Abstract
As a natural working fluid, carbon dioxide (CO2) has been extensively applied to produce power and cooling in thermodynamic cycles. So far, various combined CO2 power and cooling systems have been proposed to enhance the energy conversion efficiency and reduce the cost further. However, how to evaluate the performance of different combined systems for a practical application scenario is still an open question. Thus, in this work, four representative systems are considered to investigate and compare the energy, exergy, and economic performances under design conditions. The corresponding models are established, and various performance parameters are calculated. According to the obtained results, the total products of four systems are 6831.36 kW, 4421.73 kW, 6252.81 kW, and 6978.69 kW, respectively. The minimum total cost is obtained by System 2. Thereafter, in order to maximize the total product (the sum of net work and refrigerating capacity), and simultaneously minimize the total cost, key system parameters are optimized by a multi-objective optimization algorithm, namely, NSGA-Ⅱ. The optimization results show that System 1 provides the highest total product (7345.4 kW), while System 2 has the lowest cost (27.51 $/h). After comprehensive comparisons for the net work, cooling capacity, efficiencies, and total cost, System 1 is regarded as the best among the considered four systems.
1 Introduction
Population growth and economic development have continuously increased energy consumption worldwide, which aggravates energy shortage and environmental pollution. Facing these challenges, it is imperative to exploit renewable energy and enhance the energy conversion efficiency of existing systems. According to the statistical data on world energy markets in 2020, the utilization of renewable energy has become the largest increment among different energy sources. However, the percentage of renewable energy in total energy is still as low as 5.4% (Dudley, 2021). Therefore, improving the energy conversion efficiency of existing systems still remains the first priority, so as to meet the continuous growth of energy demands. For instance, in the utilization of fossil fuels, recovering the waste heat by developing advanced technologies is usually applied to improve the overall system efficiency.
Nowadays, most of the energy conversions are achieved through thermodynamic cycles, such as the steam Rankine cycle, Organic Rankine cycle (ORC), vapor compression refrigeration, and absorption refrigeration cycle. As the most mature technology, the steam Rankine cycle has been widely applied in nuclear (Wang et al., 2017) and coal-fired (Fu et al., 2015) power plants. Instead of water, organic fluid is employed in ORC. Since the organic fluid has a relatively low boiling temperature, ORC is more suitable to convert the low- and medium-grade energy, such as geothermal energy (Su et al., 2018) and industrial waste heat (Su et al., 2017). As for the refrigeration cycle, it transfers heat from low temperature to high temperature by driving electricity or heat source. The commonly used working fluids include organic refrigerants, LiBr-H2O, and NH3-H2O (Lin et al., 2022). However, due to the fact that a large-scale use of organic fluids in these thermodynamic cycles has caused serious global warming, carbon dioxide (CO2) as a nature fluid has received more and more concerns in recent years. Compared with organic fluids, CO2 has excellent properties such as non-corrosive, non-toxic, non-flammable, and compatible with standard material (Yu et al., 2021).
For the CO2 power cycle, the representative system is the supercritical CO2 (S-CO2) Brayton cycle. Since CO2 has a critical temperature (Tc = 30.98°C) close to the ambient temperature, CO2 is easy to reach a supercritical state. Owing to the fact that S-CO2 has a low compressibility factor nearly above the critical point, the system usually operates under this condition to decrease the compressed work markedly. Furthermore, the high density of S-CO2 enables extremely compact turbomachinery (Khan and Shyam Mishra, 2021). In general, the S-CO2 turbine is 1/30 of the steam turbine in terms of size (Chai and Tassou, 2020). Thus, the S-CO2 system generally has a narrow footprint and can be started up quickly. Apart from power generation, CO2 is also employed to produce the cooling by the transcritical refrigeration cycle due to the favorable properties, such as high volumetric refrigeration capacity, great transport performance, and outstanding thermophysical properties under the low-temperature environment (Khanmohammadi et al., 2018). With the development of society, more power and cooling are required to meet the demand of industrial production. Considering the advantages of CO2 in power and refrigeration systems, researchers have paid much interest on the combined supercritical power and transcritical refrigeration systems. So far, a few combined systems have been proposed, and comprehensive studies have been conducted to investigate the performances of these systems by the corresponding authors, as summarized in Table 1. In addition to the cycle schematic schemes, the heat sources, sensitivity analysis, and optimized targets are also provided for these combined CO2 power and cooling systems.
TABLE 1
| Author | Year | Cycle schematic scheme | Heat source | Sensitivity analysis | Optimized target |
|---|---|---|---|---|---|
| Wang et al. (2014) | 2014 |

|
ICE waste heat 400∼600°C | Heat source temperature, gas cooler outlet temperature, and cooling capacity | Single-objective optimization: Max {Network} |
| Akbari and Mahmoudi, (2017) | 2017 |

|
Reactor | Maximum pressure, intermediate pressure, gas cooler outlet temperature, evaporation temperature, and mass flow rate fraction at the gas cooler exit for power production | Single-objective optimization: Max {energy efficiency} or Max {exergy efficiency} or Min {total product unit cost} |
| Xia et al. (2018) | 2018 |

|
800°C | Turbine inlet pressure, turbine inlet temperature, turbine outlet pressure, cooler outlet temperature, and evaporation temperature | - |
| Manjunath et al. (2018) | 2018 |

|
Exhaust gas 572°C | Pressure drop, gas cooler pressure, evaporation temperature, IHE effectiveness, and turbine inlet temperature | - |
| Ipakchi et al. (2019) | 2019 |

|
Flue gas 400°C | Turbine inlet pressure, turbine inlet temperature, turbine outlet pressure, ejector back pressure, separator pressure, and evaporator pressure | Multi-objective optimization: Max {energy efficiency, exergy efficiency}and Min {total cost} |
| Li and Wang, (2019) | 2019 |

|
Reactor 800°C | Turbine discharge pressure, mass flow rate fraction at the gas cooler exit for power production, gas cooler outlet temperature, the ratio of cooling capacity to heat consumption, and evaporation temperature | Single-objective optimization: Max {exergy efficiency}. Multi-objective optimization: Max {exergy efficiency}and Min {annual cost per heat consumption} |
| Liang et al. (2020) | 2020 |

|
Exhaust gas | Turbine inlet pressure, cooler pressure, evaporation temperature, power compressor discharge temperature, and cooling compressor discharge pressure | - |
| Yu et al. (2020) | 2020 |

|
Exhaust gas 572°C | Cooler pressure, cooler outlet temperature, evaporation temperature, turbine inlet temperature, and isentropic efficiency of turbomachinery | - |
| Yuan et al. (2021) | 2021 |

|
Reactor 800°C | Turbine inlet pressure, turbine back pressure, cooler outlet temperature, and evaporation temperature | Single-objective optimization: Max {exergy efficiency}. Multi-objective optimization: Max {exergy efficiency}and Min {total product unit cost} |
Summary of the existing combined CO2 power and cooling systems.
In 2014, Wang et al. (2014) developed eight different structures of combined systems to recover the waste heat of internal combustion engines. These novel systems are composed of an S-CO2 power cycle and transcritical CO2 refrigeration cycle, as shown in Table 1. For the power cycle, in addition to the basic S-CO2 power cycle in Table 1, a double-turbine S-CO2 power cycle is also employed. The considered compression and expansion processes in the power cycle include single compression, double compression, single expansion, and double expansion. In total, there are four types of power cycles. As for the refrigeration cycle, only basic and regenerative configurations are considered. Aiming at these eight combined systems, the authors analyzed and optimized the thermodynamic performance and concluded that the adoption of double-turbine is helpful to enhance the net work of the system.
In 2017, Akbari and Mahmoudi, (2017) proposed a novel combination of a CO2 power and refrigeration cycle. The system consists of a recompression S-CO2 power cycle and a basic transcritical refrigeration cycle with an expander. The power and refrigeration cycles of this system are coupled by sharing the gas cooler. At the inlet and outlet of the gas cooler, the power and refrigeration flows are mixed and divided, respectively. Furthermore, the performances were investigated from thermo-economic viewpoints under different optimization scenarios. It was found that the exergy efficiency for the cost-optimal design is decreased by 4.25%, compared with that of the exergy optimal design.
Considering the advantages of ejector refrigeration, Xia et al. (2018) developed a system to couple a recompression power cycle with an ejector refrigeration cycle. At the outlet of low-temperature recuperator (LTR), the low pressure flow is divided into two streams: one stream enters the ejector to entrain the secondary refrigeration stream into the chamber; the other stream enters the recompressor. These two streams are mixed before entering high-temperature recuperator (HTR). The authors compared the performance of this novel combined system with the alone S-CO2 recompression power system. Under the given conditions, the energy and exergy efficiencies of this combined cycle are 46.99 and 47.21%, while those of the recompression system are only 33.95 and 46.41%, respectively. In 2018, Manjunath et al. (2018) developed a novel combined system for shipboard heat recovery and achieved the goal to produce power and cooling. The system includes a regenerative power cycle and a transcritical refrigeration cycle with IHE. The power and cooling cycles share the regenerator and gas cooler. The authors comprehensively discussed the thermodynamic performance of this novel system and analyzed the influences of key parameters on system performance. The results showed that the overall energy efficiency of the shipboard plant can be increased by 34%.
Thereafter, in 2019, Ipakchi et al. (2019) coupled the CO2 ejector refrigeration cycle with the simple recuperated power cycle. In this combined system, the primary stream from the HTR entrains the secondary refrigeration stream into the chamber. In the separator, the saturated liquid of CO2 is divided into two streams, so as to finish the power and refrigeration cycles, respectively. The authors analyzed and optimized the thermo-economic system performance. The results showed that the optimal net present value and energy and exergy efficiencies of this system can reach up to 0.34189 M$, 27.42, and 24.21%, respectively. At the same time, Li and Wang, (2019) proposed a novel system to produce power and cooling. The power cycle has three recuperators, and the refrigeration cycle employs a two-stage compression process and an internal heat exchange. For the streams in refrigeration and power cycles, they are divided at the outlet of a gas cooler and mixed at the HTR inlet. The obtained results showed that when the evaporation temperature decreases, the comparative advantage of this new system over the separation system increases.
In 2020, Liang et al. (2020) combined the S-CO2 recuperative cycle with the refrigeration cycle. For the power cycle, the output work of the turbine is used to drive the refrigeration compressor, so as to achieve the integration of power and refrigeration. Based on the listed layouts in Table 1, the authors further integrated the power and refrigeration cycles with a shared cooler. For these two novel systems, a detailed analysis was conducted for the exergy loss. It was obtained that the irreversibility of recuperator accounts for the largest proportion of total exergy loss. Meanwhile, performances of these two systems were compared. The results showed that the system with a shared cooler has a higher cooling capacity under the same evaporation temperature. Furthermore, Yu et al. (2020) constructed a novel combined system. The LTR and gas cooler are shared by the S-CO2 power and transcritical refrigeration cycles. The authors established the thermo-economic models and compared the performance with that of the system presented by Manjunath et al. (2018). The results suggested that the energy efficiency of the novel system is increased by 10%.
Recently, Yuan et al. (2021) designed a novel combined CO2 system to effectively utilize nuclear power. The power cycle includes three recuperators. While in the refrigeration cycle, a part of the stream at the cooler outlet is utilized as the primary flow of the ejector to entrain secondary vapor at the outlet of the evaporator. The power and refrigeration flows are divided at the outlet of the cooler and mixed at the inlet of HTR. The authors analyzed the thermodynamic and economic performances and employed single-objective and multi-objective optimizations to optimize corresponding performances. It was reported that the optimal net work of this novel combined system is 43.1 MW under the evaporation temperature of 0ºC.
From the aforementioned reviews, it can be found that the existing studies mainly concentrate on the development of combined CO2 power and refrigeration systems and corresponding performance analysis under different conditions. Among these studies, the heat source, operating condition, and component modeling rules are not unified, so the system performance cannot be comprehensively compared. Aiming at these systems, how to evaluate the comprehensive performance of different combined systems for a practical application scenario is still an open question. Therefore, it is necessary to compare the performance of various combined CO2 power and cooling systems under the same operating condition and modeling principles, so as to provide theoretical guidance for the construction and selection of high-efficient combined CO2 power and cooling system.
Thus, in this work, four combined systems are selected as representatives. In order to investigate the performances of these systems, thermodynamic and economic models are developed. The energy, exergy, and economic (3E) performance comparison among four considered systems is carried out under design conditions. Meanwhile, a multi-objective algorithm (NSAG-II) is used to optimize the performance of these systems. Based on the aforementioned works, this study is structured as follows: Section 2 describes the construction of combined systems. Section 3 establishes the mathematical models, followed by Section 4, which discusses the obtained results. Finally, the drawn conclusions are presented in Section 5.
2 Description of Four Studied Systems
From the reviews, there are three coupling methods for the combined CO2 power and cooling cycle: 1) the turbine of the power cycle directly drives the compressor of the refrigeration cycle; 2) the power cycle and refrigeration cycle share with the cooler or recuperator; and 3) different pressure processes of the power cycle and refrigeration cycle are connected by the ejector. For the combined CO2 power and refrigeration systems, considering the fact that the S-CO2 power cycle has different structures such as recompression, split, and recuperation, and the transcritical CO2 refrigeration cycle can be equipped with a recuperator or ejector, four representative combined systems are selected to explore all the cycle configurations. These four systems are, respectively, proposed by Yu et al. (2020), Ipakchi et al. (2019), Akbari and Mahmoudi, (2017), and Li and Wang, (2019). In order to denote these systems conveniently, they are simply called System 1, System 2, System 3, and System 4 in order.
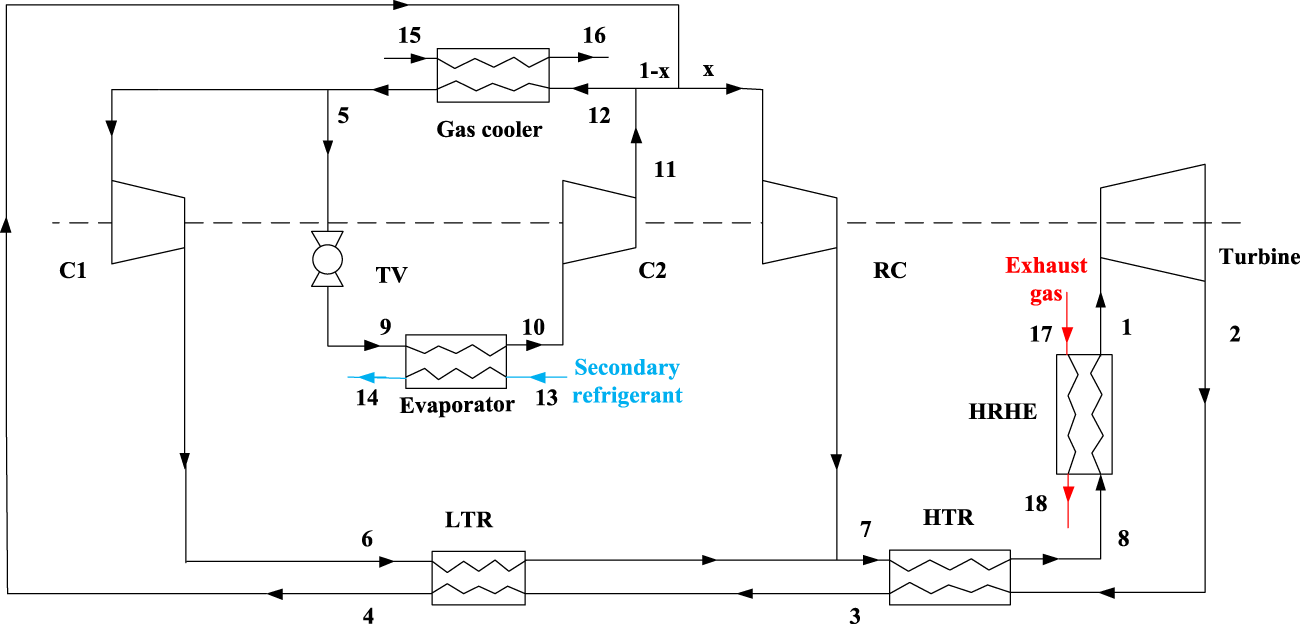
Figure 1 shows the configuration of the combined system with sharing LTR and gas cooler (System 1). Figure 2 presents the T-s diagram of System 1. In this system, the exhaust gas is utilized to heat S-CO2 in the heat-recovery-heat-exchanger (HRHE). CO2 then enters the turbine, and the outlet CO2 of the turbine flows into the HTR to exchange heat. Thereafter, the outlet stream from HTR mixes with CO2 from the outlet of refrigeration compressor (C2). The total flows enter LTR and gas cooler sequentially. Subsequently, CO2 is divided into two streams at the outlet of gas cooler: one part flows into the power compressor (C1) and another enters the internal heat exchanger (IHE) of the refrigeration cycle. For the compressed CO2 in C1, it sequentially flows through LTR and HTR, finishing the power cycle. As for CO2 in the refrigeration cycle, after IHE, CO2 enters the throttling valve (TV) and evaporator. Then, the outlet fluid of the evaporator is over-heated. At the outlet of IHE, CO2 enters C2 to be compressed, and then CO2 mixes with the fluid from the power cycle. To reduce the number of system components, LTR and gas cooler are shared by two sub-cycles. Furthermore, in this system, the LTR can simultaneously recover the exhaust heat from the power and refrigeration cycles. By introducing the refrigerant CO2 into the LTR, the heat capacity difference between the two sides of the LTR is decreased to the extent that the temperature match of LTR can be well achieved.
FIGURE 1

Schematic scheme of the combined power and cooling system with sharing LTR and gas cooler (System 1) (Yu et al., 2020).
FIGURE 2

Temperature-entropy diagram of System 1.
The configuration of the second system (System 2) is displayed in Figure 3. Figure 4 presents T-s diagram of System 2. In this system, the primary stream from the HTR entrains the secondary refrigeration stream into the chamber. The outlet flow of the ejector is mixed with the outlet flow of C3. Then, the S-CO2 sequentially goes through the gas cooler, TV1, and separator. In the separator, CO2 is separated into saturated vapor and liquid. A portion of saturated liquid enters the pump, and the remaining flow of saturated liquid goes into the IHE to complete cooling.
FIGURE 3

Schematic scheme of the combined power and cooling system coupled by the ejector (System 2) (Ipakchi et al., 2019).
FIGURE 4

Temperature-entropy diagram of System 2.
Figure 5 displays the construction diagram of System 3. Compared with System 1, the power and refrigeration cycles of this system are coupled by sharing the gas cooler. The stream is divided into two parts before entering cooler; one flowing enters the re-compressor (RC) and mixes with LTR high-pressure fluid at the inlet of the cold side for HTR. As for another flow, the CO2 mixes with the refrigeration flow and enters the gas cooler. After passing through the gas cooler, CO2 is divided into two flows to enter the power and refrigeration cycles, respectively. Furthermore, the IHE is not employed in the refrigeration cycle. Figure 6 depicts the T-s diagram for System 3.
FIGURE 5
Schematic scheme of the combined recompression power cycle and refrigeration cycle with the sharing gas cooler (System 3) (Akbari and Mahmoudi, 2017).
FIGURE 6

Temperature-entropy diagram of System 3.
The layout of the combined recompression power cycle and multi-stage compression refrigeration cycle (System 4) is illustrated in Figure 7. Figure 8 displays the T-s graph. In comparison to the refrigeration processes in System 3, a two-stage compression is employed to System 4, and an IHE is added to recover part of the released heat in the refrigeration cycle. In addition, in the power cycle of System 4, middle temperature recuperator (MTR) is introduced. The outlet CO2 of the turbine passes through HTR, MTR, and LTR sequentially. The outlet flows of the main compressor and recompressor are mixed at the MTR inlet. For the two CO2 flows in refrigeration and power cycles, they are divided in the outlet of gas cooler and mixed at the HTR inlet.
FIGURE 7

Schematic scheme of the combined recompression power cycle and multi-stage compression refrigeration cycle (System 4) (Li and Wang, 2019).
FIGURE 8

Temperature-entropy diagram of System 4.
3 Mathematical Models on Four Representative Systems
In order to establish mathematical models for the four systems, the following assumptions are adopted for simplicity:
• The system operates in steady states.
• The pressure drops, and thermal losses of the system are neglected.
• Heat exchangers are modeled on the basis of counter-flow.
• Kinetic energy of CO2 flow is ignored.
• Efficiencies of the nozzle, mixing chamber, and diffuser in the ejector are constant (Bai et al., 2016).
• The throttling process is isenthalpic.
• For the ejector, the mixing process maintains constant pressure (Bai et al., 2016).
• The power flow and refrigeration flow are mixed or divided with the same temperature and pressure.
3.1 Thermodynamic Modeling
On the basis of mass conservation, the first law and second law of thermodynamics, energy, and exergy models are established for the combined power and cooling cycles.
3.1.1 Energy Model
Take System 1 as an example, the conservation equation for each component is provided in the following text.
For the heat exchangers, the energy balance equations are, respectively, listed as follows:
Furthermore, for the modeling of LTR, the effectiveness is employed and defined as:
The expressions for the work involved in turbines and compressors are given by
Thus, the net work of the system is obtained through the following formula:
The absorbed heat in the HRHE is calculated by
The heat taken away by the cooling water in the gas cooler can be expressed as
For the isenthalpic expansion process in TV, it can be formulated by
The cooling capacity of CO2 to the refrigerant space in the evaporator is
Based on the previously obtained parameters, the thermal and waste heat recovery efficiencies of the combined system can be calculated by:
As for other systems, heat exchangers, compressors, turbines, and TVs can be similarly modeled by the aforementioned equations, thus obtaining the performance metrics of these systems. Furthermore, for the employed ejector in System 2, since the constant-pressure mixing model has been given in the literatures (Ipakchi et al., 2019) in detail, the model equations of the ejector are not presented here.
3.1.2 Exergy Model
The net exergy input from the waste heat is defined bywhere means the average temperature of exhaust gas.
For the exergy output of the refrigeration cycle, it is given in Eq. 18:where represents the mean temperature of cooled space.
Before establishing the exergy model for each component, the specific exergy of any state point is calculated by the following formula:
On this basis, the irreversibility of each component can be calculated as follows (Table 2):
TABLE 2
| Component | Irreversibility |
|---|---|
| HRHE | |
| HTR | |
| LTR | |
| Cooler | |
| IHE | |
| TV | |
| Evaporator | |
| Compressor 1 | |
| Compressor 2 | |
| Turbine |
Irreversibility of each component for System 1 (Yu et al., 2020).
According to the aforementioned calculated parameters, the exergy efficiency and waste heat recovery efficiency can be obtained.
Similarly, the exergy analysis on other three systems can also be conducted by employing the aforementioned equations. As for the ejector in System 2, the exergy destruction is expressed as:
3.2 Economic Model
To provide a comprehensive analysis on the performance of the system, the economics are calculated for the considered four systems. In general, the total cost of system can be divided into two parts: initial investment in component, and operation and management costs. As for the initial investment, the cost of each component in these systems can be estimated by the listed equations in Table 3.
TABLE 3
| Component | Capital investment cost function |
|---|---|
| HRHE, recuperators, and evaporator (Xiao et al., 2021) | |
| Turbine (Xiao et al., 2021) | |
| Compressor (Xiao et al., 2021) | |
| Gas cooler and IHE (Xiao et al., 2021) | |
| Ejector (Xu et al., 2018) |
Cost function of each component for the considered systems.
To determine the cost of heat exchanger, the corresponding area has to be worked out in advance, as shown in Table 3. For the calculation of area, the heat conduction (UA) of the heat exchanger is usually employed. In general, UA can be obtained by Eq. 23:where means the logarithmic mean temperature difference of the heat exchanger.
However, considering the fact that thermodynamic properties of CO2 vary significantly with the temperature, the heat exchanger is discretized into N sub-heat exchangers. These properties are assumed to be constant in each sub-heat exchanger. On this basis, the transferred heat of each sub-heat exchanger can be obtained byThe corresponding LMTD is calculated byThen, UA of heat exchanger can be calculated by
As for the operation and maintenance cost, it is usually estimated to be 6% () of the component investment cost. Thus, the cost rate of each component is calculated bywhere is a capital recovery factor, τ means hours of operation per year, refers to the initial investment of the component, and stands for the operation and maintenance factor.
The is calculated bywhere represents an interest rate and n indicates the operation years.
3.3 Multi-Objective Optimization
Based on the previously established models, decision variables of system including turbine inlet temperature, gas cooler pressure, evaporation temperature, and the primary and secondary pressure of ejector are optimized to maximize the total product (the sum of net work and cooling capacity) and minimize the total cost. The corresponding ranges of decision variables for different systems are listed in Table 4. In this work, non-dominated sorting genetic algorithm-II (NSGA-II) is adopted to conduct the multi-objective optimization for these combined systems. NSGA-II was first developed by Deb et al. (2002). It is an evolutionary algorithm to determine the optimum state of a system in different scenarios. This algorithm originates from the theory of natural selection in biological genetics. Due to its good diversity of solutions and low computational complexity (Cui et al., 2017), it has been widely employed in energy engineering (Jyothiprakash et al., 2019).
TABLE 4
| System | Range |
|---|---|
| System 1 | 400°C ≤ T1 ≤ 520°C、8.5MPa ≤ PL≤12MPa、-15°C ≤ Teva≤15°C |
| System 2 | 400°C ≤ T1 ≤ 520°C、8.5MPa ≤ PL≤12MPa、-15°C ≤ Teva≤15°C 12MPa ≤ P3 ≤ 14MPa、7.5MPa ≤ P14 ≤ 8.5MPa |
| System 3 | 400°C ≤ T1 ≤ 520°C、8.5MPa ≤ PL≤12MPa、-15°C ≤ Teva≤15°C |
| System 4 | 400°C ≤ T1 ≤ 520°C、8.5MPa ≤ PL≤12MPa、-15°C ≤ Teva≤15°C |
Range of the selected decision variables.
Figure 9 gives the flow chart of NSGA-II algorithm. The parent population with N size is first initialized, and the first generation is randomly produced according to the problem domains and constraints. Chromosomes are then decoded, and calculations are conducted for the developed thermodynamic and economic models, so that the total product and cost are obtained. Thereafter, according to the rank value and crowding distance, the populations with better fitness are selected. At the next stage, individuals selected from the tournament are saved in an intermediate mating pool. Their offspring are generated by crossing and mutating. The corresponding fitness values are obtained by conducting thermodynamic and economic calculations. Meanwhile, the minimum temperature differences of recuperators are judged to check whether the differences are satisfied with the requirement or not. If the differences meet the minimum requirement, the parent and offspring populations are directly mixed to produce a larger population. If not, the total product equals 0 and the total cost is 100, so that the chromosome does not prevail in evolution. After the mixing process, select N individuals from the mixed population based on the rank and crowded distance, and simultaneously determine whether the maximum generation is reached. If the stopping criterion is satisfied, output the optimal results.
FIGURE 9

Flow diagram of NSGA-II for the system parameter optimization.
4 3E Comparison Among Four Representative Systems
To achieve a comprehensive understanding of these four systems, thermodynamic and economic performances are analyzed based on the established models in Section 3. For the sake of fair performance comparison, all systems operate under the same conditions. The standard parameters are provided in Table 5. On this basis, thermodynamic and economic performances are derived from the models for the considered four systems. The corresponding computer codes are developed on the platform of MATLAB. For the required properties of the exhaust gas and CO2, property software REFPROP is adopted (Lemmon et al., 2018). After calculating the thermodynamic and economic performances under standard operating conditions, decision variables, including turbine inlet temperature, the pressures of primary and secondary flows in ejector, gas cooler pressure, and evaporation temperature, are optimized to maximize the total product and minimize the total cost. Thermodynamic and economic calculations are embedded into NSGA-Ⅱ to get the fitness value for chromosomes with certain values of decision variables. Optimal performances are compared among these systems. The detailed results are provided in the following subsections.
TABLE 5
| Parameter | Value |
|---|---|
| Exhaust gas mass flow rate (kg/s) | 63.6 |
| Exhaust gas temperature (°C) | 572 |
| Exhaust gas pressure (MPa) | 0.1084 |
| Ambient temperature (°C) | 35 |
| Ambient pressure (MPa) | 0.101325 |
| Exhaust gas composition | Ideal gas air |
| Turbine inlet pressure (MPa) | 20 |
| Turbine outlet pressure for System 2 (MPa) | 13 |
| Gas cooler pressure (MPa) | 10 |
| Secondary flow pressure of ejector (MPa) | 8 |
| Pressure of separator (MPa) | 6 |
| Turbine inlet temperature (°C) | 500 |
| Gas cooler outlet temperature (°C) | 40 |
| Cooling water inlet temperature (°C) | 25 |
| Cooling water outlet temperature (°C) | 35 |
| Evaporator temperature (°C) | 5 |
| Minimum temperature difference of heat exchangers (°C) | ≥5 |
| Refrigerated space temperature (°C) | 25 |
| Temperature of refrigerated space after cooling (°C) | 8 |
| Turbine isentropic efficiency (%) | 90 |
| Power compressor isentropic efficiency (%) | 85 |
| Cooling compressor isentropic efficiency (%) | 80 |
| Nozzle, mixing chamber, and diffuser isentropic efficiency (%) | 90 |
| Effectiveness of heat exchanger (%) | 86 |
| Mass flow rate of CO2 in the cooling cycle (kg/s) | 20 |
| Overall heat transfer coefficient of HRHE, LTR, MTR, and evaporator (kW/m2·K) | 1.6 |
| Overall heat transfer coefficient of HTR (kW/m2·K) | 3.0 |
| Overall heat transfer coefficient of cooler (kW/m2·K) | 2.0 |
| Interest rate (%) | 12 |
| The economic life time of the system (year) | 20 |
| The annual plant operation hours (h) | 8000 |
| The maintenance factor (%) | 6 |
Standard operating conditions (Yu et al., 2020).
4.1 Performance Comparison Under Design Conditions
Based on the given standard conditions, Table 6 provides various parameters for the four combined systems from the viewpoints of energy and exergy. It is noticeable that System 1 absorbs the highest heat from the waste gas, so that the outlet gas temperature for System 1 is the lowest. Therefore, the waste heat recovery efficiency of System 1 reaches 51.15%, which is the largest among the considered systems. Furthermore, System 2 has the smallest net work (711.84 kW), while the largest work (3963.96 kW) is obtained by System 3. Although the turbine output power of System 4 is the highest (7333.629 kW), the consumed work of compressor increases greatly, thus resulting in the decrease of net work. For the cooling capacity, System 1 and System 4 almost have the same values, and the corresponding capacities are 3221.82 kW and 3224.40 kW, respectively. The highest cooling capacity of 3709.89 kW is obtained by System 2. This is because the introduction of ejector causes gas cooler outlet enthalpy of CO2 decrease, so that a lower inlet enthalpy of the evaporator is obtained. In addition, the energy efficiency of 64.07% of System 4 is the maximum. This is because HRHE absorbs less heat. The second maximum efficiency is obtained by System 3, followed by System 1 and System 2.
TABLE 6
| Cycle parameter | System 1 | System 2 | System 3 | System 4 |
|---|---|---|---|---|
| (°C) | 304.41 | 316.50 | 365.81 | 415.02 |
| (kW) | 18344.10 | 17539.01 | 14230.57 | 10893 |
| (kW) | 17956.39 | 22533.80 | 12555.47 | 10372.47 |
| (kW) | 5997.94 | 3885.45 | 6524.98 | 7333.63 |
| (kW) | C1: 1201.88 and C2: 1186.52 | P1: 1449.05, C2: 746.24, and C3: 978.32 | RC: 630.01, C1: 1040.83, and C2: 890.19 | RC: 359.36, C1: 955.18, C2: 1187.32, and C3: 1077.47 |
| (kW) | 3609.54 | 711.84 | 3963.96 | 3754.29 |
| (kW) | 3221.82 | 3709.89 | 2288.85 | 3224.40 |
| (kg/s) | 69.14 | 70.10 | 75.21 | 84.54 |
| (kg/s) | 20 | 20 | 20 | 20 |
| (%) | 37.24 | 25.21 | 43.94 | 64.07 |
| (%) | 51.15 | 48.90 | 39.68 | 30.37 |
| (kW) | 10316.94 | 9936.96 | 8288.88 | 6501.83 |
| (kW) | 6616 | 8957.44 | 4679.80 | 3126.20 |
| (%) | 36.99 | 9.54 | 49.59 | 60.92 |
| (%) | 67.55 | 65.06 | 54.27 | 42.57 |
Energy and exergy performance comparison under design conditions.
As for the total irreversibility, System 2 has the highest value. Since the exergy efficiency is also related to the absorbed heat, net output work, and cooling capacity, the order of exergy efficiency among systems is basically the same as that of energy efficiency. However, the exergy efficiency of System 2 turns out to be much lower than that of other systems under the standard conditions. The irreversibility of each component is provided in Figure 10. The recuperators in Figure 10 include HTR, MTR, LTR, and IHE. For Systems 1∼3, the exergy destruction of recuperators accounts for the largest proportion, while recuperators of System 4 have a smaller irreversibility due to a lower recuperated heat. Furthermore, since System 2 contains two TVs, the corresponding exergy destruction of TVs is the largest among the considered systems. In order to provide a detailed comparison of the recuperated processes for different recuperators, Table 7 provides the exergy destruction of the used recuperators. As shown in Table 7, the HTR contributes to the largest irreversibility in recuperators under given conditions.
FIGURE 10

Irreversibility comparison under design conditions.
TABLE 7
| Irreversibility (kW) | System 1 | System 2 | System 3 | System 4 |
|---|---|---|---|---|
| HTR | 3287.84 | 4776.22 | 1343.99 | 326.31 |
| MTR | / | / | / | 63.99 |
| LTR | 184.10 | / | 624.78 | 125.48 |
| IHE | 51.79 | 13.45 | / | 51.73 |
Irreversibility of recuperators under design conditions.
Table 8 lists economic parameters for the four systems. It is shown that the turbine cost accounts for the largest in all components. The corresponding proportions are 67.67, 43.71, 67.56, and 58.24%, respectively. For the turbine cost of System 2, it is less than that of other three systems. This is mainly attributed to the small pressure difference between the turbine inlet and outlet. As for the other three systems with equal outlet pressure, the flow rate is the main factor to affect the turbine cost. In addition to the turbine cost, the compressor costs of systems 1∼4, are 3.028 $/h, 7.935 $/h, 3.236 $/h, and 3.269 $/h, respectively. Since the pressure ratio of the compressor in System 2 is the largest, the corresponding compressor cost is the highest. However, on the whole, the total cost rate (26.75 $/h) of System 2, namely, the combined system with the ejector, is the least, while System 4 has the highest cost (38.96 $/h).
TABLE 8
| Economic parameter | System 1 | System 2 | System 3 | System 4 |
|---|---|---|---|---|
| ($/h) | 18.557 | 11.693 | 20.188 | 22.690 |
| ($/h) | 1.770 | 1.729 | 1.545 | 1.323 |
| ($/h) | 0.882 | 1.136 | 0.852 | 0.828 |
| ($/h) | 0.892 | 1.406 | 1.058 | 2.563 |
| ($/h) | / | / | / | 2.868 |
| ($/h) | 0.408 | / | 1.707 | 3.476 |
| ($/h) | 0.299 | 0.497 | / | 0.361 |
| ($/h) | 1.586 | 1.733 | 1.296 | 1.586 |
| ($/h) | C1: 2.359 and C2: 0.669 | P1: 6.925, C2: 0.398, and C3: 0.612 | RC: 0.524, C1: 2.043, and C2: 0.669 | RC: 0.327, C1: 1.875, C2: 0.669, and C3: 0.398 |
| ($/h) | / | 0.617 | / | / |
| ($/h) | 27.42 | 26.75 | 29.88 | 38.96 |
Economic performance comparison under design conditions.
4.2 Performance Comparison Based on Multi-Objective Optimization
Considering that the aforementioned key parameters have different effects on the system performances, it is necessary to optimize these parameters simultaneously to achieve the best performances. In the optimization, owing to the fact that the cooler outlet temperature subjects to the environment and a lower outlet temperature usually results in a higher system performance, the outlet temperature is fixed at a design value, namely, 40°C. Furthermore, a special care should be given to System 2. Due to the existence of ejector, the inlet pressures of the ejector are also optimized. The optimal parameters of these variables are found by the multi-objective optimization algorithm, namely, NSGA-Ⅱ. The maximization of the total product and the minimization of the total cost are optimization targets for this study.
Pareto frontiers of four combined systems are provided in Figure 11. It is clearly illustrated that the total product and the total cost mutually conflict, and it is impossible to obtain the maximum total product and minimum total cost simultaneously. When one system’s performance increases, the other gets worse. To find a solution of optimization, the magnitude of each objective should be unified. Thereafter, on the Pareto frontier curve, a point with the minimum distance to the ideal state is determined as the final solution (Ahmadi et al., 2015), as marked in Figure 11.
FIGURE 11

Pareto frontier for the combined systems. (A) System 1; (B) System 2; (C) System 3; and (D) System 4.
The optimal results are listed in Table 9. The exhaust gas outlet temperature for the optimal cases is less than that for the design condition. For the considered systems, the total products are 7345.4 kW, 5040.1 kW, 6486.5 kW, and 7312.1 kW, respectively. Furthermore, it can be obviously seen that System 1 has more advantages over the other layouts in the waste heat recovery. As for energy and exergy efficiencies, the leading cycle is System 4, followed by System 3 and System 1. Although the total cost of System 2 is the lowest, System 2 does not have distinguished advantages over the other systems in the energy or exergy efficiency. Overall, after considering system performances comprehensively, System 1 has more advantages over the other system layouts, due to its lower total cost and exhaust outlet temperature as well as higher efficiency, net work, and refrigeration capacity in the optimal point.
TABLE 9
| Cycle parameter | System 1 | System 2 | System 3 | System 4 |
|---|---|---|---|---|
| (°C) | 479.67 | 508.92 | 473.01 | 487.45 |
| (MPa) | 9.63 | 10.45 | 10.76 | 9.58 |
| (MPa) | / | 12.12 | / | / |
| (MPa) | / | 7.89 | / | / |
| (°C) | 14.97 | 9.85 | 8.11 | 12.78 |
| (°C) | 301.26 | 311.65 | 344.36 | 393.62 |
| (kW) | 18554.1 | 17861.9 | 15674.1 | 12348.8 |
| (kW) | 16756.2 | 21319.6 | 14004.4 | 10901.5 |
| (kW) | 4567.2 | 1528.5 | 4078.1 | 4449.5 |
| (kW) | 2769.2 | 3511.6 | 2408.4 | 2862.6 |
| (%) | 39.54 | 28.22 | 41.38 | 59.21 |
| (%) | 51.74 | 49.80 | 43.70 | 34.43 |
| (kW) | 5696.6 | 8308.3 | 5314.9 | 3169.4 |
| (%) | 45.07 | 17.07 | 46.75 | 62.95 |
| (%) | 68.19 | 66.06 | 59.08 | 47.76 |
| ($/h) | 30.58 | 27.51 | 30.69 | 40.08 |
Optimization results of the considered systems.
In summary, although the ejector of System 2 increases the cooling capacity, it has significantly increased the total irreversibility. Furthermore, System 3 adopts the recompression CO2 power cycle system, so as to increase the net work of the combined system. But two sub-cycles only share the cooler, which results in releasing of more heat directly to the environment. In addition, three-stage recuperation is adopted in System 4, which increases the system cost to a certain extent. System 1 has two-stage recuperation in the power cycle; the cooler and low-temperature recuperator are shared by two sub-cycles. Thus, System 1 with better performance and simple structure can effectively recover the waste heat.
5 Conclusion
In this work, four combined CO
2power and cooling systems are evaluated and compared from the perspectives of energy, exergy, and economy for the application of waste heat recovery under design conditions. Thereafter, in order to maximize the total product and minimize the total cost, key operating parameters are optimized by NSGA-Ⅱ, and the corresponding performances are compared. The drawn conclusions are presented as follows:
1) Under basic operating conditions, the total products of four systems are 6831.36 kW, 4421.73 kW, 6252.81 kW, and 6978.69 kW, respectively. In addition, the maximum energy and exergy efficiencies are obtained by System 4. For the total costs, these four systems have 27.42 $/h, 26.75 $/h, 29.88 $/h, and 38.96 $/h, respectively.
2) With regard to multi-objective optimization results, System 2 provides the lowest cost and system efficiency, while System 4 has the highest cost and system efficiency, and System 1 obtains the highest heat from the heat source.
3) After comprehensive comparison for the net work, cooling capacity, efficiencies, and total cost, System 1 is thought to be the best among the considered four systems.
The thermodynamic performances of four combined CO2 power and cooling systems are comprehensively analyzed, and the obtained results have guiding significance for the construction of the combined system. However, the existing systems are constructed based on the experience of researchers; thus, aiming at different demands for cooling and electricity, the method of intelligence construction for combined CO2 power and cooling systems is required to be further developed in the near future.
Statements
Data availability statement
The original contributions presented in the study are included in the article/supplementary material; further inquiries can be directed to the corresponding author.
Author contributions
AFY: writing-original draft. LLX: conceptualization and writing-review and editing. XXL: methodology. SDO:writing-review.
Funding
This work is sponsored by the Startup Foundation of Hunan University of Science and Technology. In addition, the work is also supported by the program “Researches on key technology to optimization and dynamic simulation of supercritical CO2 power cycle” from the China Three Gorges Corporation, under grant number 202003024.
Conflict of interest
The handling editor WS declared a shared affiliation with the author(s) AY and SO at the time of review.
The authors declare that the research was conducted in the absence of any commercial or financial relationships that could be construed as a potential conflict of interest.
Publisher’s note
All claims expressed in this article are solely those of the authors and do not necessarily represent those of their affiliated organizations, or those of the publisher, the editors, and the reviewers. Any product that may be evaluated in this article, or claim that may be made by its manufacturer, is not guaranteed or endorsed by the publisher.
Nomenclature
Symbols
- A
area, m2
- c
total products unit cost, $/GJ
- C
compressor
compressor
- CRF
capital recovery factor
- e
specific exergy, kJ/kg
- E
exergy rate, kW
- h
enthalpy, kJ/kg
- HRHE
heat-recovery-heat-exchanger
heat-recovery-heat-exchanger
- HTR
high temperature recuperator
high-temperature recuperator
- ir
interest rate
- I
irreversibility rate, kW
- IHE
internal heat exchanger
- LMTD
logarithmic mean temperature difference
- LTR
low-temperature recuperator
low-temperature recuperator
- m
mass flow rate, kg/s
- MTR
middle temperature recuperator
middle temperature recuperator
- n
operation years
- N
number of heat exchangers
- NSAG-II
non-dominated sorting genetic algorithm-II
- ORC
Organic Rankine cycle
- P
pressure, MPa
power cycle
- P
pressure, MPa
power cycle
- PPTDs
pinch point temperature differences
- PR
pressure ratio
- Q
heat transfer rate, kW
- RC
re-compressor
- s
entropy, kJ/(kg•K)
- S-CO2
supercritical carbon dioxide
- T
temperature, K
- TV
throttling valve
throttling valve
- UA
heat conductance, MW/K
- W
work, kW
- Z
capital cost of a component, $
- Ż
capital cost rate, $/h
Greeks
- η
efficiency,%
- ε
effectiveness, %
- γk
maintenance factor
- τ
hours of operation per year, h
Subscripts
- 0
environmental state
- 1
the first law of thermodynamic
- 2
the second law of thermodynamic
- ave
average state
- cooler
gas cooler
- C
compressor
compressor
- ev
evaporator
- g
exhaust gas
- HRHE
heat-recovery-heat-exchanger
heat-recovery-heat-exchanger
- HTR
high temperature recuperator
high-temperature recuperator
- i
thermodynamic state points
- in
inlet
- L
low
- LTR
low-temperature recuperator
low-temperature recuperator
- MTR
middle temperature recuperator
middle temperature recuperator
- net
net output
- out
outlet
- P
pressure, MPa
power cycle
- PC
power and cooling cycle
- R
refrigeration cycle
- ref
refrigeration cycle
- TV
throttling valve
throttling valve
- tur
turbine
- WHR
waste heat recovery
References
1
Ahmadi M. H. Ahmadi M. A. Bayat R. Ashouri M. Feidt M. (2015). Thermo-economic Optimization of Stirling Heat Pump by Using Non-dominated Sorting Genetic Algorithm. Energy Convers. Manag.91, 315–322. 10.1016/j.enconman.2014.12.006
2
Akbari A. D. Mahmoudi S. M. S. (2017). Thermoeconomic Performance and Optimization of a Novel Cogeneration System Using Carbon Dioxide as Working Fluid. Energy Convers. Manag.145, 265–277. 10.1016/j.enconman.2017.04.103
3
Bai T. Yu J. Yan G. (2016). Advanced Exergy Analyses of an Ejector Expansion Transcritical CO2 Refrigeration System. Energy Convers. Manag.126, 850–861. 10.1016/j.enconman.2016.08.057
4
Chai L. Tassou S. A. (2020). A Review of Printed Circuit Heat Exchangers for Helium and Supercritical CO2 Brayton Cycles. Therm. Sci. Eng. Prog.18, 100543. 10.1016/j.tsep.2020.100543
5
Cui Y. Geng Z. Zhu Q. Han Y. (2017). Review: Multi-Objective Optimization Methods and Application in Energy Saving. Energy125, 681–704. 10.1016/j.energy.2017.02.174
6
Deb K. Pratap A. Agarwal S. Meyarivan T. (2002). A Fast and Elitist Multiobjective Genetic Algorithm: NSGA-II. IEEE Trans. Evol. Comput.6 (2), 182–197. 10.1109/4235.996017
7
Dudley B. (2021). BP Statistical Review of World Energy. 70th edition. London: Whitehouse Associates.
8
Fu C. Anantharaman R. Gundersen T. (2015). Optimal Integration of Compression Heat with Regenerative Steam Rankine Cycles in Oxy-Combustion Coal Based Power Plants. Energy84, 612–622. 10.1016/j.energy.2015.03.023
9
Ipakchi O. Mosaffa A. H. Garousi Farshi L. (2019). Ejector Based CO2 Transcritical Combined Cooling and Power System Utilizing Waste Heat Recovery: A Thermoeconomic Assessment. Energy Convers. Manag.186, 462–472. 10.1016/j.enconman.2019.03.009
10
Jyothiprakash K. H. Harshith J. Sharan A. Seetharamu K. N. Krishnegowda Y. T. (2019). Thermodynamic Optimization of Three-Fluid Cross-Flow Heat Exchanger Using GA and PSO Heuristics. Therm. Sci. Eng. Prog.11, 289–301. 10.1016/j.tsep.2019.04.009
11
Khan Y. Shyam Mishra R. (2021). Thermo-economic Analysis of the Combined Solar Based Pre-compression Supercritical CO2 Cycle and Organic Rankine Cycle Using Ultra Low GWP Fluids. Therm. Sci. Eng. Prog.23, 100925. 10.1016/j.tsep.2021.100925
12
Khanmohammadi S. Goodarzi M. Khanmohammadi S. Ganjehsarabi H. (2018). Thermoeconomic Modeling and Multi-Objective Evolutionary-Based Optimization of a Modified Transcritical CO 2 Refrigeration Cycle. Therm. Sci. Eng. Prog.5, 86–96. 10.1016/j.tsep.2017.10.007
13
Lemmon E. W. Bell I. H. Huber M. L. McLinden M. O. (2018). NIST Standard Reference Database 23: Reference Fluid Thermodynamic and Transport Properties- REFPROP, Version 10.0. Gaithersburg: National Institute of Standards and Technology, Standard Reference Data Program.
14
Li B. Wang S.-s. (2019). Thermo-economic Analysis and Optimization of a Novel Carbon Dioxide Based Combined Cooling and Power System. Energy Convers. Manag.199, 112048. 10.1016/j.enconman.2019.112048
15
Liang Y. Sun Z. Dong M. Lu J. Yu Z. (2020). Investigation of a Refrigeration System Based on Combined Supercritical CO2 Power and Transcritical CO2 Refrigeration Cycles by Waste Heat Recovery of Engine. Int. J. Refrig.118, 470–482. 10.1016/j.ijrefrig.2020.04.031
16
Lin X. Zuo L. Yin L. Su W. Ou S. (2022). An Idea to Efficiently Recover the Waste Heat of Data Centers by Constructing an Integrated System with Carbon Dioxide Heat Pump, Mechanical Subcooling Cycle and Lithium Bromide-Water Absorption Refrigeration Cycle. Energy Convers. Manag.256, 115398. 10.1016/j.enconman.2022.115398
17
Manjunath K. Sharma O. P. Tyagi S. K. Kaushik S. C. (2018). Thermodynamic Analysis of a Supercritical/transcritical CO 2 Based Waste Heat Recovery Cycle for Shipboard Power and Cooling Applications. Energy Convers. Manag.155, 262–275. 10.1016/j.enconman.2017.10.097
18
Su W. Hwang Y. Deng S. Zhao L. Zhao D. (2018). Thermodynamic Performance Comparison of Organic Rankine Cycle between Zeotropic Mixtures and Pure Fluids under Open Heat Source. Energy Convers. Manag.165, 720–737. 10.1016/j.enconman.2018.03.071
19
Su W. Zhao L. Deng S. (2017). Simultaneous Working Fluids Design and Cycle Optimization for Organic Rankine Cycle Using Group Contribution Model. Appl. Energy202, 618–627. 10.1016/j.apenergy.2017.03.133
20
Wang C. Yan C. Wang J. Tian C. Yu S. (2017). Parametric Optimization of Steam Cycle in PWR Nuclear Power Plant Using Improved Genetic-Simplex Algorithm. Appl. Therm. Eng.125, 830–845. 10.1016/j.applthermaleng.2017.07.045
21
Wang S. S. Bai K. L. Xie Y. H. Di J. Cheng S. F. (2014). Analysis of Combined Power and Refrigeration Generation Using the Carbon Dioxide Thermodynamic Cycle to Recover the Waste Heat of an Internal Combustion Engine. Math. Problems Eng.2014. 10.1155/2014/689398
22
Xia W. K. Gao Y. C. Huo Y. W. Dai Y. P. (2018). Thermodynamic Analysis for a Novel Combined Power and Refrigeration Cycle Using Transcritical CO2. Power Gener. Technol.39 (4), 328–335.
23
Xiao G. M. Yu A. F. Su W. Zhou N. J. (2021). Constructing a Novel Supercritical Carbon Dioxide Power Cycle with the Capacity of Process Switching for the Waste Heat Recovery. Int. J. Energy Res.46 (4), 5099–5118. 10.1002/er.7503
24
Xu Y. Guo F. Song M. Jiang N. Wang Q. Chen G. (2018). Exergetic and Economic Analyses of a Novel Modified Solar-Heat-Powered Ejection-Compression Refrigeration Cycle Comparing with Conventional Cycle. Energy Convers. Manag.168, 107–118. 10.1016/j.enconman.2018.04.098
25
Yu A. Su W. Lin X. Zhou N. (2021). Recent Trends of Supercritical CO2 Brayton Cycle: Bibliometric Analysis and Research Review. Nucl. Eng. Technol.53, 699–714. 10.1016/j.net.2020.08.005
26
Yu A. Su W. Lin X. Zhou N. Zhao L. (2020). Thermodynamic Analysis on the Combination of Supercritical Carbon Dioxide Power Cycle and Transcritical Carbon Dioxide Refrigeration Cycle for the Waste Heat Recovery of Shipboard. Energy Convers. Manag.221, 113214. 10.1016/j.enconman.2020.113214
27
Yuan J. Wu C. Xu X. Liu C. (2021). Proposal and Thermoeconomic Analysis of a Novel Combined Cooling and Power System Using Carbon Dioxide as the Working Fluid. Energy Convers. Manag.227, 113566. 10.1016/j.enconman.2020.113566
Summary
Keywords
carbon dioxide, combined power and cooling, thermodynamic analysis, economic analysis, multi-objective optimization
Citation
Yu A, Xing L, Lin X and Ou S (2022) Energy, Exergy, and Economic Performances of Combined CO2 Power and Cooling Systems: Comparison and Multi-Objective Optimization. Front. Energy Res. 10:945158. doi: 10.3389/fenrg.2022.945158
Received
16 May 2022
Accepted
30 May 2022
Published
22 July 2022
Volume
10 - 2022
Edited by
Wen Su, Central South University, China
Reviewed by
Ruikai Zhao, Tianjin University, China
Chuang Wu, Chongqing University, China
Yue Cao, Southeast University, China
Updates
Copyright
© 2022 Yu, Xing, Lin and Ou.
This is an open-access article distributed under the terms of the Creative Commons Attribution License (CC BY). The use, distribution or reproduction in other forums is permitted, provided the original author(s) and the copyright owner(s) are credited and that the original publication in this journal is cited, in accordance with accepted academic practice. No use, distribution or reproduction is permitted which does not comply with these terms.
*Correspondence: Lingli Xing, xinglingli09@163.com
This article was submitted to Process and Energy Systems Engineering, a section of the journal Frontiers in Energy Research
Disclaimer
All claims expressed in this article are solely those of the authors and do not necessarily represent those of their affiliated organizations, or those of the publisher, the editors and the reviewers. Any product that may be evaluated in this article or claim that may be made by its manufacturer is not guaranteed or endorsed by the publisher.