 Li-Song Wang
 Zhong-Yi Wang
 Yan-Hua Wang
 Meng Wang
 Hai-Ou Sun
- Harbin Engineering University, Harbin, China
In this paper, a double-circular-arc cascade was used as the research object to study the effect of roughness on the compressor cascade under the conditions of different incoming attack angles. The Reynolds number of the cascade is
1 Introduction
Due to the different geographical locations and the social environment, the air will be mixed with solid or liquid particles such as dust, pollen, aerosols, etc (Bons 2010). The air in coastal areas will also contain salt spray particles (Mishra 2015). It is necessary to continuously consume a large amount of air to ensure the stable operation of the gas turbine. Inevitably, small-sized pollutant particles in the air will also enter the gas turbine. These solid or liquid particles will mix with the oil mist and adhere to the surface of the gas turbine components (Chen and Griffith, 2022b). When the gas turbine is running the compressor is the first part that comes into contact with the air, so the deposition of pollutant particles on the wall is also the most obvious. The deposition of solid or liquid particles in the air on the surface of the compressor components will eventually cause the wall to become rough. Especially when the surface of the compressor blade becomes rough, it will cause the performance degradation of the compressor and gas turbine. Alessio Suman (Suman et al., 2017) et al. analyzed the distribution of particles on compressor blades through computational fluid dynamics (CFD). The analysis has shown that particular fluid-dynamic phenomena and airfoil shape influence the pattern deposition. In the past, many scholars have conducted related studies on the influence of roughness on compressor performance (Chen et al., 2021; Chen and Griffith, 2022a). Mark P. Simens and Ayse G. Gungor used a flat plate with a strong inverse pressure gradient as the research object to study the effect of roughness on laminar separation bubbles. These numerical experiments indicate that laminar separation and turbulent transition are mainly affected by the type, height, and location of the roughness element (Simens and Gungor 2013). Jongwook Joo et al. (Joo et al., 2017). Regularly arranged rectangular blocks on the surface of the blade to simulate the rough surface, and used large eddy simulation to calculate the effect of roughness on the flow field of the NACA65 compressor cascade. Nicola Aldi et al. used NASA Stage 37 and NASA Stage 35 as research objects, simulated by imposing different spanwise distributions of surface roughness to analyze its effect on compressor performance (Nicola et al., 2013; Sun et al., 2018). Ravi J Chotalia and Dilipkumar Bhanudasji Alone (Chotalia and Alone 2017) studied the performance degradation of the single-stage transonic axial flow compressor due to the uniform roughness created by the aerosols. Yonghong Tang et al. found that doubling or halving the roughness value of all components of a centrifugal compressor in the hydraulically rough flow regime will result in a change in the peak efficiency of the compressor by about 1.72% (Tang et al., 2019). A test program on the GE J85-13 jet engine quantified the increased surface roughness and the distribution of salt deposits in an axial compressor (Syverud and Bakken 2006). Dongjae Kong (Kong, Jeong, and Song 2017) conducted experimental measurements on the smooth and rough compressor cascade passage flow field.
In recent years, compressor design technology has become more and more advanced, and compressor performance parameters have gradually improved. However, it can be noticed that the compressor blades are now more twisted than before. During the operation of the compressor, the gas flow around the blades is more complicated. It becomes complicated to analyze the influence of rough wall surface on the flow field around the compressor blade. Cascade passages are often used to analyze the two-dimensional flow process of compressor blades. The blades are straight along the span, so the transmission movement of the surrounding airflow along the blade height direction disappears. Therefore, this study used double-curved cascades as the research object and uses a combination of steady-state numerical simulation and Large-eddy simulation (LES) to study the effect of blade surface roughness on the performance of compressor cascades.
2 Model development
2.1 Geometric model
2.1.1 Smooth cascade blade
A cascade was used to simulate the effect of roughness on the compressor. The blade profile is a compressor blade designed at the NASA Lewis Research Center. The blade section of the cascade is a double-circular-arc blade with 65 degrees of camber, a 20.5° stagger angle, a solidity of 2.14, and a 228.6 mm chord length. Both the radius of the leading and trailing edge is 0.9144 mm (Zierke and Deutsch 1990). The profile of the blade is shown in 1.1.11Figure 1. After the profile of the rough blade is generated, analyze the height change value of the control point on the suction surface to obtain the specific value of the roughness on the suction surface.

FIGURE 1. Blade profile.
The equation for the pressure surface, suction surface, and camber line of the double-circular-arc blade used in the current study can be written as
and
The chord length of this cascade blade is 228.6 mm, and the radius of the leading edge and trailing edge are both 0.9144 mm. The aspect ratio (AR) is 1.61. The geometric parameters of the blade profile are shown in Table 1.
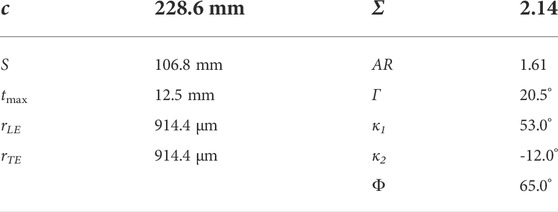
TABLE 1. Blade geometry.
3 Rough cascade blade
In past research, researchers often used two methods to study the effect of roughness on the compressor cascade. Mirko Morini et al. (Morini et al., 2011; Nicola et al., 2014; Shi et al., 2017) used the wall equation to simulate the roughness on the compressor blade, while Sun Hai-Ou et al. (Sun et al., 2021) changed the profile of the blade.
Previous research (Syverud and Bakken 2006) data has shown that the roughness on the suction surface of the compressor blade has a greater impact on performance. So only the suction side of the blade profile was been altered in this study. The rough blade profile is shown in Figure 2.
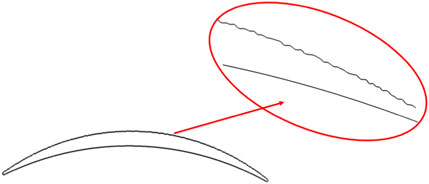
FIGURE 2. Rough blade profile.
In this research, the method of replacing the blade profile was used to simulate the rough wall surface, to describe the rough wall surface more realistically. 238 control points were selected on the suction surface profile of the smooth blade, and each control point was moved at a random distance in the direction perpendicular to the wall. A spline curve is formed by the newly obtained 238 control points. The shape of this curve is regarded as the profile of the rough blade, as shown in Figure 2.
3.1 Numerical mesh
Irregular contours on rough walls cause inconvenience to mesh generation. The quality and structure of the grid determine the accuracy and convergence of the numerical simulation, especially for large-eddy simulations. As shown in Figure 3, O-Block was used around the blade surface and the number of the mesh is 160 million. The y+ value is less than 1, 1500 nodes was set at chord direction on the blade. The number of mesh nodes in the boundary layer of the blade surface is more than 40.
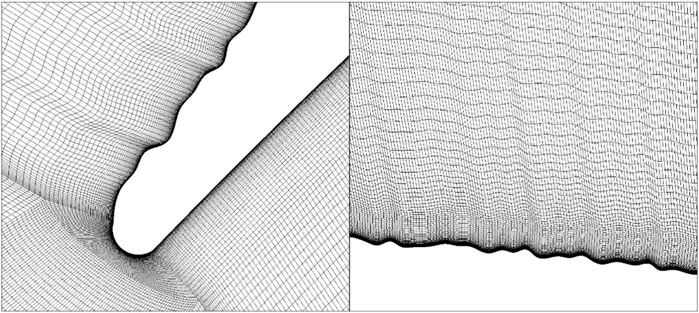
FIGURE 3. Cascade Blade surface Mesh.
The range
4 Numerical simulation
The influence of the angle of attack of the cascade on the flow field around the blade is also considered.
The geometric mean roughness Ra satisfies the relationship of
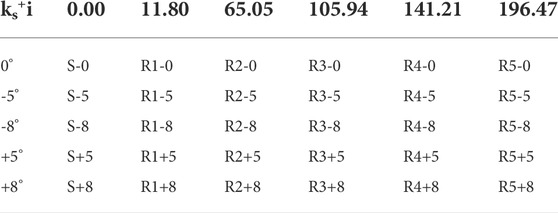
TABLE 2. Incoming attack angle (i) and wall roughness (ks+).
Figure 4 shows the computational domain model of the cascade. The single-passage numerical simulation requires less computer and can increase the calculation speed of numerical simulation. The boundary conditions of the calculation model are as follows:
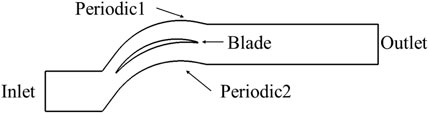
FIGURE 4. Geometrical cascade domain.
The Inlet Reynolds number is
In the steady-state calculation, the
5 Simulation result
At different angles of attack, the Cp distribution on the airfoil surface is shown in Figure 5, the Cp is defined as follows:
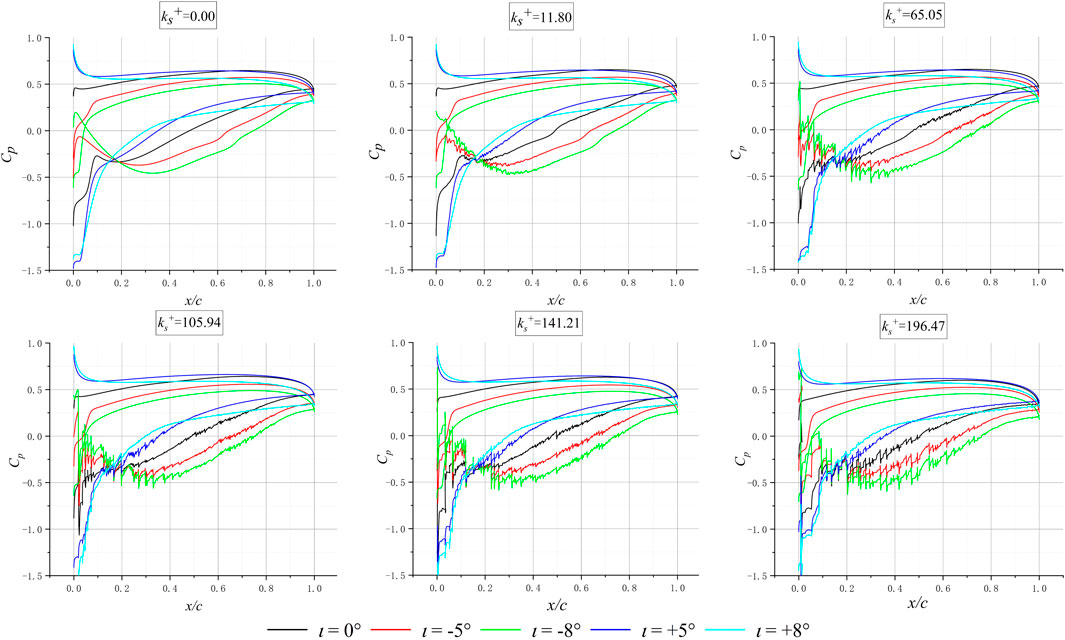
FIGURE 5. Pressure Coefficient under different i.
It can be seen from Figure 5 that under different surface roughness, the distribution Cp varies with the angle of attack almost the same. Compared with the case of 0° angle of attack, at a negative angle of attack, the pressure coefficient of the blade surface decreases. But the trend shows the difference when the angle of attack is positive. When
Under the same angle of attack, when the roughness of the suction surface is different, the distribution of the pressure coefficient is shown in Figure 6. The simulation results show that when the i is positive, the Cp hardly changes with the roughness of the suction surface.
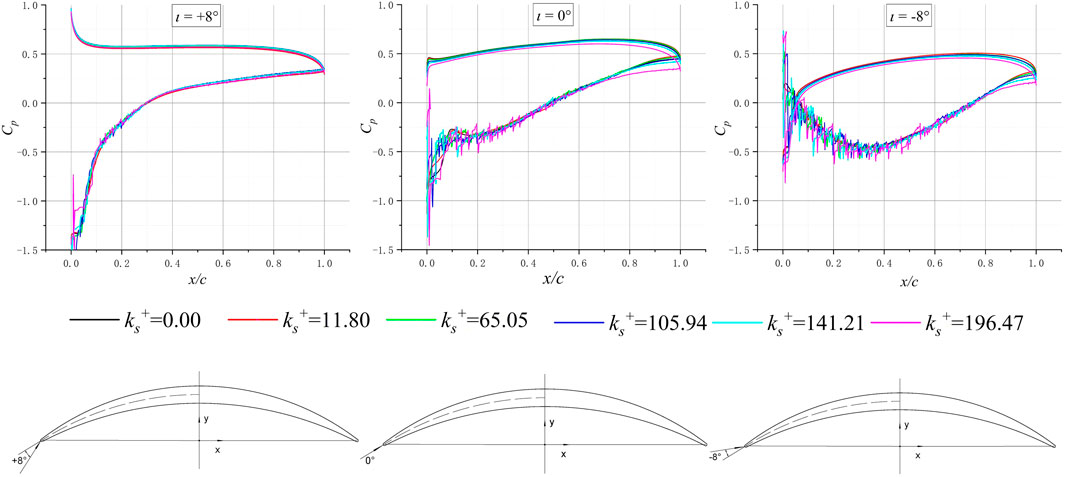
FIGURE 6. Pressure Coefficient under different.
When i is less than or equal to 0, the Cp changes with the roughness value. When
So for the blades of the cascade, the lift coefficient is the area value enclosed by the pressure coefficient curve in Figure 5 and Figure 6. The abscissa of Figure 7 is the lift coefficient of the blade, and the ordinate is the angle of attack and the equivalent sand roughness on the suction surface of the cascade blade, the lift coefficient is defined as follows:
Where
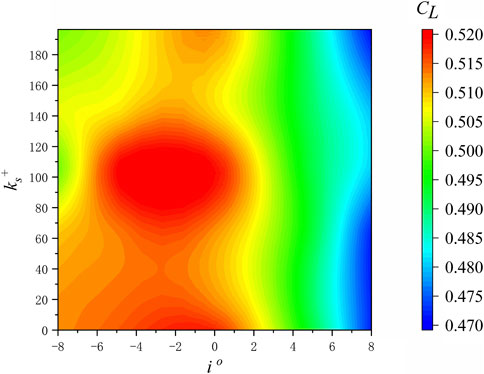
FIGURE 7. Lift coefficient.
The pressure coefficient is along the y-axis direction, as shown in Figure 1. The effect of the roughness of the suction surface on the lift coefficient of the blade is not completely negative. When
The premature separation of the airflow on the low-roughness wall destroys the original gas flow state near the wall and also causes the thickness of the boundary layer near the trailing edge of the blade to be significantly reduced.
As the roughness of the blade surface increases, the separation bubbles disappear. The boundary layer separation gradually thickens, and the position of the airflow separation is advanced. These phenomena can be observed in Figure 9.
The isentropic Mach number on the suction surface of the blade is shown in Figure 8. Starting from 0.7 chord length, the isentropic Mach value begins to change due to the increase in roughness. In addition, when
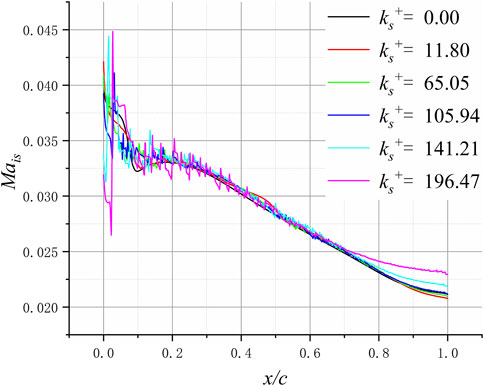
FIGURE 8. Suction surface Isentropic Mach number.
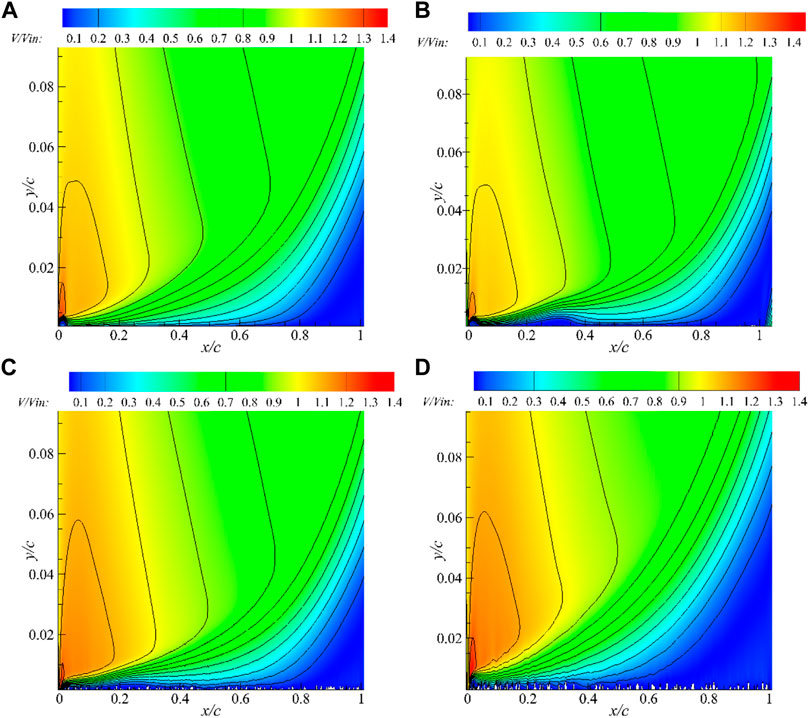
FIGURE 9. V/Vin in the cascade passage. “V” is the velocity and “Vin” represents the velocity of the inlet boundary.
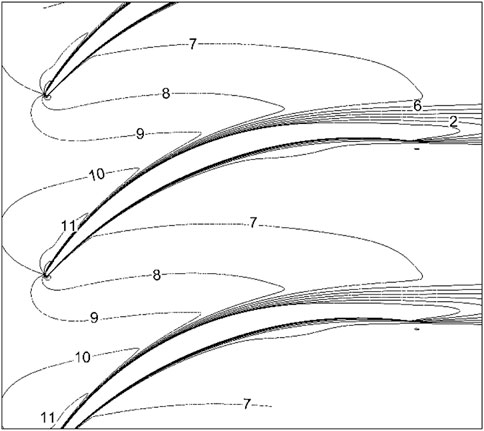
FIGURE 10. Velocity (m/s) in cascade passage.
In previous studies, the inlet velocity of the cascade was often used as the far-field velocity when calculating the airflow displacement thickness on the suction surface. Figure 10 shows the velocity distribution in the cascade passage. It can be easily found from the figure that the velocity of the airflow is different at different chord length positions. So our team used different far-field velocities at different position when calculating the displacement thickness.
Figure 11 shows the performance of the displacement thickness on the suction surface under different roughness. Since the incoming Mach number is very small, the density is assumed to be constant when calculating the displacement thickness. Overall, the displacement thickness increases with roughness. However, when the roughness is small (ks+ = 11.80), the displacement thickness of the blade back surface begins to increase at x/c = 0.2, which is greater than the displacement thickness of the smooth blade cascade. But when x/c = 0.4, the displacement thickness starts to decrease, when x/c = 0.46, the displacement thickness value of the rough blade is equal to the case of the smooth wall, and is smaller than that of the smooth wall after that.
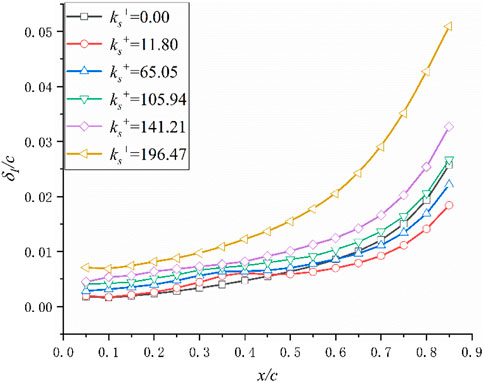
FIGURE 11. Displacement thickness (
In this paper,
The shape factor (H12) of the suction surface of the blade is shown in the Figure 12, the shape factor of the smooth blade is almost kept around 2, and slightly increased near the leading and trailing edges. When the roughness of the ks+ = 11.80, the shape factor value increases from the leading edge of the blade and suddenly increases after the chord length of 0.11, where the airflow starts to transition. From the shape factor, it can be found that the appearance of roughness induces an early transition of the boundary layer on the back surface of the leaf. But when the roughness is 11.80, the airflow on the back surface of the blade returns to the laminar state again at the chord length of 0.75. After the boundary layer is regenerated, the shape factor of rough leaves is also slightly reduced compared to smooth blade.
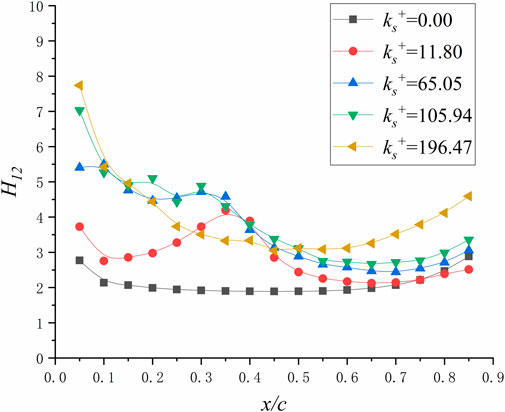
FIGURE 12. H12 on the suction surface.
Figure 13 shows the outlet airflow angle of the cascade. The outlet angle of the cascade varies with the roughness of the suction surface and is affected by the angle of attack of the incoming flow. When the angle of attack of the incoming flow is negative, the airflow angle of the outlet increases with the increase of roughness. When the angle of attack of the incoming flow is positive, even if the suction surface of the cascade becomes rough, the airflow angle at the outlet will hardly change. Once the angle of attack of the incoming flow is greater than 0, the increase of the reverse pressure gradient when the flow passes through the cascade passage will cause the airflow to transition in advance. The rough wall surface on the suction surface will be completely covered by the boundary layer with increased thickness. Rough suction surface no longer has an interference effect on the mainstream area.
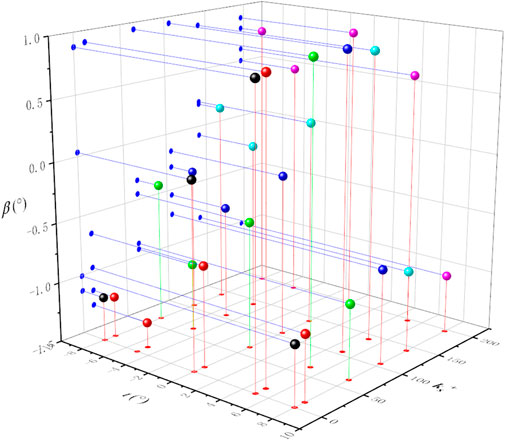
FIGURE 13. Outlet flow angle.
The velocity distribution along the x direction was measured at position 1. Position 1 is at 150% chord length from the leading edge of the blade. The effect of roughness on the velocity distribution is linear. As the roughness increases, the minimum velocity decreases linearly, as shown in Figure 14. The position of the minimum velocity is biased towards the suction surface of the blade.
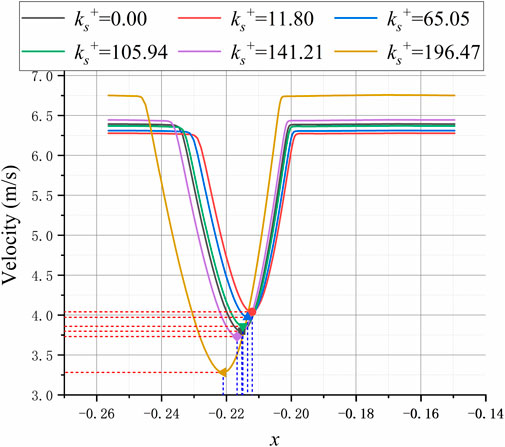
FIGURE 14. Position 1 velocity (m/s).
Take the speed extreme point of the smooth blade as the zero point, and the extreme point position is positive toward the pressure surface and negative toward the suction surface. When
Figure 15 is the contour of the velocity extreme point position and the velocity minimal value. When i is positive, the roughness does not affect the velocity distribution on the B-to-B plane. Meanwhile, as the roughness increases, the velocity of the blade exit is less sensitive to the angle of attack of the incoming flow. As the roughness of the suction surface increases, the velocity gradient at the exit of the cascade increases. The mixing loss of the secondary flow of the blade wake and the main flow increases due to the increase of the velocity gradient. The increase in roughness will also reduce the sensitivity of the cascade flow field to the angle of attack of the incoming flow.
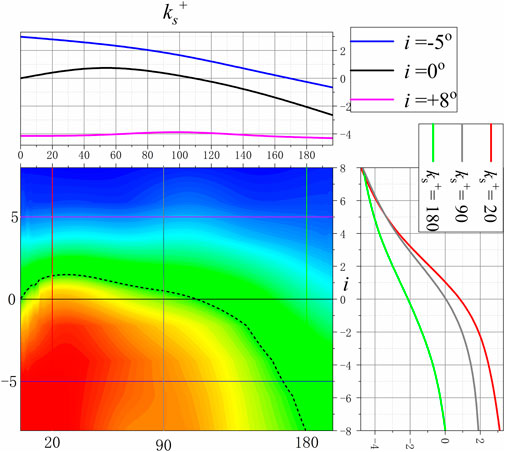
FIGURE 15. Minimum Velocity coordinate.
The calculation result of LES is shown in Figure 16 Figure 17to Figure 18. Vorticity in the cascade passage is shown in the figure. In continuum mechanics, vorticity is a pseudovector field that describes the local spinning motion of a continuum near some point (the tendency of something to rotate), as would be seen by an observer located at that point and traveling along with the flow. It is an important quantity in the dynamical theory of fluids and provides a convenient framework for understanding a variety of complex flow phenomena, such as the formation and motion of vortex rings (Guyon et al., 2002; Higham et al., 2015).
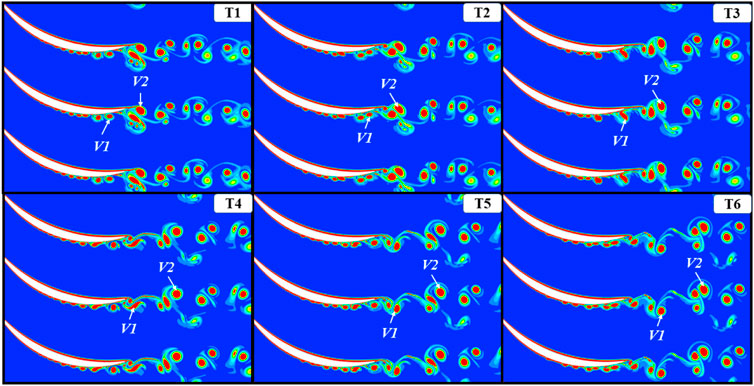
FIGURE 16. Smooth cascade vorticity.
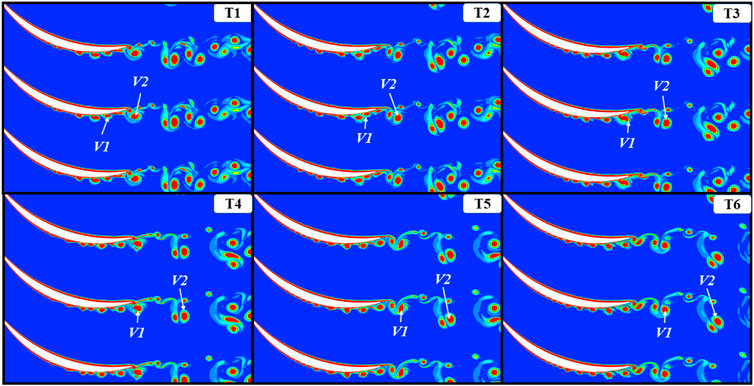
FIGURE 17. Rough cascade vorticity (
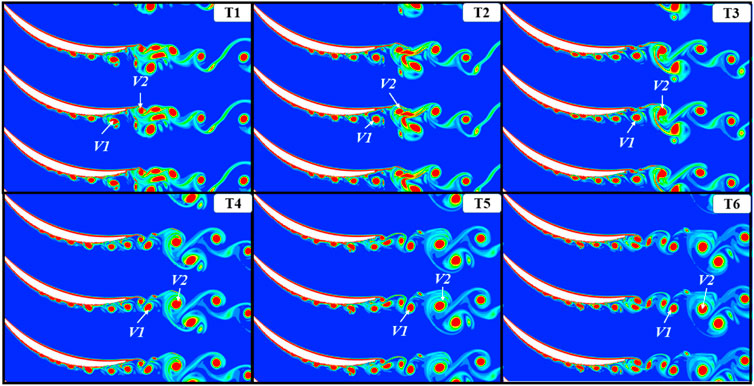
FIGURE 18. Rough cascade vorticity (
For a smooth cascade passage, the vorticity on the suction surface starts to change at 50% chord length. At the beginning of 0.36 chord length of the suction surface, the high-value area of the vorticity begins to become concentrated and gathers into a cluster. This phenomenon indicates that the airflow changes from laminar flow to turbulent flow from this position. The vortex first moves tightly against the suction surface force towards the trailing edge of the blade, and its size is gradually increasing. At 0.8 chord length, the vortex starts to break away from the suction surface. Unlike the suction surface, the airflow on the pressure surface does not turn into turbulence until it passes the trailing edge, and a larger vortex V2 is formed. The vortex V1 on the suction surface collides with the vortex V2 on the pressure surface downstream of the blade.
The vortex V2 is impacted by the high-speed, small-scale vortex V1 at the trailing edge of the blade. V2 is crushed and divided into a large-scale vortex and multiple small-scale vortices. The large-scale vortices continue to move downstream along the main flow direction, and the small-scale vortices are gradually consumed during the movement and almost disappear at T6. The shape of V1 changes from the previous round shape to a long strip shape at T4, and it returns to a round shape at T5. At t4, V1 is deformed under the influence of the vortex generated by the trailing edge of the pressure surface. However, in a short period, V1 regained its round shape under the influence of the mainstream, and the scale of the vortex was not affected.
When
Figure 16 is the vorticity amount of the passage when
6 Conclusion
In this study, we simulated the effect of a 2D-rough surface on a double-circular-arc blade cascade. The profile of the suction surface was replaced to simulate a rough surface. From the above discussion, one may conclude that the sensitivity of the pressure coefficient distribution on the blade surface to the angle of attack does not correlate with the roughness at the suction of the blade. When the incoming flow angle of attack is positive, the velocity distribution of the trailing edge of the cascade along the b-b direction and the airflow angle at the outlet will not change with the roughness. When
Unfortunately, only the effect of two-dimensional roughness on the airflow in the cascade passage was simulated in this study. The impact of the three-dimensional roughness of the blade surface on the flow of the cascade is more complicated. Meanwhile, the numerical calculation of the three-dimensional rough wall also puts forward a greater demand on the computer, which is currently difficult to supply the requirements. So one important future direction of studying the effect of the rough blade on the compressor cascade is establishing the relationship between the two-dimensional flow and the three-dimensional flow in the rough cascade. And more experiments should be conducted for the compressor cascade.
Data availability statement
The original contributions presented in the study are included in the article/supplementary material, further inquiries can be directed to the corresponding author.
Author contributions
L-SW is mainly responsible for rough blade calculation and data collation in this research Z-YW is responsible for the guidance and assistance of numerical simulation calculations in this research Y-HW is responsible for providing guidance and assistance in the writing of the article in this research MW is responsible for providing advice and guidance on the research content in this research H-OS is responsible for revising and optimizing the article during the research.
Funding
This work was supported by the National Science and Technology Major Project (J2019-Ⅲ -0017).
Conflict of interest
The authors declare that the research was conducted in the absence of any commercial or financial relationships that could be construed as a potential conflict of interest.
Publisher’s note
All claims expressed in this article are solely those of the authors and do not necessarily represent those of their affiliated organizations, or those of the publisher, the editors and the reviewers. Any product that may be evaluated in this article, or claim that may be made by its manufacturer, is not guaranteed or endorsed by the publisher.
References
Bons, J. P. (2010). A review of surface roughness effects in gas turbines. J. Turbomach. 132 (2), 021004. doi:10.1115/1.3066315
Chen, Y., Escalera Mendoza, A. S., and Todd Griffith, D. (2021). Experimental and numerical study of high-order complex curvature mode shape and mode coupling on a three-bladed wind turbine assembly. Mech. Syst. Signal Process. 160, 107873. doi:10.1016/j.ymssp.2021.107873
Chen, Y., and Griffith, D. T. (2022a). Experimental and numerical investigation of the structural dynamic characteristics for both surfaces of a wind turbine blade. J. Vib. Control, 107754632210974. doi:10.1177/10775463221097470
Chen, Y., and Griffith, D. T. (2022b). Finite cross-section method for mode shape recognition of highly coupled beam-type structures. J. Vib. Acoust., 144. doi:10.1115/1.4053977
Chotalia, R. J., and Alone., D. B. (2017). “Numerical investigations on influence of uniform blade surface roughness on the performance characteristics of a transonic axial flow compressor stage,” in ASME 2017 Gas Turbine India Conference, Bangalore, India, December 7–8, 2017.
Guyon, E., Hulin, J. P., Petit, L., Mitescu, C., and Jankowski, D. (2002). Physical hydrodynamics. Appl. Mech. Rev. 55 (10), B96–B97. doi:10.1115/1.1497485
Higham, N. J., Dennis, M. R., Glendinning, P., Martin, P. A., Santosa, F., and Tanner, J. (2015). The princeton companion to applied mathematics, 1–80. doi:10.1515/9781400874477
Joo, J., Medic, G., and Sharma, O. (2017). “Large-eddy simulation of roughened NACA65 compressor cascade,” in ASME Turbo Expo 2017: Turbomachinery Technical Conference and Exposition, Charlotte, North Carolina, USA, June 26–30, 2017.
Kong, D., Jeong, H., and Song, S. J. (2017). Effects of surface roughness on evolutions of loss and deviation in a linear compressor cascade. J. Mech. Sci. Technol. 31 (11), 5329–5335. doi:10.1007/s12206-017-1027-y
Mishra, R. K. (2015). Fouling and corrosion in an aero gas turbine compressor. J. Fail. Analysis Prev. 15, 837–845.
Morini, M., Pinelli, M., Ruggero Spina, P., and Venturini, M. (2011). Numerical analysis of the effects of nonuniform surface roughness on compressor stage performance. J. Eng. Gas. Turbine. Power 133 (7), 745–753. doi:10.1115/1.4002350
Nicola, A., Morini, M., Pinelli, M., Spina, P. R., Suman, A., and Venturini, M. (2014). Numerical analysis of the effects of surface roughness localization on the performance of an axial compressor stage. Energy Procedia 45, 1057–1066. doi:10.1016/j.egypro.2014.01.111
Nicola, A., Morini, M., Pinelli, M., Spina, P. R., Suman, A., and Venturini, M. (2013). Performance evaluation of nonuniformly fouled axial compressor stages by means of computational fluid dynamics analyses. J. Turbomach. 136, 021016, doi:10.1115/1.4025227
Shi, X., Liu, H., Long, F., Tang, J., Wang, L., Abdul Amir, H. F., et al. (2017). Study on the influence of blade roughnesson axial flow compressor stage performance. MATEC Web Conf. 108, 08008. doi:10.1051/matecconf/201710808008
Simens, M. P., and Gungor, A. G. (2013). “The effect of surface roughness on laminar separated boundary layers,” in ASME Turbo Expo 2013: Turbine Technical Conference and Exposition.
Suman, A., Morini, M., Rainer, K., Aldi, N., Brun, K., Pinneli, M., et al. (2017). Estimation of the particle deposition on a subsonic axial compressor blade. J. Eng. Gas Turbines Power 139. doi:10.1115/1.4034209
Sun, H.-O., Wang, L.-S., Wang, Z.-Y., Wang, M., Wang, Y.-H., Wan, L., et al. (2021). Simulation of the effect of nonuniform fouling thickness on an axial compressor stage performance. Adv. Mech. Eng. 13 (7), 168781402110304. doi:10.1177/16878140211030403
Sun, H Ou, Wang, L., Wan, L., and Qu, F. (2018). “Study on the performance variation of compressor under salt fog scale,” in ASME Turbo Expo 2018: Turbomachinery Technical Conference and Exposition.
Syverud, E., and Bakken, L. E. (2006). “The impact of surface roughness on axial compressor performance deterioration,” in ASME Turbo Expo 2006: Power for Land, Sea, and Air, 491–501.
Tang, Y., Xi, G., Wang, Z., and Tian, Y. (2019). Quantitative study on equivalent roughness conversion coefficient and roughness effect of centrifugal compressor. J. Fluids Eng. 142, 021208. doi:10.1115/1.4044843
Zierke, W. C., and Deutsch, S. (1990). Closure to “discussion of ‘the measurement of boundary layers on a compressor blade in cascade: Part 4—flow fields for incidence angles of −1.5 and −8.5 degrees’” (1990, ASME J. Turbomach., 112, p. 255). J. Turbomach. 110 (2), 255. doi:10.1115/1.2927641
Nomenclature
Re Reynolds number
Ra Surface Roughness
AR Aspect ratio
Ma Mach number
V Velocity
H12 Shape factor
Subscripts and superscripts
p Pressure side
s Suction side
LE Leading-edge
TE Trailing-edge
in Inlet
out Outlet
is Isentropic
* Total
Keywords: roughness, boundary layer, compressor cascade, suction, large eddy simulation
Citation: Wang L-S, Wang Z-Y, Wang Y-H, Wang M and Sun H-O (2022) Numerical simulation of low reynolds number 2-d rough blade compressor cascade. Front. Energy Res. 10:950559. doi: 10.3389/fenrg.2022.950559
Received: 23 May 2022; Accepted: 12 July 2022;
Published: 11 August 2022.
Edited by:
Lei Luo, Harbin Institute of Technology, ChinaReviewed by:
Xiaochen Mao, Northwestern Polytechnical University, ChinaLi Jia, Chang’an University, China
Copyright © 2022 Wang, Wang, Wang, Wang and Sun. This is an open-access article distributed under the terms of the Creative Commons Attribution License (CC BY). The use, distribution or reproduction in other forums is permitted, provided the original author(s) and the copyright owner(s) are credited and that the original publication in this journal is cited, in accordance with accepted academic practice. No use, distribution or reproduction is permitted which does not comply with these terms.
*Correspondence: Yan-Hua Wang, d2FuZ3lhbmh1YUBocmJldS5lZHUuY24=