Abstract
This paper is a sequel to a previous article by the authors in which UAV-based energy-efficient reconfigurable routing (UBER) scheme was proposed to address coverage loss and rapid energy depletion issues for smart wireless livestock sensor networks. Sensor node and route failure issues associated with the UBER scheme are therefore addressed in this research by proposing a recoverable UAV-based energy-efficient reconfigurable routing (RUBER) scheme. RUBER scheme relies on an efficient fault detection and recycling technique, dynamic recovery mechanism, and robust route maintenance technique. Performance of RUBER was analyzed under low, medium and high failure rate network conditions. Performance indices employed for this assessment are failure detection ratio (FDR), failure recovery ratio (FRR), load balancing ratio (LBR), and packet delivery ratio (PDR). Analysis results demonstrated that keeping the failure rate below 10% led to performance improvements of 60.96%, 74.14%, 64.68%, and 60.74% for FDR, FRR, LBR, and PDR, respectively. Performance comparison of RUBER was conducted against UBER and hybrid heterogeneous routing (HYBRID) schemes. Performance metrics utilized for this comparative evaluation are average routing delay (ARD), energy dissipation ratio (EDR), routing overhead (ROH), fault tolerance index (FTI), nodal failure recovered (NFR), route failure recovered (RFR), and cluster survival ratio (CSR). With respect to best-case values, RUBER exhibited gains of 79.67%, 44.98%, 67.88%, 74.90%, 52.20%, 70.56%, and 52.52% over UBER and HYBRID in terms of ARD, EDR, ROH, FTI, NFR, RFR, and CSR respectively. Simulation experiments revealed the relative competitiveness of the RUBER scheme against the benchmarked schemes.
1 Introduction
Livestock farming (LF) plays a critical role in the global economy due to the rapidly growing pressure on food supply (Gray et al., 2017; Barbedo and Koenigkan, 2018; Alanezi et al., 2022a; Alanezi et al., 2022b). In reaction to this global trend, the productivity (including input and capacity efficiencies) of LF industries must scale up proportionally (Mudziwepasi and Scott, 2014; Sharma and Koundal, 2018; Friha et al., 2021). Low-cost automated wireless sensor network (WSN) technologies have served as viable solutions to tackle this production capacity challenge (Kakamoukas et al., 2019; Xiang et al., 2019; Boursianis et al., 2020; Long et al., 2020; Loukatos and Arvanitis, 2021; Alanezi et al., 2022a; Loukatos et al., 2022). Moreover, the integration of embedded Ambient Intelligence (AmI) services into Internet of Things (IoT) devices for smart sensor nodes (SNs) have led to the effective allocation, dynamic management, and distributed control of scarce energy resources (Barriuso et al., 2018; Mistry et al., 2022; Symeonaki et al., 2022). Conservation and optimal utilization of scarce energy resources is central to prolonging the lifetime of specialized WSN applications deployed for monitoring livestock’s vital stimuli and tracking their locations (Barbedo and Koenigkan, 2018; Sharma and Koundal, 2018). One of the common energy conservation techniques is the adoption of low-power portable, wearable and autonomous SNs for sensing, gathering and processing of livestock stimulus (Barriuso et al., 2018; Casas et al., 2021; Alanezi et al., 2022b). However, unfavorable atmospheric conditions coupled with the unpredictable roaming pattern of livestock makes tracking very challenging, especially for applications deployed solely based on wearable SNs. These challenges include rapid energy depletion, high cost of continuous real-time monitoring, frequent coverage loss in large network field, short network lifespan, and monotony of manual intervention in system’s operation.
These challenges have spurred series of research efforts on the viability of adopting Unmanned Aerial Vehicles (UAVs) to tackle routing issues related to monitoring livestock stimulus (Mudziwepasi and Scott, 2014; Pajares, 2015; Gray et al., 2017; Sharma and Koundal, 2018; Freed et al., 2021; Mukhamediev et al., 2021; Petrova and Petrov, 2021; Mistry et al., 2022). The key technical benefits of incorporating UAV into LF surveillance solutions are design flexibility, cost-effectiveness, and coverage effectiveness (Chamoso et al., 2014; Chabot and Bird, 2015; Barbedo and Koenigkan, 2018; Rivas et al., 2018; Afrianto et al., 2020; Behjati et al., 2021). In such LF surveillance applications, UAVs serve as 1.) sinks for gathering high-priority stimulus from wearable SNs and 2.) flying mobile terminals for direct observation of the livestock (Xu et al., 2016; Yue et al., 2018). Therefore, the large continuous production of LF products necessitates the fusion of WSN with UAV innovations to tackle the rising global food supply pressure. Researchers have consequently deployed several integrated UAV-WSN technologies to boost the production capacity of LF industries, where UAVs serve as mobile sinks (MS) gathering livestock stimulus, and specialized Embedded Intelligence (EI) algorithms are utilized for decision-driven predictive data analytics (Yue et al., 2018; Boursianis et al., 2020). Integrated UAV-WSN solutions are therefore highly effective in improving the end-to-end LF food supply chain process (Xu et al., 2016; Alanezi et al., 2022b; Mistry et al., 2022). Most especially, distributed unsupervised livestock surveillance solutions mitigate the monotony, difficulty, and tediousness of manual inspection of large livestock farms. However, the issues of short network lifespan and frequent coverage loss still subsist.
Researchers have proposed a wide range of generic (Sivakumar et al., 1999; Heinzelman et al., 2000; Heinzelman et al., 2002; Bandyopadhyay and Coyle, 2003; Ding et al., 2005; Huang and Wu, 2005; Lotfinezhad and Liang, 2005; Neethirajan, 2017) and specific (Rahmatizadeh et al., 2014; Asmaa et al., 2016; Nitesh et al., 2017; Yue et al., 2018; Zhang et al., 2018; Behera et al., 2019; Huang et al., 2020; Gnanasekera et al., 2021; Lin et al., 2021; Hu et al., 2022; Quoc et al., 2022) routing techniques to address these issues. Among the proffered techniques, cluster-based routing (CBR) strategies have relatively exhibited better network resilience, connectivity, adaptability, reliability, energy-efficiency, and computational simplicity (Salami et al., 2009; Salami et al., 2010; Astakhova, 2020; Alanezi et al., 2022b).
Effective design of distributed unsupervised livestock monitoring applications using CBR strategy requires flexible, scalable, low-cost, and energy-aware routing architectures. This is usually implemented by dynamically, logically, and systematically arranging smart SNs fastened to livestock herds into sets named herd clusters (HCs) in this research work, for easily achieving network scalability, adapting to dynamic topology and conserving scarce energy resources. For each HC, the network elects HC leads (HCLs) based on their relative distance cost with respect to the MS, residual energy, and shortest-path accessibility for data transmission. After the cluster configuration phase, HC members (HCMs) forward sensed livestock stimulus to their respective HCLs using single-hop or multi-hop transmission. After the intra-cluster data transmission phase, HCLs forward cumulated data to the hovering MS for subsequent relaying to the base station (BS) (Gnanasekera et al., 2021; Yaxley et al., 2021; Alanezi et al., 2022b; Hu et al., 2022; Li et al., 2022).
Centered on this herd CBR methodology, this article proffers a recoverable UAV-based energy-efficient reconfigurable (RUBER) routing algorithm for smart wireless livestock sensor networks. This proposed RUBER scheme is an improvement on the previous UBER scheme developed by the same authors. One of the major improvements and technical differences of RUBER is that it specifically solves sensor node and route failure issues which are significant challenges faced by the UBER scheme. Another technical difference lies in the unique features, techniques and operational mechanisms introduced and utilized by these CBR schemes. RUBER relies on an efficient fault detection and recycling technique, dynamic recovery mechanism, and robust route maintenance technique while UBER relies on UAV-assisted coverage recovery mechanism, dynamic residual energy thresholding strategy, and robust cluster-to-UAV link formation. These operational mechanisms and techniques introduced for RUBER are specialized enhancements, functional improvements and algorithmic extensions over the operational features of UBER. MATLAB and OMNET++ simulation experiments were employed for performance assessment and comparative analysis of RUBER by benchmarking its performance with UBER and HYBRID. Simulation experiments demonstrated the efficiency and relative competitiveness of the RUBER scheme against the benchmarked schemes.
The rest of this article is arranged in the following way: Section 2 reviews the pertinent fault-tolerant CBR strategies for MS-based applications. Section 3 technically describes the mechanism of operation of the proposed RUBER protocol, while Section 4 delivers the ensuing simulation results together with buttressing explanations. Section 5 provides the conclusion to this article.
2 Related works
Conventional CBR strategies are usually categorized as generic based on their network architecture, routing mode, and compatibility with diverse WSN applications. However, the common limitations of generic CBR schemes are cluster re-configuration/re-sizing issues for large-scale networks, time-complexity tradeoff, rapid energy depletion due to long-range single-hop transmissions, and frequent HCL failures (Sivakumar et al., 1999; Heinzelman et al., 2000; Heinzelman et al., 2002; Bandyopadhyay and Coyle, 2003; Ding et al., 2005; Huang and Wu, 2005; Lotfinezhad and Liang, 2005; Salami et al., 2009; Salami et al., 2010; Bello-Salau et al., 2011a; Bello-Salau et al., 2011b; Salami et al., 2011; Neethirajan, 2017).
UBER was proffered as an energy-efficient, coverage-aware and reconfigurable CBR technique for smart wireless livestock sensor networks (Alanezi et al., 2022b). This CBR technique relies on UAV-assisted coverage maintenance mechanism, adaptive cluster-to-UAV link formation, and linearized energy thresholding pattern for reduced energy consumption. Clustering costs and proximity to aerial MS are part of the parameters for HCL election while multi-hop data forwarding chain is dynamically constructed for end-to-end communication in the network (Alanezi et al., 2022b). The drawback of this CBR technique is the non-availability of repair and recovery strategy to cater for the detected SN and route failures.
FCGW was proposed as a fault-tolerant CBR scheme that relies on multi-path routing, symmetric link formation, Gaussian network architecture, and square-shaped cluster formation (Quoc et al., 2022). The LF field is divided into virtual square grids (or clusters) while Gaussian integers are used for electing the HCLs and MS are employed for distributed load balancing and network density re-adjustment. Shortest inter-cluster distance costs are computed for end-to-end data transmission with the aid of multiple path formation in the Gaussian network (Quoc et al., 2022). The limitations of this CBR scheme are the broadcast overhead issues and large delay associated with establishing long-range transmissions in the Gaussian network architecture.
HYBRID was proffered as a CBR strategy for network lifetime enhancement by engaging SNs deployed in unfavorable LF environments where energy consumption is managed by systematically partitioning the LF field into logical HCs and situating the BS at the edge of the network (Behera et al., 2019). Residual energy of SNs is the basis for constructing HCs. This means that SNs with relatively more residual energy have higher probability of being chosen as HCLs. Distance costs between HCs are taken into consideration for multi-hop transmission of livestock stimulus in the LF network (Behera et al., 2019). The drawback of this strategy is the processing costs of operating varying transmission modes and energy levels.
MS-DVCR was offered as a geographic routing scheme for minimizing energy consumption by employing MS-based goal-oriented virtual coordinate technique (Rahmatizadeh et al., 2014). The function of the virtual coordinate technique is to minimize the number of network update occurrences as aggregated data is relayed to the BS from the MS. This routing scheme provides an effective and alternative means for achieving MS localization without the need of taking actual distance measurements on the LF field (Rahmatizadeh et al., 2014). The limitation of this routing scheme is the execution overhead associated with virtual coordinate information broadcast, maintenance, and management.
AODV-SMS (ABC-PSO) was proposed as a fault-tolerant CBR technique for route optimization in mobile WSN using artificial bee colony-particle swarm algorithm (Yue et al., 2018). This CBR scheme incorporates path coding, collaborative updating, swarm evolution, and particle selection for the recovery and optimal formation of alternate routes. The strengths of this scheme are reliable data transmission route, effective route recovery ability, and relatively more accurate computations of network parameter(s) optimization (Yue et al., 2018). The major limitations of this strategy are the computational cost for running the optimization routine and the resulting associated energy tax of this algorithm.
VBRP was put forward as a delay-efficient coverage-aware CBR algorithm for optimizing MS trajectory in critical applications (Nitesh et al., 2017). This CBR algorithm relies on local orphaned SN recovery strategy, single-hop communication, and utilizes Voronoi vertices for computing rendezvous points which aids in MS path length reduction. The strengths of this algorithm are extended network lifespan, relatively optimal MS path length, reduced average waiting duration, and better network adaptability (Nitesh et al., 2017). The limitations of this algorithm are poor energy balancing and coverage loss issues due to topology variations.
RRM-WLDCNN was proffered as a resilient routing scheme for high-reliability monitoring applications (Huang et al., 2020). This routing strategy relies on graph labelling, subgraph extraction, and path prediction technique using deep-learning (kernel and dual convolutional neural network) approach. The benefits of this scheme are lower data transmission cost, improved path reliability, enhanced network lifetime, and better energy consumption performance (Huang et al., 2020). The drawbacks of this scheme are interference issues, processing delays, and lack of flexibility and adaptability for heterogeneous and dynamic large-scale WSNs.
Table 1 provides the technical summary of the reviewed CBR schemes.
TABLE 1
| CBR Scheme | Authos | Year | Mechanism | Metrics | Benefis | Drawbacks |
|---|---|---|---|---|---|---|
| UBER | Alanei et.al | 2022 | Dynamic residual energy thresholding culster-to-UAV Link Formation UAV-assisted coverage recovery | Network stability load balancing ratio,topology fluctuation effect ratio energy consumption network coverage,received packets,SN failures detected,routing overhead,end-to-end delay | Energy conservation network coverage maximization | Critical SN and route failures |
| FCGW | Quc et al. | 2022 | Multi-path routing symmetric link formation,Gaussion network architecture square-shaped cluster formation | Average residual energy number of dead nodes number of packets sent/received | Enhanced fault tolerance,improved data reliability minimal energy consumption | Broadcast overhead issues, large delays from long-range transmission |
| HYBRID | Behera et al. | 2019 | Distance dependent hybrid routing mode, two-mode energy level for effective power utilization | Residual energy packets received,throughput number of alive nodes number of dead nodes network stability, network lifetime | Improved throughput,prolonged network lifetime minimal energy consumption | Procssing costs of operating varying transmission modes and energy levels |
| MS-DVCR | Rahmatizadeh et al. | 2014 | MS-based goal-oriented virtual coordinate technique | Successfully routed messages, average path length, energy consumption | Lower energy consumption, effective mobile nodes localization | Execution overhead from virtual coordinate information broadcast, maintenance, and management |
| AODV-SMS | Yue et al. | 2018 | Artificial bee colony-particle swarm algorithm | Energy consumption energy utilization rate,packets loss rate transmission latency,network connectivity network reliability size of network | Reliable data transmission route, effective route recovery ability, accurate computations of network parameter(s) optimization | Computational cost for running the optimization routine, high energy tax |
| VBRP | Nitesh et al. | 2017 | Local orphaned SN recovery strategy, single-hop communication, Voronoi vertices | Path length, average waiting time, network lifetime, standard deviation of remaining energy | Extended network lifespan, optimal MS path length, reduced average waiting duration, better network adaptability | Poor energy balancing, coverage loss issues from topology variations |
| RRM-WLDCNN | Huang et al. | 2020 | Graph labelling, subgraph extraction, path prediction using deep-learning (kernel and dual convolutional neural network) | Transmission delay, system residual energy, average routing length, number of dead nodes, precision | Lower data transmission cost, improved path reliability, enhanced network lifetime, better energy consumption | Interference issues, processing delays, lack of flexibility/adaptability |
Technical summary of reviewed CBR schemes.
3 Proposed RUBER scheme
This section discusses the integrated network architecture, operational assumptions, cluster setup process, routine sensing and forwarding operations, failure detection and recycling procedure, recovery mechanism, and route maintenance strategy.
3.1 Integrated network architecture
Figure 1 depicts the integrated network architecture for smart wireless livestock sensor network. In this heterogeneous network architecture, smart wearable SNs serving as HCMs sense vital stimulus (pulse rate, sweat volume, temperature, position) and transmit detected stimulus to their corresponding HCLs. The HCLs combine all received stimulus received from their respective HCMs and forward the cumulated stimulus to the adjacent UAVs serving as MS. UAVs hover above the LF network area at a reachable operational altitude. With the aid of a network gateway (NGW)-BS connection equipped with Zigbee (ZGB) interface, these MS relay received cumulated stimulus to the livestock monitoring server (LMS) for classification and processing. The LMS examines the classified and processed stimulus in order to trigger the appropriate LF controller (LFC) devices (switches, alarms, thermostat, lighting adjusters, and other regulators). Permitted mobile end users (MEUs) are allowed to access, scrutinize, and utilize the livestock stimulus database from the LMS through Internet (INET) link.
FIGURE 1

Integrated network architecture (Alanezi et al., 2022b).
3.2 Assumptions
The proposed RUBER scheme is based on the following underlying assumptions:
1) All SNs are identical with homogeneous physico-electronic properties.
2) UAVs serve as MS with advanced energy storage, antenna characteristics and processing capabilities.
3) UAV has variable speed with three degrees of freedom.
4) UAVs are EI-enabled for seamless control from the LMS.
5) Smart SNs are adaptive to multiple transmission routes.
3.3 Energy consumption model
Conventional energy dissipation model is largely contingent on the number of transferred bits (b) and interspace (l) as posited in (Heinzelman et al., 2000; Heinzelman et al., 2002) using the first-order radio model. The consequence of this contingent relationship is that energy tax (ETAX) grows exponentially with increasing interspace, as stated in Eq. 1 (Alanezi et al., 2022b):Where and are op-amp and electronic energy depletions, respectively. Eq. 2 describes the interspace as (Friis, 1946):Where is the wavelength and is the path attenuation factor. RUBER’s energy dissipation model curbs this exponential growth of by relying on the dynamic residual energy thresholding strategy formulated in (Alanezi et al., 2022b) as:Where lth, , and are distance threshold, long-range transmission energy and short-range transmission energy, respectively. and values are based on practical transceivers design specifications (IEEE, 2020; Texas Instruments, 2022). The distance threshold is expressed as (Alanezi et al., 2022b):Where hrx, htx, v, fc, and k are receiver’s antenna height, transmitter’s antenna height, velocity, carrier frequency, and threshold constant, respectively. By inspection, Eq. 3 has been reduced to a linear form which helps to curb exponential growth associated with the quadratic form in Eq. 1. Furthermore, it must be mentioned that most reliability and fault-tolerant CBR schemes rely on multipath routing which is an energy-intensive process as the energy incurred can be expressed as:Where and represent the total number of SNs and total number of backup routes, respectively. In the proposed RUBER scheme, only two backup routes are employed in addition to the main shortest route. This reduces the energy loss, complexity and computational cost of Eq. 5 by setting constant for the RUBER scheme as:
The implication of Eq. 6 is that the main shortest route is employed for data transmission while two backup routes are utilized to handle traffic overloading and network failures (specifically SN and route failures). In order to further curb traffic overloading, a time-variant dynamic load is contrived based on the residual energy as:Where , and bi are the total initial energy, partial derivative operator and number of transferred bits at instance , respectively. The load balancing condition is therefore expressed as:
The load balancing condition in Eq. 8 is periodically monitored and tuned for effective HC size adjustment, traffic overload prevention, and avoiding severe network congestion issues associated with employing multipath routing strategy.
3.4 Setup phase
RUBER algorithm starts with network-wide learning and recognition process where clustering costs are exchanged among contiguous SNs. This is defined as (Alanezi et al., 2022b):Where is the received UAV signal strength for SNx at instance . After the learning and recognition stage, SNs with an active connection with the MS compete to assume HCL roles by computing and dynamically updating their electability probability as (Alanezi et al., 2022b):Where and are the upper and lower HCL contention probability limits. The essence of ratio in Eq. 11 is to improve the HC setup phase by incorporating dynamic residual energy thresholding. The implication of Eq. 11 is that SNs with active connection to the MS and relatively higher have a higher likelihood of being pre-elected as trial HCLs after a specified round R of network operation. Trial HCLs information are shared with closest SNs to construct a set of contiguous trial HCLs out of which the ones with the least clustering cost are given preference as final HCLs for initiating the HCM enlisting process. Upon successful round completion, roles of trial HCLs are upgraded and confirmed as final HCLs. POLLING packets are sent by the final HCLs in expectation of JOIN packets from their adjacent SNs. At the end of the HCM enlisting process, ordinary SNs are tagged as HCMs and included as members of their corresponding final HCL sets. The algorithmic details of the cluster setup phase are described in (Alanezi et al., 2022b).
3.5 Sensing and forwarding phase
In this phase, the radios of HCMs are activated for sensing and forwarding livestock stimulus to their corresponding HCLs. Figure 2 depicts the sensing and forwarding process while Figure 3 illustrates the handshaking process for the proposed RUBER scheme. Neighborhood-1 HCMs (HCM_1, HCM_2, HCM_3, HCM_4, HCM_5, HCM_6) are the set of closest SNs to the HCL while Neighborhood-2 HCMs (HCM_7, HCM_8, HCM_9, HCM_10, HCM_11, HCM_12) are closer to the Neighborhood-1 HCMs than the HCL and as a result, Neighborhood-2 HCMs communicate with the HCL through Neighborhood-1 HCMs using hop-to-hop delivery. As an illustration, HCM_7 detects a desired livestock stimulus and forwards it to HCM_1. HCM_1 replies HCM_7 with an ACK packet provided there are no SN or route failures and forward the stimulus to the HCL. HCL replies HCM_1 with an ACK packet. The HCL combine all received stimulus received from the Neighborhood-1 HCMs and forward the cumulated stimulus to the nearest MS (MS_1). In order to ensure reliability, balanced duty cycle and reduced energy consumption, handshaking is interlaced with multi-hop transmission in the end-to-end communication chain. Upon reception of all the desired livestock stimulus by the LMS, the MS transmit interrupting signal that prompts the HCLs to broadcast END_ROUND packet across the network.
FIGURE 2

Sensing and forwarding process.
FIGURE 3

Handshaking process.
3.6 Failure detection and recycling procedure
Figure 4 shows a HC with SN failure for HCM_2 and route failures for HCM_7-to-HCM_1 and HCM_10-to-HCM_4 links. In this scenario, HCM_7 sends the detected stimulus to HCM_1 but without receiving an ACK response. If an ACK response is not received till the retransmission limit expires for two consecutive transmission rounds (t-2, t-1), then the fault is classified as route failure. In the event that HCM_1, HCM_8 and HCM_12 probes HCM_7 status with ACK packet but without an acknowledging response until the allowed idle limit is exceeded, the fault is classified as SN failure (receiver module). On the other hand, if HCM_7 sends the detected stimulus to HCM_1 and has already received ACK responses in the past at t-2 and t-1 but fails to receive an ACK response in the current round till the retransmission limit expires, then the fault is classified as SN failure (transmitter module). In a scenario, that HCM_1 forwards HCM_7 and HCM_1 stimuli to HCL but before aggregation, HCL detects HCM_1’s stimulus time stamp is out of synchronization (or expired) by more than two transmission rounds in comparison with the current stimulus forwarded by HCM_7, then the fault is classified as SN failure (sensor module). Based on the different classifications of detected faults, RUBER adopts a recycling strategy where SNs are logically categorized (as fully-functioning, traffic-only, initiator, defunct) and reused by the network based on the status of each SN module. A fully-functioning SN has its microcontroller, sensing, transmitter, receiver and power modules operating normally while all these modules are dead for a defunct SN. A backup SN is assigned by the HCL to replace a defunct SN through the network discovery and HCM updating/re-enlisting process. A traffic-only SN has a defective sensing module and is employed only as a passive intermediary for receiving and forwarding packets. On the other hand, an initiator SN has a defective receiver module and is employed only for sensing and forwarding detected stimulus. The failure detection and recycling algorithm is presented in Table 2.
FIGURE 4

Illustration of SN and route failures.
TABLE 2
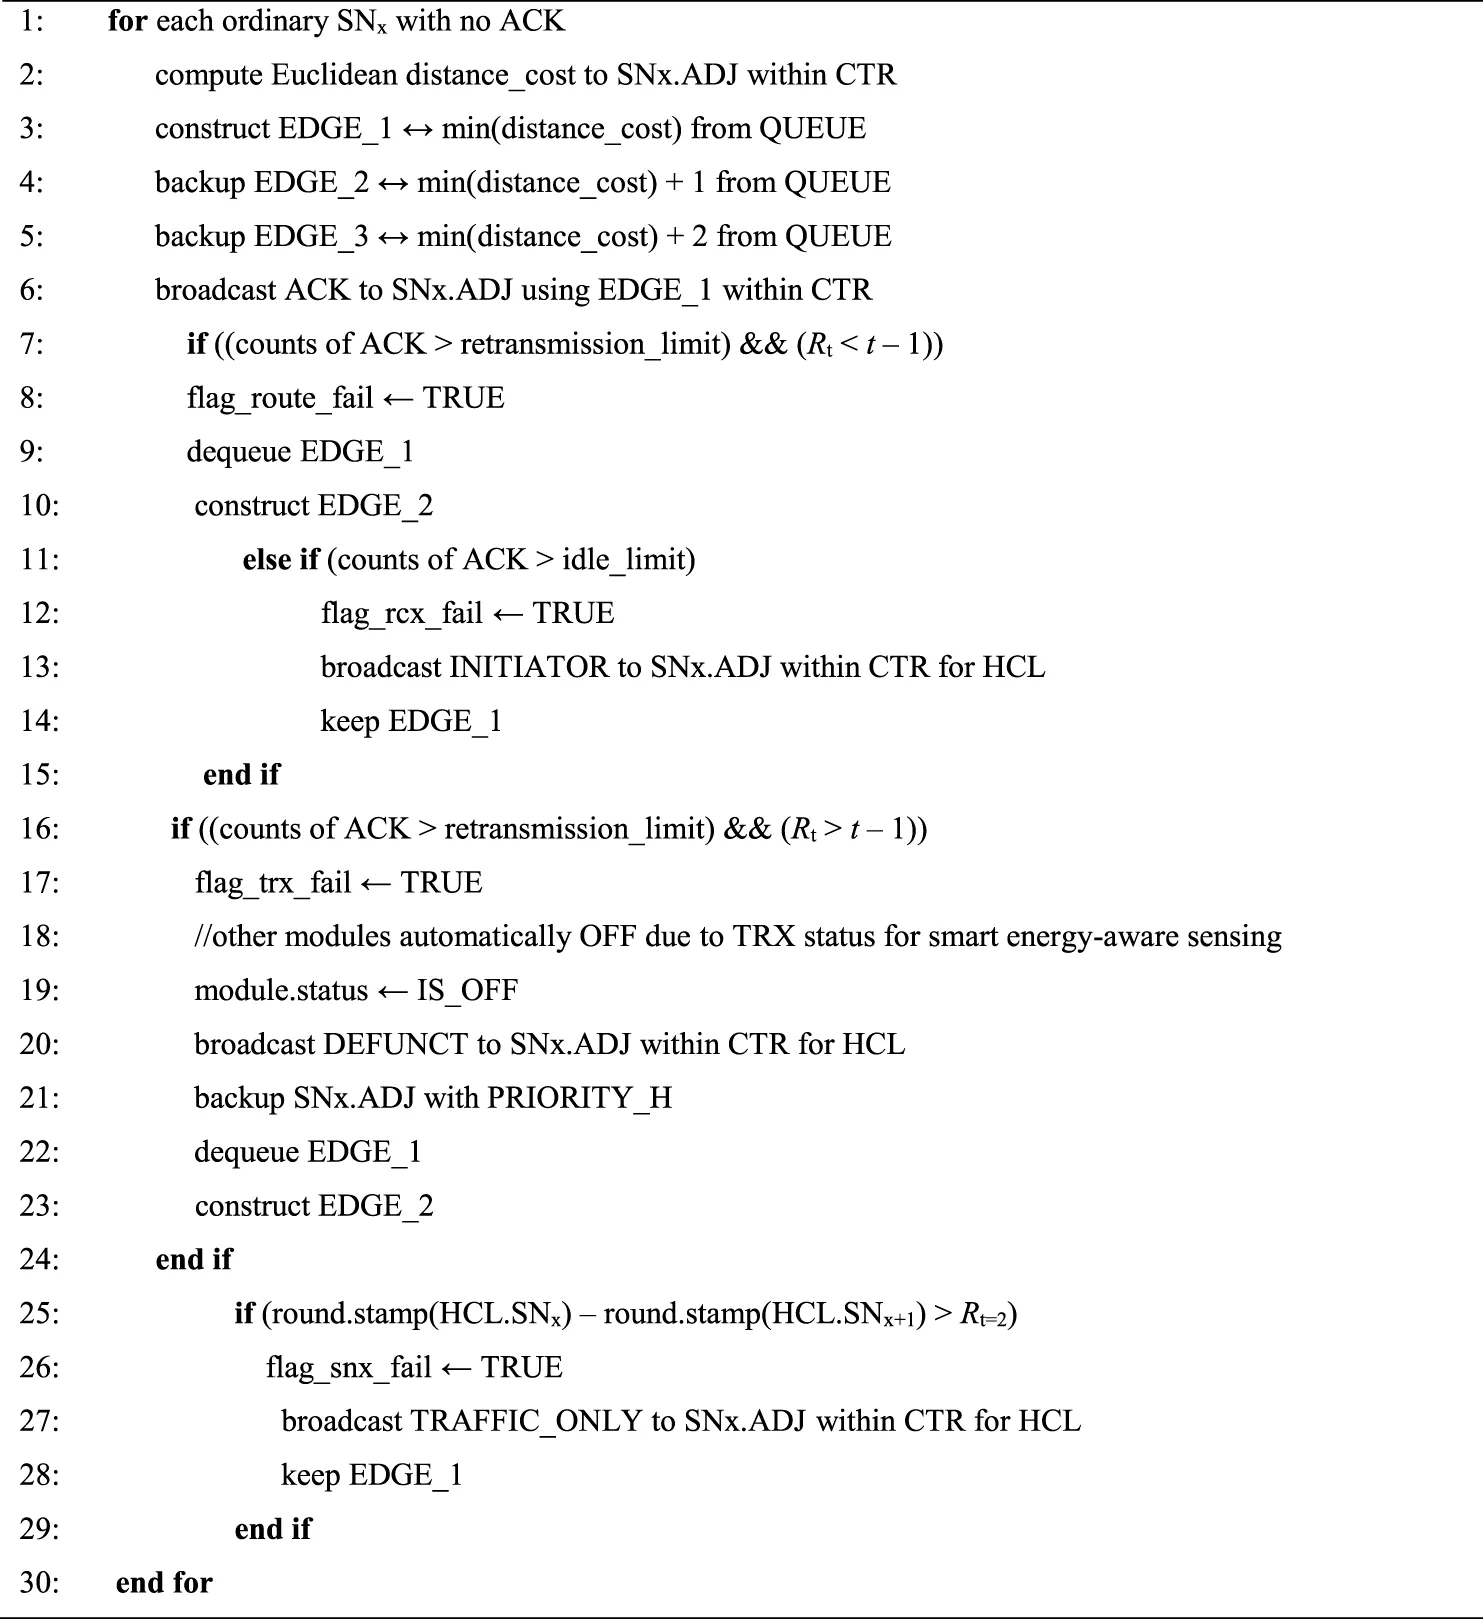 |
Failure detection and recycling algorithm for RUBER.
3.7 Recovery mechanism
Figure 5 describes the recovery mechanism based on the SN and route failure scenarios indicated in Figure 4. In the scenario of route failure between HCM_7 and HCM_1 link, the next shortest backup route (out of the two backup routes) is used to transmit the detected stimulus from HCM_7 to HCM_12. HCM_12 handshakes with HCM_7 and forwards the detected stimulus to HCM_6. HCM_6 handshakes with HCM_12 and forwards the detected stimulus to the HCL. The HCL finally handshakes with HCM_6 before synchronization check, cumulation and forwarding of cumulated stimulus to the MS. In the case of route failure between HCM_4 and HCM_10 as a result of HCM_10s receiver module fault (initiator category), HCM_10 sent detected stimulus to HCM_4 but failed to receive ACK response from HCM_4, backup route through HCM_11 is therefore used to re-transmit the detected stimulus. In the scenario of SN failure of HCM_2 (defunct category), HCM_8 utilizes the next shortest backup route to HCM_9. After handshaking with HCM_8, HCM_9 forwards the detected stimulus to HCM_3. HCM_3 handshakes with HCM_9 and forwards the detected stimulus to the HCL. HCL finally handshakes with HCM_3 before pre-processing and forwarding of cumulated stimulus to the MS.
FIGURE 5

Recovery mechanism.
3.8 Route maintenance strategy
The function of the route maintenance strategy is to prevent severe congestion issues associated with multipath routing. Route maintenance is primarily achieved by utilizing the FIFO transmission scheduling policy, implementing the retransmission limit, and maintaining transmission window between successive data transmissions. The tripartite backup mechanism (using main shortest route and two next shortest backup routes) further helps to effectively ensure route maintenance and reliable data transmission.
4 Results and discussion
This section is a technical discussion on RUBER’s performance indices, simulation specifications, time complexity, performance assessment with respect to different failure rates, and performance analysis of RUBER in comparison with UBER and HYBRID.
4.1 Performance Indices
The indices adopted for performance assessment are failure detection ratio (FDR), failure recovery ratio (FRR), load balancing ratio (LBR), packet delivery ratio (PDR), average routing delay (ARD), energy dissipation ratio (EDR), routing overhead (ROH), fault tolerance index (FTI), nodal failure recovered (NFR), route failure recovered (RFR), and cluster survival ratio (CSR). The conundrum matrix representation for the performance indices is provided in Table 3.
TABLE 3
| Index | Measure | Unit (Scale) | Evaluation Objective | Complexity Rating | Accuracy Rating | Consistency Rating | Performance Target |
|---|---|---|---|---|---|---|---|
| FDR | Reported Faults | Ratio (0–1) | Response to Variations | Low | Medium | Medium | Fault Tolerance |
| FRR | Faults Recovered | Ratio (0–1) | Response to Variations | Medium | Medium | High | Fault Tolerance |
| LBR | Residual Energy | Ratio (0–1) | Response to Variations | High | Medium | High | Energy Efficiency |
| PDR | Packets Received | Ratio (0–1) | Response to Variations | Low | High | High | Throughput |
| ARD | Transmission Delay | Ratio (0–1) | Comparative Analysis | Low | High | Medium | End-to-End Delay |
| EDR | Energy Dissipation | Ratio (0–1) | Comparative Analysis | Low | High | Medium | Energy Efficiency |
| ROH | Processing Cost | Ratio (0–1) | Comparative Analysis | Medium | Medium | High | Operating Cost |
| FTI | Recovery Success Rate | Ratio (0–1) | Comparative Analysis | High | High | Medium | Fault Tolerance |
| NFR | Node Failures | Percentage (0–100) | Comparative Analysis | Medium | Medium | High | Fault Tolerance |
| RFR | Route Failures | Percentage (0–100) | Comparative Analysis | Medium | Medium | High | Fault Tolerance |
| CSR | Cluster Operational Duration | Ratio (0–1) | Comparative Analysis | High | High | Medium | Network Lifetime |
Conundrum matrix evaluation for performance indices.
4.2 Simulation specifications
Simulations were carried out with the aid of MATLAB and OMNET++ while key settings/specifications adopted for the simulation experiment are as shown in Table 4. Other network design parameters are based on specifications in (Alanezi et al., 2022b).
TABLE 4
| Symbol | Denotation | Value |
|---|---|---|
| SN-DEP | Number of Distributed SNs | 250 |
| LF-NS | Dimension of LF Network | 2000 m × 2000 m |
| PKS | Packet Unit | 500 bytes |
| ETAX TL | Tuning Levels for ETAX | 8 |
| Etot | Initial Energy | 2 J |
| Eidle | Energy for Idling | 0.2 μJ |
| Eagg | Accumulation Energy | 5 pJ/bit |
| EEC | Energy Consumed by Circuitry | 5 nJ/bit |
| CTRmax | Maximum Reach for Transmission | 250 m |
| Α | Path Attenuation Factor | 2.5 |
| SN-RS | Receiver Sensitivity | −95 dBm |
| MS-ALT | Maximum UAV Altitude | 230 m |
| MS-V | Velocity of UAV | 20 m/s |
| MS-SR | Signaling Period for UAV | 2 s |
| MS-TD | UAV Trip Length | 960 s |
| AVG-STAT | Number of Statistical Averages | 50 |
Simulation specifications.
4.3 Time complexity
In the proposed RUBER scheme, and nearest neighbor relative distance costs are computed for each SN in order to implement fault-tolerant cluster-based data transmission. It logically follows that for the worst-case scenario, each SN will have to be processed N-1 times for electability to become HCL while N-1 HCL-to-MS link configurations need to be tested for stimulus collection. Therefore, this shows that RUBER has time complexity and processing cost of Θ(N) which is relatively higher than the complexity (Θ(1)) of UBER. This relatively high processing cost is a tradeoff of the proposed RUBER scheme which will be addressed in future research work.
4.4 Performance Evaluation
4.4.1 Assessment of RUBER performance
In order to analyze the variations in failure rate with respect to LBR, PDR, FDR, and FRR on RUBER performance, experimental cases of low failure (10%), medium failure (35%), and high failure (65%) rates were systematically tested with the aid of simulation.
4.4.2 Effect of Failure Rate on Load Balancing Ratio (LBR)
With reference to Figure 6, a higher LBR value (LBR ≥0.5) is desired as this signifies the rotation of transmission burden and ensuing degradation of Ersd are equalized for all SNs and not skewed towards specific set of network elements (e.g., HCLs). Observation: The simulation yielded an average LBR of 0.6277, 0.4319 and 0.2216 for the low, medium and high failure rate scenarios for the indicated period of network operation. Interpretation: With respect to the hypothesis (i.e., if the failure increases, the capacity of the network to balance traffic reduces), the findings of this research reveal that the network was able to successfully distribute traffic among 62.77% of the SNs when the failure rate is kept low (i.e., at 10%). This capacity of the network to successfully balance traffic among the SNs dropped to 43.19% and 22.16% when the failure rates are increased to 35% and 65% respectively. This means that a low-failure rate network yields LBR gains of 31.19% and 64.68% over medium- and high-failure rate networks, respectively. Justification: The technical justification for the obtained results is that energy loss and dynamic load factor (Gi) of SNx proportionally increase with the number of adjacent SNs directly connected to SNx at instance i. Implication: The implication of this in the context of smart wireless livestock sensor network is that an increased failure rate will lead to imbalanced load (i.e., unfavorably high concentration and distribution of traffic to specific HCLs for prolonged period of network operation) and relatively higher energy loss which shortens network lifetime and disrupts real-time monitoring of livestock stimulus for a desirably longer period. Figure 6 results underscore the importance of operating the network with an appropriate failure rate on LBR performance.
FIGURE 6

Effect of failure rate on load balancing ratio.
4.4.3 Effect of Failure Rate on Packet Delivery Ratio (PDR)
With respect to Figure 7, a higher PDR value (PDR ≥0.5) is desired as this implies more packets are successfully transmitted and received through the HCM-to-HCL and HCL-to-MS transmission links. Observation: The simulation yielded an average PDR of 0.5473, 0.3835 and 0.2148 for the low, medium and high failure rate scenarios for the duration of network operation. Interpretation: With respect to the working hypothesis (i.e., if the failure rate increases, the capacity of the network to deliver packets reduces), the findings of this research demonstrate that the network was able to successfully deliver 54.73% of packets (at first trial without retransmission) when the failure rate is kept low (i.e., at 10%). This packet delivery capacity dropped to 38.35% and 21.48% when the failure rates were increased to 35% and 65% respectively. This means that a low-failure rate network results in PDR improvements of 29.92% and 60.74% over medium- and high-failure rate networks, respectively. Justification: The reason for this is that operating the network at relatively higher failure rates (≥35%) results in frequent packet drops, connectivity loss, and high retransmission rates. Implication: The implication of this in the context of livestock monitoring applications is that an increased failure rate will negatively affect the time-synchronization, quality, and integrity of captured livestock stimulus which makes it difficult to carry out timely control/corrective operations based on the detected stimulus. Figure 7 results emphasize the significance of running the network with a suitable failure rate on PDR performance.
FIGURE 7

Effect of failure rate on packet delivery ratio.
4.4.4 Effect of Failure Rate on Failure Detection Ratio (FDR)
Regarding Figure 8, a low FDR value (FDR ≤0.4) is desired as this indicates the frequency of detected/reported faults in the network. A low FDR is a reliably good indicator of a healthy network. Observation: The simulation yielded an average FDR of 0.2525, 0.4903 and 0.6469 for the low, medium, and high failure rate scenarios over the indicated network operation period. Interpretation: With respect to the underlying hypothesis (i.e., higher failure cases will occur and be detected if the network is operated with relatively higher failure rates), the findings of this research show that the network reported 25.25% cases of failure when the failure rate is kept low (i.e., at 10%). The occurrence and cases of failure detected increased to 49.03% and 64.69% when the failure rates were increased to 35% and 65% respectively. This means that a low-failure rate network records FDR gains of 48.49% and 60.96% over medium- and high-failure rate networks, respectively. Justification: The technical reason for this is that running the network with relatively high failure rates (≥35%) leads to high processing overheads (due to excessive handshaking, recurrent exchange of control packets, failure to resolve path to HCL, looping) which introduces more faults into the network and worsens the efficiency of the failure detection and recycling process. Implication: The implication of this in the context of livestock monitoring is that operating the network with high failure rates will lead to network breakdown as a result of the high cases of node and route faults. Figure 8 results underline the influence of designing the network with suitable failure rate on FDR performance.
FIGURE 8

Effect of failure rate on failure detection ratio.
4.4.5 Effect of Failure Rate on Failure Recovery Ratio (FRR)
With regard to Figure 9, a high FRR value (FRR ≥0.5) is desired as this reflects the rate of the network to successfully repair and recover from SN and route failures. A high FRR is a strong indicator of a resilient network. Observation: The simulation yielded an average FRR of 0.6969, 0.3014 and 0.1802 for the low, medium and high failure rate scenarios for the network operation duration. Interpretation: With respect to the fundamental proposition (i.e., if the failure rate increases, the capacity of the network to recover from failure reduces), the findings of this research reveal that the network was able to successfully exhibit 69.69% failure recovery when the failure rate is kept low (i.e., at 10%). This failure recovery capacity dropped to 30.14% and 18.02% when the failure rates were increased to 35% and 65% respectively. This means that a low-failure rate network results in FRR gains of 56.75% and 74.14% over medium- and high-failure rate networks, respectively. Justification: The justification for this is that operating the network with relatively high failure rates (≥35%) introduces more faults (especially from completely dead HCs and SNs surrounded/isolated by dead neighbors) into the network and significantly reduces the failure recovery process. Implication: The implication of this in the context of livestock monitoring applications is that operating the network with high failure rates disrupts real-time gathering of livestock stimulus as a result of undesirably long network response time. Figure 9 results underline the influence of employing suitable MS altitude on FRR performance.
FIGURE 9

Effect of failure rate on failure recovery ratio.
Table 5 sums up RUBER performance assessment results for different failure rates.
TABLE 5
| % Gain of Low Over | ||
|---|---|---|
| Index | Medium (%) | High (%) |
| LBR | 31.19 | 64.68 |
| PDR | 29.92 | 60.74 |
| FDR | 48.49 | 60.96 |
| FRR | 56.75 | 74.14 |
Précis of RUBER performance with failure rate variations.
4.5 Performance comparison of RUBER
For the purpose of performance comparison, UBER and HYBRID routing schemes are selected for benchmarking against RUBER.
4.5.1 Evaluation of average routing delay (ARD) performance
Figure 10 shows the comparative plot of ARD for RUBER against UBER and HYBRID. Observation and Interpretation: With respect to the operational hypothesis (i.e., if the time trends for data traffic are analyzed for the proposed scheme against the benchmarked schemes under similar network conditions, higher transmission delays will be observed for the benchmarked schemes), the findings of this research demonstrated that RUBER exhibited lesser average routing delay with 32.74% and 79.67% improvements over UBER and HYBRID, respectively. Justification and Implication: These performance improvements are technically justified by the delay prevention components (FIFO transmission scheduling, imposing retransmission limit, maintaining transmission window, flexible/alternative route formation for inter-cluster communication, adaptive MS-assisted intra-cluster communication) of the adopted route maintenance strategy. The implication of this in the context of smart wireless livestock sensor network applications is the capacity to perform seamless real-time monitoring and execute timely control/corrective operations with the incorporation of the RUBER scheme.
FIGURE 10

Average routing delay performance.
4.5.2 Evaluation of energy dissipation ratio (EDR) performance
Figure 11 provides the comparative plot of EDR for RUBER with respect to UBER and HYBRID. Observation and Interpretation: With relation to the working proposition (i.e., if the energy consumption trends for the network are analyzed for the proposed scheme against the benchmarked schemes under similar network conditions, higher energy costs will be observed for the benchmarked schemes), the findings of this research revealed that RUBER exhibited lower energy dissipation ratio by yielding improvements of 10.43% and 44.98% over UBER and HYBRID, respectively. Justification and Implication: These performance enhancements are due to the energy conservation components (utilization of load balancing condition, dynamic/linearized thresholding, simplified EMP for fault-tolerant routing) of the employed energy consumption model. The implication of this in the context of livestock monitoring is the capacity to conserve scarce energy resources and prolong network operational lifetime with the adoption of the RUBER scheme.
FIGURE 11

Energy dissipation ratio performance.
4.5.3 Evaluation of routing overhead (ROH) performance
Figure 12 depicts the comparative plot of ROH for RUBER compared to UBER and HYBRID. Observation and Interpretation: In connection with the working hypothesis (i.e., if the packet processing time trends prior to actual data transmission are analyzed for the proposed scheme against the benchmarked schemes under similar network conditions, higher routing overheads will be observed for the benchmarked schemes), the findings of this research demonstrated that RUBER displayed lower ROH by giving improvements of 39.08% and 67.88% over UBER and HYBRID, respectively. Justification and Implication: The technical justification for these performance improvements are due to the employment of shorter (least distance cost) alternative routes for data transmission, rapid HCL-to-MS communication, relatively reduced cost of ACK handshaking, rapid path resolution, and quicker route reconstruction. The implication of this in the context of smart livestock monitoring is the capacity of the network to favorably display faster response time and rapid execution of network operations with the integration of the RUBER scheme.
FIGURE 12

Routing overhead performance.
4.5.4 Evaluation of fault tolerance index (FTI) performance
Figure 13 provides the comparative plot of FTI for RUBER with respect to UBER and HYBRID. Observation and Interpretation: With relation to the underlying hypothesis (i.e., if the rates of successful recovery from failures are analyzed for the proposed scheme against the benchmarked schemes under similar network conditions, lesser tolerance and recovery from faults will be observed for the benchmarked schemes), the findings of this research revealed that RUBER exhibited higher FTI by recording gains of 55.73% and 74.90% over UBER and HYBRID, respectively. Justification and Implication: These performance gains for RUBER are due to the fact that failure detection and recycling process are intrinsically carried out on the basis of relative distance cost and residual energy. Another reason for the improved FTI of RUBER is the setting of Q constant (practical/manageable limit on the number of backup routes) which makes it possible to achieve rapid and seamless repair and recovery process. The implication of this in the context of livestock monitoring is the capacity of the network to practically exhibit resilience, robustness and rapid recovery from faults with the adoption of the RUBER scheme.
FIGURE 13

Fault tolerance index performance.
4.5.5 Evaluation of nodal failure recovered (NFR) performance
Figure 14 shows the comparative plot of NFR for RUBER against UBER and HYBRID. Observation and Interpretation: With regard to the fundamental proposition (i.e., if the number of recovered cases from nodal failures is analyzed for the proposed scheme against the benchmarked schemes under similar network conditions, lesser recovery from nodal failures will be observed for the benchmarked schemes), the findings of this research displayed that RUBER recorded higher NFR by showing improvements of 44.93% and 52.20% over UBER and HYBRID, respectively. Justification and Implication: The technical justifications for these performance improvements are due to the effective SN fault recovery mechanism, recycling process (for SN reuse and significant SN failure cases reduction), and dynamic HCL-assisted cluster membership process that ensures resilient end-to-end communication with reduced SN failures. The implication of this in the context of livestock monitoring applications is that with the incorporation of the RUBER scheme, the ability of the network to timely detect, backup and resolve node faults is improved without constituting significant interruption of data transmission.
FIGURE 14

Nodal failure recovered performance.
4.5.6 Evaluation of route failure recovered (RFR) performance
Figure 15 provides the comparative plot of RFR for RUBER with respect to UBER and HYBRID. Observation and Interpretation: With respect to the working hypothesis (i.e., if the number of recovered cases from route failures is analyzed for the proposed scheme against the benchmarked schemes under similar network conditions, lesser recovery from route failures will be observed for the benchmarked schemes), the findings of this research demonstrated that RUBER exhibited higher RFR by recording gains of 53.22% and 70.56% over UBER and HYBRID, respectively. Justification and Implication: These performance gains are due to the effective route failure recovery mechanism, MS-based network (intra-cluster connectivity chain) monitoring, and dynamic HCL-assisted enlisting process that ensures robust end-to-end transmission with reduced route failures. The implication of this in the context of smart livestock monitoring applications is that with the integration of the RUBER scheme, the capacity of the network to quickly identify, repair and backup link faults is enhanced without resulting to significant disruption in data transmission.
FIGURE 15

Route failure recovered performance.
4.5.7 Evaluation of cluster survival ratio (CSR) performance
Figure 16 depicts the comparative plot of CSR for RUBER in comparison to UBER and HYBRID. Observation and Interpretation: With reference to the fundamental hypothesis (i.e., if the cluster operational duration trends are analyzed for the proposed scheme against the benchmarked schemes under similar network conditions, lesser cluster survival duration will be observed for the benchmarked schemes), the findings of this research revealed that RUBER displayed higher CSR by 19.26% and 52.52% improvements over UBER and HYBRID, respectively. Justification and Implication: The technical justifications for these performance improvements are the distributed (inter-cluster, intra-cluster, cluster-to-MS) multi-hop data transmission, energy-efficient route maintenance strategy, effective repair, and recovery procedures. The implication of this in the context of smart wireless livestock sensor network applications is the capacity of the network to effectively manage cluster-based transmissions and prolong cluster lifetime with the incorporation of the RUBER scheme.
FIGURE 16

Cluster survival ratio performance.
Table 6 outlines RUBER’s performance comparison with UBER and HYBRID.
TABLE 6
| Metric | UBER (%) | Hybrid (%) |
|---|---|---|
| ARD | 32.74 | 79.67 |
| EDR | 10.43 | 44.98 |
| ROH | 39.08 | 67.88 |
| FTI | 55.73 | 74.90 |
| NFR | 44.93 | 52.20 |
| RFR | 53.22 | 70.56 |
| CSR | 19.26 | 52.52 |
Précis of RUBER’s performance comparison results.
5 Conclusion
This paper addresses sensor node and route failure issues for smart wireless livestock sensor networks by developing a recoverable UAV-based energy-efficient reconfigurable routing (RUBER) scheme. RUBER scheme relies on an efficient fault detection and recycling technique, dynamic recovery mechanism, and robust route maintenance technique for the running of an integrated heterogenous network. Performance-based experiments were conducted with MATLAB and OMNET++ simulations. Performance of RUBER was analyzed under low, medium and high failure rate conditions. Simulation results demonstrated that running a low-failure rate network yielded significant performance improvements with respect to failure detection ratio, failure recovery ratio, load balancing ratio, and packet delivery ratio. Performance comparison of RUBER was conducted against UBER and HYBRID schemes. With respect to best-case values, RUBER exhibited marked performance gains in terms of average routing delay, energy dissipation ratio, routing overhead, fault tolerance index, nodal failure recovered, route failure recovered, and cluster survival ratio. Results obtained revealed the relative competitiveness of the RUBER scheme against the benchmarked schemes.
6 Future research works
Future research efforts in this project will focus on the development and deployment of an integrated UAV-WSN testbed for livestock monitoring applications distributed for experimental use in the campus of University of Hafr Al Batin. This will facilitate systematic performance evaluation and comparative assessment of actual field measurements with the obtained simulation results. Furthermore, the identified time complexity and processing cost issues of RUBER will be addressed in an upcoming research article by designing a time-aware cost-effective CBR scheme.
Statements
Data availability statement
The original contributions presented in the study are included in the article/supplementary material, further inquiries can be directed to the corresponding author.
Author contributions
Conceptualization, AS and YS; methodology, AS, YS and HB; software, AS; validation, YS and HB.; formal analysis, YS; investigation, AS.; resources, AS and YS; writing—original draft preparation, MA, AS, YS, HB, and MK; writing—review and editing, MA, AS, YS, HB, and MK; visualization, YS; supervision, HB and MA; project administration, MA; funding acquisition, MA. All authors have read and agreed to the published version of the manuscript.
Funding
This research was funded by Deputyship for Research and Innovation, Ministry of Education in Saudi Arabia, grant number IFP-A-201-2-1.
Conflict of interest
The authors declare that the research was conducted in the absence of any commercial or financial relationships that could be construed as a potential conflict of interest.
Publisher’s note
All claims expressed in this article are solely those of the authors and do not necessarily represent those of their affiliated organizations, or those of the publisher, the editors and the reviewers. Any product that may be evaluated in this article, or claim that may be made by its manufacturer, is not guaranteed or endorsed by the publisher.
References
1
AfriantoI.WahjuniS.DjatnaT. (2020). “Model of ubiquitous precision livestock system 4.0: A technological review,” in Proceedings of the 2nd Faculty of Industrial Technology International Congress FoITIC, Bandung, Indonesia, January 2020, 156–162. Available: https://eproceeding.itenas.ac.id/index.php/foitic/article/view/74 (Accessed Apr. 25, 2022).
2
AlaneziM. A.SalamiA. F.Sha’abanY. A.BouchekaraH. R. E. H.ShahriarM. S.KhodjaM.et al (2022)., 22. Sensors, 6158. 10.3390/s22166158Uber: UAV-based energy-efficient reconfigurable routing scheme for smart wireless livestock sensor networkSensors (Basel).
3
AlaneziM. A.ShahriarM. S.HasanM. B.AhmedS.Sha’abanY. A.BouchekaraH. R. E. H. (2022). Livestock management with unmanned aerial Vehicles: A review. IEEE Access10, 45001–45028. 10.1109/ACCESS.2022.3168295
4
AsmaaE.SaidR.LahoucineK. (2016). “Review of recovery techniques to recapture lost targets in wireless sensor networks,” in Proceedings of the 2nd IEEE International Conference on Electrical and Information Technologies (ICEIT), 04-07 May 2016, Tangiers, Morocco, 1–6. 10.1109/eitech.2016.7519591
5
AstakhovaT. (2020). “Research on the energy characteristics of routing in wireless sensor networks,” in Proceedings of the CEUR Workshop Proceedings. [Online]. Available: http://ceur-ws.org/Vol-2590/short15.pdf (Accessed Apr. 20, 2022).
6
BandyopadhyayS.CoyleE. J. (2003). “An energy efficient hierarchical clustering algorithm for wireless sensor networks,” in Proceedings of the IEEE INFOCOM 2003 - Twenty-second Annual Joint Conference of the IEEE Computer and Communications Societies, 30 Mar. 2003-03 Mar. 2003, San Francisco, CA, USA, 1713–1723. 10.1109/INFCOM.2003.1209194
7
BarbedoJ. G. A.KoenigkanL. V. (2018). Perspectives on the use of unmanned aerial systems to monitor cattle. Outlook Agric.47 (3), 214–222. 10.1177/0030727018781876
8
BarriusoA.Villarrubia GonzálezG.De PazJ.LozanoÁ.BajoJ. (2018). Combination of multi-agent systems and wireless sensor networks for the monitoring of cattle. Sensors18 (2), 108. 10.3390/s18010108
9
BeheraT. M.MohapatraS. K.SamalU. C.KhanM. S. (2019). Hybrid heterogeneous routing scheme for improved network performance in WSNs for animal tracking. Internet Things6, 100047. 10.1016/j.iot.2019.03.001
10
BehjatiM.Mohd NohA. B.AlobaidyH. A. H.ZulkifleyM. A.NordinR.AbdullahN. F. (2021). LoRa communications as an enabler for Internet of drones towards large-scale livestock monitoring in rural farms. Sensors21 (15), 5044. 10.3390/s21155044
11
Bello-SalauH.SalamiA. F.AnwarF.AibinuA. M. (2011). “Evaluation of radio propagation techniques for hierarchical sensor networks,” in Proceedings of the 4th IEEE International Conference on Mechatronics (ICOM), Kuala Lumpur, Malaysia, 001–005.
12
Bello-SalauH.SalamiA. F.AnwarF.IslamM. R. (2011). Analysis of radio model performance for clustering sensor networks. Sensors Transducers128 (5), 27–38.
13
BoursianisA. D.PapadopoulouM. S.DiamantoulakisP.Liopa-TsakalidiA.BarouchasP.SalahasG.et al (2020). Internet of Things (IoT) and agricultural unmanned aerial Vehicles (UAVs) in smart farming: A comprehensive review. Internet Things18, 100187. 10.1016/j.iot.2020.100187
14
CasasR.HermosaA.MarcoÁ.BlancoT.Zarazaga-SoriaF. J. (2021). Real-time extensive livestock monitoring using LPWAN smart wearable and infrastructure. Appl. Sci.11 (3), 1240. 10.3390/app11031240
15
ChabotD.BirdD. M. (2015). Wildlife research and management methods in the 21st century: Where do unmanned aircraft fit in?J. Unmanned Veh. Syst.3 (4), 137–155. 10.1139/juvs-2015-0021
16
ChamosoP.RaveaneW.ParraV.GonzálezA. (2014). UAVs applied to the counting and monitoring of animals. Ambient Intell. - Softw. Appl., 291, 71–80. 10.1007/978-3-319-07596-9_8
17
DingP.HollidayJ.CelikA. (2005). Distributed energy-efficient hierarchical clustering for wireless sensor networks. Distributed Comput. Sens. Syst., 3560, 322–339. 10.1007/11502593_25
18
FreedT.CarsonV. C.DoerrK. H. (2021). Optimizing a RFID-UAV cattle search tour. Int. J. RF Technol.11 (2), 127–141. 10.3233/rft-180163
19
FrihaO.FerragM. A.ShuL.MaglarasL.WangX. (2021). Internet of Things for the future of smart agriculture: A comprehensive survey of emerging technologies. IEEE/CAA J. Autom. Sin.8 (4), 718–752. 10.1109/JAS.2021.1003925
20
FriisH. T. (1946). A note on a simple transmission formula. Proc. IRE34 (5), 254–256. 10.1109/jrproc.1946.234568
21
GnanasekeraM.KatupitiyaJ.SavkinA. V.De SilvaA. H. T. E. (2021). A range-based algorithm for autonomous navigation of an aerial drone to approach and follow a herd of cattle. Sensors21 (21), 7218. 10.3390/s21217218
22
GrayJ.BanhaziT. M.KistA. A. (2017). Wireless data management system for environmental monitoring in livestock buildings. Inf. Process. Agric.4 (1), 1–17. 10.1016/j.inpa.2016.12.001
23
HeinzelmanW. B.ChandrakasanA. P.BalakrishnanH. (2002). An application-specific protocol architecture for wireless microsensor networks. IEEE Trans. Wirel. Commun.1 (4), 660–670. 10.1109/twc.2002.804190
24
HeinzelmanW. R.ChandrakasanA.BalakrishnanH. (2000). “Energy-efficient communication protocol for wireless microsensor networks,” in Proceedings of the 33rd Annual Hawaii International Conference on System Sciences, Maui, HI, USA, Jan. 01 2020, 1–10. 10.1109/HICSS.2000.926982
25
HuJ.TurgutA. E.KrajnikT.LennoxB.ArvinF. (2022). Occlusion-based coordination protocol design for autonomous robotic shepherding tasks. IEEE Trans. Cogn. Dev. Syst.14 (1), 126–135. 10.1109/TCDS.2020.3018549
26
HuangH.WuJ. (2005). “A probabilistic clustering algorithm in wireless sensor networks,” in Proceedings of the VTC-2005-Fall - 2005 IEEE 62nd Vehicular Technology Conference, 28-28 Sep. 2005, Dallas, TX, USA, 1796–1798. 10.1109/VETECF.2005.1558414
27
HuangR.MaL.ZhaiG.HeJ.ChuX.YanH. (2020). Resilient routing mechanism for wireless sensor networks with deep learning link reliability prediction. IEEE Access8, 64857–64872. 10.1109/access.2020.2984593
28
IEEE (2020). IEEE standard for low-rate wireless networks. IEEE Std 802.15.4-2020 Revis. IEEE Std 802.15.4-2015), 1–800. 10.1109/IEEESTD.2020.9144691
29
KakamoukasG.SariciannidisP.LivanosG.ZervakisM.RamnalisD.PolychronosV.et al (2019). “A multi-collective, IoT-enabled, adaptive smart farming architecture,” in Proceedings of the 2019 IEEE International Conference on Imaging Systems and Techniques (IST), 09-10 Dec. 2019, Abu Dhabi, United Arab Emirates, 1–6. 10.1109/IST48021.2019.9010236
30
LiX.HuangH.SavkinA. V.ZhangJ. (2022). Robotic herding of farm animals using a network of barking aerial drones. Drones629 (2), 29–22. 10.3390/drones6020029
31
LinC.HanG.QiX.DuJ.XuT.Martínez-GarcíaM. (2021). Energy-optimal data collection for unmanned aerial vehicle-aided industrial wireless sensor network-based agricultural monitoring system: A clustering compressed sampling approach. IEEE Trans. Ind. Inf.17 (6), 4411–4420. 10.1109/TII.2020.3027840
32
LongN. K.SammutK.SgariotoD.GarrattM.AbbassH. A. (2020). A comprehensive review of shepherding as a bio-inspired swarm-robotics guidance approach. IEEE Trans. Emerg. Top. Comput. Intell.4 (4), 523–537. 10.1109/TETCI.2020.2992778
33
LotfinezhadM.LiangB. (2005). “Energy efficient clustering in sensor networks with mobile agents,” in Proceedings of the IEEE Wireless Communications and Networking Conference, 13-17 Mar. 2005, New Orleans, LA, USA, 1872–1877. 10.1109/WCNC.2005.1424797
34
LoukatosD.ArvanitisK. G. (2021). Multi-modal sensor nodes in experimental scalable agricultural IoT application scenarios. IoT-based Intelligent Model. Environ. Ecol. Eng., 67, 101–128. 10.1007/978-3-030-71172-6_5
35
LoukatosD.FragkosA.ArvanitisK. G. (2022). Experimental performance evaluation techniques of LoRa radio modules and exploitation for agricultural use. Springer Optim. Its Appl.182, 101–120. 10.1007/978-3-030-84144-7_4
36
MistryC.GhoshA.BiswasM.BaguiB.BasakA. (2022). Applications of Internet of Things and unmanned aerial Vehicle in smart agriculture: A review. OSF Prepr., 1–18. 10.31219/osf.io/fmgtw
37
MudziwepasiS. K.ScottM. S. (2014). “Assessment of a wireless sensor network based monitoring tool for zero effort technologies: A cattle-health and movement monitoring test case,” in Proceedings of the IEEE 6th International Conference on Adaptive Science & Technology (ICAST), Ota, Nigeria, 29-31 Oct. 2014. 10.1109/icastech.2014.7068068
38
MukhamedievR. I.SymagulovA.KuchinY.ZaitsevaE.BekbotayevaA.YakuninK.et al (2021). Review of some applications of unmanned aerial Vehicles Technology in the resource-rich country. Appl. Sci.11 (21). 10.3390/app112110171
39
NeethirajanS. (2017). Recent advances in wearable sensors for animal health management. Sens. Bio-Sensing Res.12, 15–29. 10.1016/j.sbsr.2016.11.004
40
NiteshK.AzharuddinM.JanaP. K. (2017). A novel approach for designing delay efficient path for mobile sink in wireless sensor networks. Wirel. Netw.24 (7), 2337–2356. 10.1007/s11276-017-1477-2
41
PajaresG. (2015). Overview and current status of remote sensing applications based on unmanned aerial Vehicles (UAVs). Photogramm. Eng. Remote Sens.81 (4), 281–330. 10.14358/pers.81.4.281
42
PetrovaT.PetrovZ. (2021). Analysis of efficiency of the unmanned aerial Vehicles use in contemporary agrotechnologies. Int. J. Inf. Technol. Secur.13 (4), 25–34. Available: https://ijits-bg.com/contents/IJITS-2021-No4/2021-N4-03.pdf (Accessed Apr. 24, 2022).
43
QuocD. N.LiuN.GuoD. (2022). A hybrid fault-tolerant routing based on Gaussian network for wireless sensor network. J. Commun. Netw.24 (1), 37–46. 10.23919/JCN.2021.000028
44
RahmatizadehR.KhanS. A.JayasumanaA. P.TurgutD.BölöniL. (2014). “Routing towards a mobile sink using virtual coordinates in a wireless sensor network,” in Proceedings of the 2014 IEEE International Conference on Communications (ICC), 10-14 Jun. 2014, Sydney, NSW, Australia, 12–17. 10.1109/ICC.2014.6883287
45
RivasA.ChamosoP.González-BrionesA.CorchadoJ. M. (2018). Detection of cattle using drones and convolutional neural networks. Sensors18 (7). 10.3390/s18072048
46
SalamiA. F.AnwarF.AibinuA. M.Bello-SalauH.AbdallaA. H. (2011). “Investigative analysis of clustering routing protocols for scalable sensor networks,” in Proceedings of the 4th IEEE International Conference on Mechatronics (ICOM), Kuala Lumpur, Malaysia, 17-19 May 2011, 011–015.
47
SalamiA. F.AnwarF.PriantoroA. U. (2009). An investigation into clustering routing protocols for wireless sensor networks. Sensors Transducers106 (7), 48–61.
48
SalamiA. F.BariS. M. S.AnwarF.KhanS. (2010). “Feasibility analysis of clustering routing protocols for multipurpose sensor networking,” in Proceedings of the 2nd International Conference on Multimedia and Computational Intelligence (ICMCI), Shanghai, China, 432–435.
49
SharmaB.KoundalD. (2018). Cattle health monitoring system using wireless sensor network: A survey from innovation perspective. IET Wirel. Sens. Syst.8 (4), 143–151. 10.1049/iet-wss.2017.0060
50
SivakumarR.SinhaP.BharghavanV. (1999). Cedar: A core-extraction distributed ad hoc routing algorithm. IEEE J. Sel. Areas Commun.17 (8), 1454–1465. 10.1109/49.779926
51
SymeonakiE.ArvanitisK. G.PiromalisD.TselesD.BalafoutisA. T. (2022). Ontology-based IoT middleware approach for smart livestock farming toward agriculture 4.0: A case study for controlling thermal environment in a pig facility. Agronomy12 (3). 10.3390/agronomy12030750
52
Texas Instruments “2.4 GHz IEEE 802.15.4/ZigBee-ready RF transceiver applications.” Accessed: Apr. 21, 2022. Available: https://www.ti.com/product/CC2420.
53
XiangT.-Z.XiaG.-S.ZhangL. (2019). Mini-Unmanned aerial vehicle-based remote sensing: Techniques, applications, and prospects. IEEE Geosci. Remote Sens. Mag.7 (3), 29–63. 10.1109/MGRS.2019.2918840
54
XuJ.SolmazG.RahmatizadehR.TurgutD.BoloniL., “Internet of Things applications: Animal monitoring with unmanned aerial Vehicle,” 2016, Accessed: Apr. 25, 2022. [Online]. arXiv:1610.05287 [cs], Available: https://arxiv.org/abs/1610.05287.
55
YaxleyK. J.JoinerK. F.AbbassH. (2021). Drone approach parameters leading to lower stress sheep flocking and movement: Sky shepherding. Sci. Rep.11 (1), 7803–7809. 10.1038/s41598-021-87453-y
56
YueY.CaoL.HangB.LuoZ. (2018). A swarm intelligence algorithm for routing recovery strategy in wireless sensor networks with mobile sink. IEEE Access6, 67434–67445. 10.1109/ACCESS.2018.2879364
57
ZhangZ.MehmoodA.ShuL.HuoZ.ZhangY.MukherjeeM. (2018). A survey on fault diagnosis in wireless sensor networks. IEEE Access6, 11349–11364. 10.1109/access.2018.2794519
Summary
Keywords
failure recovery, herd cluster-based routing, fault tolerance, unmanned aerial vehicle, wireless livestock sensor network
Citation
Alanezi MA, Salami AF, Sha’aban YA and Bouchekara HREH (2022) RUBER: Recoverable UAV-based energy-efficient reconfigurable routing scheme for smart wireless livestock sensor network. Front. Energy Res. 10:975614. doi: 10.3389/fenrg.2022.975614
Received
22 June 2022
Accepted
21 July 2022
Published
20 October 2022
Volume
10 - 2022
Edited by
Haris M. Khalid, Higher Colleges of Technology, United Arab Emirates
Reviewed by
Konstantinos G. Arvanitis, Agricultural University of Athens, Greece
Neeraj Kumar Singh, Larsen & Toubro, India
Updates
Copyright
© 2022 Alanezi, Salami, Sha’aban and Bouchekara.
This is an open-access article distributed under the terms of the Creative Commons Attribution License (CC BY). The use, distribution or reproduction in other forums is permitted, provided the original author(s) and the copyright owner(s) are credited and that the original publication in this journal is cited, in accordance with accepted academic practice. No use, distribution or reproduction is permitted which does not comply with these terms.
*Correspondence: Houssem R. E. H. Bouchekara, bouchekara.houssem@gmail.com
This article was submitted to Advanced Clean Fuel Technologies, a section of the journal Frontiers in Energy Research
Disclaimer
All claims expressed in this article are solely those of the authors and do not necessarily represent those of their affiliated organizations, or those of the publisher, the editors and the reviewers. Any product that may be evaluated in this article or claim that may be made by its manufacturer is not guaranteed or endorsed by the publisher.