 Qi Liu
 Marcelo D. Benitez
 Zhao Xia
 J. Carlos Santamarina
- KAUST King Abdullah University of Science and Technology, Thuwal, Saudi Arabia
The injection of CO2 into geological formations triggers inherently coupled thermo-hydro-chemo-mechanical processes. The reservoir pressure and temperature determine the CO2 density, the CO2-water interfacial tension, and the solubility of CO2 in water (hindered by salts and competing gases). The CO2-water interface experiences marked pinning onto mineral surfaces, and contact angles can range from the asymptotic advancing to receding values, in contrast to the single contact angle predicted by Young’s equation. CO2 dissolves in water to form carbonic acid and the acidified water dissolves minerals; mineral dissolution enhances porosity and permeability, triggers settlement, may couple with advection to form “wormholes”, produces stress changes and may cause block sliding and shear bands. Convective currents can emerge beneath the CO2 plume and sustain CO2 and mineral dissolution processes. On the other hand, mineralization is a self-homogenizing process in advective regimes. The crystallization pressure can exceed the tensile capacity of the host rock and create new surfaces or form grain-displacive lenses. Within the rock matrix, coupled reactive-diffusion-precipitation results in periodic precipitation bands. Adequate seal rocks for CO2 geological storage must be able to sustain the excess capillary pressure in the buoyant CO2 plume without experiencing open-mode discontinuities or weakening physico-chemical interactions. CO2 injection into depleted oil reservoirs benefits from time-proven seals; in addition, CO2 can mobilize residual oil to simultaneously recover additional oil through oil swelling, ganglia destabilization, the reduction in oil viscosity and even miscible displacement. Rapid CO2 depressurization near the injection well causes cooling under most anticipated reservoir conditions; cooling can trigger hydrate and ice formation, and reduce permeability. In some cases, effective stress changes associated with the injection pressure and cooling thermoelasticity can reactivate fractures. All forms of carbon geological storage will require large reservoir volumes to hold a meaningful fraction of the CO2 that will be emitted during the energy transition.
Introduction
We emit ∼40 billion tons of CO2 per year, however, emissions should decrease to ≤18 billion tons per year to prevent further global warming (IPCC, 2021). This scenario will require reduced fossil fuel consumption and CO2 capture and geological storage. Currently, the total capacity of operating CO2 storage facilities is 150 million tons/year (GCCSI, 2021), i.e., three orders of magnitude lower than needed. Therefore, thousands of new geological storage projects must come online in the near future.
The injection of CO2 into geological formations triggers inherently coupled thermo-hydro-chemo-mechanical processes. In this manuscript, we present a comprehensive review of the underlying physical processes, summarize the properties of bulk phases and interfaces, and analyze the most relevant pore-scale phenomena that can affect the long-term geological storage of CO2.
CO2 and aqueous solutions: Properties and interactions
Fluids involved in carbon geological storage exhibit different pressure and temperature-dependent bulk properties, solubilities and capillary response.
Density
The pressure and temperature-dependent CO2 density determines storage capacity, gravity-driven displacement, instabilities, and capillary pressure against the seal (Van der Meer, 1993; DiCarlo, 2013). Figure 1 shows the density ρ [kg/m3] of water, oil and CO2 as a function of pressure and temperature: the density of CO2 varies significantly but remains a buoyant phase, while water is the heavier fluid in high-temperature reservoirs.
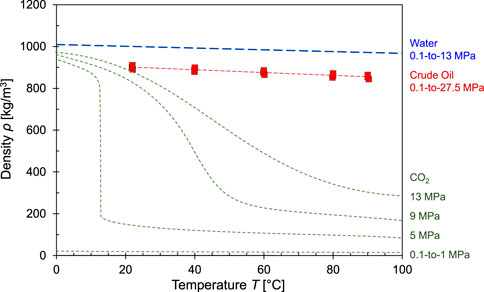
FIGURE 1. Density as a function of pressures and temperature: water, crude oil and CO2. Data sources: Karnanda et al., 2013, NIST Chemistry WebBook., 2022, Freund et al., 2006.
Geological storage projects can involve gas, liquid and supercritical CO2 (Figure 2). The gas-liquid phase boundary
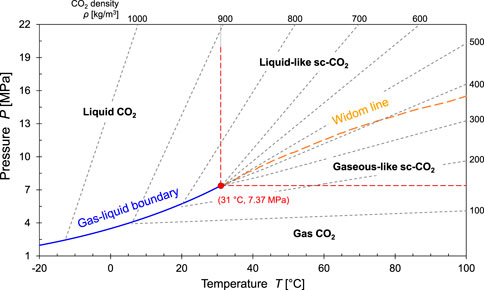
FIGURE 2. Carbon dioxide phase diagram. Note that there are marked changes across the Widom line within the supercritical regime. Data for density lines: Bachu., 2003.
Viscosity
Liquid CO2 and water are Newtonian fluids, yet most crude oils exhibit some shear thinning. Figure 3 shows the reduction in viscosity μ [μPa⋅s] with temperature for different types of crude oils, water and CO2 (Note: viscosity shown in log-scale). Molecular vibration acts against intermolecular attraction hence the viscosity of liquids decreases with higher temperature while pressure has a second-order effect. On the other hand, the viscosity of gases tends to increase with temperature and pressure because the collision frequency increases. The viscosity of CO2 is much lower than water and oil, and it experiences sharp changes across the liquid-gas LG phase boundary and the Widom line WL in agreement with density changes.
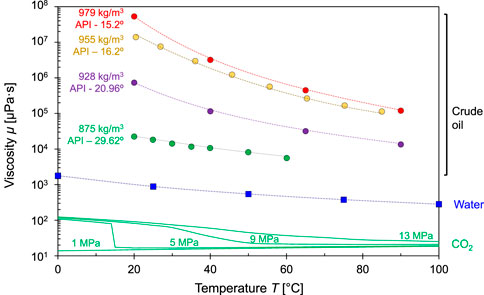
FIGURE 3. Viscosity as a function of temperature: various crude oils (●), water (■) and CO2 (continue lines - different pressures). Crude oils include heavy (density
Interfacial tension
Interfacial tension γ [mN/m] and contact angle θ [°] determine capillary phenomena between multiphase fluids in porous media. The capillary pressure ΔP is the pressure difference between the non-wetting Pnw [Pa] and the wetting Pw [Pa] fluid; for a spherical interface of radius r [m]
The interfacial tension between CO2 and water is reported as a function of pressure and temperature in most cases. However, intermolecular distance
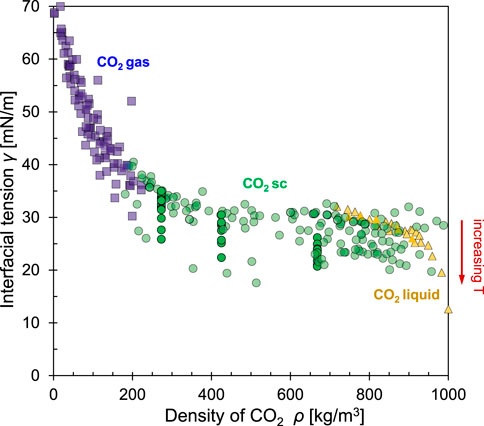
FIGURE 4. The interfacial tension between CO2 and water as a function of CO2 density. The dataset combines results for CO2 in gas (■), super critical (●) and liquid states (▲). Note: density determines molecular proximity for electrical interactions, thus, it emerges as the governing variable. Still, the data spread is due to thermal effects: interfacial tension decreases with increased random vibration. Data sources: Hough et al., 1952, Park et al., 2005, Sutjiadi-Sia et al., 2008, Chun and Wilkinson., 1995, Da Rocha et al., 1999, Hebach et al., 2002, Chiquet et al., 2007, Kvamme et al., 2007, Espinoza and Santamarina., 2010, Georgiadis et al., 2010, and measurements by the authors for this study (2022).
Wettability—contact angles
Wettability captures the interaction between two fluids and the mineral surface. Wettability plays a critical role in capillary phenomena, pore-scale fluid arrangement, and macroscopic multiphase flow in CO2 geological storage.
Contact angle measurements provide an apparently simple assessment of the otherwise complex physical processes that underline wettability (Sargent et al., 2005; Drelich et al., 2020). Force equilibrium parallel to the mineral surface relates the contact angle to the interfacial tensions γ [N/m] between the fluid F, liquid L and solid S (Young, 1805):
On the other hand, force equilibrium normal to the substrate surface allows us to anticipate the adhesion A [N/m] between the liquid-fluid interface and the mineral substrate
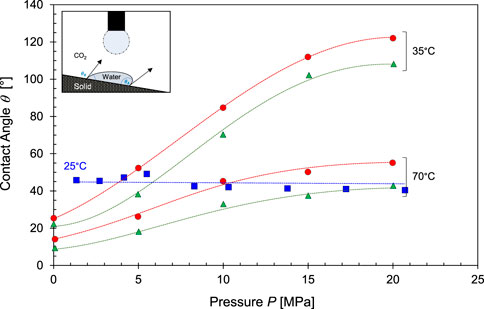
FIGURE 5. Contact angle formed by a water droplet on calcite in a CO2 atmosphere as function of CO2 pressure. Advancing contact angle (●), receding contact angle (▲) and static contact angle (■). Data sources: Bikkina, 2011, Arif et al., 2017a. For clarity, only a subset of the dataset is presented in this figure.
In contrast to the single thermodynamic contact angle predicted by Young’s equation, interfaces can exhibit a range of contact angles between two asymptotic values: the advancing contact angle
X-ray CT measurements confirm these observations and show that a wide range of contact angles exist in-situ possibly due to (Andrew et al., 2014): 1) the contact line adhesion A, 2) surface roughness and chemical inhomogeneities on the solid surface (de Gennes, 1985; Eral et al., 2013), and 3) the fact that in-situ contact angles rarely represent equilibrium conditions.
Let’s modify Young’s force equilibrium analysis parallel to the mineral surface to take into consideration the adhesion force A acting against both advancing on receding directions; then the anticipated contact angle hysteresis is
CO2 solubility in aqueous solutions
While two phases may exhibit interfacial tension, their mutual solubilities can have important implications. For example, CO2 dissolves in water and enhances carbon geological storage, on the other hand, minerals dissolve in CO2-acidified water and may trigger internal instabilities (details follow).
The solubility of CO2 in water increases with pressure but decreases with temperature. Henry’s law relates solubility χ [mol/l] to the partial pressure of CO2 PCO2 [kPa] through the temperature dependent Henry’s constant kH [mol L−1 kPa−1]:
where kH = 3.4 × 10⁻⁴ [mol L−1 kPa−1] at temperature T = 298.15 K. Figure 6A shows the evolving CO2 solubility in water as a function of pressure for different temperatures.
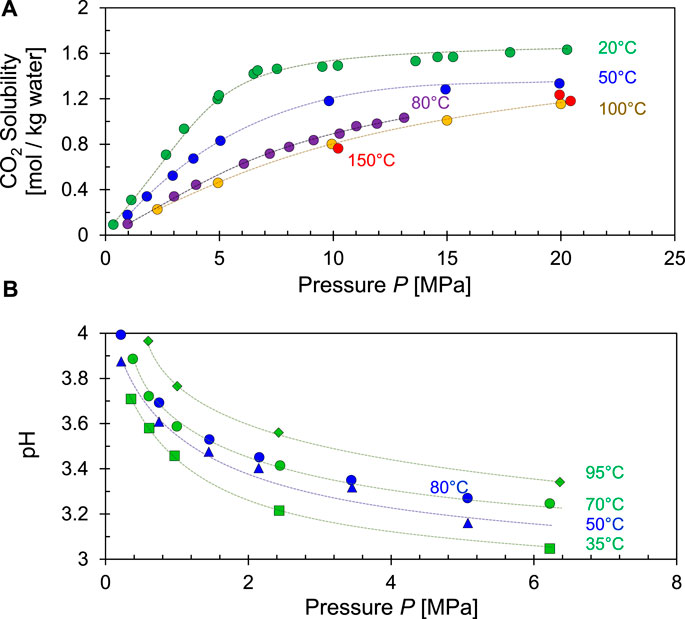
FIGURE 6. Solubility of CO2 in water and change in pH. (A) CO2 solubility increases with pressure but decreases with temperatures—Data sources: Duan and Sun., 2003, Sanaei et al., 2019. (B) Equilibrium pH for CO2 saturated water as a function of pressure and temperatures—Data sources: blue = Haghi et al., 2017; green = Peng et al., 2013.
CO2 dissolves in water to form aqueous carbon dioxide CO2 (aq). The ionization of carbonic acid produces H+ and decreases the pH:
Therefore, the equilibrium pH for water with dissolved CO2 is also a function of pressure and temperature (Figure 6B).
Effect of salinity
High salinity is a common condition in reservoirs considered for CO2 geological storage, such as saline aquifers, depleted hydrocarbon reservoirs and coalbeds. In general, CO2 solubility in water may either increase (salting-in effect, e.g. NaClO4 and K3PO4) or decrease (salting-out effect, e.g., salts from strong bases and strong acids such as NaCl, CaCl2 and MgCl2 (Yasunishi and Yoshida 1979; García, 2005; García et al., 2005). In most geological settings, CO2 solubility decreases with salt concentration as water mobility decreases, particularly for small high-valence ions. Consequently, the CO2 solubility in salt solutions at the same ionic concentration follows the following sequence: highest in KCl solutions → NaCl → CaCl2 → lowest in MgCl2 solutions. Figure 7 shows that the solubility of CO2 decreases by ∼50% for a 3 mol NaCl solution compared to deionized water. Therefore, the storage capacity for dissolved CO2 decreases by half and the needed reservoir size doubles in brine saturated formations.
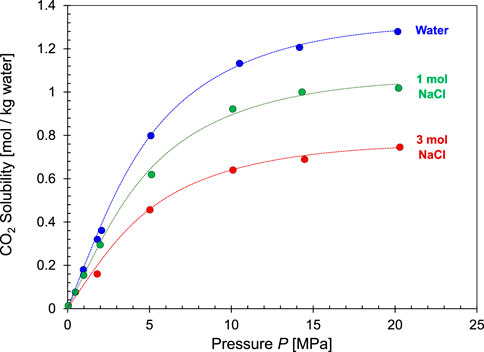
FIGURE 7. The effect of salinity on CO2 solubility in NaCl solutions as a function of pressures (T = 50°C—Data source: Koschel et al., 2006). Data at p = 101.3 kPa were gathered at T = 25°C thus solubility values are higher than the rest of the trend for T = 50°C (Data sources: Markham and Kobe., 1941; Koschel et al., 2006; Duan et al., 2006; Kiepe et al., 2002).
Effect of mixed gases
Flue gas released at power plants and industrial sources contains N2 (∼66%), CO2 (10%–15%), water vapor, other gases such as SO2, H2S, NO2, and light hydrocarbons such as CH4 (Bell et al., 2021). Separation is costly and the presence of competing gases affects the solubility of CO2 in water mainly because: (1) the solubility of CO2 in water depends on its partial pressure which decreases in a mixed gas at constant total pressure, and (2) competing ions. In the case of a N2-CO2-water system, N2 does not react with water, therefore the solubility of CO2 only depends on its partial pressure or mole fraction in the mixed gas (Figure 8A).
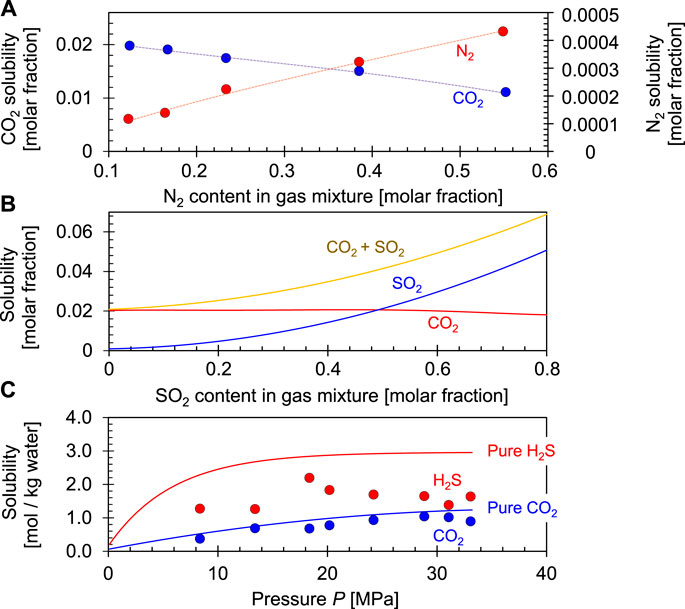
FIGURE 8. Effects mixed gas of CO2 solubility. (A) CO2 and N2 solubilities in the N2+CO2+H2O systems at a T = 34.85°C and p = 8.0 MPa. Data source: Nakhaei-Kohani et al., 2022. (B) CO2 and SO2 solubilities in the SO2+CO2+H2O systems at a T = 50°C and p = 10 MPa. Data source: Miri et al., 2014. (C) CO2 and H2S solubilities in the H2S + CO2+H2O systems at a T = 120°C. Trends and data from Savary et al., 2012.
Similar to salt, coexisting gases can either promote or inhibit CO2 solubility, yet competition is more common in carbon storage. For example, the dissolution of SO2 in water involves the following reactions (Goldberg and Parker., 1985):
The generated H+ competes with the ionization of carbonic acid and decreases the CO2 solubility (Figure 8B). Similarly, H2S dissolution in water inhibits CO2 dissolution as well (Figure 8C):
Fluid-Mineral interaction: Dissolution and precipitation
Water acidifies in the presence of CO2 and prompts mineral dissolution. The consequences of reactive fluids on the reservoir and seal stability require careful consideration.
Mineral dissolution in CO2 acidified water
A mineral’s crystal structure determines its susceptibility to dissolution in CO2 acidified water. In particular, crystallographic orientation may cause spatially heterogeneous dissolution (Daval et al., 2013; Pollet-Villard et al., 2016; Oelkers et al., 2018).
Crystal structure
Silicates and carbonates are the most common minerals in CO2 geological reservoirs. Others, minerals include oxides, sulfides, sulfate and halide.
Silicates are abundant and chemically reactive with carbonated water, thus, they have become the most promising mineral class for carbon mineralization (O’Connor et al., 2002). The fundamental unit in silicate structures is the silicon-oxygen tetrahedron (SiO4)4- (see Figure 9A). Metal ions are present in all silicates except quartz. Other cations with similar dimensions such as Al3+, Mg2+, Fe2+, Fe3+, Mn2+ and Ti4+ can replace Si4+ from tetrahedral groups by isomorphic substitution (Brigatti et al., 2006).
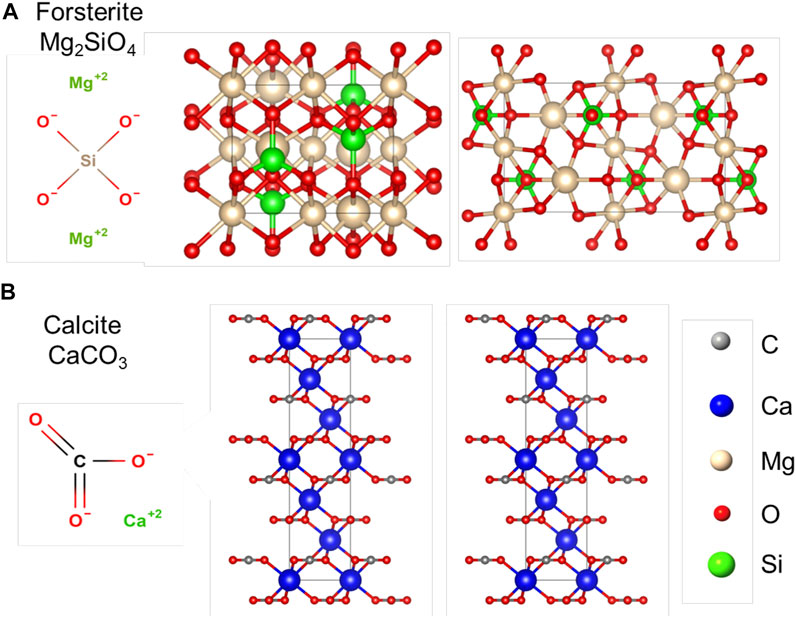
FIGURE 9. Crystal molecular structure. (A) Forsterite Mg2SiO4. (B) Calcite CaCO3. The visualization prepared with the open source software VESTA.
Carbonates are common in most formations currently considered for CO2 geological storage. The carbonate ion (CO32-) is the basic structural unit of carbonate minerals (see Figure 9B). This anion forms ionic bonds with cations such as Ca2+, Mg2+, Fe2+, Mn2+ as well as rare-earth elements e.g., Ba2+, Ce3+. Calcite CaCO3, magnesite MgCO3, rhodochrosite MnCO3, siderite FeCO3, and dolomite CaMg(CO3)2 are some of the most common carbonate minerals in nature (Effenberger et al., 1981).
Chemical bonds in minerals
Oxygen and metals Ca, Mg, Fe, Mn, Ni become oppositely charged by electron transfer and form ionic bonds, whereas silicon Si, carbon C, sulfur S and oxygen O bond together by sharing electron pairs in covalent bonds. Covalent bonds have higher bond energy than ionic bonds, for example, the bond energy in the covalent bond formed by silicon-oxygen is ∼13,100 kJ/mol, and the bond energy in the ionic bond formed by magnesium-oxygen is ∼3,816 kJ/mol (Huggins and Sun., 1946). Therefore, metal-oxygen bond breakage prevails in mineral dissolution and controls the dissolution rate (Figure 10). In addition, amorphous minerals dissolve more readily than their crystalline counterparts, such as basaltic glass compared with crystalline basalt.
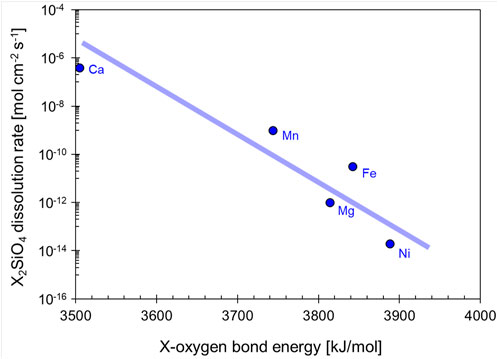
FIGURE 10. Olivine dissolution rate as a function of the metal-oxygen bond energy. X represents one of the metallic ions commonly found in olivine, such as: Ca2+, Mn2+, Fe2+, Mg2+, Ni2+. Data sources: Huggins and Sun., 1946, Casey., 1991.
Mineral dissolution
In the presence of water, a mineral liberates ions (reactants) that move away from the mineral surface to the bulk solution mainly due to electrical interaction within the Helmholtz layer and random vibration. Ions experience the greatest potential change across the Helmholtz layer, and eventually form activated complexes and new reaction products in the bulk solution (Hayes and Katz., 1996; Crundwell., 2014). Common mineral and glass dissolution reactions in CO2 acidified water are summarized in Table 1 (see also Espinoza et al., 2011; Kim and Santamarina., 2014). Figure 11 shows the dissolution of forsterite in CO2 acidified water. Dissolution involves the breaking of magnesium-oxygen bonds and the release of Mg2+ and SiO44-; subsequently, Mg2+ ions form hydrated ions with water, while SiO44- ions form activated complexes with protons, HSiO43-.
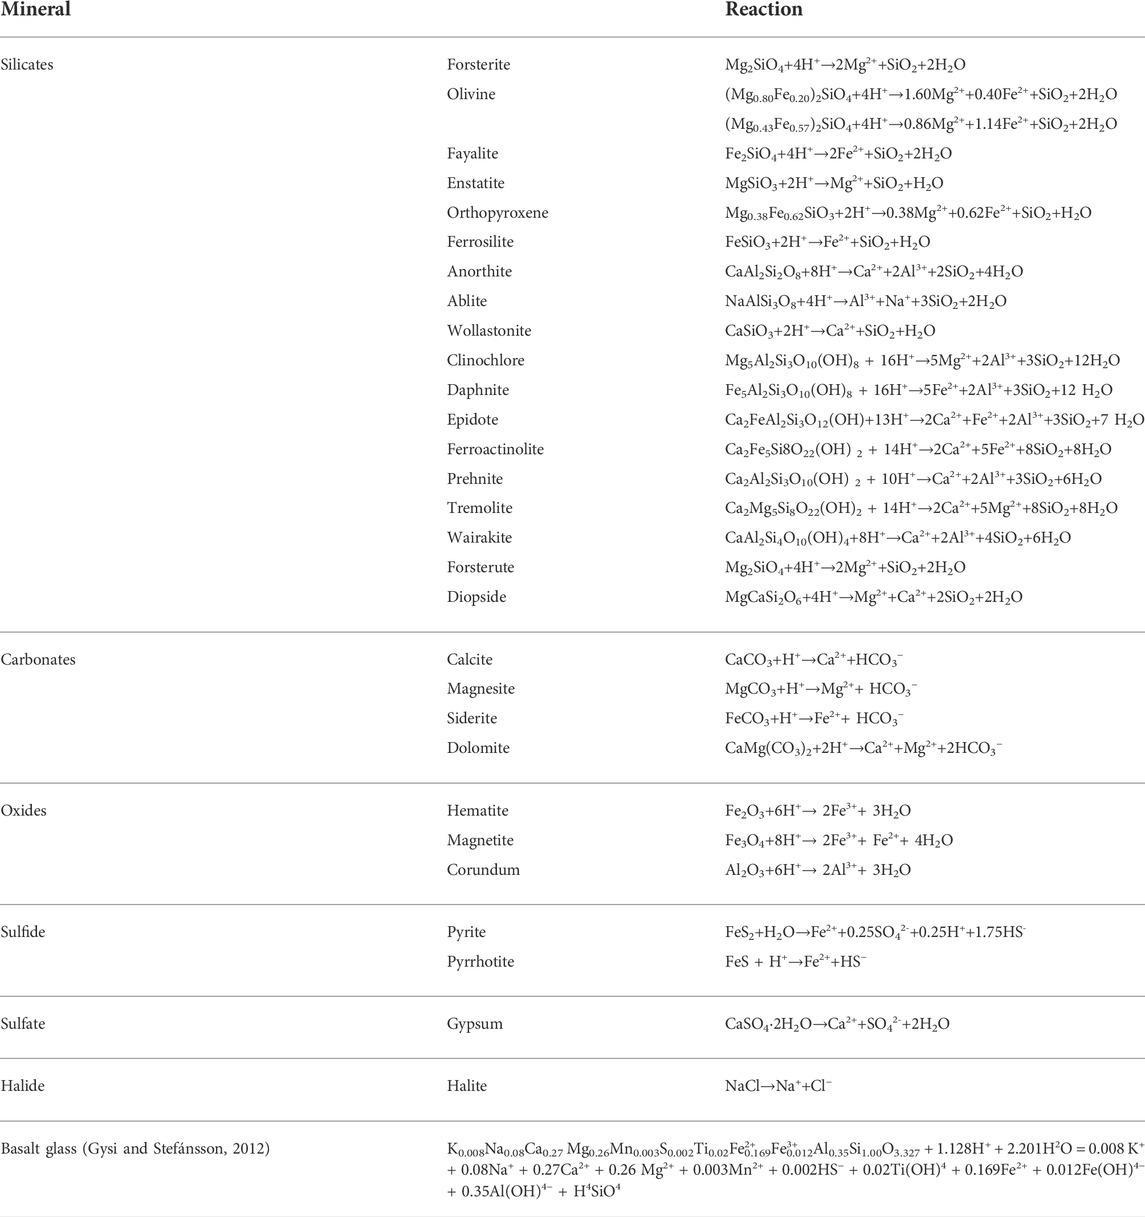
TABLE 1. Common mineral dissolution reactions in CO2 acidified water.
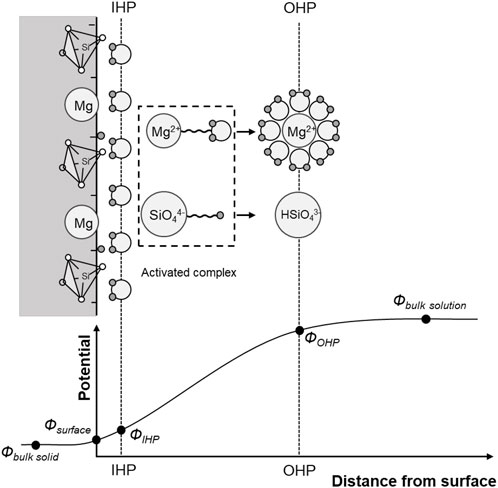
FIGURE 11. Stages in forsterite Mg2SiO4 dissolution—OHP: outer Helmholtz plane. IHP: inner Helmholtz plane. After Crundwell., 2014.
Kinetics of mineral dissolution
The rate of dissolution far-from-equilibrium rd [mol/s] can be estimated as (Arthur et al., 2000):
where k [mol m−2 s−1] is the rate constant for mineral dissolution, s [m2] is the surface area of minerals in a reference volume of solution, and
Table 2 lists kinetic dissolution rates calculated using Eq. 14 and kinetic parameters compiled from the literature for common silicate and carbonate minerals in acid solutions. Clearly, carbonates are more reactive than other minerals, in agreement with their bond energies reported above. Anorthite, fayalite and forsterite have higher reactivity than other silicates due to the relative abundance of ionic metal-oxygen bonds and the absence of silicon-oxygen covalent bonds in these minerals (Angel., 1988; Velbel., 1999). Other parameters affect mineral dissolution rates as well, for example: temperature, pH, CO2 partial pressure (Stumm and Morgan., 1996), salinity (Pokrovsky et al., 2005), organic ligands (Fredd and Fogler., 1998), and catalysts (e.g., sodium bicarbonate–O’Connor et al., 2001).
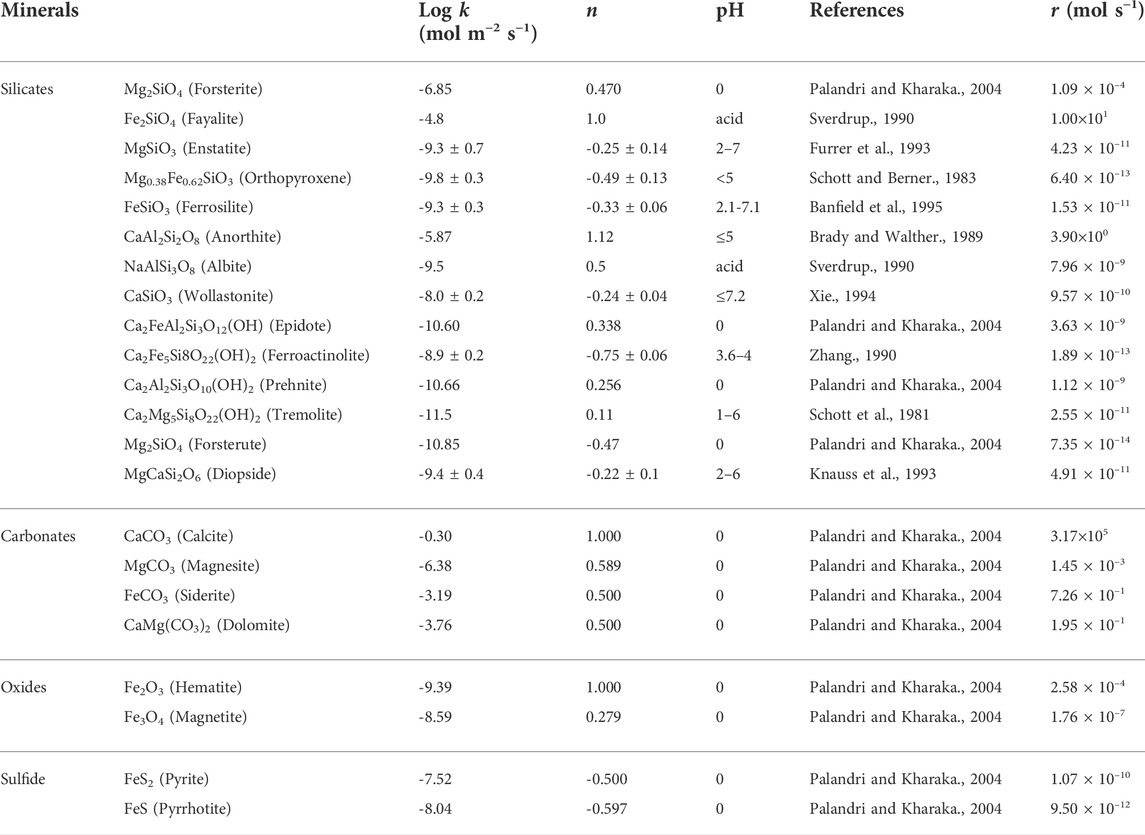
TABLE 2. Kinetic rate parameters for mineral dissolution in acid solutions (T = 25°C) and the calculated dissolution rates r (Eq. 14—Calculations assume 25°C, 0.1 MPa, the pH of CO2 water is 4.5, the surface area is fixed at 2 m2).
Mineral dissolution: Hydro-chemo-mechanical coupling
Minerals dissolve during CO2 injection and produce species that are carried away by advection and diffusion. Consequently, mineral dissolution enhances porosity and permeability, and causes settlement and stress changes.
The evolution of mineral dissolution in a porous medium is inherently related to pore size variability and the presence of preferential flow pathways which deliver the majority of the reactants in advective regimes: 10% of pores may be responsible for more than 50% of the total flow rate in sediments (Jang et al., 2011), and flow channeling is even more pronounced in fractured rock masses (National Academies of Sciences Engineering and Medicine, 2020; Cardona et al., 2021). Therefore, dissolution and transport are coupled, and may involve fabric changes. Hydro-chemo-mechanical coupling effects triggered by dissolution are explored next.
Dissolution at constant fabric (no mechanical coupling)
Dissolution and advection lead to increased flow focusing and “wormhole” formation (Kim and Santamarina., 2015; Kim and Santamarina., 2016; Menke et al., 2017; Derr et al., 2020). Two dimensionless ratios combine the three time scales for advection tadv, diffusion tdiff, and reaction tr; for a channel length Lch,
where v [m/s] is the average flow velocity in pores, D [m2/s] is the molecular diffusion coefficient, and the kinetic rate
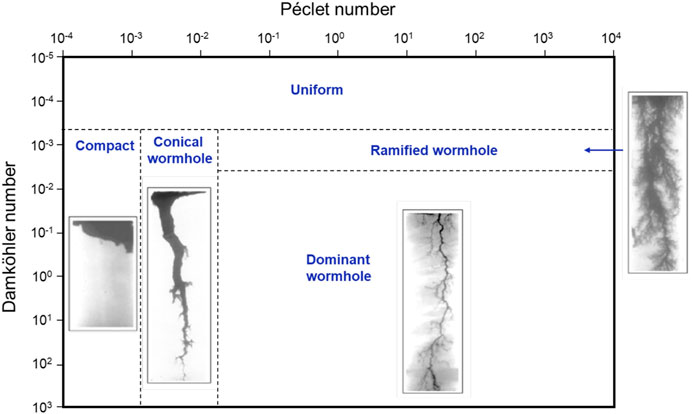
FIGURE 12. Dissolution in rigid porous network—Various regimes in the Péclet-Damköhler space. Modified from Golfier et al., 2002. Source of images: Fredd., 2000.
Similarly, various dissolution regimes emerge when reactive fluids flow through rock fractures (Kim and Santamarina., 2015; Shafabakhsh et al., 2021). A low Da causes a more uniform aperture enlargement along the length of the fracture. On the other hand, most reactants are consumed near the inlet in large Da and low Pe regimes (highly reactive low-advection conditions). Finally, a large fracture aperture slows the diffusive transport of reactants to the mineral fracture surface, and higher reactant concentrations remain along the centerline.
Dissolution-triggered fabric changes (mechanically coupled effects)
Mineral dissolution during CO2 injection can cause fabric changes in sediments, block sliding in fractured rocks and stress changes in both cases.
The coefficient of lateral earth pressure at rest k0 = σh’/σv’| εh=0 is the stress ratio between the effective horizontal stress σh’ and the effective vertical stress σv’ under zero lateral strain conditions εh = 0. Both experimental and numerical results show that even a small amount of particle dissolution can produce a pronounced drop in k0 and the state of stress may even reach the Coulomb failure envelope, i.e., Rankine active coefficient k0→ka (mixture of soluble and insoluble grains–Shin and Santamarina., 2009). At the grain scale, forces initially carried by dissolving particles get transferred to less soluble neighboring grains, the particle coordination number decreases, and force chains form a brittle honeycomb-like fabric (Figure 13A—Shin et al., 2008; Cha and Santamarina, 2014; Kim et al., 2019). After reaching its lowest value, the stress ratio may gradually recover upon further dissolution to reach a “terminal state”.
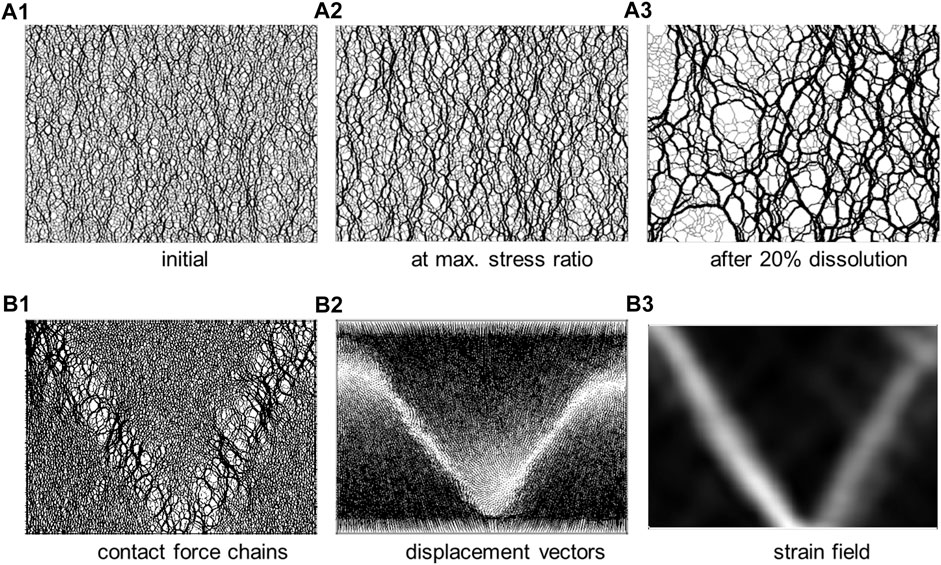
FIGURE 13. Dissolution in granular materials under constant vertical stress and zero lateral strain. (A) Force chain evolution during the dissolution of randomly distributed soluble grains: the evolving brittle “honeycomb” structure exhibits pronounced force chain arching (20% of the grains are soluble—Shin et al., 2008). (B) Pressure-solution whereby the particle dissolution rate is proportional to the normal force: the emergence of shear bands, Cha and Santamarina., 2019.
Stress concentration at grain contacts favors localized dissolution, i.e., “pressure solution” (even in single-mineral systems—Rutter, 1983; Etheridge et al., 1984; Fowler and Yang., 1999). Strong intergranular force chains and force-dependent contact dissolution combine to create a positive feedback mechanism that can lead to shear localization (Cha and Santamarina, 2016—Figure 13B). This sequence of events explains the nontectonic origin of shear discontinuities and polygonal fault systems observed in marine sediments and lacustrine deposits (Cartwright et al., 2003; Shin et al., 2008; Shin et al., 2010).
Let’s assume a carbonate reservoir (mineralogy = 100% calcite, porosity = 0.3) at a depth of 800 m (p = 8 MPa, T = 60 °C) filled with CO2 saturated water (pH ≈ 3.21, calcite solubility ≈ 4.41 × 10⁻⁵ mol/L). Under these conditions, 1.3 g ∼ 0.5 cm3 of calcite will dissolve for every pore volume of CO2 saturated water, and cause a volumetric strain of ε = 0.5 × 10⁻⁶. The induced isotropic stress change is Δσ = E × ε ≈ 1 kPa per pore volume of fluid exchange (the Young’s modulus is E ≈ 5 GPa for a carbonate with porosity 0.3—Ng and Santamarina 2022). Thus, the stress change for a single pore volume is small; however, ensuing convective transport and dissolution localization may eventually trigger mechanical instabilities.
Precipitation: Crystallization pressure and matrix filling
Precipitation is a self-homogenizing process in porous media: precipitates reduce the permeability of preferential flow paths and reactive fluids deviate to other pathways. Still, precipitation has other important consequences related to crystallization pressure and ensuing pore habits. These processes play a central role in CO2 mineralization.
Crystallization pressure: new fractures
New minerals nucleate on preexisting surfaces (heterogeneous nucleation), grow into the pore space, and exert crystallization pressure when growth is constrained by pore and fracture walls (Lee and Kurtis, 2017). A thin film between the crystal and the wall and corner flow (along roughness and crevices which are not occupied by the growing mineral) maintain connectivity with the saturated solution and sustain crystal growth (Becker and Day, 1916; Taber, 1916; Correns, 1949).
The crystal experiences an internal excess pressure ΔP = Pcrys–Psol, where Pcrys is the pressure in the growing crystal and Psol is the hydrostatic pressure of the pore solution. This excess pressure ΔP is a function of the solution supersaturation S = c/c0, where c and c0 are the solute concentrations in the supersaturated solution and in the saturated solution respectively:
Other parameters include: the gas constant R [J mol−1 K−1], the absolute temperature T [K], and the molar volume of the precipitated solid phase Vm [m3/mol]. Figure 14 shows the calculated crystallization pressure of quartz SiO2, cristobalite SiO2 and calcite CaCO3 for different degrees of supersaturation (Wiltschko and Morse, 2001).
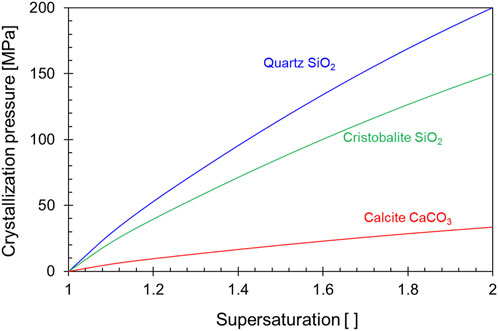
FIGURE 14. Crystallization pressures of quartz, cristobalite, and calcite as a function of supersaturation Trends from Wiltschko and Morse., 2001; formulation in Maliva and Siever., 1988.
The stress field induced by the crystallization pressure in neighboring pores may trigger an opening mode fracture (Anderson, 2017). Similarly, precipitation may form grain-displacive nodules and lenses in sediments when the crystallization pressure exceeds the in situ effective stress (Shin and Santamarina, 2011; Liu and Santamarina, 2022). Note that precipitated carbonates usually occupy a larger volume than the dissolved source minerals (Snæbjörnsdóttir et al., 2018; Snæbjörnsdóttir et al., 2020), therefore volume expansion during local dissolution-precipitation will also cause crystallization pressure.
Recurrent precipitation in the matrix: Liesegang band formation
Crystal growth decreases the local reactant concentration and may locally deplete the reactants that the host medium may contribute. Meanwhile, the reaction front keeps advancing; eventually transported and host rock reactants reach the threshold saturation concentration again and a new round of mineral precipitation starts. Such reactive-diffusion-precipitation process produces a periodic precipitation pattern, known as Liesegang bands (Liesegang, 1896; Rácz, 1999; Panjarian and Sultan, 2001; Nabika et al., 2020). Banded precipitation is found in a wide range of geological settings; Figure 15 shows periodic precipitation patterns in sandstones, carbonate and granite. These field observations are natural analogues for CO2 mineralization within the rock matrix.
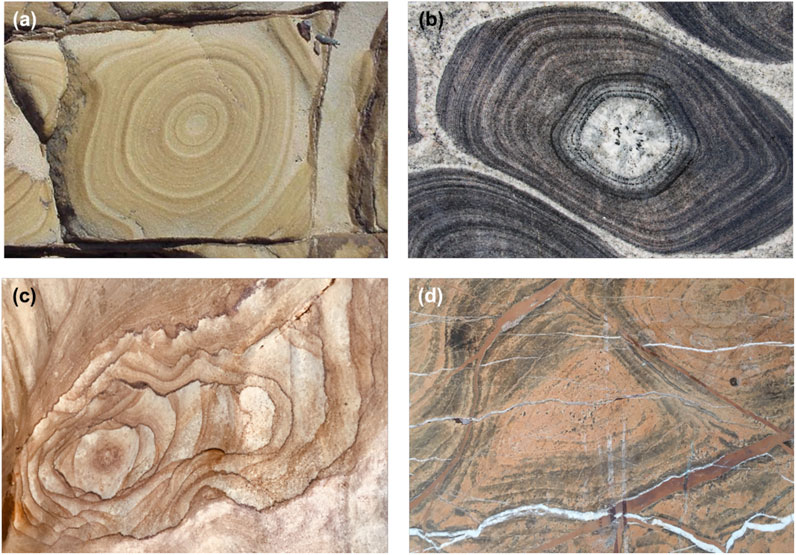
FIGURE 15. Diffusive-reactive transport: Liesegang bands. (A) in sandstone - from T McCarron. (B) Orbicular granite—Lahti et al., 2005. (C) Sandstone—Wadi Lajab, Saudi Arabia. (D) Jordanian carbonate.
CO2 mineralization
The general reaction for CO2 mineralization starts with calcium, magnesium or iron silicates to produce the corresponding carbonates:
Mafic and ultramafic rocks are silicates; therefore, the ultimate storage ability per cobic meter of rock is determined by the molar mass ratio between CO2 and silicate MCO2/Msilic, and the rock density and porosity (MCO2/Msilic)⋅(1-ϕ)ρrock. The molar mass ratios MCO2/Msilic are: 0.38 for wollastonite CaSiO3, 0.44 for enstatite MgSiO3 and 0.33 FeSiO3 for ferrosilite. Then, the theoretical ultimate storage density values can exceed 500 kg/m3. However, the reaction is time-dependent and more modest values between 30-and-200 kg CO2 per cubic meter of basalt could be expected within the first 10-to-100 years after injection (e.g., Xiong et al., 2018).
In fact, the reaction rate depends on the mineral reactivity, the available exposed surface area and fracture spacing, and the evolving efficiency of transport processes. Eq. 14 and kinetic parameters in Table 2 show that the characteristic time for carbonation varies in orders of magnitude for different minerals. For example, consider a rock block with a constant exposed surface of 2 m2 in contact with CO2 saturated water (p = 0.1 MPa, T = 25°C, pH = 4.5): it takes around 7 years to dissolve 1 m3 forsterite Mg2SiO4 (
Other phenomena—reservoirs
The geological storage of CO2 involves other reservoir-dependent processes, such as zone differentiation and convective currents in saline aquifers, excess pressure due to the buoyant CO2 plume and altered seal performance, oil mobilization in depleted reservoirs, and near-well drying and cooling. These phenomena are investigated next.
CO2 injection into saline aquifers
Transport during CO2 injection into saline aquifers involves advection, dispersion, dissolution, diffusion, and convection (Figure 16). CO2 is lighter and less viscous than water, therefore, CO2 injection responds to buoyant, capillary and viscous forces: 1) CO2 invasion next to the well is most sensitive to stratification and invades by viscous fingering through the most pervious layers, 2) the plume becomes gravity-dominant away from the well (Hesse et al., 2008), and eventually 3) it rests against the top seal by buoyancy and capillary trapping. Then, the reservoir develops various zones according to the saturating fluids: the supercritical CO2 plume, the capillary transition zone, CO2-rich brine, and the far-field saturated with the initial brine (Figure 16).
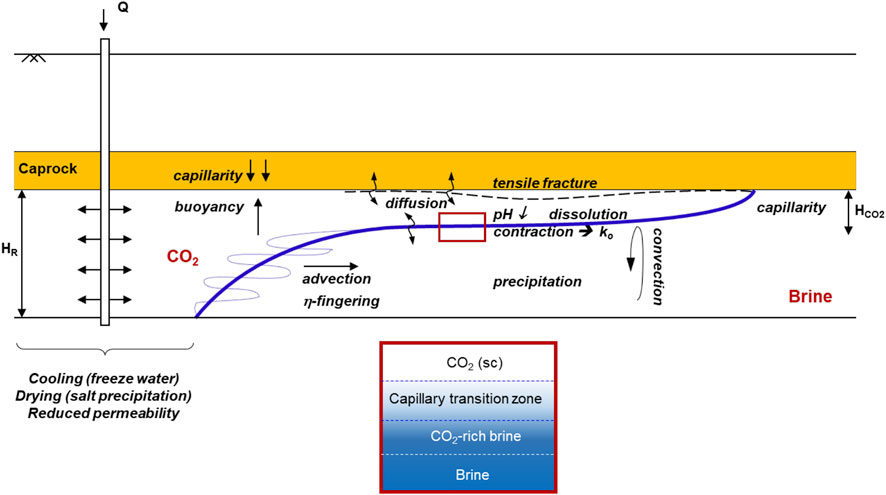
FIGURE 16. Carbon geological storage in saline aquifer: reservoir zones and underlying phenomena near the injection well and in the far field.
During early storage times, the degree of water saturation in the reservoir is a function of the capillary pressure
Next to the plume lower boundary, stored CO2 dissolves into the groundwater and convection emerges due to the increased density of water with dissolved CO2 - between
where the governing parameters are the formation permeability khy [m2], g = 9.8 m/s2, the height of the fluid column HR [m], the change in fluid density
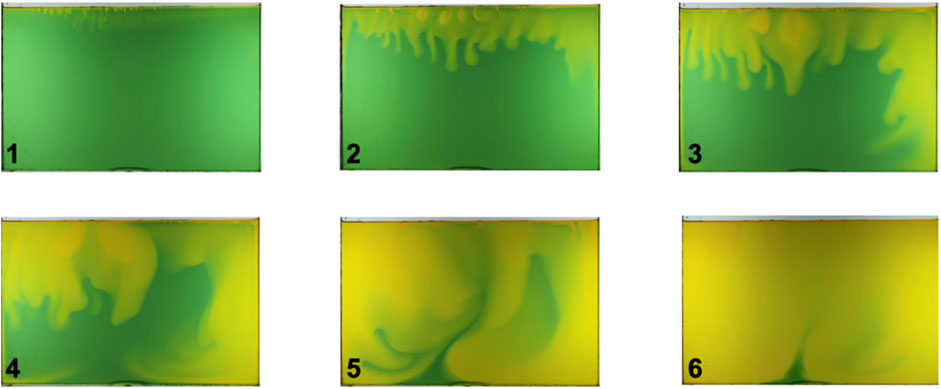
FIGURE 17. CO2 solute driven convection. Time lapse images of a water bath beneath a CO2 atmosphere (water with a universal pH indicator—Bang et al., 2012). The time interval between images is 40 min.
The convection period is
Finally, the injection of dry CO2 into a saline aquifer causes salt precipitation as water evaporates into the supercritical CO2 near the wellbore (Miri et al., 2015). Salt precipitation can reduce CO2 injectivity into the reservoir; its impact depends on the injection rate, mode (monotonic vs. cyclic), and brine salinity (Talman et al., 2020; He et al., 2022).
Seal rock: structure trapping
Small pores in high specific surface clay-rich caprocks give rise to the high capillary entry pressure and low permeability needed to hinder the upwards migration of the buoyant CO2 plume. On the other hand, CO2 invasion either dissolved in water or as a supercritical phase alters the physiochemical equilibrium in the seal rock.
Capillary pressure against the seal
The plume height h [m] determines the excess pressure in the CO2 plume at the seal-reservoir interface,
The characteristic pore diameter d* is a function of the specific surface area Ss, the void ratio e, the mineral density
Sealing numbers
On the other hand, the higher CO2 pressure changes the effective stress can trigger fault reactivation and grain-displacive breakthrough. The stability number
where the variables are: the initial total vertical stress σz0 and fluid pressure P0 at the reservoir-seal interface before CO2 injection, and effective stress ratio k0 = σh’/σz’ at zero lateral strain. Safe CO2 injection requires reservoirs with a high stability number
CO2 interaction with clay-rich caprock
As anticipated by the sealing number
1) First contact (before SC-CO2 invasion): CO2 dissolves in water and acidifies the brine. Low pH promotes protonation, and leads to positively charged surfaces, which will affect the clay fabric.
2) Long term (after SC-CO2 invasion): CO2 replaces water and becomes the saturating pore fluid. There will be a reduction in osmotic repulsion, dissolution of residual water in CO2 and salt precipitation, volumetric contraction driven by capillarity, and a three-fold increase in the Hamaker constant for clay-CO2-clay as compared to clay-water-clay (Shin and Santamarina, 2010; Espinoza and Santamarina, 2012).
Changes in electrical and capillary forces will induce volumetric changes, thus stress changes in the caprock. Figure 18 shows that a montmorillonite-water paste contracts and experiences desiccation cracks when water evaporates into supercritical CO2 atmosphere. Sedimentation experiments show that clay particles show strong particle aggregation with heptane and liquid CO2 which shows that the electrical interaction between clays and water is different than with CO2 in its different states (Espinoza and Santamarina, 2012).
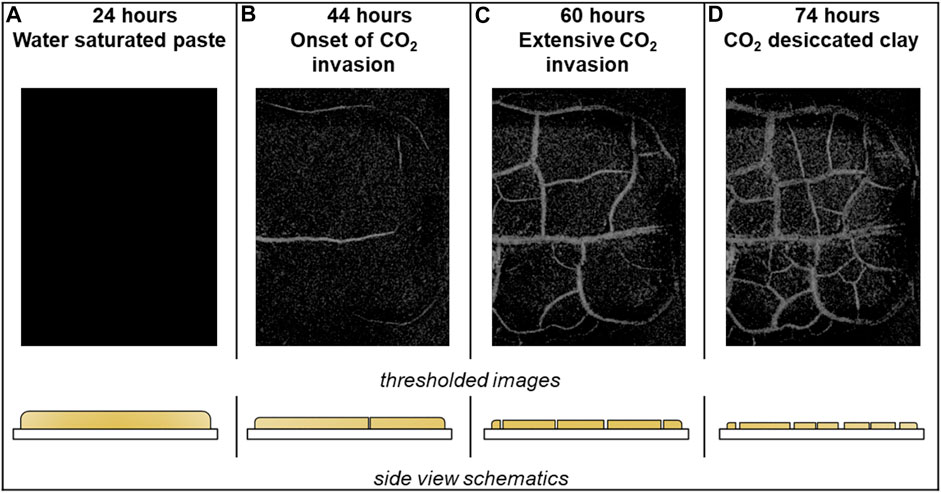
FIGURE 18. Montmorillonite-water paste subjected to a supercritical CO2 atmosphere (p = 15 MPa and T = 38°C). The photographs and associated sketches show the evolution of desiccation and the formation of capillary-driven fractures: as water evaporates into the CO2 reservoir, suction increases and the water-CO2 interface “compresses” the sediment; eventually, supercritical CO2 invades the sediment and triggers desiccation cracks, Espinoza and Santamarina., 2012.
CO2 injection into depleted oil reservoirs
CO2 injection into depleted oil reservoirs benefits from time-proven seals. In addition, CO2 can mobilize residual oil; in this case, we can simultaneously sequester CO2 while recovering additional oil. Numerous pore-scale mechanisms affect CO2-oil displacement processes, including oil swelling, ganglia destabilization, coalescence of disconnected oil blobs into a continuous oil phase, light-component extraction, miscible displacement and asphaltene deposition. Details follow.
Oil density and viscosity
The oil density decreases slightly with temperature, and pressure has a second order effect (Figure 1). On the other hand, the viscosity of crude oils can decrease by an order of magnitude when the temperature increases from 40°C to 80°C (Figure 3).
Oil-water interfacial tension
The interfacial tension between two non-polar fluids such as CO2 and oil tends to be smaller than when dipolar water molecules are involved. Figure 19 shows the interfacial tension between three different alkanes (decane, dodecane and hexadecane) and CO2 as a function of CO2 density. The interfacial tension increases with the number of carbon atoms in alkanes and decreases with increasing CO2 density.
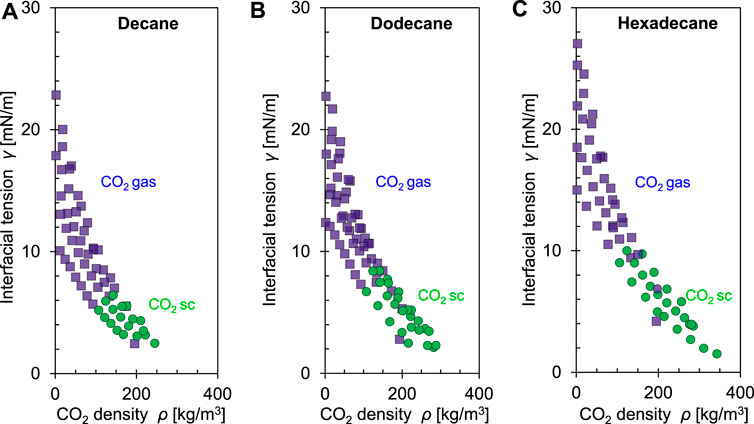
FIGURE 19. Interfacial tension between selected alkanes and CO2 as a function of the CO2 density at different pressures and temperatures: (A) Decane, (B) Dodecane and (C) Hexadecane. Symbols: CO2 gas (■) and CO2 supercritical (●). Data source: Georgiadis et al., 2010.
CO2 solubility in crude oil - Viscosity
The solubility of CO2 in crude oil is much higher than in water because of their shared non-polar nature (Schmid, 2001). Solubility is directly dependent on the CO2 partial pressure (Figure 20A), and is also affected by temperature and oil properties. Oil experiences a pronounced decrease in viscosity as CO2 dissolves in it (Figure 20B).
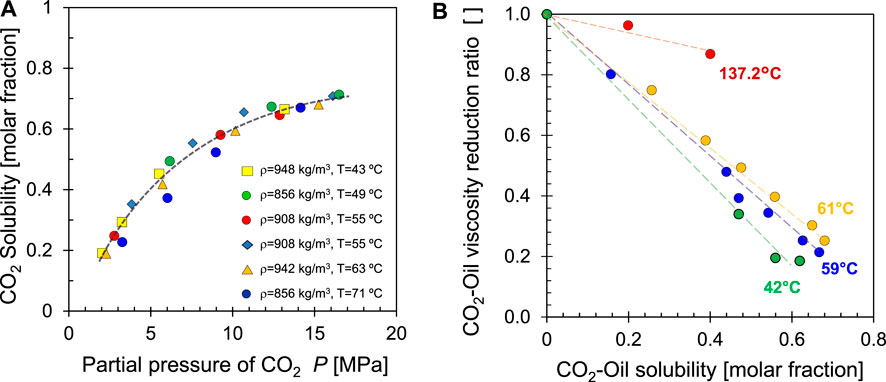
FIGURE 20. CO2 and oil. (A) Solubility as a function of CO2 partial pressure for different temperatures. Data source: Simon and Graue., 1965. (B) Oil viscosity with increasing molar fraction of dissolved CO2. Data source: Barclay and Mishra., 2016.
Crude oil and CO2 become fully miscible and the interface vanishes when the “minimum miscibility pressure” is reached; Table 3 lists minimum miscibility pressures for various crude oils. Above the minimum miscibility pressure, a transition zone forms in the reservoir. Miscibility is not instantaneous but develops gradually, i.e., “dynamic miscibility” (Verma, 2015).
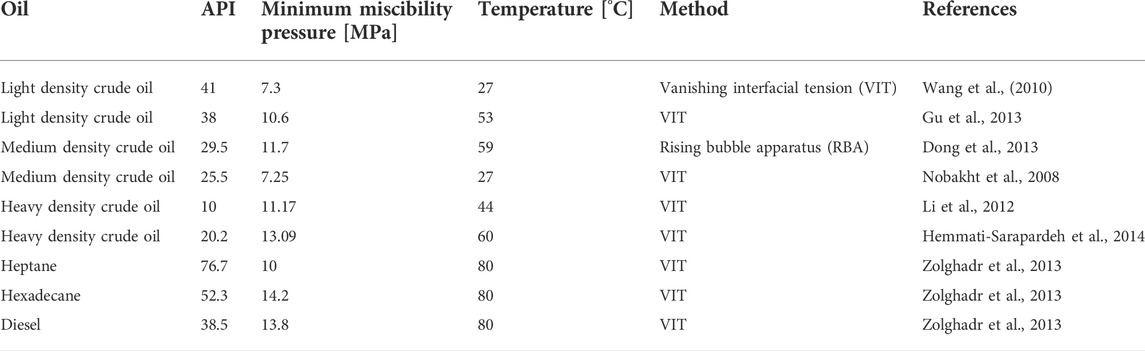
TABLE 3. Minimum miscibility pressure for different crude oils and organic compounds.
Swelling and shrinkage
Miscibility results from (1) the dissolution of CO2 into the reservoir oil causing swelling, and (2) the vaporization of intermediate-molecular-weight hydrocarbons into the injected CO2 resulting in oil shrinkage. The competitive effects of swelling and shrinkage are evident in the data presented in Figure 21: the oil swelling factor increases with CO2 pressure until it reaches a maximum volume (at p = 8 MPa when T = 50°C, or at p = 17 MPa when T = 95°C); thereafter, vaporization-extraction becomes dominant at high-pressure and oil shrinks.
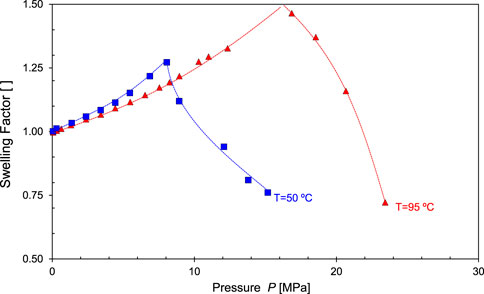
FIGURE 21. Miscibility and oil volume change. There are two competing processes: CO2 dissolution in oil prevails at low pressure and causes oil swelling; on the other hand, light hydrocarbons vaporize into CO2 and oil shrinks at high pressure. Data source: Rezk and Foroozesh (2019).
Asphaltene precipitation
Crude oil contains saturated hydrocarbons (single bonds between carbon atoms and saturated with hydrogen), aromatics (planar rings), resins, and asphaltenes. Asphaltenes are polar, polyaromatic and of high molecular weight substances that are insoluble in n-hexane or n-pentane. The size of asphaltenes ranges from less than 1 nm single molecules in light oils to more than 5 nm aggregates in black oils and heavy oils (Mullins, 2010). CO2 dissolution in oil causes asphaltene precipitation; as asphaltene deposits on mineral surfaces, it changes the wettability of the reservoir causing mostly irreversible formation damage. Experimental studies show that ionic liquids prevent asphaltene precipitation (Hu and Guo, 2005; Zheng et al., 2019).
Thermal effects
The injection of CO2 triggers thermal changes in surface facilities, the injection well and inside the reservoir (Hoteit et al., 2019).
Joule-Thomson expansion
The CO2 injection pressure exceeds the formation pressure and rapid quasi-adiabatic expansion of CO2 takes place near the injection well. When a gas expands from high pressure to low pressure, the temperature change ΔT is related to the pressure change ΔP by the Joule-Thomson coefficient
Gas expansion causes cooling when the Joule-Thomson coefficient
The Joule-Thomson coefficient is
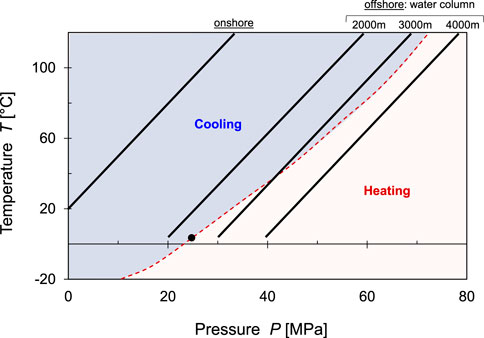
FIGURE 22. Joule-Thompson effect—Near well thermal effects. Cooling is anticipated for most onshore and offshore applications. The “inversion curve” predicts heating for seafloor injections beneath > 2,400 m high water columns.
Other thermal effects
In addition to the Joule-Thomson effect, endothermic water vaporization into supercritical CO2 takes place mainly near the injection well (Vilarrasa and Rutqvist, 2017), while exothermic dissolution of supercritical CO2 into the host brine prevails further away from the well (
Field implications
Under most field conditions, CO2 injection will cause a significant temperature drop. The extent of cooling scales with the pressure drop and is partially compensated by heat transport in the reservoir (Oldenburg, 2007; Gauteplass et al., 2020). Cooling induces thermo-elastic stresses and triggers hydrate or ice formation when PT-conditions cross the corresponding phase boundary; hydrate and ice hinder fluid flow into the formation (Sloan, 2010). Effective stress changes caused by the injection pressure and thermos-elastic effects can reactivate fractures and improve their transmissivity due to shear dilation (Vilarrasa et al., 2017).
Finally, thermal changes affect density (Figures 1, 2), viscosity (Figure 3), interfacial properties (Figures 4, 5), and solubility and pH (Figure 6). In the supercritical regime, thermally induced density gradients are most pronounced across the Widom line and near the critical point. The induced thermal gradients give rise to thermally driven convection (Islam et al., 2014).
Storage density—reservoir size
The storage capacity per unit volume of the reservoir or ‘storage density’ SD [kg CO2/m3 of rock] depends on the CO2 phase and the reservoir porosity ϕ:
The listed SD values correspond to: porosity ϕ = 0.1-to-0.3, CO2 solubility in fresh water at common reservoir PT conditions
The annual worldwide CO2 emission is ∼40 Gt/yr. Let’s consider storing 1 gigaton of CO2, i.e., a “small fraction” of the total annual emissions: the required volume for CO2 dissolved in fresh water is equivalent to a 30 m thick porous reservoir 50 km × 50 km wide, assuming high porosity ϕ = 0.3 and a storage density SD = 13 kg/m3. Clearly, higher density CO2 forms are preferred for efficient storage; still, the storage density SD values listed above imply that all CO2 geological storage forms will require large reservoir volumes.
Conclusions
The injection of CO2 into geological formations triggers numerous coupled thermo-hydro-chemo-mechanical processes.
The gas-liquid phase boundary and the Widom line within the supercritical regime divide the lighter gaseous-like regime from the denser liquid-like regime. The density of CO2 has a first-order effect on the CO2-water interfacial tension.
The CO2-water interface pins strongly to mineral surfaces and results in a wide range of contact angles that vary between the advancing and the receding asymptotic values. Soon after injection, the residual water saturation reflects the reservoir capillary pressure vs. saturation response; thereafter, the degree of water saturation decreases with time as water evaporates into CO2.
The solubility of CO2 in water increases with pressure but decreases with temperature. In most geological settings, CO2 solubility decreases with salt concentration particularly when small high-valence ions are involved. Similarly, the presence of competing gases affects the solubility of CO2 in water because of competing ions and a reduction in the partial pressure of CO2 (at constant total pressure).
Dissolved CO2 acidifies water and prompts mineral dissolution (silicates and carbonates). Dissolution couples with preferential advective flow channels, diffusive transport and mechanical effects to cause various dissolution patterns, internal shear failure (even under zero lateral strain conditions), and strains may localize along shear bands. Next to the plume lower boundary, convective currents may emerge due to the increased density of water with dissolved CO2 and minerals.
CO2 mineralization homogenizes flow pathways. Crystal growth against pore and fracture walls exert crystallization pressure that can create new fracture surfaces or cause grain-displacive mineral lenses (when the crystallization pressure exceeds the rock tensile strength or the far-field confining stress). Precipitation may also take place within the rock matrix by successive dissolution-diffusion-precipitation sequences that result in periodic precipitation patterns, i.e., Liesegang bands.
Buoyant CO2 plumes apply excess pressure against the seal caprock and interact with clay minerals through physicochemical processes. The sealing number
CO2 injection into depleted oil reservoirs benefits from proven seal performance. At the same time, it causes light-component extraction, oil swelling, ganglia destabilization, a reduction in oil viscosity, and miscible displacement. Then, we can simultaneously sequester CO2 while recovering additional oil through CO2 gravity-driven enhanced oil recovery.
Rapid CO2 depressurization near the injection well causes cooling under most anticipated reservoir conditions. Cooling may trigger hydrate and ice formation, and reduce permeability. In some cases, effective stress changes associated with the injection pressure and cooling thermoelasticity can reactivate fractures.
The CO2 storage density in terms of kg of CO2 per cubic meter of the reservoir depends on the CO2 phase and the reservoir porosity ϕ. First order estimates are 4-to-13 kg/m3 for CO2 dissolved in water, 25-to-77 kg/m3 for CO2 trapped in hydrate, 30-to-200 kg/m3 for mineralized CO2 (attainable within the first 10-to-100 years of storage), and 50-to-240 kg/m3 for supercritical-to-liquid CO2 (most efficient but prone to leakage). In all cases, large reservoir volumes will be required to store a meaningful fraction of the CO2 that will be emitted during the energy transition (Anderson, 2017; Global status CCS, 2021).
Author contributions
All authors listed have made a substantial, direct, and intellectual contribution to the work and approved it for publication.
Acknowledgments
G. Abelskamp edited the manuscript. Support for this research was provided by the KAUST Endowment.
Conflict of interest
The authors declare that the research was conducted in the absence of any commercial or financial relationships that could be construed as a potential conflict of interest.
Publisher’s note
All claims expressed in this article are solely those of the authors and do not necessarily represent those of their affiliated organizations, or those of the publisher, the editors and the reviewers. Any product that may be evaluated in this article, or claim that may be made by its manufacturer, is not guaranteed or endorsed by the publisher.
References
Akhmadiyarov, A. A., Petrov, A. A., Rakipov, I. T., and Varfolomeev, M. A. (2019). Effect of pressure, temperature and gas phase composition on the rheological properties of heavy crude oil. IOP Conf. Ser. Earth Environ. Sci. 282, 012021. doi:10.1088/1755-1315/282/1/012021
Andrew, M., Bijeljic, B., and Blunt, M. J. (2014). Pore-scale contact angle measurements at reservoir conditions using X-ray microtomography. Adv. Water Resour. 68, 24–31. doi:10.1016/j.advwatres.2014.02.014
Arif, M., Lebedev, M., Barifcani, A., and Iglauer, S. (2017a). CO2 storage in carbonates: Wettability of calcite. Int. J. Greenh. Gas Control 62, 113–121. doi:10.1016/j.ijggc.2017.04.014
Arif, M., Lebedev, M., Barifcani, A., and Iglauer, S. (2017b). Influence of shale-total organic content on CO2 geo-storage potential. Geophys. Res. Lett. 44, 8769–8775. doi:10.1002/2017GL073532
Arthur, R. C., Savage, D., Sasamoto, H., Shibata, M., and Yui, M. (2000). Compilation of kinetic data for geochemical calculations. Tokai, Ibaraki (Japan): Japan Nuclear Cycle Development Inst.
Bachu, S. (2003). Screening and ranking of sedimentary basins for sequestration of CO2 in geological media in response to climate change. Environ. Geol. 44, 277–289. doi:10.1007/s00254-003-0762-9
Banfield, J. F., Ferruzzi, G. G., Casey, W. H., and Westrich, H. R. (1995). HRTEM study comparing naturally and experimentally weathered pyroxenoids. Geochim. Cosmochim. Acta 59, 19–31. doi:10.1016/0016-7037(94)00372-S
Bang, E. S., Son, J. S., and Santamarina, J. C. (2012). “Subsurface CO2 leakage : Lab-scale study of salient characteristics and assessment of borehole-based detection using resistivity tomography,” in Proceeding of the 4th International Conference on Geotechnical and Geophysical Site Characterization (ISC’4), Porto de Galinhas, Pernambuco – Brazil, January 2013.
Barclay, T. H., and Mishra, S. (2016). New correlations for CO2-Oil solubility and viscosity reduction for light oils. J. Pet. Explor. Prod. Technol. 6, 815–823. doi:10.1007/s13202-016-0233-y
Becker, G. F., and Day, A. L. (1916). Note on the linear force of growing crystals. J. Geol. 24, 313–333. doi:10.1086/622342
Bell, J. G., Benham, M. J., and Thomas, K. M. (2021). Adsorption of carbon dioxide, water vapor, nitrogen, and sulfur dioxide on activated carbon for capture from flue gases: Competitive adsorption and selectivity aspects. Energy fuels. 35, 8102–8116. doi:10.1021/acs.energyfuels.1c00339
Bikkina, P. (2011). Contact angle measurements of CO2–water–quartz/calcite systems in the perspective of carbon sequestration. Int. J. Greenh. Gas Control 5 (5), 1259–1271. doi:10.1016/j.ijggc.2011.07.001
Brady, P. V., and Walther, J. V. (1989). Controls on silicate dissolution rates in neutral and basic pH solutions at 25°C. Geochim. Cosmochim. Acta 53, 2823–2830. doi:10.1016/0016-7037(89)90160-9
Brigatti, M. F., Galan, E., and Theng, B. K. G. (2006). Chapter 2 structures and mineralogy of clay minerals. Elsevier. doi:10.1016/S1572-4352(05)01002-0
Cardona, A., Finkbeiner, T., and Santamarina, J. C. (2021). Natural rock fractures: From aperture to fluid flow. Rock Mech. Rock Eng. 54, 5827–5844. doi:10.1007/s00603-021-02565-1
Cartwright, J., James, D., and Bolton, A. (2003). The Genesis of polygonal fault systems: A review. Geol. Soc. Lond. Spec. Publ. 216, 223–243. doi:10.1144/GSL.SP.2003.216.01.15
Casey, W. H. (1991). On the relative dissolution rates of some oxide and orthosilicate minerals. J. Colloid Interface Sci. 146, 586–589. doi:10.1016/0021-9797(91)90225-W
Cha, M., and Santamarina, J. C. (2014). Dissolution of randomly distributed soluble grains: Post-dissolution k 0 -loading and shear. Géotechnique 64, 828–836. doi:10.1680/geot.14.P.115
Cha, M., and Santamarina, J. C. (2016). Hydro-chemo-mechanical coupling in sediments: Localized mineral dissolution. Geomechanics Energy Environ. 7, 1–9. doi:10.1016/j.gete.2016.06.001
Cha, M., and Santamarina, J. C. (2019). Localized dissolution in sediments under stress. Granul. Matter 21, 79–11. doi:10.1007/s10035-019-0932-4
Chiquet, P., Daridon, J. L., Broseta, D., and Thibeau, S. (2007). CO2/water interfacial tensions under pressure and temperature conditions of CO2 geological storage. Energy Convers. Manag. 48, 736–744. doi:10.1016/j.enconman.2006.09.011
Chun, B. S., and Wilkinson, G. T. (1995). Interfacial tension in high-pressure carbon dioxide mixtures. Ind. Eng. Chem. Res. 34, 4371–4377. doi:10.1021/ie00039a029
Correns, C. W. (1949). Growth and dissolution of crystals under linear pressure. Discuss. Faraday Soc. 5, 267. doi:10.1039/df9490500267
Crundwell, F. K. (2014). The mechanism of dissolution of minerals in acidic and alkaline solutions: Part I — a new theory of non-oxidation dissolution. Hydrometallurgy 149, 252–264. doi:10.1016/j.hydromet.2014.06.009
Da Rocha, S. R. P., Harrison, K. L., and Johnston, K. P. (1999). Effect of surfactants on the interfacial tension and emulsion formation between water and carbon dioxide. Langmuir 15, 419–428. doi:10.1021/la980844k
Daval, D., Hellmann, R., Saldi, G. D., Wirth, R., and Knauss, K. G. (2013). Linking nm-scale measurements of the anisotropy of silicate surface reactivity to macroscopic dissolution rate laws: New insights based on diopside. Geochim. Cosmochim. Acta 107, 121–134. doi:10.1016/j.gca.2012.12.045
de Gennes, P. G. (1985). Wetting: Statics and dynamics. Rev. Mod. Phys. 57 (3), 827–863. doi:10.1103/revmodphys.57.827
Demirel, Y. (2014). Nonequilibrium thermodynamics: Transport and rate processes in physical, chemical and biological systems. Elsevier. doi:10.1016/C2012-0-00459-0
Derr, N. J., Fronk, D. C., Weber, C. A., Mahadevan, A., Rycroft, C. H., and Mahadevan, L. (2020). Flow-driven branching in a frangible porous medium. Phys. Rev. Lett. 125, 158002. doi:10.1103/PhysRevLett.125.158002
DiCarlo, D. A. (2013). Stability of gravity-driven multiphase flow in porous media: 40 Years of advancements. Water Resour. Res. 49, 4531–4544. doi:10.1002/wrcr.20359
Dong, Z., Li, Y., Lin, M., and Li, M. (2013). A study of the mechanism of enhancing oil recovery using supercritical carbon dioxide microemulsions. Pet. Sci. 10, 91–96. doi:10.1007/s12182-013-0254-9
Drelich, J. W., Boinovich, L., Chibowski, E., Della Volpe, C., Hołysz, L., Marmur, A., et al. (2020). Contact angles: History of over 200 years of open questions. Surf. Innov. 8, 3–27. doi:10.1680/jsuin.19.00007
Duan, Z., and Sun, R. (2003). An improved model calculating CO2 solubility in pure water and aqueous NaCl solutions from 273 to 533 K and from 0 to 2000 bar. Chem. Geol. 193, 257–271. doi:10.1016/S0009-2541(02)00263-2
Duan, Z., Sun, R., Zhu, C., and Chou, I. M. (2006). An improved model for the calculation of CO2 solubility in aqueous solutions containing Na+, K+, Ca2+, Mg2+, Cl−, and SO42. Mar. Chem. 98 (2-4), 131–139. doi:10.1016/j.marchem.2005.09.001
Effenberger, H., Mereiter, Κ., and Zemann, J. (1981). Crystal structure refinements of magnesite, calcite, rhodochrosite, siderite, smithonite, and dolomite, with discussion of some aspects of the stereochemistry of calcite type carbonates. Z. für Krist. - Cryst. Mat. 156, 233–244. doi:10.1524/zkri.1981.156.14.233
Emami-Meybodi, H., Hassanzadeh, H., Green, C. P., and Ennis-King, J. (2015). Convective dissolution of CO2 in saline aquifers: Progress in modeling and experiments. Int. J. Greenh. Gas Control 40, 238–266. doi:10.1016/j.ijggc.2015.04.003
Eral, H. B., ’t Mannetje, D. J. C. M., and Oh, J. M. (2013). Contact angle hysteresis: A review of fundamentals and applications. Colloid Polym. Sci. 291, 247–260. doi:10.1007/s00396-012-2796-6
Espinoza, D. N., Kim, S. H., and Santamarina, J. C. (2011). CO2 geological storage—geotechnical implications. KSCE J. Civ. Eng. 15 (4), 707–719. doi:10.1007/s12205-011-0011-9
Espinoza, D. N., and Santamarina, J. C. (2010). Water-CO2-mineral systems: Interfacial tension, contact angle, and diffusion - implications to CO2 geological storage. Water Resour. Res. 46, 1–10. doi:10.1029/2009WR008634
Espinoza, D. N., and Santamarina, J. C. (2012). Clay interaction with liquid and supercritical CO2: The relevance of electrical and capillary forces. Int. J. Greenh. Gas Control 10, 351–362. doi:10.1016/j.ijggc.2012.06.020
Espinoza, D. N., and Santamarina, J. C. (2017). CO2 breakthrough—caprock sealing efficiency and integrity for carbon geological storage. Int. J. Greenh. Gas Control 66, 218–229. doi:10.1016/j.ijggc.2017.09.019
Etheridge, M. A., Wall, V. J., Cox, S. F., and Vernon, R. H. (1984). High fluid pressures during regional metamorphism and deformation: Implications for mass transport and deformation mechanisms. J. Geophys. Res. 89, 4344–4358. doi:10.1029/JB089iB06p04344
Fischer, C., Arvidson, R. S., and Lüttge, A. (2012). How predictable are dissolution rates of crystalline material? Geochim. Cosmochim. Acta 98, 177–185. doi:10.1016/j.gca.2012.09.011
Fowler, A. C., and Yang, X. (1999). Pressure solution and viscous compaction in sedimentary basins. J. Geophys. Res. 104, 12989–12997. doi:10.1029/1998JB900029
Fredd, C. N. (2000). “Dynamic model of wormhole formation demonstrates conditions for effective skin reduction during carbonate matrix acidizing,” in Proceeding of the SPE Permian Basin Oil Gas Recover. Conf. Proc., Midland, Texas, March 2000. doi:10.2118/59537-ms
Fredd, C. N., and Fogler, H. S. (1998). Alternative stimulation fluids and their impact on carbonate acidizing. SPE J. 3, 34–41. doi:10.2118/31074-PA
Freund, P., Bachu, S., and Gupta, M. (2006). Annex I - properties of CO2 and carbon-based fuels. Carbon N. Y., 383–400.
Furrer, G., Zysset, M., and Schindler, P. W. (1993). “Weathering kinetics of montmorillonite: Investigations in batch and mixed-flow reactors,” in Geochemistry of clay-pore fluid interactions (London: Chapman & Hall), 243–262.
Gachuz-Muro, H., and Sohrabi, M. (2013). “Effects of brine on crude oil viscosity at different temperature and brine composition - heavy oil/water interaction,” in Proceeding of the 75th Eur. Assoc. Geosci. Eng. Conf. Exhib. 2013 Inc. SPE Eur. 2013 Chang. Front., London, UK, June 2013, 1878–1889. doi:10.2118/164910-ms
García, A. V., Thomsen, K., and Stenby, E. H. (2005). Prediction of mineral scale formation in geothermal and oilfield operations using the extended UNIQUAC model. Geothermics 34, 61–97. doi:10.1016/j.geothermics.2004.11.002
Gauteplass, J., Almenningen, S., Barth, T., and Ersland, G. (2020). Hydrate plugging and flow remediation during CO2 injection in sediments. Energies 13, 4511. doi:10.3390/EN13174511
Gautier, J.-M., Oelkers, E. H., and Schott, J. (2001). Are quartz dissolution rates proportional to B.E.T. surface areas? Geochim. Cosmochim. Acta 65, 1059–1070. doi:10.1016/S0016-7037(00)00570-6
Georgiadis, A., Llovell, F., Bismarck, A., Blas, F. J., Galindo, A., Maitland, G. C., et al. (2010). Interfacial tension measurements and modelling of (carbon dioxide + n-alkane) and (carbon dioxide + water) binary mixtures at elevated pressures and temperatures. J. Supercrit. Fluids 55, 743–754. doi:10.1016/j.supflu.2010.09.028
Goldberg, R. N., and Parker, V. B. (1985). Thermodynamics of solution of SO2(g) in water and of aqueous sulfur dioxide solutions. J. Res. Natl. Bur. Stand. (1977). 90, 341. doi:10.6028/jres.090.024
Golfier, F., Zarcone, C., Bazin, B., Lenormand, R., Lasseux, D., and Quintard, M. (2002). On the ability of a Darcy-scale model to capture wormhole formation during the dissolution of a porous medium. J. Fluid Mech. 457, 213–254. doi:10.1017/S0022112002007735
Grandstaff, D. E. (1978). Changes in surface area and morphology and the mechanism of forsterite dissolution. Geochim. Cosmochim. Acta 42, 1899–1901. doi:10.1016/0016-7037(78)90245-4
Gu, Y., Hou, P., and Luo, W. (2013). Effects of four important factors on the measured minimum miscibility pressure and first-contact miscibility pressure. J. Chem. Eng. Data 58, 1361–1370. doi:10.1021/je4001137
Gysi, A. P., and Stefánsson, A. (2012). Experiments and geochemical modeling of CO2 sequestration during hydrothermal basalt alteration. Chem. Geol. 306307, 10–28. doi:10.1016/j.chemgeo.2012.02.016
Haghi, R. K., Chapoy, A., Peirera, L. M. C., Yang, J., and Tohidi, B. (2017). pH of CO2 saturated water and CO2 saturated brines: Experimental measurements and modelling. Int. J. Greenh. Gas Control 66, 190–203. doi:10.1016/j.ijggc.2017.10.001
Han, W. S., Stillman, G. A., Lu, M., Lu, C., McPherson, B. J., and Park, E. (2010). Evaluation of potential nonisothermal processes and heat transport during CO2 sequestration. J. Geophys. Res. 115, B07209. doi:10.1029/2009JB006745
Hayes, K. F., and Katz, L. E. (1996). “Application of X-ray absorption spectroscopy for surface complexation modelling of metal ion sorption,” in Physics and Chemistry of mineral surfaces. Editor P. V. Brady (Baton Rouge): CRC Press), 147–223.
He, D., Xu, R., Ji, T., and Jiang, P. (2022). Experimental investigation of the mechanism of salt precipitation in the fracture during CO2 geological sequestration. Int. J. Greenh. Gas Control 118, 103693. doi:10.1016/j.ijggc.2022.103693
Hebach, A., Oberhof, A., Dahmen, N., Kögel, A., Ederer, H., and Dinjus, E. (2002). Interfacial tension at elevated pressures-measurements and correlations in the water + carbon dioxide system. J. Chem. Eng. Data 47, 1540–1546. doi:10.1021/je025569p
Hemmati-Sarapardeh, A., Ayatollahi, S., Ghazanfari, M. H., and Masihi, M. (2014). Experimental determination of interfacial tension and miscibility of the CO2-crude oil system; Temperature, pressure, and composition effects. J. Chem. Eng. Data 59, 61–69. doi:10.1021/je400811h
Hesse, M. A., Orr, F. M., and Tchelepi, H. A. (2008). Gravity currents with residual trapping. J. Fluid Mech. 611, 35–60. doi:10.1017/S002211200800219X
Hoteit, H., Fahs, M., and Soltanian, M. R. (2019). Assessment of CO2 injectivity during sequestration in depleted gas reservoirs. Geosciences 9 (5), 199. doi:10.3390/geosciences9050199
Houben, M., van Geijn, R., van Essen, M., Borneman, Z., and Nijmeijer, K. (2021). Supercritical CO2 permeation in glassy polyimide membranes. J. Memb. Sci. 620, 118922. doi:10.1016/j.memsci.2020.118922
Hough, E. W., Wood, B. B., and Rzasa, M. J. (1952). Adsorption at water–helium, –methane and –nitrogen interfaces at pressures to 15, 000 P.s.i.a. J. Phys. Chem. 56, 996–999. doi:10.1021/j150500a017
Hu, Y. F., and Guo, T. M. (2005). Effect of the structures of ionic liquids and alkylbenzene-derived amphiphiles on the inhibition of asphaltene precipitation from CO 2-injected reservoir oils. Langmuir 21, 8168–8174. doi:10.1021/la050212f
Huggins, M. L., and Sun, K.-H. (1946). Energy additivity in oxygen-containing crystals and glasses. J. Phys. Chem. 50, 319–328. doi:10.1021/j150448a003
Huhtamäki, T., Tian, X., Korhonen, J. T., and Ras, R. (2018). Surface-wetting characterization using contact-angle measurements. Nat. Protoc. 13, 1521–1538. doi:10.1038/s41596-018-0003-z
Islam, A., Nia, K. A. K., Sepehrnoori, K., and Patzek, T. (2014). Effects of geochemical reaction on double diffusive natural convection of CO2 in brine saturated geothermal reservoir. Energy Procedia 63, 5357–5377. doi:10.1016/j.egypro.2014.11.568
James, L., Palandri, K., Yousif, K., and Kharaka, K. (2004). U.S. GEOLOGICAL SURVEY OPEN FILE REPORT (OF 2004-1068) National Energy Technology Laboratory. Steve Jobs. Menlo Park, NY: Department of Energy.
Jang, J., Narsilio, G. A., and Santamarina, J. C. (2011). Hydraulic conductivity in spatially varying media-a pore-scale investigation. Geophys. J. Int. 184 (3), 1167–1179. doi:10.1111/j.1365-246x.2010.04893.x
Jiang, L., Wang, S., Abudula, A., Liu, Y., and Song, Y. (2019). The effect of density difference on the development of density-driven convection under large Rayleigh number. Int. J. Heat. Mass Transf. 139, 1087–1095. doi:10.1016/j.ijheatmasstransfer.2019.05.027
Karnanda, W., Benzagouta, M. S., AlQuraishi, A., and Amro, M. M. (2013). Effect of temperature, pressure, salinity, and surfactant concentration on IFT for surfactant flooding optimization. Arab. J. Geosci. 6, 3535–3544. doi:10.1007/s12517-012-0605-7
Kiepe, J., Horstmann, S., Fischer, K., and Gmehling, J. (2002). Experimental determination and prediction of gas solubility data for CO2+H2O mixtures containing NaCl or KCl at temperatures between 313 and 393K and pressures up to 10 MPa. Ind. Eng. Chem. Res. 41 (17), 4393–4398. doi:10.1021/ie020154i
Kim, S., Espinoza, D. N., Jung, J., Cha, M., and Santamarina, J. C. (2019). “Carbon geological storage: Coupled processes, engineering and monitoring,” in Science of carbon storage in deep saline formations (Elsevier), 383–407. doi:10.1016/B978-0-12-812752-0.00017-4
Kim, S., and Santamarina, J. C. (2014). Engineered CO2 injection: The use of surfactants for enhanced sweep efficiency. Int. J. Greenh. Gas Control 20, 324–332. doi:10.1016/j.ijggc.2013.11.018
Kim, S., and Santamarina, J. C. (2015). Reactive fluid flow in CO2 storage reservoirs: A 2-D pore network model study. Greenh. Gas. Sci. Technol. 5, 462–473. doi:10.1002/ghg.1487
Kim, S., and Santamarina, J. C. (2016). Geometry‐coupled reactive fluid transport at the fracture scale: Application to CO 2 geologic storage. Geofluids 16 (2), 329–341. doi:10.1111/gfl.12152
Knauss, K. G., Nguyen, S. N., and Weed, H. C. (1993). Diopside dissolution kinetics as a function of pH, CO2, temperature, and time. Geochim. Cosmochim. Acta 57, 285–294. doi:10.1016/0016-7037(93)90431-U
Kneafsey, T. J., and Pruess, K. (2010). Laboratory flow experiments for visualizing carbon dioxide-induced, density-driven brine convection. Transp. Porous Media 82, 123–139. doi:10.1007/s11242-009-9482-2
Koschel, D., Coxam, J.‐Y., Rodier, L., and Majer, V. (2006). Enthalpy and solubility data of CO2 in water and NaCl(aq) at conditions of interest for geological sequestration. Fluid Phase Equilib. 247 (1–2), 107–120. doi:10.1016/j.fluid.2006.06.006
Kvamme, B., Kuznetsova, T., Hebach, A., Oberhof, A., and Lunde, E. (2007). Measurements and modelling of interfacial tension for water + carbon dioxide systems at elevated pressures. Comput. Mat. Sci. 38, 506–513. doi:10.1016/j.commatsci.2006.01.020
Lahti, S. I., Raivio, P., and Laitakari, I. (2005). Orbicular rocks in Finland, with contributions by paula raivio and ilkka laitakari. Espoo: Geological Survey of Finland.
Lee, B. Y., and Kurtis, K. E. (2017). Effect of pore structure on salt crystallization damage of cement-based materials: Consideration of w/b and nanoparticle use. Cem. Concr. Res. 98, 61–70. doi:10.1016/j.cemconres.2017.04.002
Li, H., Yang, D., and Tontiwachwuthikul, P. (2012). Experimental and theoretical determination of equilibrium interfacial tension for the solvent(s)-CO 2-heavy oil systems. Energy fuels. 26, 1776–1786. doi:10.1021/ef201860f
Liesegang, R. E. (1896). Ueber einige Eigenschaften von Gallerten. Naturwissenschaftliche. Wochenschrift 11, 353.
Liu, Q., and Santamarina, J. C. (2022). Fluid- driven instabilities in granular media: From viscous fingering and dissolution wormholes to desiccation cracks and ice lenses. Front. Mech. Eng. 8, 861554. doi:10.3389/fmech.2022.861554
Maliva, R. G., and Siever, R. (1988). Mechanism and controls of silicification of fossils in limestones. J. Geol. 96, 387–398. doi:10.1086/629235
Markham, A. E., and Kobe, K. A. (1941). The solubility of carbon dioxide in aqueous solutions of sulfuric and perchloric acids at 25°. J. Am. Chem. Soc. 63, 1165–1166. doi:10.1021/ja01849a507
Menke, H. P., Bijeljic, B., and Blunt, M. J. (2017). Dynamic reservoir-condition microtomography of reactive transport in complex carbonates: Effect of initial pore structure and initial brine pH. Geochim. Cosmochim. Acta 204, 267–285. doi:10.1016/j.gca.2017.01.053
Miri, R., Aagaard, P., and Hellevang, H. (2014). Examination of CO2 –so 2 solubility in water by SAFT1. Implications for CO2 transport and storage. J. Phys. Chem. B 118, 10214–10223. doi:10.1021/jp505562j
Miri, R., van Noort, R., Aagaard, P., and Hellevang, H. (2015). New insights on the physics of salt precipitation during injection of CO2 into saline aquifers. Int. J. Greenh. Gas Control 43, 10–21. doi:10.1016/j.ijggc.2015.10.004
Nabika, H., Itatani, M., and Lagzi, I. (2020). Pattern formation in precipitation reactions: The Liesegang phenomenon. Langmuir 36, 481–497. doi:10.1021/acs.langmuir.9b03018
Nakhaei-Kohani, R., Taslimi-Renani, E., Hadavimoghaddam, F., Mohammadi, M.-R., and Hemmati-Sarapardeh, A. (2022). Modeling solubility of CO2–N2 gas mixtures in aqueous electrolyte systems using artificial intelligence techniques and equations of state. Sci. Rep. 12, 3625. doi:10.1038/s41598-022-07393-z
National Academies of Sciences Engineering and Medicine (2020). Characterization, modeling, monitoring, and remediation of fractured rock. Washington, DC: The National Academies Press. doi:10.17226/21742
Ng, K., and Santamarina, J. C. (2022). Mechanical and hydraulic properties of carbonate rocks - the critical role of porosity. J. Rock Mech. Geotech. Eng. doi:10.1016/j.jrmge.2022.07.017
Nobakht, M., Moghadam, S., and Gu, Y. (2008). Mutual interactions between crude oil and CO2 under different pressures. Fluid Phase Equilib. 265, 94–103. doi:10.1016/j.fluid.2007.12.009
O’Connor, W. K., Dahlin, D. C., Nilsen, D. N., Rush, G. E., and WaltersRichard P Turner, P. C. (2001). “Carbon dioxide sequestration by direct mineral carbonation: Results from recent studies and current status,” in First national conference on carbon sequestration (Washington, DC.
O’Connor, W. K., Dahlin, D. C., Rush, G. E., Dahlin, C. L., and Collins, W. K. (2002). Carbon dioxide sequestration by direct mineral carbonation: Process mineralogy of feed and products. Min. Metall. Explor. 19, 95–101. doi:10.1007/BF03403262
Oelkers, E. H., Declercq, J., Saldi, G. D., Gislason, S. R., and Schott, J. (2018). Olivine dissolution rates: A critical review. Chem. Geol. 500, 1–19. doi:10.1016/j.chemgeo.2018.10.008
Oldenburg, C. M. (2007). Joule-Thomson cooling due to CO2 injection into natural gas reservoirs. Energy Convers. Manag. 48, 1808–1815. doi:10.1016/j.enconman.2007.01.010
Palandri, J. L., and Kharaka, Y. K. (2004). A compilation of rate parameters of water-mineral interaction kinetics for application to geochemical modeling. Open-File Report. USGS Numbered S.
Panjarian, S., and Sultan, R. (2001). Crystal selection and Liesegang banding in dynamic precipitate systems. Collect. Czechoslov. Chem. Commun. 66, 541–554. doi:10.1135/cccc20010541
Park, J. Y., Lim, J. S., Yoon, C. H., Lee, C. H., and Park, K. P. (2005). Effect of a fluorinated sodium bis(2-ethylhexyl) sulfosuccinate (aerosol-OT, AOT) analogue surfactant on the interfacial tension of CO 2 + water and CO2 + Ni-plating solution in near- and supercritical CO2. J. Chem. Eng. Data 50, 299–308. doi:10.1021/je0499667
Peng, C., Crawshaw, J. P., Maitland, G. C., Martin Trusler, J. P., and Vega-Maza, D. (2013). The pH of CO2-saturated water at temperatures between 308 K and 423 K at pressures up to 15 MPa. J. Supercrit. Fluids 82, 129–137. doi:10.1016/j.supflu.2013.07.001
Phuoc, T. X., and Massoudi, M. (2021). Using CO2 as a cooling fluid for power plants: A novel approach for CO2 storage and utilization. Appl. Sci. (Basel). 11, 4974. doi:10.3390/APP11114974
Pokrovsky, O. S., Golubev, S. V., and Schott, J. (2005). Dissolution kinetics of calcite, dolomite and magnesite at 25 °C and 0 to 50 atm pCO2. Chem. Geol. 217, 239–255. doi:10.1016/j.chemgeo.2004.12.012
Pollet-Villard, M., Daval, D., Ackerer, P., Saldi, G. D., Wild, B., Knauss, K. G., et al. (2016). Does crystallographic anisotropy prevent the conventional treatment of aqueous mineral reactivity? A case study based on K-feldspar dissolution kinetics. Geochim. Cosmochim. Acta 190, 294–308. doi:10.1016/j.gca.2016.07.007
Rácz, Z. (1999). formation of Liesegang patterns. Phys. A Stat. Mech. its Appl. 274, 50–59. doi:10.1016/S0378-4371(99)00432-X
Rezk, M. G., and Foroozesh, J. (2019). Phase behavior and fluid interactions of a CO2-Light oil system at high pressures and temperatures. Heliyon 5, e02057. doi:10.1016/j.heliyon.2019.e02057
Rutter, E. H. (1983). Pressure solution in nature, theory and experiment. J. Geol. Soc. Lond. 140, 725–740. doi:10.1144/gsjgs.140.5.0725
Sanaei, A., Varavei, A., and Sepehrnoori, K. (2019). Mechanistic modeling of carbonated waterflooding. J. Pet. Sci. Eng. 178, 863–877. doi:10.1016/j.petrol.2019.04.001
Sargent, J. P., Tredwell, S., Dixon, D. G., Buxton, A. L., Shanahan, M. E. R., Padday, J. F., et al. (2005). Handbook of adhesion. Chichester, UK: John Wiley & Sons, 579–620. doi:10.1002/0470014229.ch21
Savary, V., Berger, G., Dubois, M., Lacharpagne, J.-C., Pages, A., Thibeau, S., et al. (2012). The solubility of CO2+H2S mixtures in water and 2M NaCl at 120°C and pressures up to 35MPa. Int. J. Greenh. Gas Control 10, 123–133. doi:10.1016/j.ijggc.2012.05.021
Schmelzer, J. W. P., Zanotto, E. D., and Fokin, V. M. (2005). Pressure dependence of viscosity. J. Chem. Phys. 122, 074511. doi:10.1063/1.1851510
Schmid, R. (2001). Recent advances in the description of the structure of water, the hydrophobic effect, and the like-dissolves-like rule. Monatsh. fur Chem. 132, 1295–1326. doi:10.1007/s007060170019
Schott, J., Berner, R. A., and Sjöberg, E. L. (1981). Mechanism of pyroxene and amphibole weathering—I. Experimental studies of iron-free minerals. Geochim. Cosmochim. Acta 45, 2123–2135. doi:10.1016/0016-7037(81)90065-X
Schott, J., and Berner, R. A. (1983). X-ray photoelectron studies of the mechanism of iron silicate dissolution during weathering. Geochim. Cosmochim. Acta 47, 2233–2240. doi:10.1016/0016-7037(83)90046-7
Shafabakhsh, P., Ataie-Ashtiani, B., Simmons, C. T., Younes, A., and Fahs, M. (2021). Convective-reactive transport of dissolved CO2 in fractured-geological formations. Int. J. Greenh. Gas Control 109, 103365. doi:10.1016/j.ijggc.2021.103365
Shin, H., Santamarina, J. C., and Cartwright, J. A. (2008). Contraction-driven shear failure in compacting uncemented sediments. Geol. 36, 931. doi:10.1130/G24951A.1
Shin, H., Santamarina, J. C., and Cartwright, J. A. (2010). Displacement field in contraction-driven faults. J. Geophys. Res. 115, B07408. doi:10.1029/2009JB006572
Shin, H., and Santamarina, J. C. (2010). Fluid-driven fractures in uncemented sediments: Underlying particle-level processes. Earth Planet. Sci. Lett. 299 (1-2), 180–189. doi:10.1016/j.epsl.2010.08.033
Shin, H., and Santamarina, J. C. (2009). Mineral dissolution and the evolution of k0. J. Geotech. Geoenviron. Eng. 135, 1141–1147. doi:10.1061/(ASCE)GT.1943-5606.0000053
Shin, H., and Santamarina, J. C. (2011). Open-mode discontinuities in soils. Geotech. Lett. 1, 95–99. doi:10.1680/geolett.11.00014
Simeoni, G. G., Bryk, T., Gorelli, F. A., Krisch, M., Ruocco, G., Santoro, M., et al. (2010). The Widom line as the crossover between liquid-like and gas-like behaviour in supercritical fluids. Nat. Phys. 6, 503–507. doi:10.1038/nphys1683
Simon, R., and Graue, D. J. (1965). Generalized correlations for predicting solubility, swelling and viscosity behavior of CO2 -crude oil systems. J. Pet. Technol. 17, 102–106. doi:10.2118/917-pa
Sloan, E. D. (2010). Natural gas hydrates in flow assurance. Burlington, MA: Gulf Professional Publishing. doi:10.1016/C2009-0-62311-4
Snæbjörnsdóttir, S. Ó., Gislason, S. R., Galeczka, I. M., and Oelkers, E. H. (2018). Reaction path modelling of in-situ mineralisation of CO2 at the CarbFix site at Hellisheidi, SW-Iceland. Geochim. Cosmochim. Acta 220, 348–366. doi:10.1016/j.gca.2017.09.053
Snæbjörnsdóttir, S. Ó., Sigfússon, B., Marieni, C., Goldberg, D., Gislason, S. R., and Oelkers, E. H. (2020). Carbon dioxide storage through mineral carbonation. Nat. Rev. Earth Environ. 1, 90–102. doi:10.1038/s43017-019-0011-8
Stumm, W., and Morgan, J. J. (1996). Aquatic Chemistry, Chemical Equilibria and Rates in Natural Waters. J. Chem. Educ. 3rd Edn. New York: 73.
Sutjiadi-Sia, Y., Jaeger, P., and Eggers, R. (2008). Interfacial phenomena of aqueous systems in dense carbon dioxide. J. Supercrit. Fluids 46, 272–279. doi:10.1016/j.supflu.2008.06.001
Sverdrup, H. U. (1990). The kinetics of base cation release due to chemical weathering. Lund, Sweden: Lund University Press.
Taber, S. (1916). The growth of crystals under external pressure. Am. J. Sci. s4-41, 532–556. doi:10.2475/ajs.s4-41.246.532
Talman, S., Shokri, A. R., Chalaturnyk, R., and Nickel, E. (2020). “Salt precipitation at an active CO2 injection site,” in Gas injection into geological formations and related topics (John Wiley & Sons), 183–199. doi:10.1002/9781119593324.ch11
Van der Meer, L. G. H. (1993). The conditions limiting CO2 storage in aquifers. Energy Convers. Manag. 34, 959–966. doi:10.1016/0196-8904(93)90042-9
Velbel, M. A. (1999). Bond strength and the relative weathering rates of simple orthosilicates. Am. J. Sci. 299, 679–696. doi:10.2475/ajs.299.7-9.679
Verma, M. K. (2015). Fundamentals of carbon dioxide-enhanced oil recovery (CO2-EOR): A supporting document of the assessment methodology for hydrocarbon recovery using CO2-EOR associated with carbon sequestration. Washington, DC: US Department of the Interior, US Geological Survey, 19.
Vilarrasa, V., Rinaldi, A. P., and Rutqvist, J. (2017). Long-term thermal effects on injectivity evolution during CO2 storage. Int. J. Greenh. Gas Control 64, 314–322. doi:10.1016/j.ijggc.2017.07.019
Vilarrasa, V., and Rutqvist, J. (2017). Thermal effects on geologic carbon storage. Earth. Sci. Rev. 165, 245–256. doi:10.1016/j.earscirev.2016.12.011
Wang, X., Zhang, S., and Gu, Y. (2010). Four important onset pressures for mutual interactions between each of three crude oils and CO2. J. Chem. Eng. Data 55, 4390–4398. doi:10.1021/je1005664
Wiltschko, D. V., and Morse, J. W. (2001). Crystallization pressure versus “crack seal” as the mechanism for banded veins. Geology 29, 79. doi:10.1130/0091-7613(2001)029<0079:CPVCSA>2.0.CO;2
Xiong, W., Wells, R. K., Horner, J. A., Schaef, H. T., Skemer, P. A., and Giammar, D. E. (2018). CO 2 mineral sequestration in naturally porous basalt. Environ. Sci. Technol. Lett. 5, 142–147. doi:10.1021/acs.estlett.8b00047
Yasunishi, A., and Yoshida, F. (1979). Solubility of carbon dioxide in aqueous electrolyte solutions. J. Chem. Eng. Data 24, 11–14. doi:10.1021/je60080a007
Young, T. (1805). III. An essay on the cohesion of fluids. Philos. Trans. R. Soc. Lond. 95, 65–87. doi:10.1098/rstl.1805.0005
Zheng, C., Brunner, M., Li, H., Zhang, D., and Atkin, R. (2019). Dissolution and suspension of asphaltenes with ionic liquids. Fuel 238, 129–138. doi:10.1016/j.fuel.2018.10.070
Zolghadr, A., Escrochi, M., and Ayatollahi, S. (2013). Temperature and composition effect on CO2 miscibility by interfacial tension measurement. J. Chem. Eng. Data 58, 1168–1175. doi:10.1021/je301283e
Glossary
c [mol/l] Solute concentration (0: at saturation)
Cp [J/K] Heat capacity
D [m2/s] Molecular diffusion coefficient
d* [m] Characteristic pore diameter
Da [] Damköhler number
e [] Void ratio
E [GPa] Young’s modulus
g [m/s] Gravitational acceleration
H [m] Height of the fluid column (CO2: carbon dioxide column; R: reservoir)
k [mol m−2 s−1] Rate constant of mineral dissolution
k0 [] Lateral coefficient earth pressure (0: at rest; a: Rankine’s active case)
kH [mol L−1 atm−1] Henry’s constant
khyd [m2] Permeability
Lch [m] Channel length
l0 [m] Intermolecular distance
M [g/mol] Molar mass (CO2; silic: silicate minerals)
P [Pa] Pressure (0: initial pressure; CO2: partial pressure CO2; nw: non-wetting fluid; w: wetting fluid; crys: on a growing crystal; sol: solution)
Pe [] Péclet number
R [J mol−1 K−1] Gas constant
Ra [] Rayleigh number
r [m] Radius of the interface
rd [mol/s] Mineral dissolution rate
S [] Supersaturation
s [m2] Surface area
Ss [m2/g] Specific surface area
Sw [] Degree of water saturation
SD [kg/m3] Storage density in terms of kg of CO2 per m3 of the reservoir
T [K] Absolute temperature
Tp [m] Plume thickness
t [s] Time (adv: advection; diff: diffusion; r: reactive)
Vm [m3/mol] Mineral molar volume
v [m/s] Average flow velocity
z [m] Height of the sediment column
zw [m] Height of the water column above the seafloor
α [K−1] The coefficient of thermal expansion
β [] Factor related to the pore size distribution
γ [N/m] Interfacial tension (FS: fluid-solid; LS: liquid-solid; LF: fluid-liquid)
ΔH [kJ/kg] Enthalpy change in phase transformation
ε[] Strain
θ [°] Contact angle (A: advancing; R: receding)
κ [1/s] Kinetic rate of mineral dissolution
μ [µPa·s] Fluid Viscosity (w: water)
μJT [] Joule-Thomson coefficient
Πseal [] Dimensionless ratio (seal: sealing number; stability: stability number)
ρ [kg/m3] Density (b: bulk; CO2; hyd: hydrate; m: mineral; W: water; 0: initial fluid density)
σ’ [Pa] Effective stress (h: horizontal; v: vertical; z0: under zero lateral strain conditions)
χCO2 [mol/L] Solubility of CO2
φ [] Porosity
ψ [] Geometric fabric factor
Keywords: porous media, carbon geological storage, dissolution, mineralization, oil recovery, thermal effect, seals
Citation: Liu Q, Benitez MD, Xia Z and Santamarina JC (2022) Pore-scale phenomena in carbon geological storage (Saline aquifers—Mineralization—Depleted oil reservoirs). Front. Energy Res. 10:979573. doi: 10.3389/fenrg.2022.979573
Received: 27 June 2022; Accepted: 15 August 2022;
Published: 29 September 2022.
Edited by:
Andreas Busch, Heriot-Watt University, United KingdomReviewed by:
Jiaqi Wang, Harbin Engineering University, ChinaMarwan Fahs, National School for Water and Environmental Engineering, France
Copyright © 2022 Liu, Benitez, Xia and Santamarina. This is an open-access article distributed under the terms of the Creative Commons Attribution License (CC BY). The use, distribution or reproduction in other forums is permitted, provided the original author(s) and the copyright owner(s) are credited and that the original publication in this journal is cited, in accordance with accepted academic practice. No use, distribution or reproduction is permitted which does not comply with these terms.
*Correspondence: J. Carlos Santamarina, Y2FybG9zLnNhbnRhbWFyaW5hQGthdXN0LmVkdS5zYQ==