 Zhenxu Zhang
 Junsong Jia
 Yali Guo1,2
 Chundi Chen
- 1School of Geography and Environment, Jiangxi Normal University, Nanchang, China
- 2Key Laboratory of Poyang Lake Wetland and Watershed Research, Ministry of Education, Jiangxi Normal University, Nanchang, China
- 3School of Architecture and Urban Planning, Tongji University, Shanghai, China
Achieving global peaking of carbon dioxide (CO2) emissions as early as possible is a common goal for all countries. However, CO2 emissions in the northwest China still show a rapid growth trend. Thus, we used the Low Emissions Analysis Platform (LEAP) model to build three scenarios to investigate the peak of CO2 emissions and reduction pathways in five northwestern provinces of China. The results show that: 1) the CO2 emissions of five northwestern provinces under the baseline, the policy, and the green scenarios will peak in 2035 (1663.46 × 106 tonnes), 2031 (1405.00 × 106 tonnes), and 2027 (1273.96 × 106 tonnes), respectively. 2) The CO2 emissions of all provinces, except Qinghai, will not peak before 2030 in the baseline scenario. Under the policy and green scenarios, each province will achieve the peak of CO2 emissions by 2030. 3) The CO2 emissions from agriculture, transportation, and other sectors will peak before 2030 under the baseline scenario. The CO2 emissions from construction will peak before 2030 in policy scenario. The industry and commerce will peak before 2030 in green scenario. 4) The emission reduction effect indicates that CO2 emissions from 2020 to 2040 will be reduced by 4137.70 × 106 tonnes in the policy scenario and 7201.46 × 106 tonnes in the green scenario. The industrial coal and thermal power are the sectors with the greatest potential to reduce CO2 emissions. Accelerating the restructuring of industries and energy structures and improving technologies to reduce energy intensity can promote the achievement of the peak in CO2 emissions by 2030.
1 Introduction
Global warming caused by CO2 emissions has become a serious threat to human survival and development. In 2015, the Paris Agreement clearly states that the global average temperature cannot be more than 1.5–2°C above pre-industrial levels, with parties aiming to reach a global peak in greenhouse gas emissions as soon as possible (The United Nations Framework Convention on Climate Change, 2015). As the world’s largest carbon emitter, China has also made a series of emission reduction measures and pledged to achieve the peaking of CO2 emissions by 2030 (Intended Nationally Determined Contributions, 2015). However, it will require the joint efforts of all provinces to achieve these ambitious goals.
The five northwestern provinces of China, which contain Shaanxi, Gansu, Ningxia, Qinghai and Xinjiang (See Supplementary Material), are deeply inland and are not conducive to attracting investment compared with the eastern coastal regions. In addition, the implementation of open-door policy has accelerated the outflow of talent and technology from the region, resulting in a lagging economic and technological level in the region (Fu et al., 2015; Zeng et al., 2019). However, abundant fossil energy is an inherent advantage of the region (Chen et al., 2010). In recent years, with its advantages and the support of policies such as “One Belt, One Road” and Western Development, the economy of the region is expected to maintain a rapid growth trend. Economic development will inevitably lead to the massive consumption of fossil energy, thus producing more greenhouse gases. This will have a negative impact on achieving the target of the peaking of CO2 emissions by 2030. Therefore, the scenario analysis of CO2 emission peaks and emission reduction pathways in northwest China is of great practical importance.
The methods of estimating energy demand and CO2 emissions are mainly divided into three categories: top-down, bottom-up, and hybrid models. Top-down models, such as the computable general equilibrium model, can simulate the response of sectors to policy shocks (Krook-Riekkola et al., 2017). However, they cannot explain the specific pathway of the peak in CO2 emissions (Yu et al., 2014; Yan et al., 2021). Hybrid models, such as the global change assessment model, are fully functional, but their structures are complex (Zhang et al., 2019). The Low Emissions Analysis Platform (LEAP) model is a typical bottom-up model that includes energy supply, energy conversion, and final energy demand. It can forecast the energy demand of a country or region and calculate the greenhouse-gas emissions (Heaps, 2022; Sun et al., 2022). The policy analyst can create and evaluate different scenarios by comparing the indicators to be achieved. Therefore, many scholars have studied CO2 emissions from different sectors using the LEAP model. For example, using LEAP model, Duan et al. (2019) analyzed the peak of CO2 emissions from the construction sector in Jilin Province of China, and their results indicate that the construction sector will peak in 2030. Masoomi et al. (2021) projected CO2 emissions from the power sector in Iran, and the results indicate that the CO2 emissions from the power sector will reach 429 Mt by 2035. Liu et al. (2021) investigated the peak of CO2 emissions from the tourism sector of China, and their research suggests that the tourism sector will peak in 2033. Zhao et al. (2021) analyzed the peak of carbon emissions from the transportation sector in Guangdong Province of China, and the results indicate that the peak will be reached in 2027 under the low-carbon scenario. Duan et al. (2022) analyzed the peak of CO2 emissions from the industrial sector of China, and the results indicate that the industrial sector will peak in 2030 under the energy-saving and low-carbon scenario. All the above scholars have studied the peak of CO2 emissions from a single sector. However, the achievement of a region’s peak target for CO2 emissions requires the combined efforts of multiple sectors. Therefore, we created three CO2 emission scenarios for six major sectors and analyzed the reduction potential of each sector in the lagging northwestern region of China. This study can specifically analyze the peak pathways and emission reduction measures of CO2 for each sector in the region.
2 Data sources and methodology
2.1 Data sources
The data of energy consumption and value added by sector are obtained from the China Energy Statistical Yearbook, Provincial Statistical Yearbooks, and the official website from the National Bureau of Statistics. Various types of energy are classified into coal, oil products, natural gas, and electricity. Furthermore, to eliminate the effect of price changes, the value added by each sector in past years was converted to constant 2010 prices.
2.2 Methodology
According to the LEAP model, total CO2 emissions are from terminal energy consumption and energy conversion processes. The formula is as follows:
where,
where,
where,
2.3 Scenario setting
To achieve the goal of CO2 emissions’ peak and energy savings, three scenarios are designed: the baseline scenario, the policy scenario and the green scenario. The specific scenario and parameter settings are described in the supplementary material (Supplementary Tables S1–S6).
3 Results and discussion
3.1 Historical CO2 emissions
Five northwestern provinces showed a fluctuating growth trend in CO2 emissions from 2000 to 2019 (Figure 1). The CO2 emissions increased from 226.74 × 10⁶ tonnes in 2000 to 1181.51 × 106 tonnes in 2019. The CO2 emissions of Shaanxi, Gansu, Ningxia, Qinghai and Xinjiang from 2000 to 2019 increased by 310.48 × 10⁶ tonnes, 122.92 × 10⁶ tonnes, 184.69 × 10⁶ tonnes, 45.14 × 10⁶ tonnes and 291.52 × 10⁶ tonnes, respectively (Figure 1A). The contribution of Shaanxi and Xinjiang is the largest; their average annual growth rate is 11.83 and 9.48%, respectively. The smallest is Qinghai with an average annual growth rate of 4.93%.
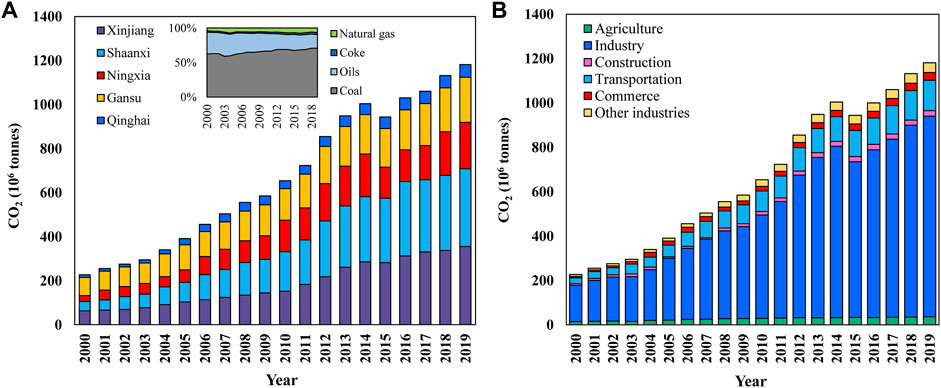
FIGURE 1. The trends of CO2 emissions in the five northwestern provinces. (A,B) represent the CO2 emissions of different provinces and sectors, respectively.
The CO2 emissions from agriculture, industry, construction, transportation, commerce, and other sectors from 2000 to 2019 increased by 21.43 × 10⁶ tonnes, 740.56 × 10⁶ tonnes, 17.41 × 10⁶ tonnes, 111.58 × 10⁶ tonnes, 28.63 × 10⁶ tonnes, and 35.16 × 10⁶ tonnes, respectively (Figure 1B). Among them, the industrial and transportation sectors are the main sectors of CO2 emissions, and they account for more than 70% of the total CO2 emissions. Another, it can be easily seen that the energy consumption in northwest China since 2000 has been dominated by coal (59%–71%). Then, the consumption of oil products (20%–32%) followed it (Figure 1A). The main reasons are as follows. Firstly, the Western Development Policy has promoted the development of industrialization and the establishment of energy-reserve bases, which in turn has led to a rapid increase in CO2 emissions. Secondly, the limitation of resource endowment of “less gas and more coal” and the less-developed energy utilization technologies still exist in China, especially in the five northwestern provinces.
3.2 CO2 emissions peaking under different scenarios
3.2.1 CO2 emissions’ peak of different provinces
The total and peak of CO2 emissions in the five northwestern provinces are shown in Figure 2A. The CO2 emissions in the baseline scenario will peak in 2035 (1663.46 × 106 tonnes), 5 years later than the national target of 2030. The policy scenario will peak in 2031 (1405.00 × 106 tonnes). The green scenario will peak in 2027 (1273.96 × 106 tonnes), 3 years ahead of the national target. This indicates that CO2 emissions in the region cannot be maintained in the baseline scenario and need to be advanced in the policy and green scenarios.
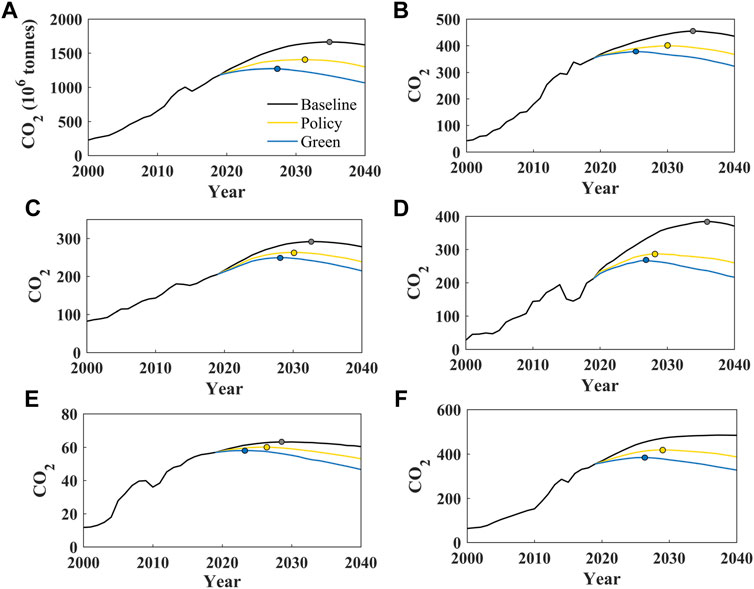
FIGURE 2. The CO2 emissions and peaks of each province under the three scenarios. (A) represents the total CO2 emissions. (B–F) represent the CO2 emissions of Shaanxi, Gansu, Ningxia, Qinghai, and Xinjiang, respectively.
The CO2 emissions of Shaanxi (Figure 2B) will peak in 2034 (454.87 × 10⁶ tonnes) under the baseline scenario. The policy and green scenarios will peak in 2030 (399.15 × 10⁶ tonnes) and 2025 (377.52 × 10⁶ tonnes), respectively. Shaanxi Province has a relatively developed economy in the five northwestern provinces, and its economic contribution accounts for 40% of the region. However, the province’s energy structure is relatively single, with coal consumption accounting for 75%. In addition, relative to the eastern region, the technology level of Shaanxi Province is still backward, with a surplus of low-end products and a lack of high value-added products. This has led to its reliance on large-scale energy-intensive and low-end industries to drive economic growth, which in turn leads to CO2 emissions not peaking by 2030. Therefore, the future development of Shaanxi Province needs to be improved technology and propelled energy-use efficiency.
In the baseline scenario, the CO2 emissions of Gansu (Figure 2C) and Ningxia (Figure 2D) will peak in 2033 (291.53 × 10⁶ tonnes) and 2036 (384.42 × 10⁶ tonnes), respectively. Xinjiang (Figure 2F) does not show a peak under the baseline scenario. Under the policy and green scenarios, all three provinces will peak prior to 2030. The industrialization of these three provinces started later, and the main problems at present are as follows. 1) Energy structure urgently needs to be adjusted, coal accounts for more than 60% of its energy consumption. 2) Low level of technology, except for a few backbone enterprises, there is generally a low level of the production process, resulting in a large energy consumption per unit of output value. Its unit output value is 3–5 times higher than the domestic average. 3) Due to the abundant resources of coal and oil, a heavy industrial structure has formed with non-ferrous, metallurgical, petroleum, chemical and coal industries. These reasons lead to the economic growth of the three provinces accompanied by huge energy consumption, and thus their CO2 emissions are difficult to peak in 2030 under the baseline scenario. Therefore, the restructuring of industrial and energy structures and the introduction of advanced equipment to improve production technology are the main directions for the three provinces.
The CO2 emissions of Qinghai (Figure 2E) will peak in 2028 (63.15 × 10⁶ tonnes) under the baseline scenario. The policy and green scenarios will peak in 2026 (60.15 × 10⁶ tonnes) and 2023 (57.96 × 10⁶ tonnes), respectively. Qinghai Province is sparsely populated and is dominated by animal husbandry and tourism. In addition, the province has abundant clean energy and a relatively reasonable energy structure. In 2019, the proportion of coal, oil, natural gas, and renewable-energy consumption in the province was 29.15%, 10.87%, 16.83% and 43.6% (China Statistical Yearbook, 2019). Therefore, the CO2 emissions in Qinghai Province are increasing slowly and will be able to reach the peak by 2030.
3.2.2 CO2 emissions’ peak of different sectors
To further explore emission reduction pathways from a sectoral perspective, we estimated the peak of CO2 emissions for six sectors in the region. The CO2 emissions of the agriculture sector (Figure 3A) will peak in 2027 (38.73 × 10⁶ tonnes) under the baseline scenario, 3 years ahead of the national target. The policy and green scenarios will peak in 2024 (37.24 × 10⁶ tonnes) and 2021 (36.51 × 10⁶ tonnes), respectively. Chen et al. (2019) predicted that the CO2 emissions of the agricultural sector in China will peak in 2026. This is similar to our findings in the baseline scenario. Industrialization has contributed to the increase in the level of mechanization of agricultural production and the improvement of water, electricity, roads and infrastructure in the agricultural sector, which has created conditions for the modernization and scaling up of agricultural development. This will inevitably lead to an increase in CO2 emissions from the agricultural sector. However, the five northwest provincial governments have formulated relevant policies for the agricultural sector, such as promoting low-carbon agricultural technologies, strengthening agricultural water and fertilizer management, upgrading agricultural machinery, and developing biogas digesters (National Development and Reform Commission of the People’s Republic of China, 2021). These measures have also curbed the growth of CO2 emissions. In addition, the demand and scope of activities in the agricultural sector are relatively stable. And in recent years, the implementation of afforestation and the establishment of modern ecological pastures and farmland in the northwest China have led to a rationalization of the agricultural structure. Therefore, the CO2 emissions from agricultural sector can peak prior to 2030 in the baseline scenario.
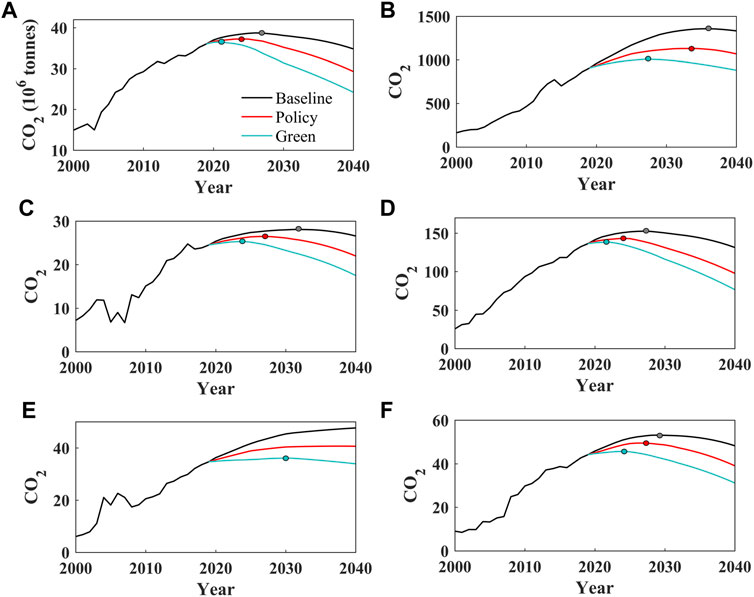
FIGURE 3. The CO2 emissions and peaks for each sector under three scenarios. (A–F) denote agriculture, industry, construction, transportation, commerce, and other industries, respectively.
The CO2 emissions of the industrial sector (Figure 3B) will peak in 2036 (1356.68 × 106 tonnes) under the baseline scenario, 6 years later than the national target. Under the policy scenario, the industrial sector will peak in 2034 (1130.99 × 106 tonnes). Under the green scenario, the industrial sector will peak in 2027 (1008.24 × 106 tonnes), 3 years ahead of the national target. In addition, the CO2 emission trend of the industrial sector is largely consistent with the overall trend of CO2 emissions, which indicates that the industrial sector is the key sector for peaking CO2 emissions. This is consistent with the findings of Li et al. (2018) for China and Zhang et al. (2019) for Beijing, both of which suggest that industry is the main sector that delays the peaking of CO2 emissions. China is a developing country, and industry is the dominant sector of the national economy. Since the implementation of the Western Development Policy in 2000, the region has invested and built a large number of heavy chemical industries and nationally important energy production and processing bases, such as coal production and coal chemical bases, large oil and gas extraction and processing bases, and other industries. This fact inevitably leads to the result that the peak times of the industrial CO2 emissions affect the overall peak times. Considering that the industrial base in the region is solid relatively and is continuing to advance. To ensure sustained economic growth in the region, CO2 emissions from the industrial sector cannot only consider peaking by 2030, but needs to combine policy scenarios and green scenarios to achieve a gradual peaking of CO2 emissions. Namely, it should be ensured that the average annual growth rate of the economy of the industrial sector does not exceed 4.3% until 2030, and the share of secondary industry decreases to 29.09%. Meanwhile, energy intensity should be reduced to 1.45 tonnes/104 China Yuan (CNY) in 2030.
The CO2 emissions of the construction sector (Figure 3C) will peak in 2032 (28.08 × 10⁶ tonnes) in the baseline scenario, 2 years later than the national target. The policy and green scenarios will peak in 2027 (26.50 × 10⁶ tonnes) and 2024 (25.31 × 10⁶ tonnes), respectively. Chen et al. (2019) investigated the peak of carbon emissions from the construction sector in China, and the results showed that China’s construction-industry carbon emissions will peak in 2035. This is similar to our results from the baseline scenario. At present, the urbanization process of China is accelerating (Liang et al., 2019). Meanwhile, the construction sector is also advancing rapidly. The housing construction area in the five northwestern provinces has increased by 49,280.94 × 104 square meters from 2000 to 2019. This leads to the massive consumption of steel and cement and generates great CO2. According to the seventh population census, 63.89% of China’s population lives in urban and 36.11% in rural (National Bureau of Statistics, 2021). However, the urban population in the five northwestern provinces is 59.80% and the rural population is 40.20%, which is lower than the national average. As urbanization progresses in the region, the building area will also increase, which in turn will generate more CO2 emissions. Therefore, to ensure the stable economic growth and achieve the peak of CO2 emissions by 2030, the construction sector needs to advance in a policy scenario.
The CO2 emissions of the transportation sector (Figure 3D) will peak in 2027 (152.66 × 10⁶ tonnes) under the baseline scenario. The policy and green scenarios will peak in 2024 (143.30 × 10⁶ tonnes) and 2022 (138.50 × 10⁶ tonnes), respectively. Transportation is the second-largest source of CO2 emissions after industry and is expected to peak prior to 2030 in the baseline scenario, which will undoubtedly play an important role in achieving the peak of CO2 emissions on time. Continued economic growth has improved the transportation conditions and increased the willingness of people to travel in the Northwest. This has led to an increase in energy consumption and CO2 emissions in the region. However, the northwest region is sparsely populated with a more dispersed population. This has led to higher costs for people in the region to use private cars to travel. Therefore, there is a lower level of car ownership in the region. In addition, the northwestern region is rich in clean energy sources such as solar, wind and natural gas. This has led to a decrease in oil consumption and an increase in the proportion of electricity and natural gas, and the popularity of electric vehicles has further curbed the growth of CO2 emissions. At present, there is a lower density of both rail and road in the northwest, and CO2 emissions are growing slowly. If the government takes strong measures in the transportation sector, such as improving fuel economy and promoting the optimization and upgrading of transportation modes and equipment. It should be ensured that the economic growth rate does not exceed 5.57% annually until 2030, and that the energy intensity decreases to 0.71 tonnes/104 CNY and the share of oil to 59.68% by 2030. In this pattern, the CO2 emissions from transportation will be further slowed and hopefully reach the peak by 2030 in the baseline scenario.
Under the green scenario, the CO2 emissions from the commerce sector will start to slow down after 2030 (Figure 3E). With the promotion of the Belt and Road policy, the level of service industry has also improved significantly in the region. The CO2 emissions have increased because of the development of tourism resources and the improvement of supporting facilities related to the commerce sector in the western region. Although commerce generates some CO2 and shows a growing trend, its growth rate exceeds the growth rate of CO2 emissions. For example, the average annual growth rate of commerce CO2 emissions from 2020 to 2040 is 1.34% in the baseline scenario, while its economic growth rate is 3.91%. Li et al. (2018) showed that the share of energy in the commerce sector will grow significantly in the China, reaching 82% of energy use by 2050. The tertiary sector has the characteristic of low energy consumption and high output. This is the main reason that China is vigorously developing the tertiary sector to ensure high-quality economic growth. Therefore, the commerce sector can be advanced in the baseline scenario.
The CO2 emissions from other industries (Figure 3F) will peak in 2029 (53.17 × 10⁶ tonnes) in the baseline scenario. The policy and green scenarios will peak in 2027 (49.50 × 10⁶ tonnes) and 2024 (45.70 × 10⁶ tonnes), respectively. Other industries have the same attributes as commerce. Therefore, it is feasible for the other industries to advance in the baseline scenario.
3.3 Emission reduction effect
3.3.1 Emission reduction effect of terminal energy consumption
As shown in Figure 4A, compared to the baseline scenario, the terminal consumption module in the policy scenario will cumulatively reduce 2183.00 × 106 tonnes CO2 from 2020 to 2040. Among them, industrial coal will have the largest emission reduction effect, with a cumulative reduction of 1687.65 tonnes CO2, accounting for 77.3% of the total emission reduction effect.
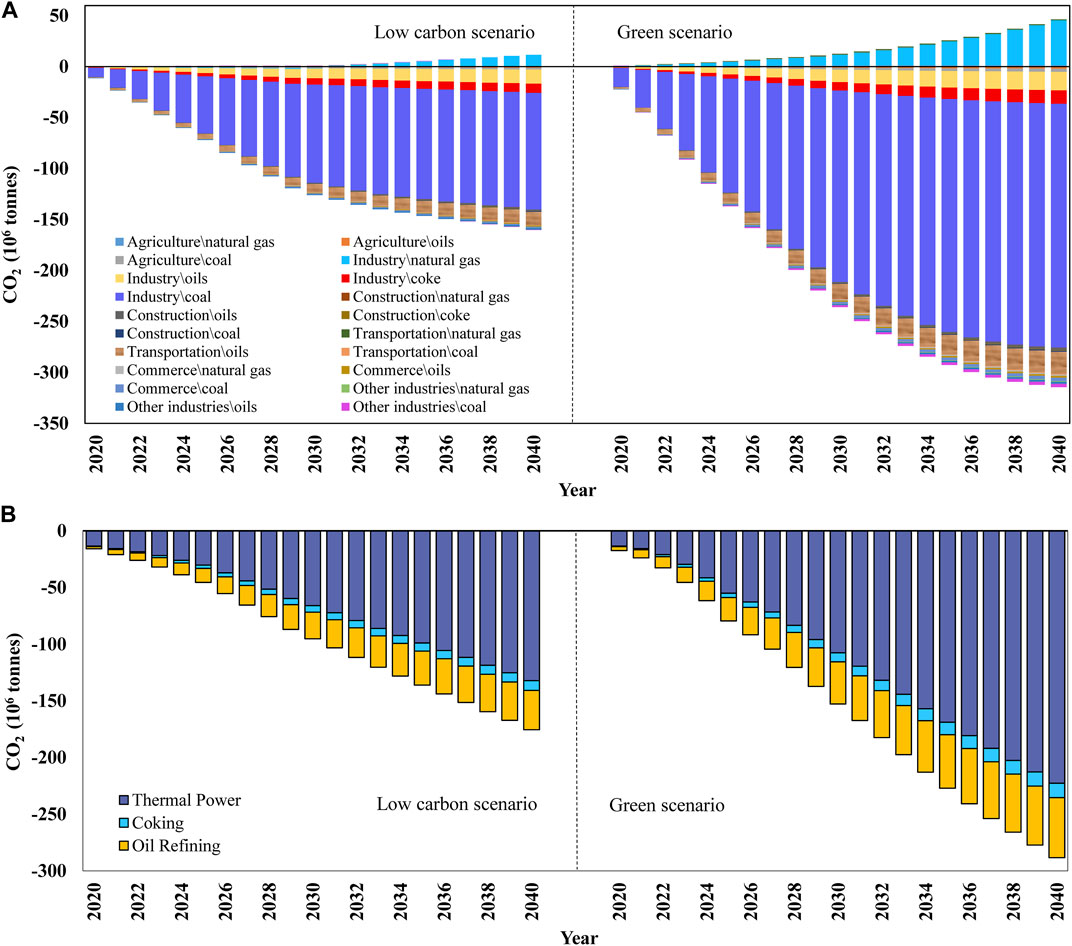
FIGURE 4. Emission reduction effects by different sectors under different scenarios. (A,B) denote the emission reductions of terminal energy and conversion process, respectively.
Compared to the baseline scenario, the terminal consumption module in the green scenario will cumulatively reduce 4020.36 × 106 tonnes CO2. Among them, the CO2 emissions from the industrial coal will be reduced by 3444.49 × 106 tonnes, accounting for 85.6% of the total emission reduction effect. In addition, natural gas will increase CO2 emissions in both scenarios. This is because the share of natural gas will increase significantly in the future.
3.3.2 Emission reduction effect of energy conversion
As shown in Figure 4B, compared to the baseline scenario, the energy conversion process under the policy scenario will cumulatively reduce 1954.70 × 106 tonnes CO2 from 2020 to 2040. Among them, the CO2 emissions from thermal power will be reduced by 3444.49 × 106 tonnes, accounting for 71.9% of the total emission reduction effect.
Compared to the baseline scenario, the energy conversion process in the green scenario will cumulatively reduce 3181.09 × 106 tonnes CO2. The CO2 emissions from thermal power will be reduced by 2329.54 × 106 tonnes, accounting for 73.2% of the total emission reduction effect.
In summary, the CO2 emissions from 2020 to 2040 will be reduced by 4137.70 × 106 tonnes in the policy scenario and by 7201.46 × 106 tonnes in the green scenario. This is equivalent to 41.72% and 72.64% of the industrial CO2 emissions from 2000 to 2019, respectively.
4 Conclusion and policy recommendation
4.1 Conclusion
Total CO2 emissions in the five northwestern provinces will peak in 2035 under the baseline scenario, and that of the policy and green scenarios will peak in 2031 and 2027, respectively.
In the analysis of the provinces, the CO2 emissions of all provinces except Qinghai are unable to reach the peak before 2030 in the baseline scenario. Under the policy and the green scenarios, all provinces are able to peak by 2030.
In the sector analysis, the CO2 emissions from agriculture, transportation, and other sectors in the region will peak before 2030 under the baseline scenario. The CO2 emissions from industry, construction and commerce will peak before 2030 in policy and green scenarios. Compared to the baseline scenario, the CO2 emissions from 2020 to 2040 will be reduced by 4137.70 × 106 tonnes under the policy scenario and 7201.46×policy106 tonnes under the green scenario. Among the end-consumption module, industrial coal is the sector with the greatest potential for reducing CO2 emissions. In the energy conversion module, thermal power is the sector with the largest emission reduction, followed by oil refining and coking.
4.2 Policy recommendation
Firstly, the five northwestern provinces should adjust the industrial structure. The five northwestern provinces commonly have the problem of over-weighting of secondary industries. Therefore, the region should transform the deformed industrial structure which is based on the development of natural resources. This includes strictly controlling and regulating the growth of these energy-intensive sectors, as well as upgrading traditional sectors through technological innovation and developing emerging sectors that consume less energy. In addition, the government should establish a strict monitoring and control mechanism to keep the industry structure within a reasonable range. It should be ensured that the share of the secondary industry will decrease to 37.43% by 2030, and the commerce and other industries increase to 47.86%. Meanwhile, the share of the agricultural and transport sectors should be maintained at no more than 9.14% and 5.46%, respectively, by 2030.
Secondly, the energy intensity should further be reduced. Thus, the government should encourage technological innovation and give financial and policy support to enterprise sectors with higher energy-saving and energy conversion efficiency. In addition, the government should further strengthen the technical exchange with the eastern of China and introduce advanced talents and equipment to eliminate that equipment with high-energy consumption. It should be ensured that the energy intensity of agriculture, industry, construction, transportation, commerce, and other sectors will be reduced to 0.13 tonnes/104 CNY, 1.45 tonnes/104 CNY, 0.08 tonnes/104 CNY, 0.71 tonnes/104 CNY, 0.24 tonnes/104 CNY, and 0.047 tonnes/104 CNY, respectively, by 2030. In addition, the thermal power efficiency should also be improved, such as accelerating the closure of small thermal power plants and integrating and recycling waste power plants. It should be ensured that the thermal power efficiency will increase to 49.3% by 2030.
Finally, the northwest of China is rich in clean energy sources such as solar, wind and natural gas. Therefore, the full utilization of the region’s solar and wind energy to reduce the use of coal energy should be a long-term strategy that needs to be maintained. It should be ensured that the share of coal in end consumption will not exceed 43.3% by 2030, while the share of natural gas and non-fossil energy will increase to 25.42%. With the above policy implementation efforts, the five northwestern provinces will hopefully achieve the peak of CO2 emissions by 2030.
4.3 Limitations and the future research directions
The limitations of this article deserve further research. Firstly, we did not consider the impact of biomass energy on CO2 emissions peaking, which is an issue that needs to be addressed in the future. Secondly, we only consider measuring the peak of CO2 emissions. However, we do not consider the cost effects required under three scenarios. Therefore, the trade-off between the implementation of emission reduction measures and the required costs deserves further in-depth study.
Data availability statement
The original contributions presented in the study are included in the article/Supplementary Material, further inquiries can be directed to the corresponding author.
Author contributions
ZZ and JJ conceived and designed the research. ZZ collected and analysed the data. ZZ and JJ wrote and revised the paper. YG, BW, and CC contributed to progress of research idea and provide a critical review for this study. All authors have read and agreed to publish the current version of the manuscript.
Funding
This research was funded by the Foundation Project of Philosophy and Social Science in Jiangxi Province (Grant No. 21JL03), the Research Project of Humanities and Social Science in Jiangxi’s Universities (Grant No. GL. 19225) and the Chinese National Science Foundation (Grant No. 71473113).
Conflict of interest
The authors declare that the research was conducted in the absence of any commercial or financial relationships that could be construed as a potential conflict of interest.
Publisher’s note
All claims expressed in this article are solely those of the authors and do not necessarily represent those of their affiliated organizations, or those of the publisher, the editors and the reviewers. Any product that may be evaluated in this article, or claim that may be made by its manufacturer, is not guaranteed or endorsed by the publisher.
Supplementary material
The Supplementary Material for this article can be found online at: https://www.frontiersin.org/articles/10.3389/fenrg.2022.983751/full#supplementary-material
References
Chen, W., Li, H., and Wu, Z. (2010). Western China energy development and West to east energy transfer: Application of the western China sustainable energy development model. Energy Policy 38, 7106–7120. doi:10.1016/j.enpol.2010.07.029
Chen, X., Shuai, C., Wu, Y., and Zhang, Y. (2019). Analysis on the carbon emission peaks of China’s industrial, building, transport, and agricultural sectors. Sci. Total Environ.
Duan, H., Zhang, S., Duan, S., Zhang, W., Duan, Z., Wang, S., et al. (2019). Carbon emissions peak prediction and the reduction pathway in buildings during operation in Jilin province based on LEAP. Sustainability 11, 4540. doi:10.3390/su11174540
Duan, H., Dong, X., Xie, P., Chen, S., Qin, B., Dong, Z., et al. (2022). Peaking industrial CO2 emission in a typical heavy industrial region: From multi-industry and multi-energy type perspectives. Int. J. Environ. Res. Public Health 13, 7829. doi:10.3390/ijerph19137829
Fu, G., Tian, Z., and Ding, B. (2015). Reflections on energy conservation and emission reduction in the industrialization development of typical western provinces and regions—Xinjiang and Ningxia as examples, (In Chinese). Energy China 37, 16–20. Available at: https://kns.cnki.net/kcms/detail/detail.aspx?FileName=ZGLN201508004&DbName=CJFQ2015. doi:10.3969/j.issn.1003-2355.2015.08.003
Heaps, C. G. (2022). LEAP: The low emissions analysis Platform. [Software version: 2020.1.64]. Somerville, MA, USA: Stockholm Environment Institute. Available at: https://leap.sei.org (accessed June 8, 2022).
Intended Nationally Determined Contributions (INDC) (2015). China-intended nationally determined contribution. Paris, France: INDC. Available at: https://www4.unfccc.int/sites/submissions/indc/Submission%20Pages/submissions.aspx (accessed June 23, 2022).
Intergovernmental Panel on Climate Change (IPCC) (2006). 2006 IPCC Guidelines for national greenhouse gas Inventories: Volume II: Energy. Japan: Institute for Global Environmental Strategies.
Krook-Riekkola, A., Berg, C., Ahlgren, E. O., and Söderholm, P. (2017). Challenges in top-down and bottom-up soft-linking: Lessons from linking a Swedish energy system model with a CGE model. Energy 141, 803–817. doi:10.1016/j.energy.2017.09.107
Li, J., Ma, Z., Zhang, Y., and Wen, Z. (2018). Analysis on energy demand and CO2 emissions in China following the energy production and consumption revolution strategy and China dream target. Adv. Clim. Change Res. 1, 16–26. doi:10.1016/j.accre.2018.01.001
Liang, Y., Cai, W., and Ma, M. (2019). Carbon dioxide intensity and income level in the Chinese megacities’ residential building sector: Decomposition and decoupling analyses. Sci. Total Environ. 677, 315–327. doi:10.1016/j.scitotenv.2019.04.289
Liu, D., Yang, D., and Huang, A. (2021). LEAP-based greenhouse gases emissions peak and low carbon pathways in China’s tourist industry. Int. J. Environ. Res. Public Health 18, 1218. doi:10.3390/ijerph18031218
Masoomi, M., Panahi, M., and Samadi, R. (2021). Demand side management for electricity in Iran: Cost and emission analysis using LEAP modeling framework. Environ. Dev. Sustain. 24, 5667–5693. doi:10.1007/s10668-021-01676-7
National Bureau of Statistics (2021). Bulletin of the seventh national census. Available at: http://www.stats.gov.cn/tjsj/tjgb/rkpcgb/ (accessed May 3, 2022).
National Development and Reform Commission of the People's Republic of China (NDRC) (2021). Outline of the fourteenth five-year plan for national economic and social development of the People's Republic of China and the vision 2035. Available at: https://www.ndrc.gov.cn/(accessed May 3, 2022).
Sun, W., Zhao, Y., Li, Z., Yin, Y., and Cao, C. (2022). Carbon emission peak paths under different scenarios based on the LEAP model—a case study of suzhou, China. Front. Environ. Sci. 10, 905471. doi:10.3389/fenvs.2022.905471
The United Nations Framework Convention on Climate Change (UNFCCC) (2015). Paris agreement. Available at: http://unfccc.int/process-and-meetings/the-parisagreement/the-paris-agreement (accessed June 8, 2022).
Yan, D., Liu, F., Ye, P., Fu, B., Song, Y., Zhang, G., et al. (2021). Main methods and models for carbon peak scenario prediction, (In Chinese). Environ. Prot. Circular Econ. 41, 97–101. Available at: https://kns.cnki.net/kcms/detail/detail.aspx?FileName=LNCX202107026&DbName=CJFQ2021.
Yu, H., Pan, S. Y., Tang, B. J., Mi, Z. F., Zhang, Y., and Wei, Y. M. (2014). Urban energy consumption and CO2 emissions in beijing: Current and future. Energy Effic. 8, 527–543. doi:10.1007/s12053-014-9305-3
Zeng, L., Lu, H., Liu, Y., Zhou, Y., and Hu, H. (2019). Analysis of regional differences and influencing factors on China’s carbon emission efficiency in 2005-2015. Energies 12, 3081. doi:10.3390/en12163081
Zhang, D., Liu, G., Chen, C., Zhang, Y., Hao, Y., and Casazza, M. (2019). Medium-to-long-term coupled strategies for energy efficiency and greenhouse gas emissions reduction in Beijing (China). Energy Policy 127, 350–360. doi:10.1016/j.enpol.2018.12.030
Keywords: five northwestern provinces of China, CO2, LEAP, scenario, reduction path
Citation: Zhang Z, Jia J, Guo Y, Wu B and Chen C (2022) Scenario of carbon dioxide (CO2) emission peaking and reduction path implication in five northwestern provinces of China by the low emissions analysis platform (LEAP) model. Front. Energy Res. 10:983751. doi: 10.3389/fenrg.2022.983751
Received: 01 July 2022; Accepted: 04 August 2022;
Published: 31 August 2022.
Edited by:
Lancui Liu, Beijing Normal University, ChinaReviewed by:
Shiwei Yu, China University of Geosciences Wuhan, ChinaLongxi Li, China University of Geosciences Wuhan, China
Copyright © 2022 Zhang, Jia, Guo, Wu and Chen. This is an open-access article distributed under the terms of the Creative Commons Attribution License (CC BY). The use, distribution or reproduction in other forums is permitted, provided the original author(s) and the copyright owner(s) are credited and that the original publication in this journal is cited, in accordance with accepted academic practice. No use, distribution or reproduction is permitted which does not comply with these terms.
*Correspondence: Junsong Jia, amlhYW5pdUBqeG51LmVkdS5jbg==