 Pengyuan Li
 Qunyi Liu1
 Ping Zhou
- 1Institute of Mineral Resources, Chinese Academy of Geological Sciences, Beijing, China
- 2China Institute of Geo-Environment Monitoring, Beijing, China
Platinum is widely considered as a critical mineral. According to the most optimistic scenario, the demand for platinum could increase 240-fold globally by 2050 due to the enormous demand potential for green hydrogen and fuel cell vehicles. By integrating network analysis and evaluation indicators, this study develops a framework to visualize the global platinum upstream supply chain, pinpoint supply-related risk areas, and assess the position of various nations in the supply chain. We conclude that there is a significant risk of disruption to the global platinum upstream supply chain. Following is a summary of the main conclusions: First, the global platinum supply network and primary platinum product trade network are both relatively sparse, with poor network connectivity, and the overall network’s risk-resistance is weak. Second, at the non-geographical production country level, the global platinum mining countries, the countries of the producing companies, and the countries of the shareholders of the producing companies are all highly concentrated. Third, the global platinum supply and demand markets are significantly divided, and South Africa holds a significantly stronger national position in the platinum supply network than any other nation, except for the national level of producing companies’ shareholders. However, the national role of South Africa in the trade network is not as strong as that of consuming countries and transit countries. The study proposes that global platinum consuming countries can reduce supply risks by increasing domestic platinum mine production, building international large-scale integrated mining corporations, and raising global supply share by investing in overseas mines.
1 Introduction
Platinum is widely considered as a critical mineral (European Commission, 2020; U.S.Geological Survey, 2022; Natural Resources Canada, 2021; Australian Government Department of Industry, 2022), and is used in a variety of sectors, ranging from automotive, jewelry, petroleum, chemical, glass, electronics, and medicine (Johnson Matthey, 2020). The low-carbon transition has become a global consensus. As a critical raw material for fuel cells and green hydrogen generation, platinum is crucial to the global development of low-carbon clean energy, and is known as a “green energy metal” along with lithium, cobalt, and copper (Johnson Matthey, 2021). Due to the huge demand potential of fuel cell vehicles and green hydrogen, the demand for platinum will grow significantly in the future. According to Rasmussen et al. (2019), worldwide platinum demand might climb 240-fold by 2050 to a high of 51,400 tons. In contrast to the rapidly growing demand, PGMs (Platinum Group Metals) are among the rarest metals, with only around 0.0005 part per million (ppm) platinum in the earth’s upper crust. (U.S.Geological Survey, 2018). Additionally, the distribution and production of platinum resources are highly unequal (U.S.Geological Survey, 2020), with 30% of global PGMs deposits holding more than 97% of known PGMs resources. It is primarily found in the Bushveld Complex in South Africa, the Noril ‘SK-Talnakh Area in Russia, and the Great Dyke in Zimbabwe. The hydrogen economy is driving a sharp increase in platinum demand, but the scarcity and highly concentrated distribution of PGMs in the world raises the question: Will the significant growth in global platinum demand lead to increased supply risk? Therefore, identifying and evaluating global platinum supply chain risk can assist relevant nations in developing effective policies to mitigate supply concerns.
Currently, the tendency of reverse globalization is highlighted, and supply chain security come to the fore as a major concern for all nations (White House, 2021; Trump, 2017; HM Government, 2017). Mineral resources risk evaluation from a supply chain perspective is more capable of systematically portraying the risk level of each link, which has received wide attention from scholars and policymakers. Supply chains may be understood, designed, and managed using network analysis (Bellamy and Basole, 2012). In recent years, the quantitative and visual analysis of mineral resources supply risk based on complex networks has gradually become a research hotspot (Sun, 2022). By constructing a multi-layer complex network consisting of manufacturers, traders, shareholders, and countries to which they belong, the risk is systematically evaluated and the position of different participants in the network is presented through visualization techniques, and each indicator affecting the supply risk is dissected and visualized. Nuss et al. (2016a) mapped supply chains for five product platforms, then proposed a set of network indicators (product complexity, producer diversity, supply chain length, and potential bottlenecks) to assess the situation for each platform in the overall supply chain networks. van den Brink et al. (2020) evaluated cobalt supply chain risks by geographically explicitly mapping the cobalt supply chain and companies, and applying supply risk indicators and company linkages. Xun et al. (2021) mapped the global fuel cell vehicles industrial chain during the period of 2017–2019, using the combined indicator of HHI (Herfindahl-Hirschman Index) and HHI-WGI (World Governance Index), as well as network analysis, to assess the supply risks of relevant key commodities. Wen et al. (2021) constructed a complex network with copper mines, copper refineries, shareholders, and countries as nodes to study the supply risk from a network structure standpoint. The effectiveness of supply chain network analysis in revealing supply restrictions and bottlenecks in the supply chain has been demonstrated; however, no such study has been carried out for the PGMs.
Raw materials supply can be disrupted as a result of trade conflicts (Schmid, 2019) and pandemics (Ahmed, 2020). For example, restrictions on the export of rare earth metals and minerals from China and the COVID-19 pandemic closed some or all of several mines, smelters, and refineries, destabilizing the supply of copper, gold, silver (MacDonald et al., 2020), and technology metals such as cobalt, lithium, and nickel (Akcil et al., 2020).
Complex network is also a popular method for analyzing international trade issues nowadays (Geng et al., 2014; Vidmer et al., 2015; Zhong et al., 2017; Chen et al., 2020). The overall structural characteristics of the network were assessed by network density, average clustering coefficient and other metrics (Wang et al., 2020; Peng et al., 2021; Wang et al., 2022). The analysis of selected indicators such as degree centrality, strength centrality, closeness centrality, and betweenness centrality enables for the investigation of nations’ trade roles and trading position (Fan et al., 2014; Nuss et al., 2016b). There has been little research conducted on the trading network of PGMs. Tokito et al. (2016) focused solely on the risk characteristics of trade clusters when analyzing the complexity of the international trade network of platinum primary goods. In contrast, the focus of this study is on the relevance and control of nations in the platinum mining trade network.
The evaluation of mineral resources supply risk based on the index system is more one of the hot research topics in this field. In the evaluation of important minerals, the United States, the European Union, and others have developed evaluation models that use supply concentration, foreign dependency, and governance risk of supplying countries as indicators. (National Research Council, 2008; U.S. Department of Energy,2011; European Commission, 2011; European Commission, 2014; European Commission, 2017; European Commission, 2020). Based on such models, a large number of scholars have systematically evaluated the supply risk of critical minerals (Yang et al., 2013; Grandell and Thorenz, 2014; Wang et al., 2018). The most popular evaluation indicators are country risk, market concentration, reserve-production ratio, and by-product dependence (Achzet and Helbig, 2013). Regarding the supply risk evaluation of platinum, Yuan et al. (2020) introduced a criticality assessment approach to quantitatively examine platinum supply risk drivers, end-user vulnerability, market dynamics indicators, and their interrelationships in a time-dependent way. However, prior research mostly examined the supply risk of a specific link in the supply chain, and the evaluation structure was vulnerable to the influence of indicator selection.
Previous studies on global PGMs supply risks have shown that the greatest risk comes from upstream platinum mine supply (Xun et al., 2021), and the biggest supply risk is the political risk posed by South Africa due to its dominance in the world’s platinum resources and supply (Mudd et al., 2018; Yuan et al., 2020). Based on this, this study focuses on upstream platinum supply and proposes combining network analysis with risk evaluation indicators to build a global platinum supply chain risk assessment framework to evaluate the risk of the upstream supply chain of platinum and analyze the position of countries in the upstream supply chain network.
The main innovation of this study is to provide a new perspective on upstream platinum supply chain risks and to visualize the various relationships in the global upstream platinum supply chain. This study can be used by policymakers and businesses to identify supply bottlenecks and the risk of supply disruptions. This is accomplished by addressing two research gaps.
(1) A global platinum supply chain risk assessment framework combining network analysis and evaluation indicators was constructed. A complete upstream platinum supply chain network was created by mapping the world’s platinum supply, examining the connections between platinum mines, producing countries, mining companies, and company-owned shareholders, combining with the world’s primary platinum product trade network, and combining with evaluation indicators to assess the supply risk of upstream platinum.
(2) The status of main participants involved in the global platinum upstream supply chain are identified. The effect of the key suppliers in the supply chain is evaluated through the development of the countries’ status index, which assesses the status of suppliers and merchants in the global supply networks for platinum mines and primary products.
2 Methods and data
2.1 System boundary
This section describes the system boundaries of this study. This study focuses on the risk assessment of the upstream supply chain of platinum, including the mining and refining stages. Platinum trade products are selected as global platinum primary products with trade codes HS-711011 and HS-711019. Unless otherwise specified, the data time selected for this study is 2019. This is due to the fact that the global platinum mine supply in 2020 is affected by the shutdown of Anglo American Platinum’s converter plant and COVID-19 pandemic, and the data is significantly lower than the level in recent years.
2.2 Methods
This study proposes a global platinum supply chain risk assessment framework based on network analysis and index evaluation, and conducts risk assessment at two levels: global overall supply risk and participants’ status (Figure 1). At the global overall supply risk level, five evaluation dimensions of global platinum supply network, international platinum primary product trade network, supply concentration, country risk, and environmental risk are constructed, and five evaluation indicators of network density, clustering coefficient, HHI, WGI, and EPI (Environmental Performance Index) are selected. The global platinum supply network and international platinum primary product trade network together constitute the upstream supply chain network of platinum. At the level of global platinum suppliers’ status, two dimensions of the global platinum supply network and the international platinum primary product trade network are constructed, and the calculation formula of the subject’s status is designed based on the two evaluation indicators of degree centrality and betweenness centrality.
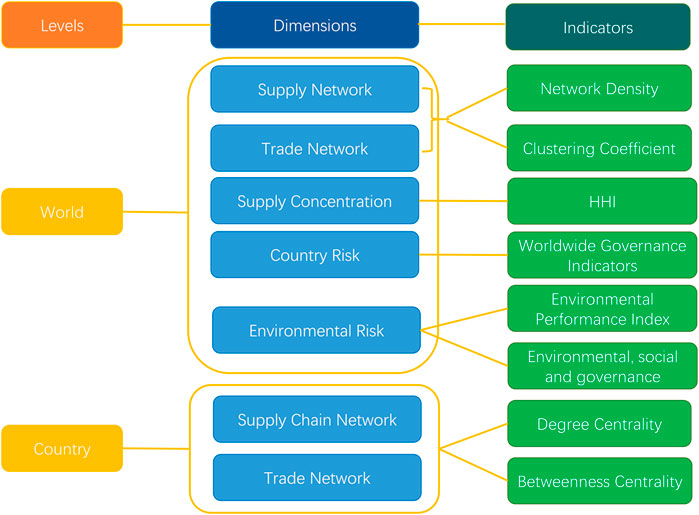
FIGURE 1. The global platinum supply chain risk assessment framework.
2.2.1 Supply chain network
2.2.1.1 Supply network construction
Based on complex network theory, this research constructs a global platinum supply network (GPSN). The supply network model consists of node set (V) and edge set (E), namely GPSN=(V, E), where node V = {VMj,VFj,VSj,VCj:j = 1,2,3 … n}represents mines, companies, shareholders of companies, countries; E = {ek:k = 1,2, … ,m}represents the relationship between the suppliers. The matrix expression of the global platinum supply network is:
In the formula, ωMF and ωFM represent the connection between the mines and the companies, respectively; ωMS and ωSM represent the connection between the mines and the shareholders of the company, respectively; ωMC and ωCM represent the connection between the mines and the countries, respectively; ωFC and ωCF represent the connection between the companies and the countries, respectively.
GPSN uses platinum mines (M), platinum production companies (F), shareholders of platinum production company (S), and countries (C) as network nodes. Platinum mines (M) and mines’ countries (CM), platinum mines (M) and affiliated platinum production companies (F), platinum mines (M) and shareholder of platinum production companies (S), platinum production companies (F) and company’s countries (CF), platinum production companies (F) and the shareholders of the platinum production companies (S), the shareholder of the platinum production companies (S) and the shareholder’s countries (CS) are established as edges (Figure 2), with the platinum production as the weight of the edges. The size of the node reflects the production of a supplier, that is, the bigger node represents the greater production of the corresponding supplier. The width of the edge represents the scale of mine production, that is, the thicker edge indicates the greater production between the two suppliers.
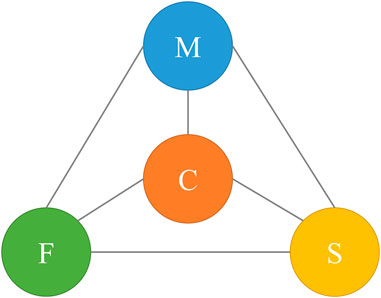
FIGURE 2. Schematic diagram of global platinum supply network (GPSN).
2.2.1.2 Overall characteristic analysis index
In the study, network density and average clustering coefficient were selected as overall network indicators to assess the risk propagation in the global platinum supply network.
(1) Network Density. The indicator measures the closeness of the connection between the subjects in the network. Calculated by dividing “the number of edges actually present in the network” by the “theoretical maximum number of edges in the network”. The network density ranges from 0 to 1, and the larger the value, the closer the connection between the subjects. The formula for the network density (Geng et al., 2014):
In the formula, m is the actual number of edges in the network, and n is the number of nodes in the network.
(2) Average Clustering Coefficient. Clustering coefficient describes the degree of clustering between nodes in a network, ranging from 0 to 1. The larger the value, the closer the connectivity between the neighbors of node i. The clustering coefficient mainly reflects the tightness of a network. The formula for the clustering coefficient (Watts and Strogatz, 1998):
In the formula, ni is the number of connected edges between adjacent nodes of node i, and ki is the degree value of node i.
The Average Clustering Coefficient (--CC) can reflect the tightness of all nodes in a network. The calculation formula is as follows (Watts and Strogatz, 1998):
2.2.1.3 The roles of major participants
In the study of complex network, degree centrality and betweenness centrality are commonly used indicators to measure the importance of nodes. Node importance can quantitatively reflect the control and influence of a node in the network. Based on the above-mentioned indicators, this study designs the calculation and publicity of participant’ status to measure the position and influence of each supplier in the platinum supply chain network.
(1) Degree Centrality. Degree centrality is the most direct indicator to measure the importance of nodes. The more edges a node has, the greater its direct influence in the network, and the more important the node is in the network. The calculation formula of the degree centrality of node i is (Freeman, 1977):
In the formula,
(2) Betweenness Centrality. The index reflects the node’s ability to control the flow of resources in the network by indicating the probability that a node resides on the shortest path between two other nodes. The larger the value, the stronger the betweenness of the node, that is, the stronger the control ability of the node. The betweenness centrality formula of node i is (LiHuangZhang et al., 2022):
where gpq is the shortest path between nodes p and q.
(3) Status indicators in the network. Based on the two indicators of degree centrality and betweenness centrality, the formula for calculating a participant’s status defined in this study is:
where NSi is the status of node i in the network; NCi and NC(b)i are the normalized degree centrality and normalized betweenness centrality of node i, respectively, and their calculation formulas are:
where C and C(b) represent the degree centrality and betweenness centrality of all nodes in the network, respectively.
2.2.2 Trade network
Supply disruptions or trade reductions are important factors in supply risk. As in the global flow of platinum material, the largest flows are platinum primary products, i.e. unwrought platinum or in powder form and platinum in semi manufactured forms (Nansai et al., 2014). If there is trade risk in platinum primary products, it will seriously affect the global supply of platinum resources. Therefore, this study mainly discusses the international platinum primary product trade network.
Based on complex network theory, this study constructs an international platinum primary product trade network (IPCN). The trade network model consists of node set (V) and edge set (E), namely IPCN=(V, E), where node V = {vj:j = 1,2,3 … n} represents trading countries; E = {ek:k = 1,2, … ,m} represents trade relations between countries. The adjacency matrix expression of the trade network model is:
where ωi,j is the weight of the link from node i to node j, measured by the trade volume of platinum primary products from one country to another.
The IPCN takes countries (areas) as nodes, the trade relations between countries (areas) as the edges, the direction of trade flow as the direction of the edges, and the trade volume of platinum primary products as the weights of the edges. The size of the node reflects the total trade volume of a country (area), that is, the larger the node, the greater the trade volume of the corresponding country (area). The width of the side represents the scale of the trade volume, which means the thicker the side, the greater the trade volume between the two countries (areas). Overall characteristic analysis indicators and countries’ status index are the same as GPSN.
Both GPSN and IPCN are visualized by Gephi, which uses network metrics to visualize and analyze networks of various scales.
2.2.3 Supply concentration
This study mainly selects HHI, WGI, EPI and the ESG (Environmental, Social and Governance) score of platinum companies to quantitatively evaluate the global platinum supply risk.
“HHI” refers to the Herfindahl-Hirschman Index, a generally accepted measure of market concentration. HHI is calculated by squaring the market share of each competing firm in the market and summing the results. In this study, we use the HHI index to assess countries concentration, companies concentration and mines concentration. According to the standards of the U.S. Department of Justice and Federal Trade Commission (U.S. Department of Justice & FTC, 2018), the HHI index between 1500 and 2500 is moderately concentrated, and the HHI index greater than 2500 is highly concentrated.
where Si is the market share of country i (in percentage unit).
2.2.4 Country risk
The World Governance Index (WGI) is used to evaluate a country’s governance level, aggregating comprehensive indicators of six dimensions of governance in more than 200 countries and regions from 1996 to 2020, including voice and accountability (VA), political stability and absence of violence/terrorism (PV), government effectiveness (GE), regulatory quality (RQ), rule of law (RL) (World Bank, 2020). All indicators are scored from −2.5 (weak governance) to 2.5 (strong governance). Poor governance is a key factor in determining supply risk, as supply in poorly governed countries can be disrupted, for example by generating political unrest (European Commission, 2014). The WGI is obtained by averaging the six dimensions. WGI is normalized to 0–1 by Eq. (12) (Xun et al., 2022).
The aggregate indicator of country political risk is defined as HHI-WGI, which takes into account both the diversity and stability of supplying countries. The calculation formula of HHI-WGI is:
where WGIi, scaled is the WGI standardized by country i.
2.2.5 Environmental risk
The Environmental Performance Index (EPI) summarizes the state of sustainability around the world and measures how closely countries are aligned with established environmental policy goals (Wendling, et al., 2018). The EPI ranks 180 countries on environmental health and ecosystem vitality based on 32 performance indicators across 11 question categories. The EPI scores range from 0 to 100, with 0 representing the lowest environmental performance score and 100 representing the highest environmental performance score. EPI is normalized to 0–1 by Eq. (14).
The aggregate indicator of national environmental risk is defined as HHI-EPI, which takes into account the diversity of supplying countries and the environmental risks in the supply process. HHI-EPI is calculated by Eq. (15).
where EPIi, scaled is the EPI standardized by country i.
ESG is a measure of the health and stability of a business. S&P Global publishes ESG scores and individual index scores for environmental factors (E), social factors (S), governance and economic factors (G) for the world’s major mining companies. Each item is scored on a scale from 0 to 100. The higher the score, the lower the ESG risk. A company’s ESG score is weighted by Eq. (16).
where ESGi is ESG score of company i and Pi is platinum production of company i.
The indicator descriptions in global platinum supply chain risk assessment framework and supply chain risk explanations corresponding to each indicator are shown in Table 1.
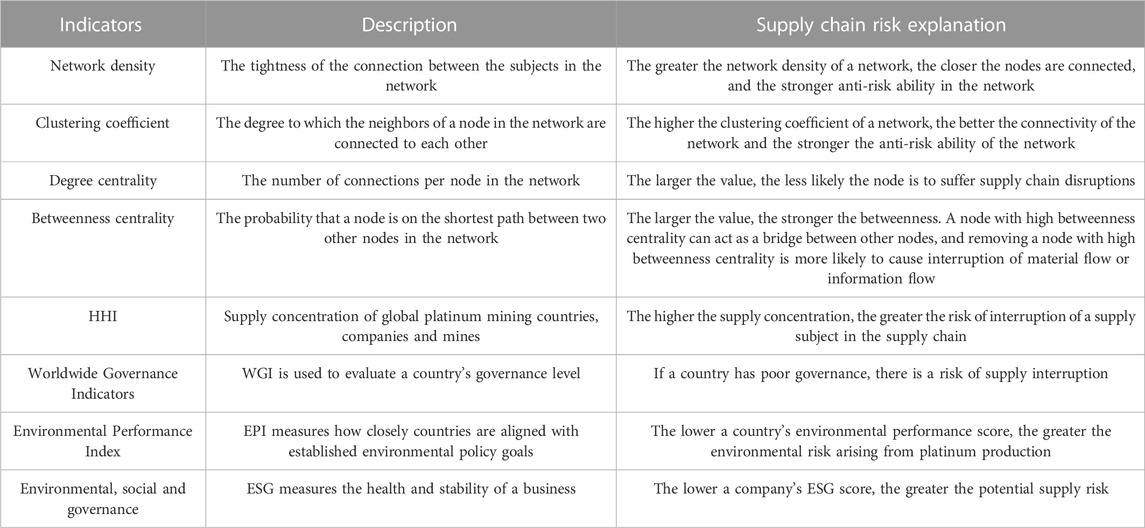
TABLE 1. Indicator description and supply chain risk explanation.
2.2.6 Supply risk rating
Based on the global platinum supply chain risk assessment framework constructed in this paper, each indicator is measured. The determination of the risk level of each indicator mainly draws on previous research results (Zhu, 2016; Wang et al., 2021) and industry standards (U.S. Department of Justice & FTC, 2018). Since there are few studies on the network density and average clustering coefficient of the supply network, the reference is to the index rating of the mineral trade network. After calculation, the score of each indicator is divided into three risk levels: low risk (1–3 points), medium risk (4–6 points), and high risk (7–9 points). According to the risk level corresponding to the evaluation results of each index, each evaluation index is scored (Table 2). In the study, equal weight was assigned to each index, and the score of each index was weighted and averaged to obtain the score of platinum mine supply chain risk, and the evaluation results of each dimension were presented on the radar chart.
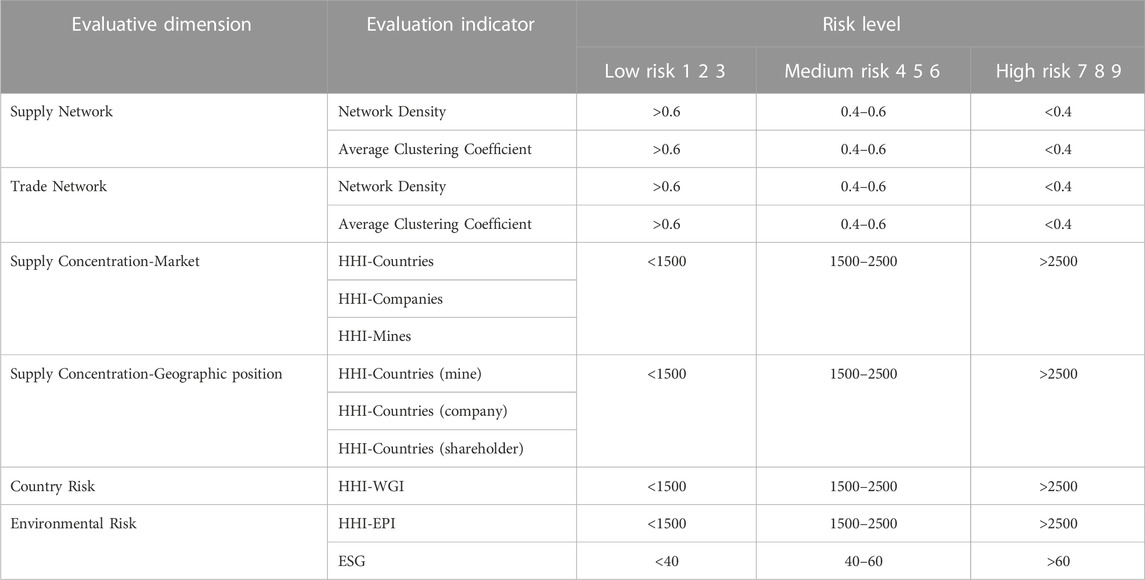
TABLE 2. Risk assessment of the global platinum supply chain.
2.3 Data
This section provides an overview of global platinum mine supply chain data. In the global platinum supply chain network, the national-level platinum mine production and refined platinum production come from USGS; the production data of platinum mines, platinum production companies and shareholders of platinum production companies are from S&P Global. In addition, data for the companies, shareholders and countries to which platinum mines belong, the shareholders and countries to which platinum mines belong, and the countries of the platinum company’s shareholder are also from S&P Global. According to S&P Global, there are 43 platinum mines worldwide for which production is available in 2019, with a combined production of 226.98t. This is approximately 22% higher than the global platinum production according to the USGS, but S&P Global is the only source for which company- and mine-level data are currently available. In the study, the production of selected platinum mines, platinum mining companies, shareholders of platinum mining companies and corresponding producing countries are all greater than 1t, and suppliers with smaller production are excluded. The resulting global platinum mine supply chain network involves 11 countries, 15 platinum production companies, 28 platinum mines, and 22 shareholders of platinum mine companies.
In the trade network of global platinum primary products, the international trade data of global platinum primary products were downloaded from the UN Comtrade Database the UN Comtrade Database (UN Comtrade, 2021). The HS code are HS-711011 and HS-711019. Since data reported by importing countries often differ from those reported by exporting countries, this paper uses import data, which is generally considered more reliable because imports generate tariff revenue and exports do not (van den Brink et al., 2020). The trade data in the paper is the physical weight of imports in 2019, measured by the kilogram. In addition, this study excluded trading countries with an import volume of less than 10 kg, leaving the top 99.8% of the total trade flow. The exclusion of these trade relations and trading countries does not affect the research on major trading countries and trade relations. The research includes a total of 65 countries.
In order to estimate the country risk and environmental risk of the global platinum mine supply, the WGI and EPI of the platinum mine producing country or region need to be obtained. WGI is from the World Bank (World Bank, 2020), and EPI is from a report jointly issued by the Yale Center for Environmental Law and Policy and the Center for International earth Science Information Network in Columbia University (Wendling, et al., 2020). The ESG scores for platinum mines also come from S&P Global. Due to the limitation of data availability, the ESG score of 2021 is selected.
3 Results and discussion
3.1 Overall evaluation of supply risk
3.1.1 Supply network
The global platinum supply network includes 11 countries, 15 companies, 28 mines, and 22 shareholders of companies, as shown in Figure 3. Different colors represent different communities in the network. The global platinum supply network can be divided into 12 communities. Results showed that the network density of the global platinum supply network was calculated to be 0.05. As there is no comparable supply network for other minerals, the global platinum supply network has a very low network density and a very sparse network compared to the trade network for minerals, with a “high risk” rating (Hou et al., 2018). The reason for this may be related to the fact that the global platinum supply network is made up of several participants: mines, companies, countries, and shareholders. If the platinum supply is interrupted, all suppliers will face great risks. The network density can only reflect the number of associations in the network, and the clustering coefficient of the network is also measured to gain insight into the network’s association status (Zhu, 2016). After calculation, the average clustering coefficient of the global platinum supply network is 0.5, indicating that the relationship between the neighbors of the supplying subjects is relatively close and at “medium risk”. For each participant, the more associated partners, the lower the clustering coefficient, and the looser the connection between the participant and the supplier partner. To comprehensively assess the risk resistance of the global platinum supply network, the two indicators of network density and average clustering coefficient are used. It is concluded that the global platinum supply network is very sparse and poorly connected, and the overall risk resistance of the network is weak.
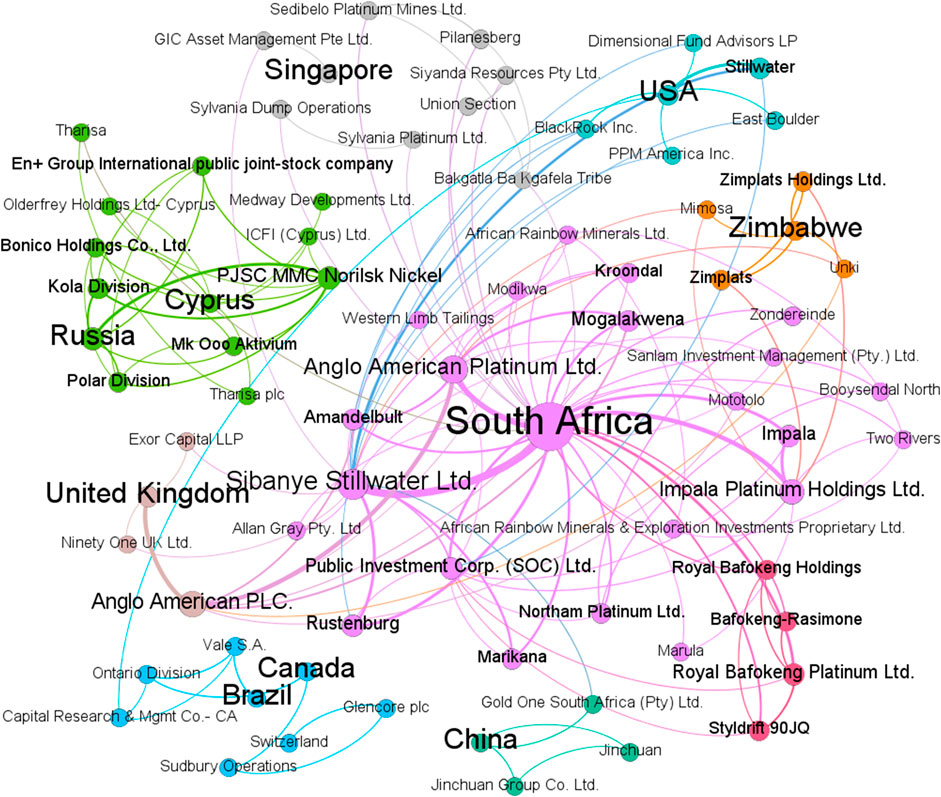
FIGURE 3. The global platinum supply network (GPSN).
3.1.2 Trade network
The international platinum primary product trade network is shown in Figure 4, the trade network can be divided into four communities. This study calculated the network density of the international platinum primary product trade network, and the result is 0.17, which is lower than that of oil, coal, lithium and other minerals (Zhong, 2016; Zhu, 2016), with a “high risk” rating. Because of the limited number of nations active in the global platinum primary products trade network, the number of trade ties created is equally minimal, resulting in a sparse network (Zhong, 2016). If there is a trade disruption, the importing countries will face a greater risk. The average clustering coefficient of the global platinum primary products trade network is 0.49, which means that the trading countries are more interconnected and at “medium risk”. If a country’s trading partners are closely related, then the country has a higher clustering coefficient; conversely, if a country’s trading partners are loosely related, then the country has a lower clustering coefficient (Zhong, 2016). Based on the network density and average clustering coefficient evaluations, it is concluded that the global trade network of primary platinum products is relatively low and has a weak anti-risk ability (Figure 5).
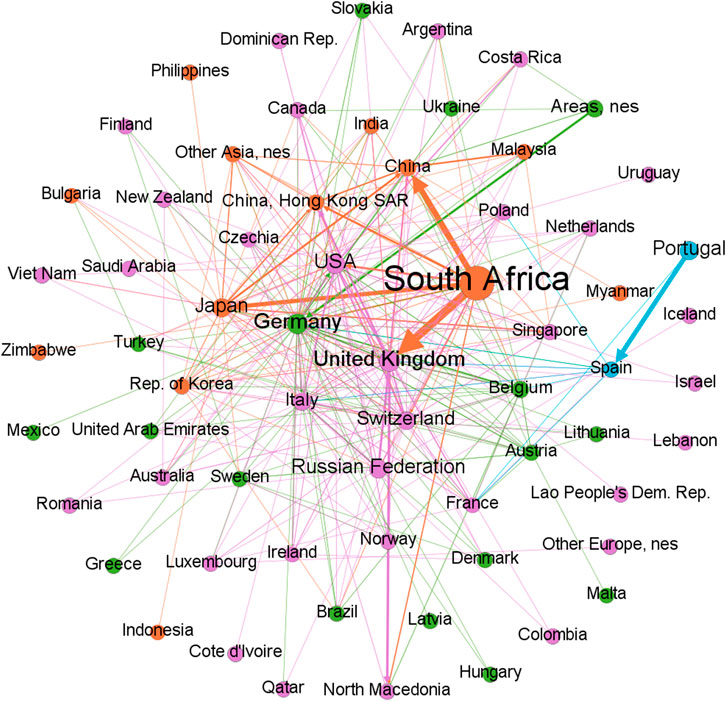
FIGURE 4. International platinum primary product trade network (IPTN).
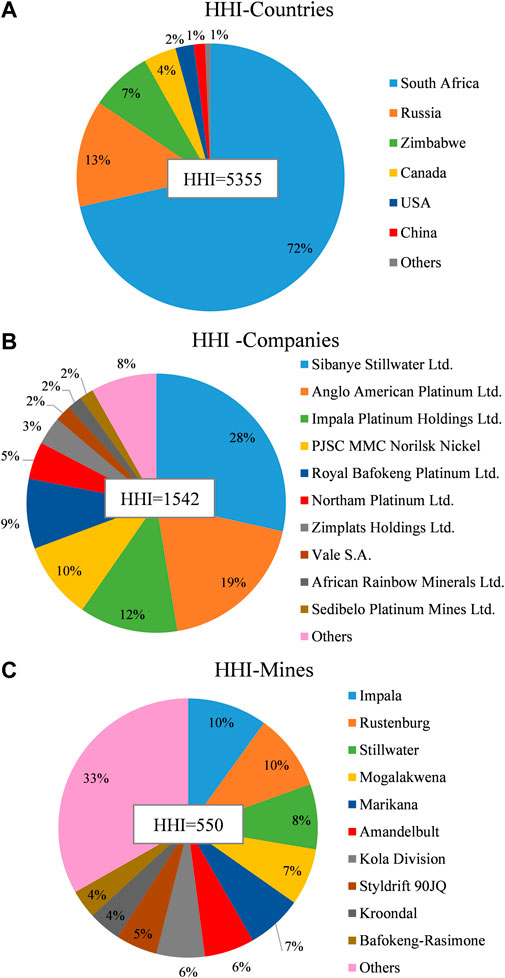
FIGURE 5. Global platinum market concentration: (A) HHI index of platinum producing countries, (B) HHI index of platinum producing companies, (C) HHI index of platinum mines.
3.1.3 Supply concentration
In the study of supply concentration, we analyze it at two levels: the market concentration and the country concentration.
3.1.3.1 Supply concentration-market
At the level of market concentration, we examined not only the production concentration of platinum producing countries, but also the production concentration of platinum production companies and production mines, which is more microscopic than previous studies. The HHI index of 11 platinum mining producing nations, 35 platinum mining corporations, and 43 platinum mines were calculated to be 5355, 1542, and 550, respectively, which are placed in “high risk,” “medium risk,” and “low risk.” The production of South Africa accounts for 72% of the global production, and the production of the top five platinum production companies accounts for 78%; the production of the top five platinum production mines accounts for 43%. Although the concentration of companies and mines is relatively scattered, it does not mean that a decrease in the production of a platinum producer or a platinum mine has little impact on the global platinum supply. In 2020, the shutdown of Anglo American Platinum’s converter plant and the disruption of South Africa mining industry production due to the impact of COV-19 epidemic reduced global platinum supply by about 16% (Johnson Matthey, 2021). Studies have shown that the average ore grade of most platinum producers or projects has shown a long-term and gradual downward trend (e.g. Impala, Northam), although the downward trend appears to have slowed for some platinum producing enterprises in recent years (eg Anglo Platinum. Lonmin, Noril’sk-Taimyr) (Mudd et al., 2018), the decline in platinum ore grade will affect platinum production.
Most of the global platinum smelters are built in areas close to major mines, such as Norilsk in Russia and Bushveld in South Africa, and PGMs mined in Zimbabwe are currently refined in South Africa (Johnson Matthey, 2020). The platinum smelters and refiners can use both primary concentrates and recycled materials to produce PGM powders or bars (Xun et al., 2022). In 2018, South Africa produced about 140 tons of refined platinum (U.S.Geological Survey, 2021a), the US produced about 25 tons of refined platinum (U.S.Geological Survey, 2021b), and Russia produced about 20 tons of refined platinum. It can be seen that the global platinum mine production and refined products are dominated by South Africa.
3.1.3.2 Supply concentration- countries
At the geographical concentration level, we examined the supply concentration of countries where platinum mines, platinum mining firms, and owners of platinum mining companies are located in the global platinum mining supply network. The HHI for countries of the platinum mines, the countries of platinum companies and the countries of shareholders of platinum companies are 6737 (Figure 6A), 5252 (Figure 6B) and 2736 (Figure 6C), respectively, all of which are at “high risk”. In particular, the countries of producing mines and the countries of platinum companies are oligopolistic. From the perspective of non-geographical producing countries, about 71% of the platinum mine production is produced in South Africa, and about 82% of platinum companies production is also located in South Africa, but 39% of platinum mine company shareholders in South Africa, 35% in the United Kingdom and 6% in the United States. In other words, although South Africa has a monopoly in the global platinum supply chain, the United Kingdom and the United States also hold platinum resources that are comparable to South Africa’s production from the standpoint of the shareholders of platinum mining companies.
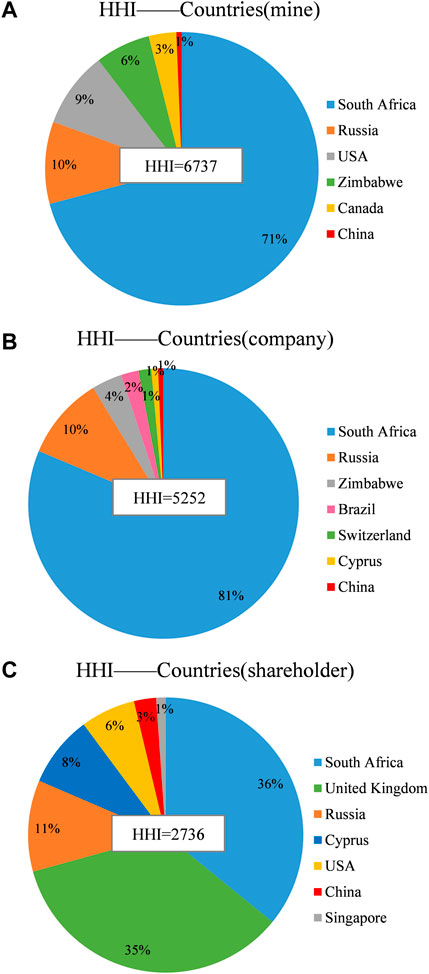
FIGURE 6. Global platinum producing countries concentration: (A) HHI index of the countries of platinum mines, (B) HHI index of the countries of platinum companies, (C) HHI index of the countries of shareholders of platinum companies.
3.1.4 Country risk
ESG has emerged as one of the most central issues in today’s global mining sector. For the first time in 12 consecutive years, KPMG has ranked ESG as the top industry risk (Deloitte, 2022; KPMG, 2022). The possibility of supply disruptions can be reflected by the supplier’s ESG performance which can be quantified by WGI and EPI (Xun et al., 2022).
South Africa is the world’s largest producer of platinum and an exporter of primary platinum products, accounting for 71.5% and 27% of the world’s production and exports, respectively. South Africa has an average WGI score of 0.15 and is in the weaker governance scale on the WGI Index on a scale of −2.5 (weak governance performance) to 2.5 (strong governance performance). Among the six evaluation indicators of WGI, Political Stability and Absence of Violence/Terrorism scored the lowest. South Africa has strict labor laws, strong labor unions, tense labor relations and frequent strikes. The Marikana riots in 2012, which murdered 34 miners, had a significant influence on South African platinum mine productivity. (Harvey, 2016; Mudd et al., 2018). 70,000 South African platinum mine employees went on strike in 2014–2015, which resulted in a 40% decrease in global platinum production. (Rasmussen et al., 2019). Russia, the second largest producer of platinum mine, has an average WGI score of −0.58, with the lowest score in Voice and Accountability among the six indicators, and is in a weaker governance level. Zimbabwe, the third largest platinum producer, has an average WGI score of −1.21, with low scores in all six indicators and a weak governance rating. Canada and the United States have relatively strong governance with WGI scores of 1.57 and 1.09, respectively, but these two countries have a relatively low share of platinum production, accounting for 3.9% and 2.2% of global production, respectively. By normalizing the political risk for the six platinum producing countries with production greater than 1 ton (99% of global production), the HHI-WGI for platinum producing countries is 2552 (Table 2), which indicates a high political risk and is “high risk".
3.1.5 Environmental risk
The EPI, published by Yale University, rates and grades countries based on how well they perform on sustainability challenges. The world’s leading platinum producers, South Africa, Russia and Zimbabwe, with EPI scores of 43.1, 50.5 and 37, ranked 95th, 58th and 123rd, respectively, out of 180 countries evaluated. With high EPI rankings but low platinum production, Canada and the United States were placed 20th and 24th, respectively, while China was ranked 120th (Table 3). By normalizing the environmental risk for the six platinum producing countries with production greater than 1 ton (99% of global production), the HHI-EPI for platinum producing countries is 3033, which is “high risk”. The higher the HHI-EPI, the higher the concentration of supply in the supplying countries, and the higher the environmental risk, which implies a higher probability of negative environmental impacts in the supply process (Xun et al., 2022).
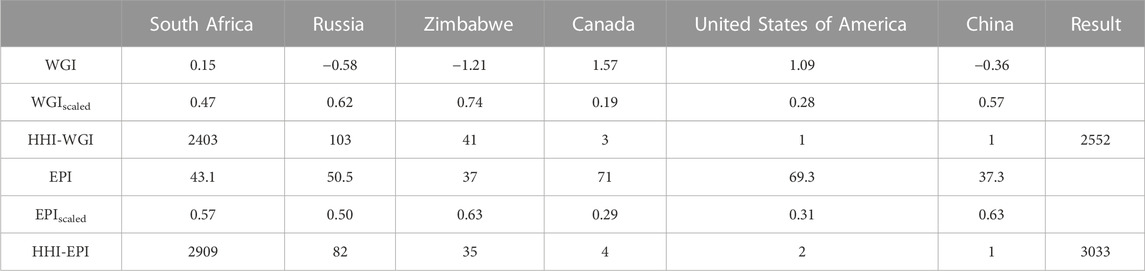
TABLE 3. Political and environmental risks of major platinum mine producing countries in the world.
This study also assesses ESG at the platinum mining company level to determine the likelihood of supply disruptions at the company level. The overall ESG scores of the world’s leading platinum producing companies are low, and they face a relatively high risk of supply disruption. By weighting the ESG scores of eight of the top 10 global platinum companies available by production, the average ESG score is 49.3 (Table 4). Individual enterprises, however, have less than 50 ESG scores and are vulnerable to supply, including Sibanye Stillwater Ltd, PJSC MMC Norilsk Nickel, Royal Bafokeng Platinum Ltd, Northam Platinum Ltd, and African Rainbow Minerals Ltd. Although Zimplats Holdings Ltd.’s ESG score is not currently available, Zimbabwe’s WGI and EPI are both low in the global rankings, therefore it is speculated that Zimplats Holdings Ltd.'s ESG score is lower than the global average.
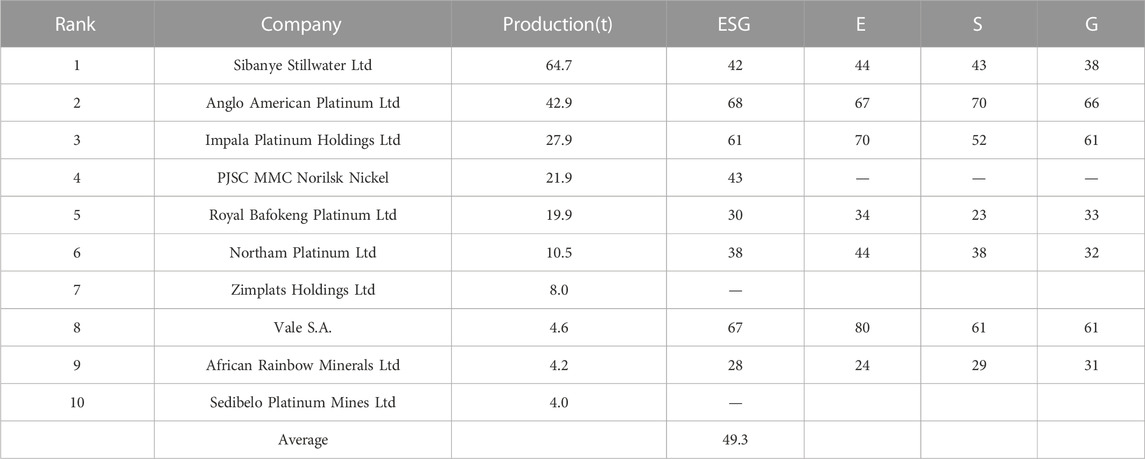
TABLE 4. ESG scores of the top 10 platinum companies in the world.
3.1.6 Supply risk rating
The aforementioned study led to the calculation and scoring of 13 indicators across 5 dimensions of the global platinum mine upstream supply chain risk. Among them, Supply network score is 7 (“high risk”), Trade network score is 7 (“high risk”), Supply concentration-Market score is 5 (“medium risk”), Supply concentration-Countries score is 8 (“high risk”), Country Risk score is 7 (“high risk”), and Environmental Risk score is 6 (“medium risk”), resulting in a global upstream platinum mining supply chain risk composite score of 7, rated as “High risk”. In order to assess the possible supply risks of each dimension more clearly, we present Supply concentration-Market and Supply concentration-Countries and the scores of the other four dimensions on the radar chart (Figure 7). By comparing with the trade network of nickel ore, lithium ore, rare earth and other minerals (Zhu, 2016; Hou et al., 2018; Wang et al., 2022), this study evaluates the overall supply risk of the global platinum supply network and platinum primary product trade network. It is considered that the average clustering coefficient of the global platinum supply network and platinum primary product trade network is moderate, but the network is sparse, the connectivity is poor, and the overall anti-risk ability of the network is poor. The three indicators of Supply Concentration, Country Risk, and Environmental Risk are all closely related to the concentration of global platinum mine production.
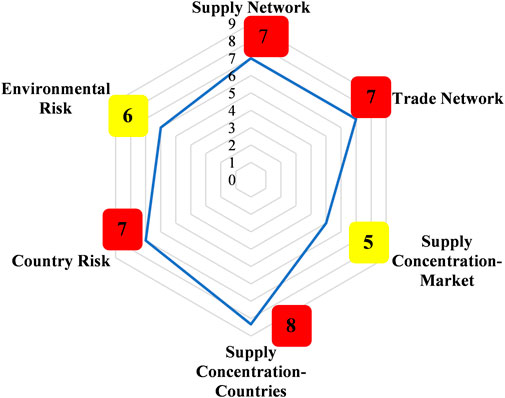
FIGURE 7. Radar chart of overall assessment of global platinum supply risk.
Regarding the supply risk of global platinum mine, we first discuss the global platinum resource endowment and whether there is a problem of exhaustion. According to research, the worldwide supply of PGMs resources will not be depleted in the coming decades (Jowitt et al., 2020), and it is unlikely to be a development restriction for future platinum applications. However, the distribution of PGMs reserves and demand is extremely mismatched due to the distribution of global resources (Hao et al., 2019), and there may be greater supply risks.
The distribution of global platinum mine resources is highly concentrated. Exploration for platinum mine and research on the genesis of deposits have grown significantly in recent years in an effort to disrupt South Africa’s and Russia’s supply monopolies on the world’s platinum ore resources (Maier, 2005). Potential prospects in the United States, Canada, Finland, Australia, and parts of Africa have been the focus of large-scale geophysical and geochemical exploration campaigns (Hoatson, 1998; Fiorentini et al., 2010; Lapworth et al., 2012), but the high concentration of global platinum resources has not yet been broken. It is expected that changing this situation will be tough.
In 2019, South Africa’s platinum mine production accounted for 72% of global production, and South Africa’s platinum mine production came from almost a single mining area–the Bushveld Igneous Complex (Mudd et al., 2018). Platinum mine production in South Africa is affected by underlying technological (e.g. mining depth), infrastructure (e.g. secure supply of energy to mining areas) and social (e.g. recent mine strikes and related violence) issues (Mudd et al., 2018), and appears to be directly influenced by the level of social progress in the region (Yuan et al., 2020). The WGI of South Africa is close to the global average level, and the environmental risk rating is lower than the global average level. If the supply is disrupted, it will have a serious impact on the global platinum mine supply.
Platinum mine production in Russia accounts for 13% of global production. Russia’s WGI is lower than the global average, and its environmental risk is comparable to the global average. Affected by the Russia-Ukraine conflict, Russian refiners were removed from the London Platinum and Palladium Market (LPPM) delivery list by on 8 April 2022, and Russia’s platinum mine production and exports have also increased uncertainty. Platinum supply in Russia is also at risk.
One of the most essential approaches to mitigate the risk of the platinum supply chain is to develop secondary supply of platinum. Despite the fact that the global supply structure of PGMs refining is comparable to that of mining, the supply risk of PGMs refining is reduced by more than 30% if secondary supply is taken into account (Xun et al., 2022). A sector-by-sector examination reveals that the majority of the world’s secondary supply of platinum is recovered from autocatalytic and jewelry scrap. In terms of recycling regions, the United States, the European Union, and Japan account for the majority of the world’s secondary supply of platinum (Yuan et al., 2020). As early as 1998, 76% of end-of-life products containing platinum were recycled in the United States (Alonso et al., 2012). Several nations in the European Union have recycling goals for used vehicles since 2006. With the global secondary supply of platinum accounting for 26% of total platinum supply in 2019, which can fulfill 16% of global platinum consumption, the global in-use stocks of PGMs provide good potential for recycling (Johnson Matthey, 2021).
Having sufficient PGMs reserves is a crucial assurance approach to reduce risk in the upstream supply chain of platinum and seize the lead in the global hydrogen energy industry in the future, in addition to securing a steady supply source. The major industrialized nations of the world have put in place a thorough strategic reserve management system for rare metals. The United States, Russia, the European Union, and Japan, for example, have all designated PGMs as strategic reserve metals (Ji and Tian, 2022). A nation’s emergency response capacity can be increased by having national strategic reserves, which can handle emergencies.
3.2 Supply risk analysis of main participants
Network analysis can be used to find out the most important participants in relation to their network placement, which is also known as centrality, i.e. the location in the network (Lee and Sohn, 2015). The overall network indicators are selected above to evaluate the overall anti-risk capability of the network. Both the Supply network and the Trade network have relatively weak anti-risk capabilities and are classified as “high risk”, but the position and risk exposure of different participants within the network are worth further exploration.
3.2.1 The position of the major participants in the supply network
Based on Eq. 7, this study calculates the status of platinum producing countries, platinum ore companies, platinum mines, and shareholders of platinum mine companies in the global platinum supply network (Figure 8). The stronger the betweenness centrality of a country (company/mine/shareholder), the more it acts as a “bridge” in the supply network. It is important to highlight these nodes, since their removal may cause supply disruption (Nuss et al., 2016a).
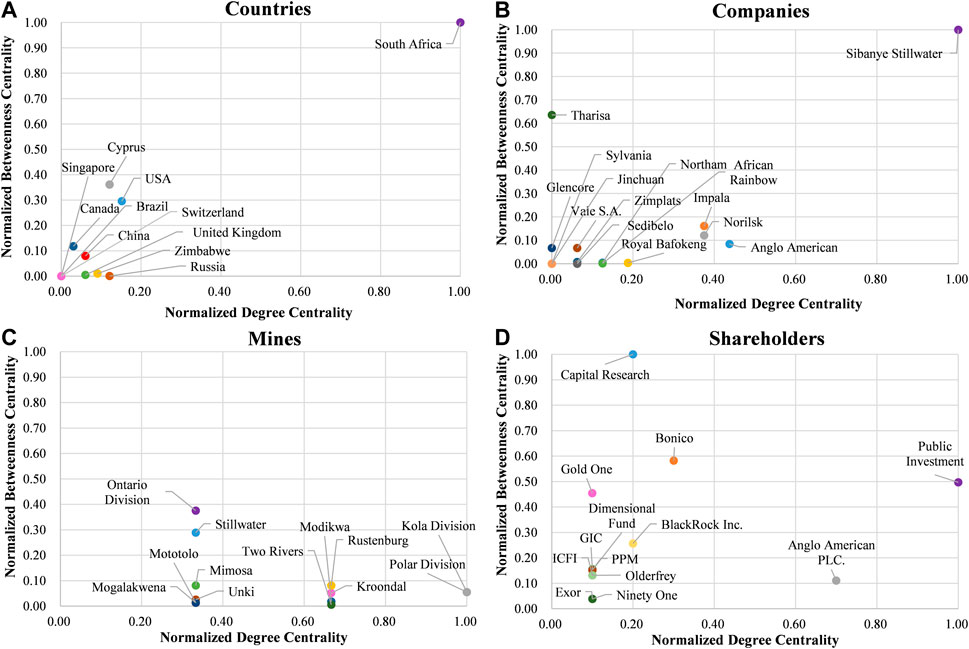
FIGURE 8. The betweenness centrality of various supply subjects in the global platinum supply network: (A) The betweenness centrality of countries, (B) The betweenness centrality of companies, (C) The betweenness centrality of mines, (D) The betweenness centrality of shareholders.
In terms of global platinum producing countries (Figure 8A), South Africa is undoubtedly the country with the highest degree centrality and betweenness centrality, that is, the strongest control. The control of other countries in the network is far from that of South Africa, which produces several times more platinum than Russia, Zimbabwe, the United States, Canada, etc. (Johnson Matthey, 2020). South Africa has a large number of platinum mines, production companies and refineries, and countries with diverse production locations are less prone to supply chain disruptions than countries with fewer production locations (Nuss et al., 2016a). The United States came in second while Cyprus came in third. This is because, in addition to owning the Stillwater mine locally, the United States also has investment holdings in some South African platinum mining producing companies. In addition to being the registered place of Tharisa plc, Cyprus is also the registered place of part of the shareholders of the Russian Norilsk company. Cyprus’ position in the network is more a reflection of Russia’s platinum supply.
For the global platinum producing companies (Figure 8B), Sibanye Stillwater Ltd. has the highest betweenness centrality, which is also the world’s largest platinum producer. It is followed by South Africa’s Impala Platinum Holdings Ltd, Russia’s PJSC MMC Norilsk Nickel and South Africa’s Anglo American Platinum Ltd, which are ranked third and fourth among global platinum producers, respectively. It can be seen that the control power of global platinum production companies is strongly proportional to the amount of platinum production.
In terms of platinum mines (Figure 8C), Canada’s Ontario division is the mine with the highest betweenness centrality, followed by Stillwater in the United States, and Russia’s Kola division and Polar division in third place. The control of global platinum mines has little to do with mine output and much to do with the comprehensiveness of the company to which it belongs. The control of global platinum mines has little to do with mine output and more to do with the comprehensiveness of the company it belongs to. The Ontario division mine belongs to Vale S.A, the third largest mining company in the world (ranked by market capitalization). The Stillwater mine, a subsidiary of Sibanye Stillwater Ltd, is the world’s largest platinum producer and ranks 24th among the top 40 global mining companies by market value. The Kola division mine and the Polar division mine are owned by PJSC MMC Norilsk Nickel, the sixth largest mining company in the world. In other words, mines owned by large integrated mining companies act as a “bridge” role in the supply network.
In terms of shareholders of global platinum mining companies (Figure 8D), the highest betweenness centrality is Public Investment Corp. (SOC) Ltd. in South Africa. Rounding out the top five are Capital Research and Mgmt Co. in the United States, Bonico Holdings Co. Ltd. in Cyprus, Anglo American PLC. in the United Kingdom, and BlackRock Inc. in the United States. In terms of shareholders of global platinum mining companies (Figure 8D), the most betweenness centrality is Public Investment Corp. (SOC) Ltd. in South Africa. Capital Research and Mgmt Co. of the United States, Bonico Holdings Co. Ltd. of Cyprus, Anglo American PLC. of the United Kingdom, and BlackRock Inc. of the United States round out the top five. Among the top five shareholder status, only one company is affiliated with South Africa, while companies in the United States and the United Kingdom have an important position. Cyprus’ Bonico Holdings Co. Ltd. is a stakeholder of Norilsk Nickel, which has its registered office in Cyprus, while Bonico is a Russian corporation.
Following that, we examine the countries that are home to the top ten participants of betweenness centrality (Figure 9). At the country level of each supplier, 10 countries are involved, of which South Africa is the largest producer; at the company’s country level, 14 countries are involved, of which 9 are in South Africa; at the country level of the mine, 13 countries are involved, of which 7 are in South Africa; at the country level of the company’s shareholders, 13 countries are involved, including one in South Africa, four in the United States, three in the United Kingdom, three in Cyprus (where the Russian company is registered). Therefore, in the global platinum supply network, South Africa has strong control at the level of platinum producing countries, companies and mines. However, the United States, the United Kingdom, and Russia have greater power over than South Africa at the company’s shareholder level (Figure 9).
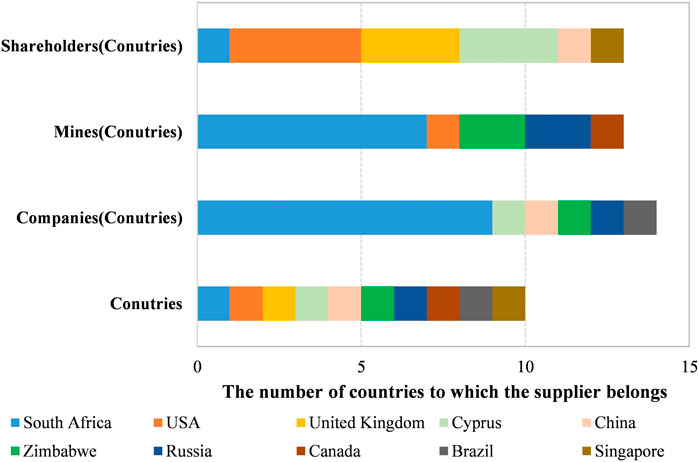
FIGURE 9. The countries of the top 10 suppliers of betweenness centrality in the global platinum supply network.
3.2.2 The position of the major participants in trade network
In 2019, the global trade in platinum primary products was 502 tonnes (physical). The main exporter of platinum primary products is South Africa (1.78 million tons), followed by the United Kingdom (470 kilotons), Germany (450 kilotons), the United States (350 kilotons), and Japan (320 kilotons); while the main importer is The United Kingdom (950 kilotons), China (710 kilotons), Germany (410 kilotons), the United States (410 kilotons), Japan (380 kilotons), etc. South Africa is the world’s largest supplier and exporter of platinum, with the majority of primary platinum products going to the United Kingdom (33%), China (22%), Japan (16%), China Hong Kong (7%), and the United States (7%). The United Kingdom, Germany, the United States and Japan are both major exporters and major importers, and can be regarded as transit points for international trade in primary platinum products. Because platinum is widely employed in industrial domains such as catalysts, electronics, and glass, primary platinum product importers are primarily concentrated in advanced industrial countries. (Tokito et al., 2016).
The position of each trading country in the international platinum primary product network is then assessed (Figure 10). At the top of the list is Germany, the most extensively connected country in the platinum primary products trade network, with the strongest control. Germany is a global leader in the import and export of platinum primary products. It is also an important producer of automobile exhaust catalysts and automobiles (Xun et al., 2022). The following countries on the list are Italy, the United States, Switzerland, the United Kingdom, and Japan, in which the United States and Japan are the two most important global producers in the automotive industry. Zurich in Switzerland is the center of platinum spot trading, and the United Kingdom has a globally important platinum transaction market (Harvey, 2016). As the world’s second largest platinum consumer market and the second largest importer of primary products, China only ranks 12th, with weak control and a relatively high probability of supply disruption. South Africa, the world’s largest producer and exporter of platinum, is only seventh. That is, although South Africa is an oligarch in the global supply of platinum mine, its position and control in the trade network is not as powerful as that of transit and consumer countries represented by Germany, Italy, the United States, Switzerland and the United Kingdom. In general, countries that play a pivotal role are often thought to have excellent anti-risk capabilities.
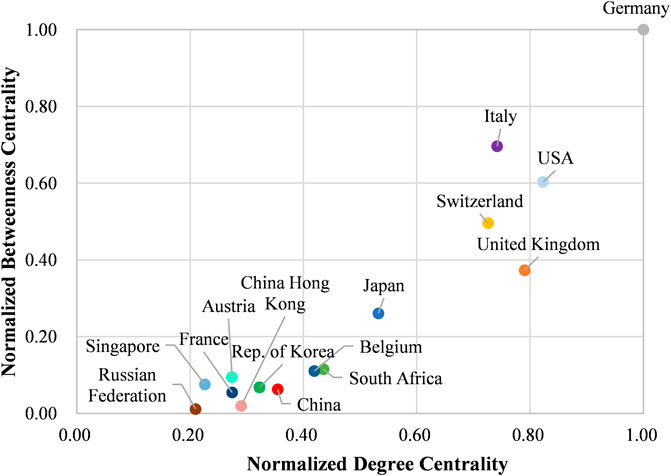
FIGURE 10. Country (area) position of the international platinum primary product trade network.
3.2.3 Comprehensive analysis of participants status
China, the United States, Europe, and Japan are now the world’s top platinum consumers (Johnson Matthey, 2020). The consumer countries involved in the global platinum supply network are China, the United States, the United Kingdom, etc., but their platinum mine production and national status are far inferior to that of the supplier country, South Africa. The platinum supply and demand markets are highly separated. The key importing countries in the platinum primary product trade network are China, the United States, Europe, and Japan. With the exception of China, the majority of other consuming countries have a higher national position in the trade network than South Africa. In general, South Africa has the strongest control in the global platinum supply market; the United States has the most sway over the consumer market; and China is the weakest and most vulnerable. By focusing on overseas investment, regional supply risks can be effectively reduced (Sun et al., 2019).
Currently, the largest consumer of platinum in the world is automotive exhaust catalysts. The major producers of ICEV-related PGM catalysts are the United States, China, Japan, and Germany, all of which are also major producers of automobiles (Xun et al., 2022). Platinum is a critical raw material for fuel cells, and the future development of global fuel cell vehicles may bring about significant changes in platinum consumption. The global producers of PGM catalysts for fuel cell vehicles are mainly South Korea and the United States, which are also major producers of fuel cell vehicles; other producers include China, Japan, and Germany (Xun et al., 2022). Considering the manufacturing technical barriers, global production of PGM catalysts is concentrated in specific countries and regions, and capacity transfer is difficult (Islam et al., 2018). Therefore, it is challenging to change the global platinum supply and demand pattern and national position in the short term.
4 Conclusion
This study constructs a global platinum mine supply chain risk assessment framework that integrates network analysis and evaluation indicators, and analyzes the global platinum mine upstream supply chain risk in detail. By mapping the supply network of global platinum producing countries, mines, companies, and company-owned shareholders, as well as the international platinum primary product trade network, the visualization of various relationships in the global platinum mine upstream supply chain is realized. The global supply structure of refined platinum products is similar to the supply structure of platinum mines. The analysis of the supply network of platinum mines in this paper also provides a reference for the supply structure of refined platinum products. The main conclusions are as follows:
First, the global platinum mine upstream supply chain risk comprehensive score is 7 points, and the rating is “high risk”. Among them, Supply network, Trade network, Supply concentration-Countries and Country Risk all have supply risks, and with the risk of supply chain interruption being very high.
Second, although the global platinum supply network and platinum primary product network are closely related to their neighbors, they are both sparse networks, with poor overall network connectivity and weak anti-risk capabilities.
Third, at the non-geographic level of producing countries, global supply concentration is high in the producing countries of platinum mines, in the countries of the producing companies and in the countries of the shareholders of the producing companies. Global concentration, however, is moderate in platinum producing companies and low in platinum mines.
Fourth, South Africa has an absolute monopoly on the resources and supply of global platinum mine, but at the level of shareholders of companies in the global platinum supply network, it has less control than the United States, the United Kingdom and Russia. In the international platinum primary product trade network, the control is not as good as that of the transit and consumer countries represented by Germany, Italy, the United States, Switzerland, and the United Kingdom.
Restricted by the global platinum resource endowment, platinum resources and production are dominated by South Africa. This high geographical concentration is unchangeable. Platinum consuming countries can reduce supply risks by doing the following:
First, optimize the supply structure of platinum upstream supply chain. Improve the supply capacity of domestic platinum mines and allied platinum mines; if domestic platinum resources are scarce, the domestic supply capacity can be increased by increasing secondary resource recovery.
Second, build an international large-scale comprehensive mining company. International large-scale integrated mining companies and their subordinate mines can act as a “bridge” role in the supply network while maintaining strong control.
Third, increase the global supply share by investing and holding overseas mines. The global platinum supply and demand market are severely separated. Platinum consuming countries can learn from how the United States and the United Kingdom engage in platinum mining companies in South Africa to raise the production of overseas equity mines and strengthen their influence and voice in the platinum supply market.
Data availability statement
The raw data supporting the conclusions of this article will be made available by the authors, without undue reservation.
Author contributions
PL: Conceptualization, Methodology, Software, Writing-original draft, review and editing; QL: Data curation, Methodology; PZ: Writing-review and editing; YL: Formal analysis.
Funding
This study is supported by the National Natural Science Foundation of China (Grant No. 71991485, No. 92162321, and No. 71991480), Basic Science Center Project for National Natural Science Foundation of China (Grant No. 72088101), and geological survey projects of China Geological Survey (Grant No. DD20221795).
Acknowledgments
The authors would like to thank Hongxiang Jia and Zhe Ma for their helpful recommendations while authoring this work. The editor and two reviewers are appreciated for their insightful and constructive remarks, which substantially improved this manuscript.
Conflict of interest
The authors declare that the research was conducted in the absence of any commercial or financial relationships that could be construed as a potential conflict of interest.
Publisher’s note
All claims expressed in this article are solely those of the authors and do not necessarily represent those of their affiliated organizations, or those of the publisher, the editors and the reviewers. Any product that may be evaluated in this article, or claim that may be made by its manufacturer, is not guaranteed or endorsed by the publisher.
References
Achzet, B., and Helbig, C. (2013). How to evaluate raw material supply risks—An overview. Resour. Policy. 38 (4), 435–447. doi:10.1016/j.resourpol.2013.06.003
Akcil, A., Sun, Z., and Panda, S. (2020). COVID-19 disruptions to tech-metals supply are a wakeup call. Nat 587, 365–367. doi:10.1038/d41586-020-03190-8
Alonso, E., Field, F. R., and Kirchain, R. E. (2012). Platinum availability for future automotive technologies. Environ. Sci. Technol. 46, 12986–12993. doi:10.1021/es301110e
Australian Government Department of Industry (2022). 2022 Critical minerals strategy. Available at: https://www.ga.gov.au/scientific-topics/minerals/critical-minerals (Accessed June 1, 2022).
Bellamy, M. A., and Basole, R. C. (2012). Network analysis of supply chain systems: A systematic review and future research. Syst. Eng. 16 (2), 235–249. doi:10.1002/sys.21238
Chen, G., Kong, R., and Wang, Y. (2020). Research on the evolution of lithium trade communities based on the complex network. Phys. A 540, 123002. doi:10.1016/j.physa.2019.123002
Deloitte (2022). Tracking the rends 2022. Deloitte touche tohmatsu limited. Available at: https://www2.deloitte.com/content/dam/Deloitte/global/Documents/Energy-and-Resources/gx-tracking-the-trends-2022-digital.pdf (Accessed August 20, 2022).
European Commission (2017). On the 2017 list of critical raw materials for the EU. Ad-hoc working group on defining critical raw minerals of the Raw Materials Supply Group. Luxembourg: Publications Office of the European Union.
European Commission (2014). On the review of the list of critical raw materials for the EU and the implementation of the Raw Materials Initiative Ad-hoc working group on defining critical raw minerals of the Raw Materials Supply Group. Luxembourg: Publications Office of the European Union.
European Commission (2020). Study on the EU’s list of critical raw materials–final report. Luxembourg: Publications Office of the European Union.
European Commission (2011). Tackling the challenges in commodity markets and on raw materials Ad-hoc working group on defining critical raw minerals of the Raw Materials Supply Group. Luxembourg: Publications Office of the European Union.
Fan, Y., Ren, S., Cai, H., and Cui, X. (2014). The state's role and position in international trade: A complex network perspective. Econ. Modell. 39, 71–81. doi:10.1016/j.econmod.2014.02.027
Fiorentini, M. L., Barnes, S. J., Lesher, C. M., Heggie, G. J., Keays, R. R., and Burnham, O. M. (2010). Platinum group element geochemistry of mineralized and non-mineralized komatiites and basalts. Econ. Geol. 105, 795–823. doi:10.2113/gsecongeo.105.4.795
Freeman, L. C. (1977). A set of measures of centrality based on betweenness. Sociometry 40, 35. doi:10.2307/3033543
Geng, J. B., Ji, Q., and Fan, Y. (2014). A dynamic analysis on global natural gas trade network. Appl. Energ 132, 23–33. doi:10.1016/j.apenergy.2014.06.064
Grandell, L., and Thorenz, A. (2014). Silver supply risk analysis for the solar sector. Renew. Energy 69, 157–165. doi:10.1016/j.renene.2014.03.032
Hao, H., Geng, Y., Tate, J. E., Liu, F., Sun, X., Mu, Z., et al. (2019). Securing platinum group metals for transport low-carbon transition. One Earth 1, 117–125. doi:10.1016/j.oneear.2019.08.012
Harvey, R. G. (2016). Why is labour strife so persistent in South Africa’s mining industry? Extr. Ind. Soc. 3, 832–842. doi:10.1016/j.exis.2016.04.008
Hm Government, (2017). Industrial strategy: Building a britain fit for the future. Available at: www.gov.uk/government/publications (Accessed January 30, 2021).
Hoatson, D. M. (1998). Platinum-group element mineralisation in Australian Precambrian layered mafic–ultramafic intrusions. AGSO J. Aust. Geol. Geophys. 17, 139–151.
Hou, W., Liu, H., Wang, H., and Wu, F. (2018). Structure and patterns of the international rare earths trade: A complex network analysis. Resour. Policy 55, 133–142. doi:10.1016/j.resourpol.2017.11.008
Islam, K. M. N., Hildenbrand, J., and Hossain, M. M. (2018). Life cycle impacts of three-way ceramic honeycomb catalytic converter in terms of disability adjusted life year. J. Clean. Product. 182, 600–615. doi:10.1016/j.jclepro.2018.02.059
Ji, C., and Tian, X. (2022). Research on the current situation and strategic reserves of China's platinum group metals industry. China Nonferrous Met. 9, 48–49.
Jowitt, S. M., Mudd, G. M., and Thompson, J. F. H. (2020). Future availability of non-renewable metal resources and the influence of environmental, social, and governance conflicts on metal production. Commun. Earth Environ. 1, 13–18. doi:10.1038/s43247-020-0011-0
KPMG (2022). Global mining outlook 2022. KPMG International. Available at: https://home.kpmg/xx/en/home/insights/2022/04/global-mining-outlook-2022.html (Accessed August 20, 2022).
Lapworth, D. J., Knights, K. V., Key, R. M., Johnson, C. C., Ayoade, E., Adekanmi, M. A., et al. (2012). Geochemical mapping using stream sediments in west-central Nigeria: Implications for environmental studies and mineral exploration in west Africa. Appl. Geochem. 6, 1035–1052. doi:10.1016/j.apgeochem.2012.02.023
Lee, H., and Sohn, I. (2015). Fundamentals of big data network analysis for research and industry. Hoboken: Wiley.
LiHuangZhang, Y. J. H., and Zhang, H. (2022). The impact of country risks on cobalt trade patterns from the perspective of the industrial chain. Resour. Policy 77, 102641. doi:10.1016/j.resourpol.2022.102641
Macdonald, A., Lam, P., and Penchev, D. (2020). COVID-19 Mining impacts – mining projects with at risk production. S&P Global. Available at: https://www.spglobal.com/marketintelligence/en/news-insights/blog/covid19-mining-impacts-mining-projects-with-at-risk-production (Accessed February 30, 2021).
Maier, W. D. (2005). Platinum-group element (PGE) deposits and occurrences: Mineralization styles, genetic concepts, and exploration criteria. J. Afr. Earth Sci. 41, 165–191. doi:10.1016/j.jafrearsci.2005.03.004
Johnson Matthey (2020). Johnson matthey PGM market report may 2020. Available at: https://matthey.com/products-and-markets/pgms-and-circularity/pgm-management/market-research (Accessed December 20, 2021).
Johnson Matthey (2021). Johnson matthey PGM market report may 2021. Available at: https://matthey.com/products-and-markets/pgms-and-circularity/pgm-management/market-research (Accessed September 25, 2021).
Mudd, G. M., Jowitt, S. M., and Werner, T. T. (2018). Global platinum group element resources, reserves and mining – A critical assessment. Sci. Total Environ. 622–623, 614–625. doi:10.1016/j.scitotenv.2017.11.350
Nansai, K., Nakajima, K., Kagawa, S., KondoSuh, Y,S., Shigetomi, Y., Oshita, Y., et al. (2014). Global flows of critical metals necessary for low-carbon technologies: The case of neodymium, cobalt, and platinum. Environ. Sci. Technol. 48 (3), 1391–1400. doi:10.1021/es4033452
National Research Council (NRC), (2008). Minerals, critical minerals, and the U.S. economy. Washington, DC: National Academies Press.
Natural Resources Canada (2021). Canada’s critical minerals list. Available at: https://www.nrcan.gc.ca/sites/nrcan/files/mineralsmetals/pdf/Critical_Minerals_List_2021-EN.pdf (Accessed June 10, 2022).
Nuss, P., Chen, W. Q., Ohno, H., and Graedel, T. E. (2016b). Structural investigation of aluminumin the U.S. economy using network analysis. Environ. Sci. Technol. 50 (7), 4091–4101. doi:10.1021/acs.est.5b05094
Nuss, P., Graedel, T. E., Alonso, E., and Carroll, A. (2016a). Mapping supply chain risk by network analysis of product platforms. Sustain. Mater. Technol. 10, 14–22. doi:10.1016/j.susmat.2016.10.002
Peng, P., Lu, F., Cheng, S., and Yang, Y. (2021). Mapping the global liquefied natural gas trade network: A perspective of maritime transportation. J. Clean. Prod. 283, 124640. doi:10.1016/j.jclepro.2020.124640
Rasmussen, K. D., Wenzel, H., Bangs, C., Petavratzi, E., and Liu, G. (2019). Platinum demand and potential bottlenecks in the global green transition: A dynamic material flow analysis. Environ. Sci. Technol. 53 (19), 11541–11551. doi:10.1021/acs.est.9b01912
Schmid, M. (2019). Rare earths in the trade dispute between the US and China: A déjà vu. Intereconomics 54 (6), 378–384. doi:10.1007/s10272-019-0856-6
Sun, X., Hao, H., Hartmann, P., Liu, Z., and Zhao, F. (2019). Supply risks of lithium-ion battery materials: An entire supply chain estimation. Mater Today Energy 14, 100347–7. doi:10.1016/j.mtener.2019.100347
Sun, X. (2022). Supply chain risks of critical metals: Sources, propagation, and responses. Front. Energy Res. 10, 01–11. doi:10.3389/fenrg.2022.957884
Tokito, S., Kagawa, S., and Nansai, K. (2016). Understanding international trade network complexity of platinum: The case of Japan. Resour. Policy. 49, 415–421. doi:10.1016/j.resourpol.2016.07.009
Trump, D. J. (2017). Executive order 13806—assessing and strengthening the manufacturing and defense industrial base and supply chain resiliency of the United States. Available at: https://www.presidency.ucsb.edu/node/329608 (Accessed January 30, 2021).
UN Comtrade (2021). UN comtrade international trade statistics database. Available at: https://comtrade.un.org (Accessed December 1, 2021).
U.S. Department of Energy (DOE) (2010). Critical minerals’ strategy. Available at: https://www.energy.gov/sites/prod/files/edg/news/documents/criticalmaterialsstrategy.pdf (Accessed February 30, 2020).
U.S. Department of Justice and FTC (2018). Herfindahl-hirschman-index. Available at: https://www.justice.gov/atr/herfindahl-hirschman-index (Accessed February 30, 2021).
U.S. Geological Survey (2021a). 2016 minerals yearbook - South Africa. Available at: https://www.usgs.gov/centers/national-minerals-information-center/platinum-group-metals-statistics-and-information (Accessed February 20, 2021).
U.S. Geological Survey (2021b). 2020 minerals yearbook-platinum. Available at: https://www.usgs.gov/centers/national-minerals-information-center/platinum-group-metals-statistics-and-information (Accessed February 20, 2021).
U.S. Geological Survey (2022). 2022 final list of critical minerals. Available at: https://www.usgs.gov/news/national-news-release/us-geological-survey-releases-2022-list-critical-minerals (Accessed May 25, 2022).
U.S. Geological Survey (2018). Critical mineral resources of the United States—economic and environmental geology and prospects for future supply. Available at: https://pubs.er.usgs.gov/publication/pp1802 (Accessed April 20, 2021).
U.S. Geological Survey (2020). Mineral commodity summaries 2020. Available at: https://www.usgs.gov/centers/national-minerals-information-center/mineral-commodity-summaries (Accessed September 12, 2021).
van den Brink, S., Kleijn, R., Sprecher, B., and Tukker, A. (2020). Identifying supply risks by mapping the cobalt supply chain. Resour. Conserv. Recycl. 156, 104743. doi:10.1016/j.resconrec.2020.104743
Vidmer, A., Zeng, A., Medo, M., and Zhang, Y. C. (2015). Prediction in complex systems: The case of the international trade network. Phys. A 436, 188–199. doi:10.1016/j.physa.2015.05.057
Wang, C., Sun, J., Zuo, L., and Song, H. (2018). Evaluation of global supply risk of critical minerals for new energy vehicles. Forum Sci. Technol. China 4, 83–93. [In Chinese]. doi:10.13580/j.cnki.fstc.2018.04.010
Wang, C., Zhao, L., Lim, M. K., Chen, W., and Sutherland, J. W. (2020). Structure of the global plastic waste trade network and the impact of China’s import Ban. Resour. Conserv. Recycl. 153, 104591. doi:10.1016/j.resconrec.2019.104591
Wang, C., Zhong, W., Wang, A., Sun, X., Li, T., and Wang, X. (2021). Mapping the evolution of international antimony ores trade pattern based on complex network. Resour. Policy. 74, 102421. doi:10.1016/j.resourpol.2021.102421
Wang, X., Wang, A., Zhong, W., Zhu, D., and Wang, C. (2022). Analysis of international nickel flow based on the industrial chain. Resour. Policy. 77, 102729. doi:10.1016/j.resourpol.2022.102729
Watts, D. J., and Strogatz, S. H. (1998). Collective dynamics of small world networks. Nat 393, 440–442. doi:10.1038/30918
Wen, S., Chen, J., and Hao, X. (2021). Research on the supply chain risk of global copper resources from the perspective of complex network. Min. Res. Dev. 41 (9), 171–178. [In Chinese]. doi:10.13827/j.cnki.kyyk.2021.09.032
Wendling, Z. A., Emerson, J. W., Esty, D. C., Levy, M. A., and Sherbinin, A. d. (2018). The 2018 environmental performance index. New Haven, CT: Yale Center for Environmental Law and Policy.
White House, The (2021). Building resilient supply chains, revitalizing American manufacturing, and fostering broad-based growth. Available at: https://www.whitehouse.gov/wp-content/uploads/2021/06/100-day-supply-chain-review-report.pdf (Accessed September 30, 2021).
World Bank (2020). Worldwide governance indicators. Available at: https://databank.worldbank.org/source/worldwide-governance-indicators (Accessed May 30, 2021).
Xun, D., Sun, X., Geng, J., Liu, Z., Zhao, F., and Hao, H. (2021). Mapping global fuel cell vehicle industry chain and assessing potential supply risks. IJHE 46, 15097–15109. doi:10.1016/j.ijhydene.2021.02.041
Xun, D., Sun, X., Liu, Z., Zhao, F., and Hao, H. (2022). Comparing supply chains of platinum group metal catalysts in internal combustion engine and fuel cell vehicles: A supply risk perspective. Clean. Logist. Supply Chain 4, 100043. doi:10.1016/j.clscn.2022.100043
Yang, J., Zhu, H. L., Ma, L. W., and Li, Z. (2013). An evaluation of critical raw materials for China. Adv. Mater. Res. 773, 954–960. doi:10.4028/www.scientific.net/amr.773.954
Yuan, Y., Yellishetty, M., Mudd, G. M., Muñoz, M. A., Northey, S. A., and Werner, T. T. (2020). Toward dynamic evaluations of materials criticality: A systems framework applied to platinum. Resour. Conserv. Recycl. 152, 104532–104613. doi:10.1016/j.resconrec.2019.104532
Zhong, W., An, H., Shen, L., Fang, W., Gao, X., and Dong, D. (2017). The roles of countries in the international fossil fuel trade: An emergy and network analysis. Energy Policy 100, 365–376. doi:10.1016/j.enpol.2016.07.025
Zhong, W. (2016). International trade pattern of fossil fuels based on the theory of complex network and emergy. China: China University of Geosciences. [In Chinese].
Keywords: platinum, supply chain, supply risk, network analysis, platinum trade
Citation: Li P, Liu Q, Zhou P and Li Y (2023) Mapping global platinum supply chain and assessing potential supply risks. Front. Energy Res. 11:1033220. doi: 10.3389/fenrg.2023.1033220
Received: 31 August 2022; Accepted: 12 January 2023;
Published: 24 January 2023.
Edited by:
Xiaoqi Sun, Shenzhen University, ChinaReviewed by:
Di Dong, Shanghai Academy of Social Sciences, ChinaYongguang Zhu, China University of Geosciences Wuhan, China
Copyright © 2023 Li, Liu, Zhou and Li. This is an open-access article distributed under the terms of the Creative Commons Attribution License (CC BY). The use, distribution or reproduction in other forums is permitted, provided the original author(s) and the copyright owner(s) are credited and that the original publication in this journal is cited, in accordance with accepted academic practice. No use, distribution or reproduction is permitted which does not comply with these terms.
*Correspondence: Ping Zhou, enBpbmdAbWFpbC5jZ3MuZ292LmNu