 Lixia Lang1,2,3
 Yanbi Chen1,2,3Yan Liu1Jianxi Wu1,2,3Yongkun Yu1,2,3Yan Wang1,2,3Xingpeng Chen1,2,3
 Zilong Zhang1,2,3,4*
- 1College of Earth and Environmental Sciences, Lanzhou University, Lanzhou, China
- 2Key Laboratory of Western China’s Environmental Systems (Ministry of Education), College of Earth and Environmental Sciences, Lanzhou University, Lanzhou, China
- 3Research Institute for Circular Economy in Western China, Lanzhou University, Lanzhou, China
- 4Institute of Green Development for the Yellow River Drainage Basin, Lanzhou University, Lanzhou, China
Introduction: Developing biomass energy to alleviate the worldwide energy crisis has become a global priority. In order to ensure the optimal utilization of biomass energy, it is necessary to calculate a country’s biomass energy potential, so as to provide support for the formulation of biomass energy macro policies, especially for the sustainable supply of raw materials.
Methods: This study constructs the biomass inventory, including crop straw, livestock manure, forest residues and municipal solid waste, and estimates the potential of the biomass energy supply of 31 provinces (autonomous regions and municipalities) in China from 2000 to 2020. The changes in the spatial pattern of the biomass energy supply are explored. Taking 2020 as a targeted year, the spatial patterns of biomass energy density defined as the biomass energy per land area and per rural person is then analyzed.
Results: The results show that from 2000 to 2020, China’s biomass energy converted into coal equivalent generally showed a fluctuating upward trend from 139,141.73 × 104 tce in 2000–146,133.20 × 104 tce in 2020, with an average annual growth rate of 0.24%. The biomass energy is dominated by livestock manure and crop straw and the four types of biomass energy show different changes but with an overall upward trend. The spatial patterns of the biomass energy potential are generally uneven, with significant inter-provincial differences and obvious regional differences in cold and hot spots. In 2020, the energy density of the biomass energy potential is characterized by “two highs and two lows,” i.e., the biomass energy density per unit land area is “high in the east and low in the west” and the per capita biomass energy density in rural areas is “high in the north and low in the south”.
Discussion: The aims of this study are to assess the capacity of biomass resources in China to support a bio-based economy and provide a reference for China’s biomass energy policy formulation and strategic layout. Research shows that in order to further develop biomass energy, the development and utilization of biomass energy should be promoted in combination with China’s regional characteristics, rational planning and local conditions.
1 Introduction
The challenges of energy security and environmental pollution have become increasingly prominent. Therefore, there is an urgent need to find suitable renewable energy sources and move towards the sustainable development of human society. As environmentally-friendly renewable energy, biomass energy, which is the only resource containing C and H elements besides fossil resources, is considered the best alternative energy to fossil energy (Feng et al., 2018; Hu, 2019) and will play a crucial role in the low-carbon transformation of international energy and the process of carbon peaking and neutrality. Thus, developing biomass energy to alleviate the energy crisis has become a global action. Biomass energy is an energy form with biomass as the carrier, i.e., solar energy is stored in biomass in the form of chemical energy through the photosynthesis of plants. It has the advantages of easy development, renewability, widespread distribution and minimal environmental pollution. The available biomass energy resources globally are very rich. According to statistics, there are −1730 × 108 t of biomass organic matter produced by photosynthesis every year. The energy contained in this biomass is 10–20 times the total global energy consumption (Xi et al., 2019). The raw materials that can be used for biomass energy include livestock manure, agricultural and forestry wastes, municipal solid waste (Zhou et al., 2021).
Recently, public concern regarding energy security and environmental issues has promoted the development of renewable energy (Yan et al., 2021). Renewable energy development and usage is one of the most effective methods to address global climate change, solve the contradiction between energy supply and demand and achieve the goal of carbon neutrality by replacing fossil energy and reducing carbon dioxide emissions. According to the research of the International Energy Agency, 36% of global energy consumption will come from renewable energy in 2030, of which biomass energy will account for 60% (Wang et al., 2022). Therefore, further promoting the high-quality development of biomass energy will make positive contributions to the reduction of carbon emissions. At present, the effective utilization of biomass energy has become a pivotal topic, attracting the attention of governments and scholars globally, with prominent projects including the sunshine Project in Japan, the Green Energy Corridor project in India and the rural energy programs of the United States (Miao, 2022). Taking China as an example, since the late 1990s, China has decided to increase capital investment and expand policy support for biomass energy development and application (Li et al., 2021). China’s 14th 5-year plan for bioeconomy development proposes to actively develop bioenergy and promote the transition from fossil energy to green low-carbon renewable energy (NDRC, 2022). In the future, as a major energy consumer, China will devote more attention to biomass resources (Miao, 2022). In this context, in order to ensure the best utilization of biomass energy, it is necessary to calculate the potential of a country’s biomass energy, obtain the basic and decisive information of biomass energy and analyze the potential and spatial patterns of biomass energy as prerequisites for its development and utilization.
Biomass energy potential estimation is a critical issue and significant research has been carried out at the national and regional levels. In recent decades, an increasing number of studies estimating the potential of biomass energy were carried out at global, national, or regional scales by using different research methods. However, evaluated quantities of biomass residues available for bioenergy production vary greatly among different studies due to differences in the types of residues analyzed, residue to product ratios, and constraining factors taken into account. Studies related to the estimation of biomass energy mainly focus on two aspects. On the one hand is assessing the total amount of various types of biomass energy. On the other hand is estimating the supply capacity of a certain type of biomass resource. A literature review in terms of research objectives and results that are related to this study is shown in Table 1.
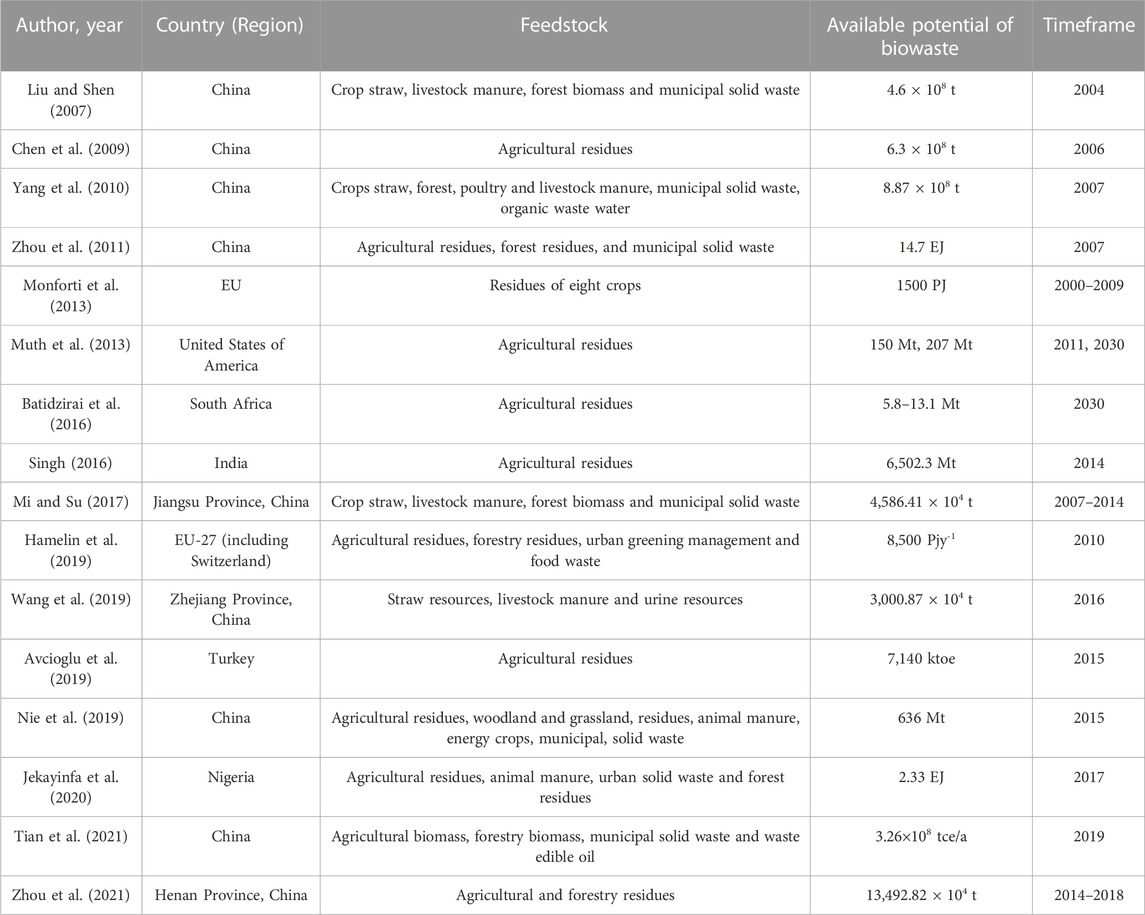
TABLE 1. Summary of biomass energy potential studies in China and other countries.
It can be seen that when estimating biomass energy, most researchers choose cross-sectional data, i.e., the calculation and distribution of resources are mainly analyzed using the data of a certain year, which cannot fully reflect the temporal and spatial changes of biomass energy in China at present. As the production process of biomass energy is closely related to the objective factors of natural conditions, such as climate, it is not sufficient to reflect the real situation of biomass energy resources in this region by selecting data for a certain year for analysis. Furthermore, the selection of research objects is not sufficiently comprehensive, with most only considering straw, livestock manure and forest biomass. Municipal solid waste and are rarely involved. Finally, there is a lack of research on the spatial distribution of biomass energy, such as Beijing(Jia et al., 2014), Shandong(Li et al., 2014), Fujian(Su, 2016), Gansu(Zheng et al., 2019), Henan(Zhou et al., 2021), Jiangsu(Mi and Su, 2017), etc.
Therefore, this study aims to quantify the potential of biomass energy in China from 2000 to 2020, analyze its composition and evolution trend and explore the geographical pattern. This study provides corresponding theoretical support for China to formulate macro policies for biomass energy in the future, especially for the sustainable supply of raw materials.
The study first constructs the biomass inventory, including crop straw, livestock manure, forest residues and municipal solid waste and estimated the potential of biomass energy supply of 31 provinces (autonomous regions and municipalities) in China from 2000 to 2020. The changes in the spatial pattern of the biomass energy supply are then explored. Finally, taking 2020 as a targeted year, the spatial patterns of biomass energy density defined as the biomass energy per land area and per rural person are analyzed. Discussion: The aims of this study are to assess the capacity of biomass resources in China to support a bio-based economy and provide a reference for China’s biomass energy policy formulation and strategic layout.
2 Materials and methods
According to present studies, we established the biomass inventory including crop straw, livestock manure, forest residues and municipal solid waste. Considering the simplicity and scientificity of the calculation, the first step of the estimation of biomass energy potential is to calculate its theoretical resources. The second step is to obtain the collectable resources according to the collection coefficient (Zhou et al., 2021). The third step is to obtain the converted coal equivalent according to the reference coefficient of energy converted coal equivalent. The research data mainly come from the National Bureau of Statistics, China Forestry Statistical Yearbook, China Energy Statistical Yearbook, provincial statistical yearbooks and provincial government websites.
2.1 Methodology for estimating biomass energy potential
2.1.1 Estimation method of crop straw biomass energy potential
China is one of the world’s major agricultural nations, with an abundance of agricultural waste and the ability to produce biomass energy (Zhou et al., 2011). Crop straw is an essential component of agricultural waste. As a result, this study utilizes agricultural straw to determine its biomass energy potential. Crop straw refers to the plants remaining after the harvest of crop seeds, which are the most valuable crop byproducts in rural areas. Most of the remaining resources have not been exploited efficiently, with the exception of those used for fertilization, paper production and other industrial raw materials and animal feed (He, 2017). The majority of crop straw consists of food crops, oil crops, cotton, hemp and sugar crops (Zhong et al., 2003). Since the output of straw is not included in the statistics of China’s relevant departments, the output of straw is typically estimated based on the output of crops (Liu and Shen, 2007). This study focuses on corn, rice, wheat, other cereal grains, cotton, rape, peanuts, beans and tubers. The estimation method of crop straw biomass energy potential is as follows:
where
The ratio of grain to straw has a direct impact on the precision of straw resource estimation. China has a vast territory and an abundance of crop varieties. The ratio of grain to straw varies considerably between areas and crop types (Huo et al., 2020). In the majority of previous regional investigations, the grain-straw ratio coefficient was the same. However, even for the same crop, the grain-straw ratio coefficient will vary among locations due to the impact of climate, region, planting systems and measurement discrepancies. This study mainly adopts the grain-straw ratio of the main crops in different agricultural areas (Table 2) provided in the “Notice of the General Office of the National Development and Reform Commission and the General Office of the Ministry of Agriculture on Carrying out the Final Evaluation of the Comprehensive Utilization Plan of Crop Straw”. Individual vacancy indicators refer to the research of (Chen et al., 2009; Bi, 2010; Mi and Su, 2017).
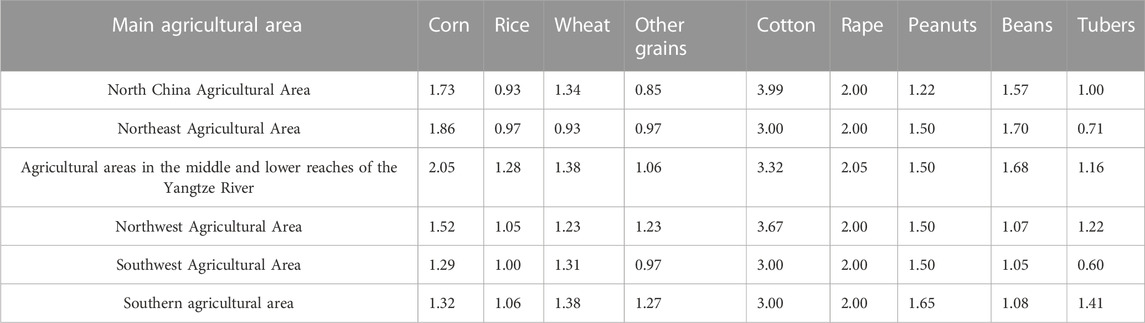
TABLE 2. Reference of main crops grain-straw ratio in different agricultural areas.
Combined with the relevant literature (Xing et al., 2015; He, 2017; Mi and Su, 2017), the collection coefficient and coal equivalent conversion coefficient selected in this study are shown in Table 3.
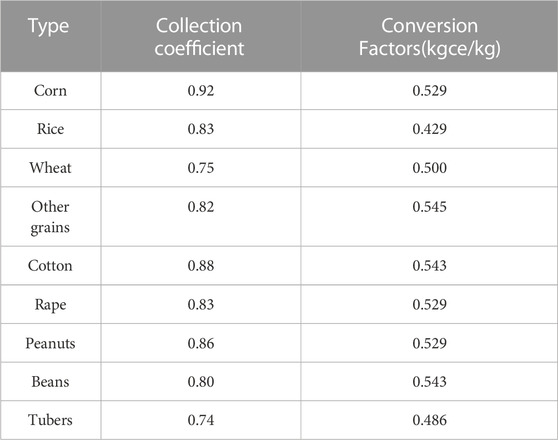
TABLE 3. Crop straw collection coefficient and conversion factors.
2.1.2 Estimation method of livestock manure biomass energy potential
As the best raw material for biogas fermentation, livestock manure is an important biomass resource (Zhou et al., 2021). With the improvement in people’s living standards and the change in diet structure, the proportion of livestock and poultry products in the diet structure has gradually increased. Therefore, the breeding industry has also developed rapidly, accompanied by the problem of livestock and poultry manure disposal. Reasonable estimation of the biomass energy of livestock and poultry manure is conducive to attracting attention for the energy utilization of biomass resources. The amount of livestock manure resources in China mainly refers to the amount of manure produced by cattle, pigs, sheep and poultry (Li et al., 2014). In this study, slaughtered fattened pigs, pigs on hand, slaughtered cattle, cattle on hand, slaughtered sheep and goats, sheep and goats on hand, horses, donkeys and mules and slaughtered poultry are selected as the estimation objects of the biomass energy potential of livestock manure. The estimation formula is as follows:
where
Livestock manure is related to animal species, breed, sex, growth period and other factors (Liu and Shen, 2007), it is worth pointing out that the number of livestock and poultry breeding heads collected from the statistical yearbook generally includes total amount of livestock for sale and on hand. The growth period of livestock and poultry is not the same. The feeding period of the number of livestock on hand was calculated as 365 days, slaughtered fattened pigs are generally 300 days (Li and Wang, 2004), slaughtered poultry are 55 days, while for sheep and goats, horses, donkeys and mules are calculated on the basis of year-round feeding. The studies of (Liu and Shen, 2007; Li et al., 2014; He, 2017; Mi and Su, 2017) were used to select the relevant coefficients, as shown in Table 4.
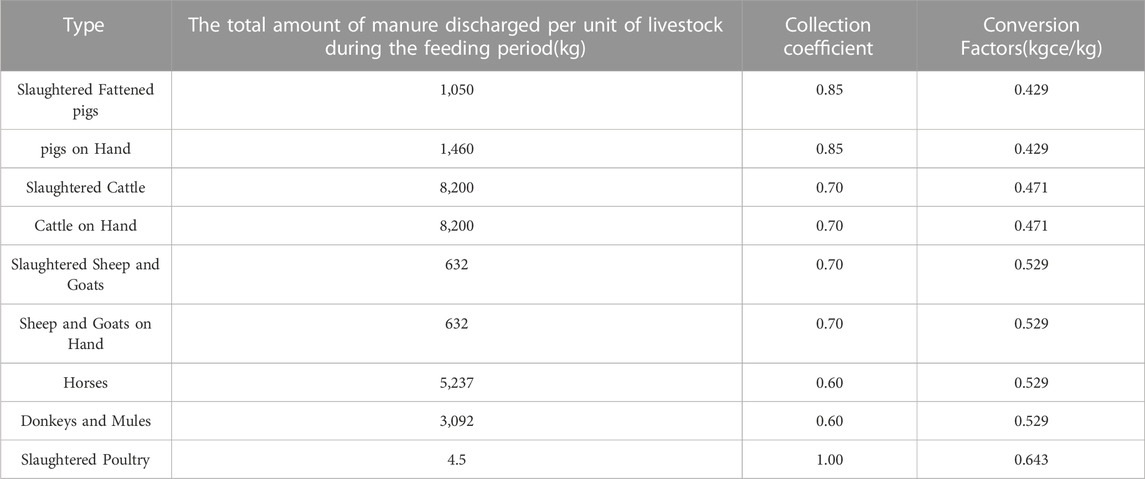
TABLE 4. The total amount of manure discharged during the feeding period of livestock, collection coefficient, and conversion factors.
2.1.3 Estimation method of forest residue biomass energy potential
The ninth national forest resources inventory reveals that the national forest area in China is 2.2 × 10⁸ hm2 and that the development potential of forestry biomass energy is substantial (NFGA, 2019). These abundant biomass resources not only provide a good material foundation for the sustainable development of forestry bioenergy but also have a large available space, which can provide a strong resource guarantee for alleviating the national energy crisis, adjusting and optimizing the energy structure and achieving a sustainable energy supply. Forest leftovers are the byproducts from thinning and felling during forest production and forestry growth (Feng et al., 2019). This study focuses primarily on economic forests, with trees planted on all sides, nursery, young and middle-aged forests, commercial timber, bamboo forests and firewood forests as categories of forest residues. The biomass energy potential estimation formula is as follows:
where
The primary data are from China Forestry Statistical Yearbook (2000–2020). Other area data for forest residue are collected from the 6th to 9th National Forest Resources Survey and provincial government websites. In reference to (Lv et al., 2005; Liu and Shen, 2007; Zang and Zhang, 2019), the specific values of the following conversion coefficients were determined, as shown in Table 5.
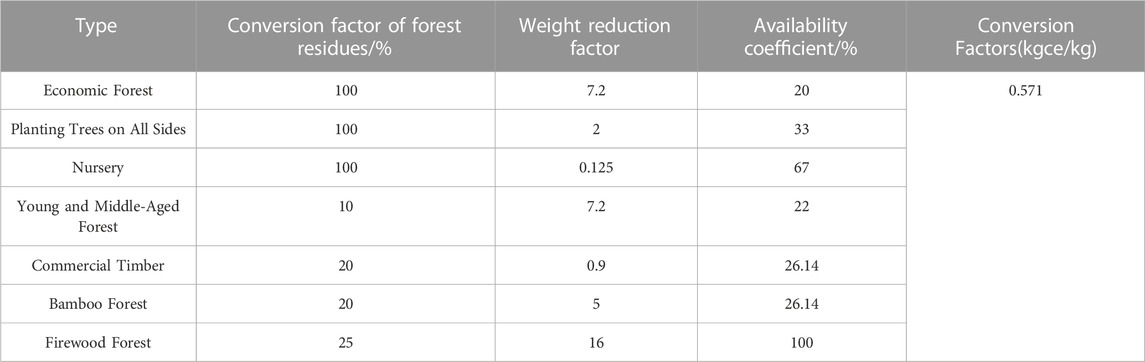
TABLE 5. Conversion factor, weight reduction factor, availability coefficient and conversion factor of forest residues.
2.1.4 Estimation method of municipal solid waste biomass energy potential
Municipal solid waste, including paper, food waste and leather, can be used as a source of biomass energy (Zang and Zhang, 2019). Municipal waste can be divided into organic waste and inorganic waste resources according to its composition. Depending on its composition, municipal garbage can be separated into organic and inorganic waste resources. Organic matter storage in municipal solid waste is close to one-third and is easily degraded. This study estimates the quantity of biomass energy converted into coal equivalent according to the amount of municipal solid waste removal (Mi and Su, 2017).
where
With reference to the relevant literature, the correlation coefficients used in this study are shown in Table 6.

TABLE 6. Coal equivalent conversion factors of municipal solid waste.
2.2 Hot spot analysis
Hot spot analysis involves identifying the locations of statistically significant hot spots, cold spots and spatial outliers by looking at each element in the environment of adjacent elements, one of which has a high value and is surrounded by other elements with the same high value. It is the hot or cold spot with significant statistical significance (Zhong and Xu, 2022). Hot spot analysis can calculate the
To facilitate comparison and analysis,
where
The output of the
2.3 Energy density
Energy density (Li et al., 2001) refers to the amount of energy stored in a certain space or mass of matter and is an indicator used to reflect resource abundance and can be used to measure the biomass energy possession per unit area or population. Since there are differences in population and area between provinces and urban areas, evaluating the availability of regional biomass from the perspective of a province alone cannot fully describe the abundance of biomass in the region (Liu and Shen, 2007; Guo, 2013). Since biomass energy is mostly used in rural areas at this stage, we take 2020 as an example to calculate the energy density of biomass energy potential based on rural population and land area.
3 Results and discussion
3.1 Biomass energy potential from 2000 to 2020
China has a wide range of biomass resources, which have significant potential for development. China has the world’s largest biomass energy supply (Zhao and Yan, 2019), which will be the focus of future development and exploitation. From 2000 to 2020, the amount of biomass energy converted into coal equivalent in China fluctuated and increased from 139,141.73 × 104 tce in 2000–146,133.20 × 104 tce in 2020, with an average annual growth rate of 0.24% (as shown in Supplementary Table SA). As a large agricultural country, China has a long history of planting and animal husbandry, as well as diverse agricultural products. Biomass energy consists primarily of animal manure and crop straw, along with municipal solid waste and forest residues. As indicated in Figure 1, from 2000 to 2020, livestock manure contributed more than 68% of the biomass energy, while crop straw contributed up to 31% in 2019. Different forms of biomass energy potentials exhibit distinct tendencies. The following sections will analyze the time changes in depth.
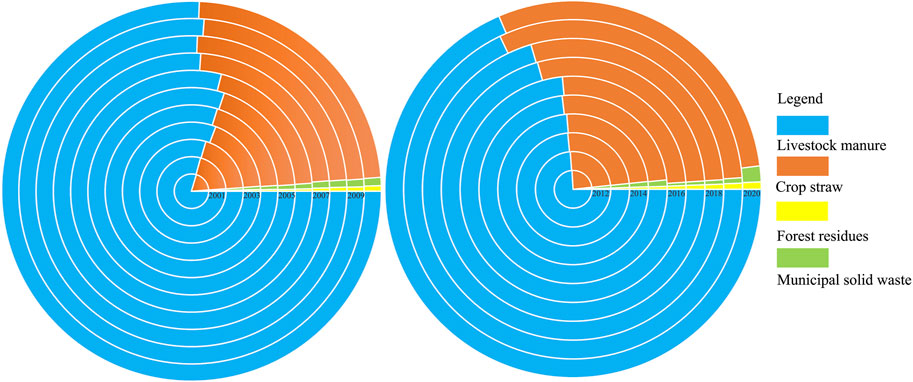
FIGURE 1. Proportion of various types of biomass energy potential converted to coal equivalent in China from 2000 to 2020.
3.1.1 Estimation results of crop straw biomass energy potential
This study focuses primarily on corn, rice, wheat, other grains, cotton, rape, peanuts, beans and tubers as the selected crops. The theoretical resources, collected quantity and converted coal equivalent quantity of crop straw biomass energy in China from 2000 to 2020 can be determined using Eq. 1. As depicted in Figure 2A, the biomass energy potential of crop straws has fluctuated and steadily increased over the previous 2 decades, with the rate of change being essentially constant. The total amount reached its maximum point in 2020, when the coal equivalent amount of crop straw reached 43,238.34 × 104 tce. Its lowest position was in 2003, when the coal equivalent amount of crop straw reached 26,036.93 × 104 tce.
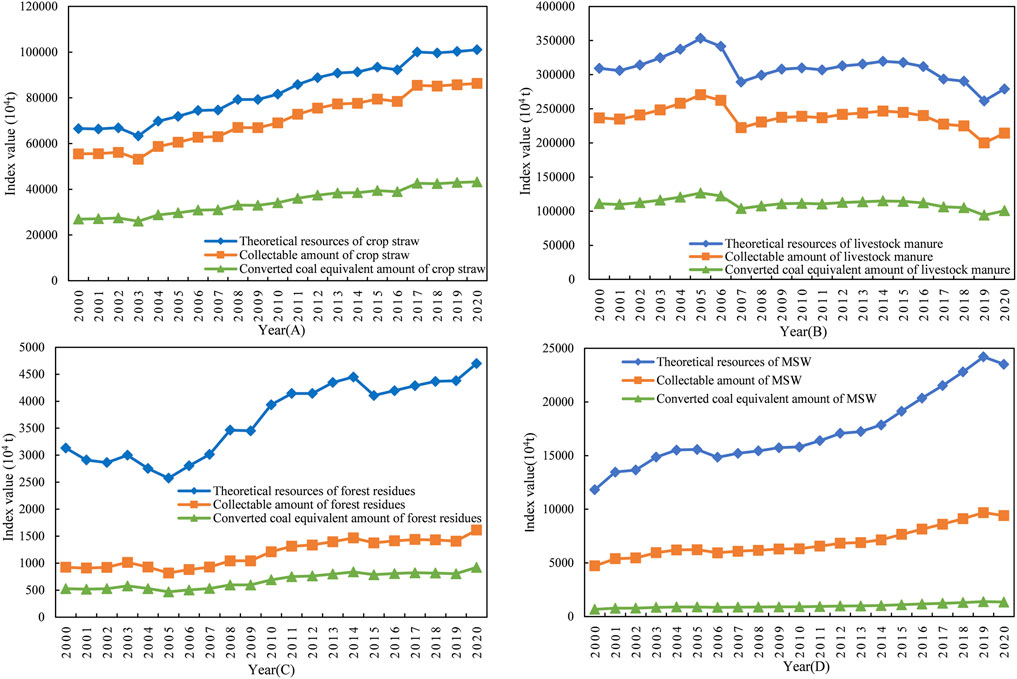
FIGURE 2. Changes of various biomass energy indicators in China from 2000 to 2020 (A–D).
In particular, the potential shift of crop straw biomass in China from 2000 to 2020 exhibited two U-shaped changes, with the lowest points occurring in 2003 and 2016. China began thoroughly implementing the strategic adjustment of agricultural structure in 1998 and the national grain planting area continued to drop from 1999 to 2003 (with a total decrease of 1,437.81 × 104 hm2), resulting in a decline in the national total straw yield (Bi, 2010). Some regions were significantly impacted by the heavier agrometeorological disasters in 2016 compared to the previous year, which contributed to this low point. Natural calamities limited the harvest of summer grains and early rice. The 2016 low point was due to the fact that national agrometeorological catastrophes were more severe than in the previous year and several regions were seriously damaged. The calamity affected the yield of summer grains and early rice. During the early stages of autumn grain growth, numerous locations in the south had excessive rainfall. Hubei, Anhui and other areas were severely impacted; some farmlands were repeatedly inundated and crop yields declined significantly (Wang, 2016).
3.1.2 Estimation results of livestock manure biomass energy potential
The livestock species selected in this study mainly include slaughtered fattened pigs, pigs on hand, slaughtered cattle, cattle on hand, slaughtered sheep and goats, sheep and goats on hand, horses, donkeys and mules and slaughtered poultry. The theoretical resources, collected quantity and converted coal quantity of animal waste biomass energy in China from 2000 to 2020 are determined using Eq. 2. Figure 2B demonstrates that the biomass energy of livestock manure fluctuates slightly. Since 2000, the biomass energy of livestock manure has shown a slow increasing trend, peaking at 126,521.67 × 104 tce in 2005 before dropping to 103,895.54 × 104 tce in 2007 and 94,073.65 × 104 tce in 2019 after a moderate climb.
Specifically, a series of policies to support agriculture issued by the central government in 2005 provided feed and financial support to accelerate the development of animal husbandry. As a result of the combined effects of policies and markets, farmers are more encouraged to expand animal husbandry production and the size of breeding has expanded, resulting in a peak. In the previous decade, 2007 marked a significant turning point for China’s livestock and poultry breeding business. As a result of the epidemic, the size of the breeding business has shrunk significantly. The “African Swine Fever” outbreak in 2019 also caused a fall in pig production capacity and marked the second low point.
3.1.3 Estimation results of forest residue biomass energy potential
The types of forest residues selected included economic forests, sipang trees, seedlings, young and middle-aged forest tending, commercial timber, bamboo forests and firewood forests as the predominant sources of forest residues. Eq. 3 is used to calculate the theoretical resources, collectable amount and converted coal equivalent amount of biomass energy of forest residues in China from 2000 to 2020. As illustrated in Figure 2C, the overall trend is upward. Specifically, the converted coal equivalent of forest residues reached their lowest levels in 2005 and 2015, at 467.62 × 10⁴ and 785.74 × 10⁴ tce, respectively. The reason for the low point in 2005 was that the national afforestation plan decreased by 26.53% compared with 2004 and the afforestation area accounted for 9.26% of economic forests according to forest types and uses. In addition, the output of seedlings in 2005 was 287.28 × 10⁸ plants, a year-on-year decrease of 28.50% (DDPFM, 2006). As an important part of forest residues, the reduction in the area leads to a decrease in the theoretical resources of forest residues. The main reason for the low point in 2015 is that the tending area of young and middle-aged forests decreased by 14.27% compared with 2014.
3.1.4 Estimation results of municipal solid waste biomass energy potential
Formula 4 is used to determine the theoretical resources, collectable amount and converted coal equivalent amount of biomass energy of municipal solid waste in China from 2000 to 2020 As depicted in Figure 2D, the biomass energy of municipal solid waste generally shows a trend of rising in the fluctuation. With the economic growth and improvement of residents’ living standards, the amount of municipal solid waste removal and transportation has increased year by year and the amount of municipal solid waste converted into coal equivalent has also increased steadily. Specifically, the total amount of coal converted into coal equivalent showed a slow rising trend and reached the maximum of 1,384.59 × 104 tce in 2019.
3.2 Changes in spatial patterns from 2000 to 2020
3.2.1 Geographical distribution pattern of biomass energy in China from 2000 to 2020
The spatial patterns are generally uneven, with large inter-provincial differences. From 2000 to 2020 (for details see Supplementary Table SB), the provinces with the high biomass energy potential include Henan, Sichuan, Hebei, Hunan and Shandong (Supplementary Figure SA). In contrast, the biomass energy potential of Shanghai, Beijing, Tianjin, the Ningxia Hui Autonomous Region and Hainan Province is relatively low. Due to the high proportion of livestock manure and crop straw biomass energy, this distribution tendency may be the result of the unbalanced development of animal husbandry or agriculture in China. The provinces with high biomass energy potential have developed animal husbandry or agriculture. Provinces with low biomass energy potential usually have slow agricultural development or small production scale (Yan et al., 2021). China’s key agricultural provinces include the provinces of Henan, Sichuan, Hebei, Hunan and Shandong. They have an abundance of crop straw and a developed breeding industry. As an expanding livestock and poultry breeding zone in China, the southwest region ranks first in the nation for the production of livestock and poultry manure and urine, and the amount of livestock and poultry breeding, such as live pigs and laying hens, exhibits a rising annual trend (Zhu and Ma, 2014). Consequently, the potential of biomass energy is enormous.
3.2.2 Hot spot analysis results
From 2000 to 2020, China’s cold and hot spots for biomass energy potential are geographically distinct (for details see Supplementary Table SC). The majority of the hot spots are clustered in the southwest, south central and eastern regions of China and have spread to the northeast. The sub-hot spots are dispersed around the primary hot spots and their number is growing. The cold spots are dispersed over northwest and eastern China, with no discernible temporal variation. The number of sub-cold spots grows and they are scattered in a strip interval between sub-hot areas. ArcGIS software was used to analyze the hot spots of China’s biomass energy potential from 2000 to 2020. According to the natural breakpoint method, the results are divided into hot spots, sub-hot spots, the transition between hot and cold areas, sub-cold spots and cold spots. From 2000 to 2002, the majority of hot spots were clustered in the provinces of Shandong, Hunan, Hubei, Anhui, Jiangsu and Guizhou. From 2003 to 2010, the number of hotspots dropped and were located in the provinces of Henan, Hubei and Guizhou. (Supplementary Figure SB). From 2011 to 2020, the number of hot spots increased and the hot spots extended to the northeast. By 2020, they are mainly distributed in northeast, central and southwest China, and concentrated in the provinces of Heilongjiang, Jilin, Henan, Hubei and Guizhou and Chongqing City with a pattern of patchy distribution. The number of sub-hot spots surrounding hot spots is rising. By 2020, the sub-hot spots are distributed in two belts, extending eastward and westward. The cold spots are distributed in northwest and east China. In 2000, the most prominent cold spots were in Gansu Province. The sub-cold spots were distributed in patches in the northwest, southeast and northeast. From 2001 to 2005, the number of cold spots increased. The main gathering areas include Gansu Province, the Tibet Autonomous Region, Zhejiang Province and Fujian Province. The number of sub-cold spots decreased. From 2006 to 2020, the Tibet Autonomous Region withdrew from cold-spots areas, while the rest remained unchanged. The number of sub-cold spots areas has increased and the sub-cold spots distributed in the sub-hot spots with strip intervals, and the aggregation characteristics are gradually enhanced.
3.2.3 Energy density analysis for 2020
Since there are differences in population and land area between provinces in the preceding analysis and biomass energy in China is predominantly used in rural areas at the present time, we use 2020 as an example to calculate the energy density of biomass energy potential based on the rural population and land area. As shown in Figure 3, the five provinces with the most biomass energy per unit land area are Henan, Shandong, Hebei, Tianjin and Jiangsu in central and eastern China. The five provinces with the least biomass energy per unit land area are the Inner Mongolia Autonomous Region, Beijing, Qinghai Province, the Xinjiang Uygur Autonomous Region and the Tibet Autonomous Region. Among them, Henan Province reaches 680.50 tce/km2, while the Tibet Autonomous Region has only 20.04 tce/km2. This is primarily due to provincial differences in biomass energy structure and land area. As depicted in Figure 4, the per capita availability of biomass energy in rural areas exhibits significant interprovincial disparities, with the largest province in Qinghai reaching 12.39 tce/person and the smallest province in Beijing reaching only 0.49 tce/person. In addition, the Inner Mongolia Autonomous Region, the Tibet Autonomous Region, Heilongjiang Province and Jilin Province are among the provinces with high per capita access to biomass energy, whereas the smallest provinces and cities are Beijing, Shanghai, Zhejiang, Fujian and Guangdong in turn. Generally, the biomass energy density per unit land area is “high in the east and low in the west” and the biomass energy density per capita in rural areas is “high in the north and low in the south” in 2020.
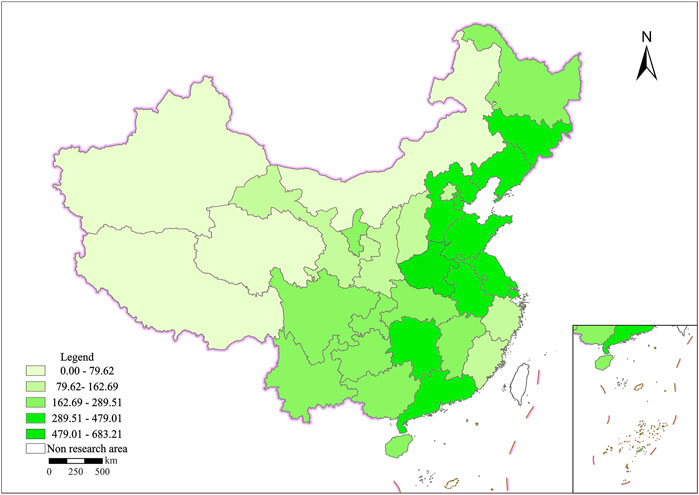
FIGURE 3. Distribution of biomass energy density per unit of land area in 2020.
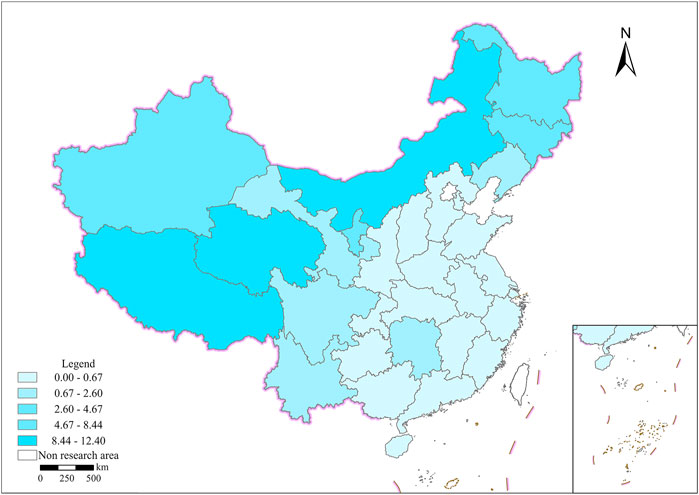
FIGURE 4. Distribution of biomass energy density per capita in rural areas in 2020.
4 Discussion
4.1 Uncertainty analysis
The biomass energy potential of livestock manure is estimated using the mean values of the total amount of manure emissions of livestock during the feeding period, which is the source of the uncertainties of total biomass energy potential. Monte Carlo simulation, as a common method to quantify the error propagation of model parameters (Hu et al., 2017), tests the uncertainty ranges of biomass energy potential in this study. Manure emissions of livestock during the feeding period coefficient is assumed to fit the log-normal distribution curve with a confidence degree of 95% (Jia et al., 2018). Monte Carlo model then runs 5,000 times to get the statistical distribution results of manure emissions of livestock during the feeding period (Kang et al., 2020)(for details see Supplementary Table SD), whose ranges is summarized by box-and-whisker plots (Figure 5). In terms of excretion coefficient, slaughtered sheep and goats exhibited the highest interquartile range, which denoted the largest variability of slaughtered sheep and goats. The excretion coefficient of the slaughtered sheep and goats was the major contributor to uncertainty, owing to its highest inter-quartile range as well as the sheep are farmed on a large scale with many varieties in China.
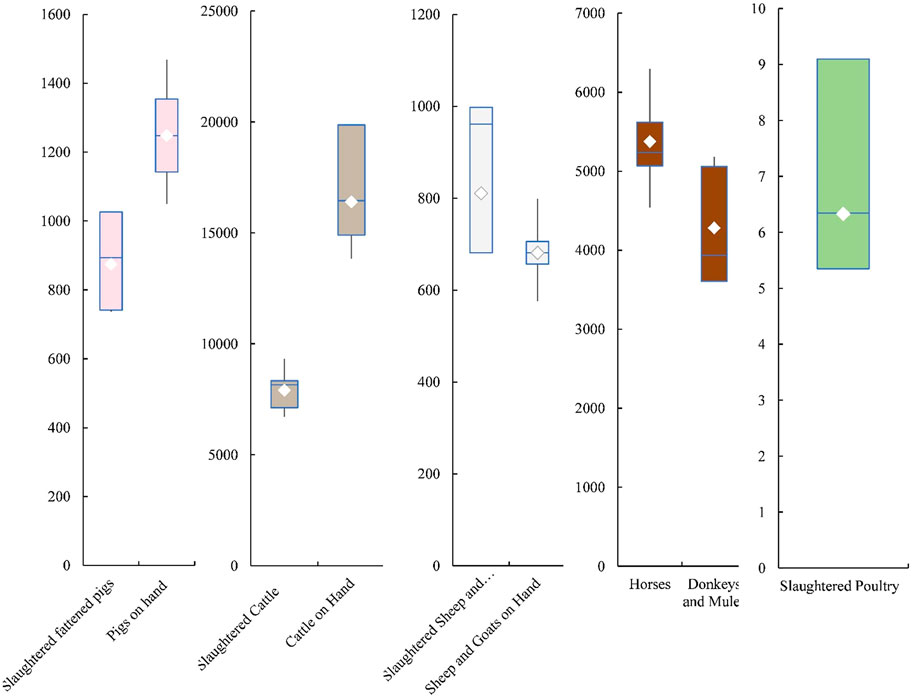
FIGURE 5. Ranges of livestock manure coefficient.
4.2 Comparison with existing biomass resources assessment
The available potentials of biomass resources estimated in other existing studies are different from that in this study throughout the accounting period. This difference is attributed to the diverse types of biomass resources and to the inconsistent values of their produced coefficients. (Liu and Shen, 2007).used smaller grain-straw ratio of crop straw, while this paper used the ratio of grain-straw in different agricultural areas, which led to a significant difference compared to this study. (Yang et al., 2010). used less classifications for forest resources and adopted larger coefficients. The estimate in 2017 by (Tian et al., 2021). Was lower than that of this study, mainly due to the fact that livestock manure is not included in their assessment (He, 2017). is different because it does not distinguish between livestock for sale and on hand when counting livestock manure.
4.3 Policy implications
In order to further develop biomass energy, the development and utilization of biomass energy should be promoted in combination with China’s regional characteristics, rational planning and local conditions. The regional distribution of biomass energy in China is uneven and there are differences in types and quantities among regions, meaning that the development of biomass energy should be based on the characteristics of biomass energy resources in various regions and should be developed and utilized in a targeted manner. In addition, the development of biomass energy should also be promoted in combination with the policies and regulations of various regions and the needs of the people, so that biomass resources can be effectively utilized. At the present stage, China’s biomass energy is mainly used in rural areas, but the utilization methods are extensive, most of which are traditional use and direct combustion, which is inefficient, and seriously threatens the rural ecological environment and health (Liu and Shen, 2007). In 2018, the consumption of non-commercial energy such as straw and firewood in rural China was 1.11 × 10⁸ tce, accounting for 35.1% of the total rural domestic energy consumption (Tang and Li, 2021). The inefficient and wasteful use of biomass energy, on the one hand, easily leads these areas into a vicious cycle of energy shortage and ecological destruction. On the other hand, human and livestock manure and indoor air pollution have become one of the main reasons that endanger people’s health in rural areas. Agricultural biomass energy technology is an important method to promote the effective utilization of agricultural waste resources. It can not only solve the environmental pollution problem of agricultural waste, reduce GHG emissions due to incineration or disorderly stacking, but also replace fossil energy to reduce CO2 emissions and improve soil carbon sequestration capacity. In the future, there is great development potential under the “dual-carbon” background. Some studies have calculated the GHG reduction potential of agricultural biomass energy. The results show that the potential of agricultural biomass energy to replace fossil energy in 2030 is 6,490–7,664 × 104 t and the GHG reduction contribution is 1.97–2.34 ×10⁸ t. The potential of alternative fossil energy in 2060 is 9,073–10763 × 104 t and the GHG reduction contribution is 2.79–3.36 × 10⁸ t (Huo et al., 2021). In the future, vigorously developing biomass energy utilization technologies, such as biofuel and biomass power generation, and scientifically and efficiently developing and utilizing biomass energy will become powerful measures to solve China’s energy and environmental problems.
5 Conclusion
Our results reveal the changes in spatial patterns of biomass energy potential from biowaste at the provincial scale in China from 2000 to 2020. Firstly, a biomass energy inventory, including crop straw, livestock manure, forest residues and municipal solid waste, was constructed to estimate the biomass energy supply potential of 31 provinces (autonomous regions and municipalities) in China from 2000 to 2020. Secondly, the spatial pattern changes of biomass energy supply were explored. Then, with 2020 as the target year, the spatial distribution of biomass energy density defined as the biomass energy per land area and per rural person was analyzed. The conclusions are as follows.
(1) China has the world’s largest biomass energy supply, which will be the focus of future development and exploitation. From 2000 to 2020, the amount of biomass energy converted into coal equivalent in China fluctuated and increased from 139,141.73 × 104 tce in 2000–146,133.20 × 104 tce in 2020, with an average annual growth rate of 0.24%. Biomass energy mainly consists of livestock manure and crop straw, supplemented by municipal solid waste, and forestry residues. In the past 20 years, the four types of biomass energy show different changing trends and the overall trend is upward, the biomass energy potential of crop straws has shown a slow and fluctuating upward trend. The biomass energy of livestock manure is generally stable and fluctuates slightly. The biomass energy of forest residues is generally on the rise and the biomass energy of municipal solid waste shows a trend of rising with fluctuation.
(2) From 2000 to 2020, the spatial distribution of biomass energy potential in China is generally uneven, with large inter-provincial differences. Due to the high proportion of livestock manure and crop straw biomass energy, this distribution tendency may be the result of the unbalanced development of animal husbandry or agriculture in China. There are obvious geographical differences in the cold and hot spots. The majority of the hot spots are clustered in the southwest, south central and east regions of China, and have spread to the northeast. The sub-hot spots are dispersed around the primary hot spot, and their number is growing. The cold spots are dispersed over northwest and eastern China, with no discernible temporal variation. The number of sub-cold spots grows and they are scattered in a strip interval between sub-hot areas.
(3) The energy density of biomass energy potential in 2020 is characterized by a “two high and two low” distribution, i.e., the biomass energy density per unit land area is “high in the east and low in the west” and the biomass energy density per capita in rural areas is “high in the north and low in the south” in 2020.
On 22 September 2020, China announced that it will enhance national independent contribution, adopt more powerful policies and measures, strive to reach the peak of carbon dioxide emissions by 2030 and strive to achieve carbon neutrality by 2060. The power sector is the largest industrial source of greenhouse gas (GHG) emissions in China and is also the key to carbon neutrality in China’s energy system. Biomass energy technology plays an important role in the deep decarbonization of the power sector. Unlike wind energy, hydropower, solar energy and so on, biomass is a renewable energy with a similar organizational structure to conventional fossil fuels, which can be stored and transported like coal. It can be applied to biomass only through a small process transformation on the basis of the original coal-fired power generation facilities. Therefore, coal-fired biomass coupling power generation can be realized. Biomass can fix carbon dioxide in nature through photosynthesis and has carbon neutral properties. The use of agricultural and forestry residues to replace coal in power production will greatly reduce carbon emissions in the process of power production. In addition, increasing the utilization ratio of biomass resources in the existing power generation structure will also help to improve the flexibility of China’s energy supply and guarantee China’s energy security (Li, et al., 2021). In this context, biomass energy technology will become an indispensable key emission reduction technology choice in the low-carbon transformation of China’s power sector.
Data availability statement
The original contributions presented in the study are included in the article/Supplementary Material, further inquiries can be directed to the corresponding author.
Author contributions
LL: Conceptualization, methodology, software, formal analysis, writing—original draft; YC: Methodology, formal analysis, writing—original draft; YL: Paper drawing, table modification, text modification; JW: Data selection and analysis; YY: Data selection and analysis; YW: Data curation, validation; XC: Writing—review and editing.
Funding
This work was supported by the National Key R&D Program of China Grant No. 2018YFC1903701.
Conflict of interest
The authors declare that the research was conducted in the absence of any commercial or financial relationships that could be construed as a potential conflict of interest.
Publisher’s note
All claims expressed in this article are solely those of the authors and do not necessarily represent those of their affiliated organizations, or those of the publisher, the editors and the reviewers. Any product that may be evaluated in this article, or claim that may be made by its manufacturer, is not guaranteed or endorsed by the publisher.
Supplementary material
The Supplementary Material for this article can be found online at: https://www.frontiersin.org/articles/10.3389/fenrg.2023.1109530/full#supplementary-material
References
Avcioglu, A. O., Dayioglu, M. A., and Turker, U. (2019). Assessment of the energy potential of agricultural biomass residues in Turkey. Renew. Energy 138, 610–619. doi:10.1016/j.renene.2019.01.053
Batidzirai, B., Valk, M., Wicke, B., Junginger, M., Daioglou, V., Euler, W., et al. (2016). Current and future technical, economic and environmental feasibility of maize and wheat residues supply for biomass energy application: Illustrated for South Africa. Biomass Bioenergy 92, 106–129. doi:10.1016/j.biombioe.2016.06.010
Bi, Y. (2010). “Study on straw resources evaluation and utilization in China,” in Chinese academy of agricultural sciences beijing.
Chen, L., Xing, L., and Han, L. (2009). Renewable energy from agro-residues in China: Solid biofuels and biomass briquetting technology. Renew. Sust. Energ. Rev. 13 (9), 2689–2695. doi:10.1016/j.rser.2009.06.025
DDPFM (2006). “Analysis of national forestry statistical annual report 2005,” in National forestry and grassland administration Beijing.
Feng, X., Wu, G., and Cao, Y. (2018). Analysis on knowledge mapping in China’s biomass energy research based on CiteSpace. J. Arid Land Resour. Environ. 32 (1), 35–42.
Feng, X., Wu, G., Cao, Y., Zhang, B., and Guo, S. (2019). Evaluation on the utilization potential of biomass energy-A case from key state-owned forest areas in Heilongjiang provice. Chin. J. Agric. Resour. regional Plan. 40 (6), 55–65.
Guerri, G., Crisci, A., Messeri, A., Congedo, L., Munafò, M., and Morabito, M. (2021). Thermal summer diurnal hot-spot analysis: The role of local urban features layers. Remote Sens. 13(3).
Guo, Y. Q. (2013). Quantitative appraisal of biomass energy of main crop straw resources and its geographical distribution in henan province. Res. Agric. Mod. 34 (1), 114–117.
Hamelin, L., Borzęcka, M., Kozak, M., and Pudełko, R. (2019). A spatial approach to bioeconomy: Quantifying the residual biomass potential in the EU-27. Energ. Rev. 100, 127–142. doi:10.1016/j.rser.2018.10.017
He, Z. (2017). Major biomass resources in changsha county. China Resour. Compr. Util. 35 (4), 60–66.
Hu, H., Lin, T., Wang, S., and Rodriguez, L. F. (2017). A cyberGIS approach to uncertainty and sensitivity analysis in biomass supply chain optimization. Appl. Energy 203, 26–40. doi:10.1016/j.apenergy.2017.03.107
Huo, L., Zhao, L., Yao, Z., Jia, J., Zhao, Y., Fu, G., et al. (2020). Difference of the ratio of maize stovers to grain and spatiotemporal variation characteristics of maize stovers in China. Trans. Chin. Soc. Agric. Eng. 36 (21), 227–234.
Huo, L., Zhao, L., Yao, Z., Luo, J., Zhang, P., Xie, T., et al. (2021). Potentiality of agricultural biomass energy for greenhouse gas emission reduction. Trans. Chin. Soc. Agric. Eng. 37 (22), 179.
Jekayinfa, S. O., Orisaleye, J. I., and Pecenka, R. (2020). An assessment of potential resources for biomass energy in Nigeria. Resources 9 (92), 92–41. doi:10.3390/resources9080092
Jia, W., Li, Y., Chen, Q., and Chadwick, D. (2014). Analysis of nutrient resources in livestock manure excretion and its potential of fertilizers substitution in Beijing suburbs Transactions of the Chinese Society of Agricultural Engineering. 30 (8), 156–167.
Jia, W., Qin, W., Zhang, Q., Wang, X., Ma, Y., and Chen, Q. (2018). Evaluation of crop residues and manure production and their geographical distribution in China. J. Clean. Prod. 188, 954–965. doi:10.1016/j.jclepro.2018.03.300
Kang, Y., Yang, Q., Bartocci, P., Wei, H., Liu, S. S., Wu, Z., et al. (2020). Bioenergy in China: Evaluation of domestic biomass resources and the associated greenhouse gas mitigation potentials. Renew. Sustain Energy Rev. 127, 109842. doi:10.1016/j.rser.2020.109842
Li, B., Shi, W., and Zhu, T. (2014). Systematic evaluation of biomass resources and utilization technology in Shandong Province. Jiangsu Agric. Sci. 42 (12), 374–377.
Li, C., Duan, H., Guo, X., and Cai, J. (2021). Insight into biomass pyrolysis kinetics: New integral methods for nonisothermal kinetics with exponential temperature program. J. Anal. Appl. Pyrolysis 155, 105080. doi:10.1016/j.jaap.2021.105080
Li, J. J., Ren, D. M., and Zhuang, X. (2001). Assessment method of biomass energy and case study. J. Nat. Resour. 16 (4), 373–380.
Li, P., and Wang, D. (2004). Estimation of annual quantity of total excretion from livestock and poultry in Chongqing Municipality. Trans. CSAE 20 (1), 288–291.
Liu, G., and Shen, L. (2007). Quantitive appraisal of biomass energy and its geographical distribution in China. J. Nat. Resour. 22 (1), 9–19.
Lv, W., Wang, C., Wang, G., Yu, G., Zhang, C. H., Zhang, D. H., et al. (2005). Study on the development potential of Biomass energy in China. Res. Approach 27(11), 21–26.
Mi, C., and Su, S. (2017). Prediction of biomass energy in Jiangsu province based on gray system model. Sino-Global Energy 22 (7), 91–98.
Miao, H. (2022). Estimation method of biomass energy reserves in China: A case study of corn straw. Journal of physics:. Conf. Ser. 2152 (012053), 1–6.
Monforti, F., Bodis, K., Scariat, N., and Dallemand, J.-F. (2013). The possible contribution of agricultural crop residues to renewable energy targets in europe: A spatially explicit study. Energ. Rev. 19, 666–677. doi:10.1016/j.rser.2012.11.060
Muth, D. J., Bryden, K. M., and Nelson, R. G. (2013). Sustainable agricultural residue removal for bioenergy: A spatially comprehensive us national assessment. Appl. Energy 102, 403–417. doi:10.1016/j.apenergy.2012.07.028
Nie, Y., Chang, S., Cai, W., Wang, C., Fu, J., Hui, J., et al. (2019). Spatial distribution of usable biomass feedstock and technical bioenergy potential in China. GCB Bioenergy 12 (1), 54–70. doi:10.1111/gcbb.12651
Singh, J. (2016). A roadmap for production of sustainable, consistent and reliable electric power from agricultural biomass-An Indian perspective. Energy Policy 92, 246–254. doi:10.1016/j.enpol.2016.02.013
Su, X. (2016). Disposal and reapplication of modern agricultural waste. J. Guangxi Univ. Natl. Soc. Sci. Ed. 38 (5), 103–109.
Tang, W., and Li, J. (2021). Current situation of rural energy consumption and analysis of "carbon neutral" capacity. Energy China 5, 60–65.
Tian, Y., Shan, M., Kong, G., Ma, L., and Shao, S. (2021). Development strategy of biomass economy in China. Chin. J. Eng. Sci. 23 (1), 133–140. doi:10.15302/j-sscae-2021.01.004
Wang, J., Fan, Y., Li, X., and Mo, X. (2022). Challenges and countermeasures facing the development of biomass energy industry. China State Finance 2, 59–60.
Wang, Y., Shan, Y. J., Ji, W. Y., and Wang, J. (2019). Nutrient resources and distribution of livestock and poultry excreta and crop straw in Zhejiang Province. J. Zhejiang Agric. Sci. 60 (2), 296–299.
Xi, J., Wang, J., and Liao, B. (2019). Review of biomass energy research. Shandong Chem. Ind. 48, 52–53.
Xing, H., Zhao, Y., and Wang, Y. Q. (2015). Estimate and distribution of rural biomass resource potential in Nantong City Jiangsu Province. Acta Ecol. Sin. 35 (10), 3840–3489.
Xue, B., Xiao, X., Li, J., Jiang, L., and Xie, X. (2018). POI-based analysis on retail’s spatial hot blocks at a city level:A case study of shenyang, China. Econ. Geogr. 38 (5), 36–43.
Yan, B., Yan, J., Li, Y., Qin, Y., and Yang, L. (2021). Spatial distribution of biogas potential, utilization ratio and development potential of biogas from agricultural waste in China. J. Clean. Prod. 292, 126077. doi:10.1016/j.jclepro.2021.126077
Yang, Y. L., Zhang, P. D., Zhang, W. L., Tian, Y. S., Zheng, Y. H., and Wang, L. S. (2010). Quantitative appraisal and potential analysis for primary biomass resources for energy utilization in China. Renew. Sustain. Energy Rev. 14 (9), 3050–3058.
Zang, L., and Zhang, C. (2019). Estimation and trend of biomass energy potential in China. World For. Res. 32 (1), 75–79.
Zhao, S. Y., and Yan, L. M. (2019). Analysis of spatial distribution and utilization potential of biomass energy in China. China For. Econ. 5, 75–79.
Zheng, J., Li, H., Li, J., and Guan, W. (2019). Investigation on regional distribution and utilization of biomass enerfy in Gansu province based on the investigation of Gansu province. Chin. J. Agric. Resour. Regional Plan. 40 (3), 53–60.
Zhong, G., and Xu, Z. (2022). Study on spatial patterns of public facilities in shantou based on POI data. Geomatics spatial Inf. Technol. 45 (3), 76–85.
Zhong, H. P., Yue, Y. Z., and Fan, J. W. (2003). Characteristics of straw resources in China and its utilization. Resour. Sci. 25 (4), 62–67.
Zhou, K., Xiao, H., Long, Y., Wu, J., and Zhang, S. (2021). Optimization path of regional layout of biomass energy industry in henan province. Sci. Technol. Manag. Res. 18, 220–226.
Zhou, X., Wang, F., Hu, H., Yang, L., Guo, P., and Xiao, B. (2011). Assessment of sustainable biomass resource for energy use in China. Biomass Bioenergy 35 (1), 1–11. doi:10.1016/j.biombioe.2010.08.006
Keywords: biomass resource, energy potential, energy density, spatial patterns, China
Citation: Lang L, Chen Y, Liu Y, Wu J, Yu Y, Wang Y, Chen X and Zhang Z (2023) Changes in spatial patterns of biomass energy potential from biowaste in China from 2000 to 2020. Front. Energy Res. 11:1109530. doi: 10.3389/fenrg.2023.1109530
Received: 27 November 2022; Accepted: 17 February 2023;
Published: 01 March 2023.
Edited by:
Yongqiang Liu, University of Southampton, United KingdomReviewed by:
Despina Vamvuka, Technical University of Crete, GreeceDilip Khatiwada, Royal Institute of Technology, Sweden
Copyright © 2023 Lang, Chen, Liu, Wu, Yu, Wang, Chen and Zhang. This is an open-access article distributed under the terms of the Creative Commons Attribution License (CC BY). The use, distribution or reproduction in other forums is permitted, provided the original author(s) and the copyright owner(s) are credited and that the original publication in this journal is cited, in accordance with accepted academic practice. No use, distribution or reproduction is permitted which does not comply with these terms.
*Correspondence: Zilong Zhang, emhhbmd6bEBsenUuZWR1LmNu