 Daniel Klüh
 Harri Nieminen
 Kristian Melin
 Arto Laari
 Tuomas Koiranen
- 1Campus Straubing for Biotechnology and Sustainability, Professorship of Regenerative Energy Systems, Technical University of Munich, Straubing, Germany
- 2LUT University Lappeenranta Campus, Lappeenranta, Finland
- 3LUT University Lahti Campus, Lahti, Finland
The chemical industry needs new methods for sourcing carbon-containing feedstocks from renewable sources to decrease CO2 emissions and reduce reliance on fossil fuels. Ethylene, a crucial base chemical used for making polymers and ethylene oxide, is primarily produced through steam cracking of fossil feedstocks. However, an evolving technology is the electrochemical reduction of CO2 or CO to produce ethylene. The study assesses the environmental, economic and energetic performance of a new biomass-based process that produces ethylene based on the electrochemical reduction of CO. The results are based on mass and energy balances from process simulation. The CO is produced by either gasification of biomass or combustion of biomass with CO2 capture and CO2 electrolysis. Besides ethylene, the process produces acetic acid, ethanol, oxygen and hydrogen as by-products which are purified and sold. The annual output varies between 36 and 68 kt ethylene with a biomass input of 157 kt. The levelized cost of ethylene ranges from 3,920 to 7,163 €/t with the gasification routes being the most cost-effective. The ethylene price is heavily dependent on electricity price, current density, operating voltage, and by-product prices. The carbon efficiency of the gasification-based routes is lower (64%) than the combustion-based routes (85%–86%). However, the energy efficiency is higher for the gasification-based routes (42%) compared to the combustion-based routes (28%). Conversion of ethanol to ethylene increases the ethylene yield with minimal impacts on the ethylene price. In terms of CO2 emissions, the gasification-based routes show lower emissions. Scenarios using wind power show a significant emission reduction potential compared to fossil products.
1 Introduction
The worldwide production of plastics is constantly rising and reached a maximum of 368 Mt in 2019 (Plastics Europe, 2021; Statista, 2022). The majority of plastic is based on fossil feedstock and only a small share is derived from biomass. The global production capacity for bio-based plastics was 2.4 Mt in 2021 (European Bioplastics, 2022).
Ethylene is a base chemical for the chemical industry (Moulijn, 2013). Most of it is used as feedstock for polyethylene (PE) production. PE accounts for 20% of the plastic demand in Europe (Plastics Europe, 2021). Ethylene is mainly produced from steam cracking which is an energy intensive process relying on fossil feedstock hydrocarbons. The production of ethylene faces three major trends. Firstly, the depletion and limited availability of fossil resources calls for renewable feedstock alternatives. Secondly, the steam cracking process causes high CO2 emissions. In order to limit climate change, different strategies for reducing CO2 emissions need to be developed. This could be either done by improving existing process (Mynko et al., 2022) or by developing new process routes (Table 1). Zhao et al. (2021) investigated the economics of the production of light olefins via 20 different production paths, based on different feedstocks and conversion processes. Thirdly, electrification of the ethylene production process can help make use of renewable electricity. With the use of renewable and low carbon electricity, the CO2 emissions can be cut. These three challenges also apply to other monomers for plastics, and base chemicals in the chemical industry.
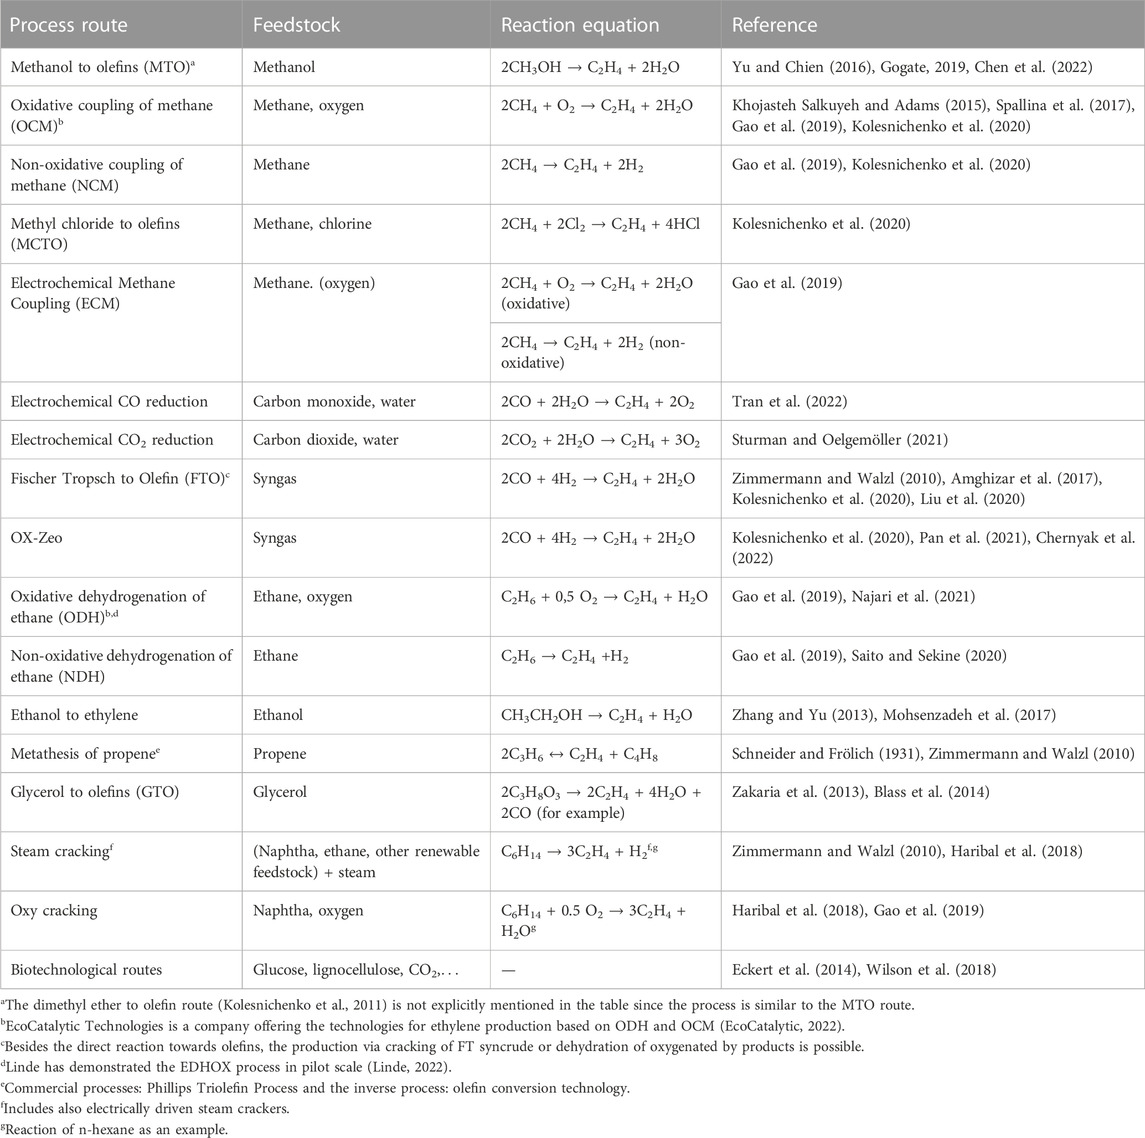
TABLE 1. Processes for the production of ethylene from various feedstock (Only the main reactions towards ethylene are shown, some processes produce a mixture of lower olefins).
Electrification of the chemical industry is highly discussed (Eryazici et al., 2021). First steps towards commercialization are undertaken in electrification of the steam cracking process. BASF et al. (2022) are building a pilot plant for testing an electrified steam cracker at the Ludwigshafen site. The plant will be able to process approximately 4 t of hydrocarbons per hour, using 6 MW of electricity (BASF et al., 2022). SYPOX (2022) is another example of an electrified steam cracker. Another concept is currently being commercialized by Coolbrook. They developed the RotoDynamic Reactor™ in which heat and micromixing for cracking is provided by rotating blades (Bushuev, 2012; Coolbrook, 2022).
Efforts towards new and electrified production routes for ethylene production are ongoing. Table 1 gives an overview of alternative production routes for ethylene based on various feedstock. The transformation from fossil-based ethylene production to renewable feedstock is investigated. Beyond the substitution of fossil feedstock by renewable alternatives in steam cracking, the development of new production processes based on other raw materials, can expand the feedstock base to include a wider variety of renewable materials.
CO2 or CO can be converted with hydrogen to methane or methanol for further processing to ethylene. Alternatively, CO2 or CO can be converted to ethylene via electrified conversion processes, i.e., converted to C2 products electrochemically. This process is currently at the technology readiness level of 3–4 (Roh et al., 2020; Chernyak et al., 2022). However, implementation of CO2/CO electrolysis via membrane electrode assembly technology is considered to have potential for scale-up. Chernyak et al. (2022) assess the electrochemical reduction as one of the most environmentally favorable options in comparison to other novel, and also established technologies. Xia et al. (2022) emphasize the utilization of biomass as renewable carbon feedstock for electrochemical processes.
The electrochemical reduction of CO2 (CO2R) can produce a wide range of products like ethylene, ethanol, acetic acid, propanol, methanol, or formic acid (Xia et al., 2022). The utilization of a two-step process from CO2 to C2 products via CO as intermediate is considered beneficial compared to direct CO2 conversion (Ramdin et al., 2021; Sisler et al., 2021). Therefore, this paper focuses on the reduction of CO to C2 products (COR) combined with biomass gasification. The processes can in comparison to steam crackers be scaled to smaller plant sizes and produces no additional gaseous by-products like propylene which need to be processed onsite making the plant more flexible in size and location.
The combination of biomass-based and electrified processes, termed Power-/Biomass-to-X (PBtX), has been widely investigated in recent years. Most studies have focused on the production of liquid fuels or chemicals by indirect electrification via addition of hydrogen derived from water electrolysis. By adding H2, the CO/H2 ratio of the bio-based syngas can be adjusted to the requirements of the synthesis process. It has been shown that PBtX systems reach higher carbon and energy efficiencies compared to the processes without electrification. However, the direct electrification of PBtX routes is not as mature and has just recently gained more attention. Examples include the use of electrically heated gasifiers (Putta et al., 2022) or reformers (Melin et al., 2022), and electrochemical conditioning of syngas (Butera et al., 2021).
This paper focuses on a PBtX process based on gasification followed by direct electrification of the synthesis process via electrochemical reduction of CO. Such an approach has not been previously discussed in the PBtX context, to the authors’ knowledge. Several studies start with CO2 from an undefined source converting CO2 in a two-step process to C2 products (Table 2). In this paper, the first step of the two-step process is substituted via gasification and gas purification (see Figure 1). This paper strives to address the research gap in the field of PBtX processes in terms of (a) direct electrification of the synthesis process via electrochemical reduction of CO to C2 products, (b) the utilization of solid biomass as feedstock for the electrochemical reduction via gasification, (c) the improved conversion of COR products towards ethylene via chemical catalytic routes and (d) an assessment of the influence of product distribution on the process performance and (e) the environmental assessment of production routes in terms of CO2 emissions. The Power-Biomass-to-Ethylene process via gasification and electrochemical reduction of CO developed here is a new path for the sustainable production of ethylene.
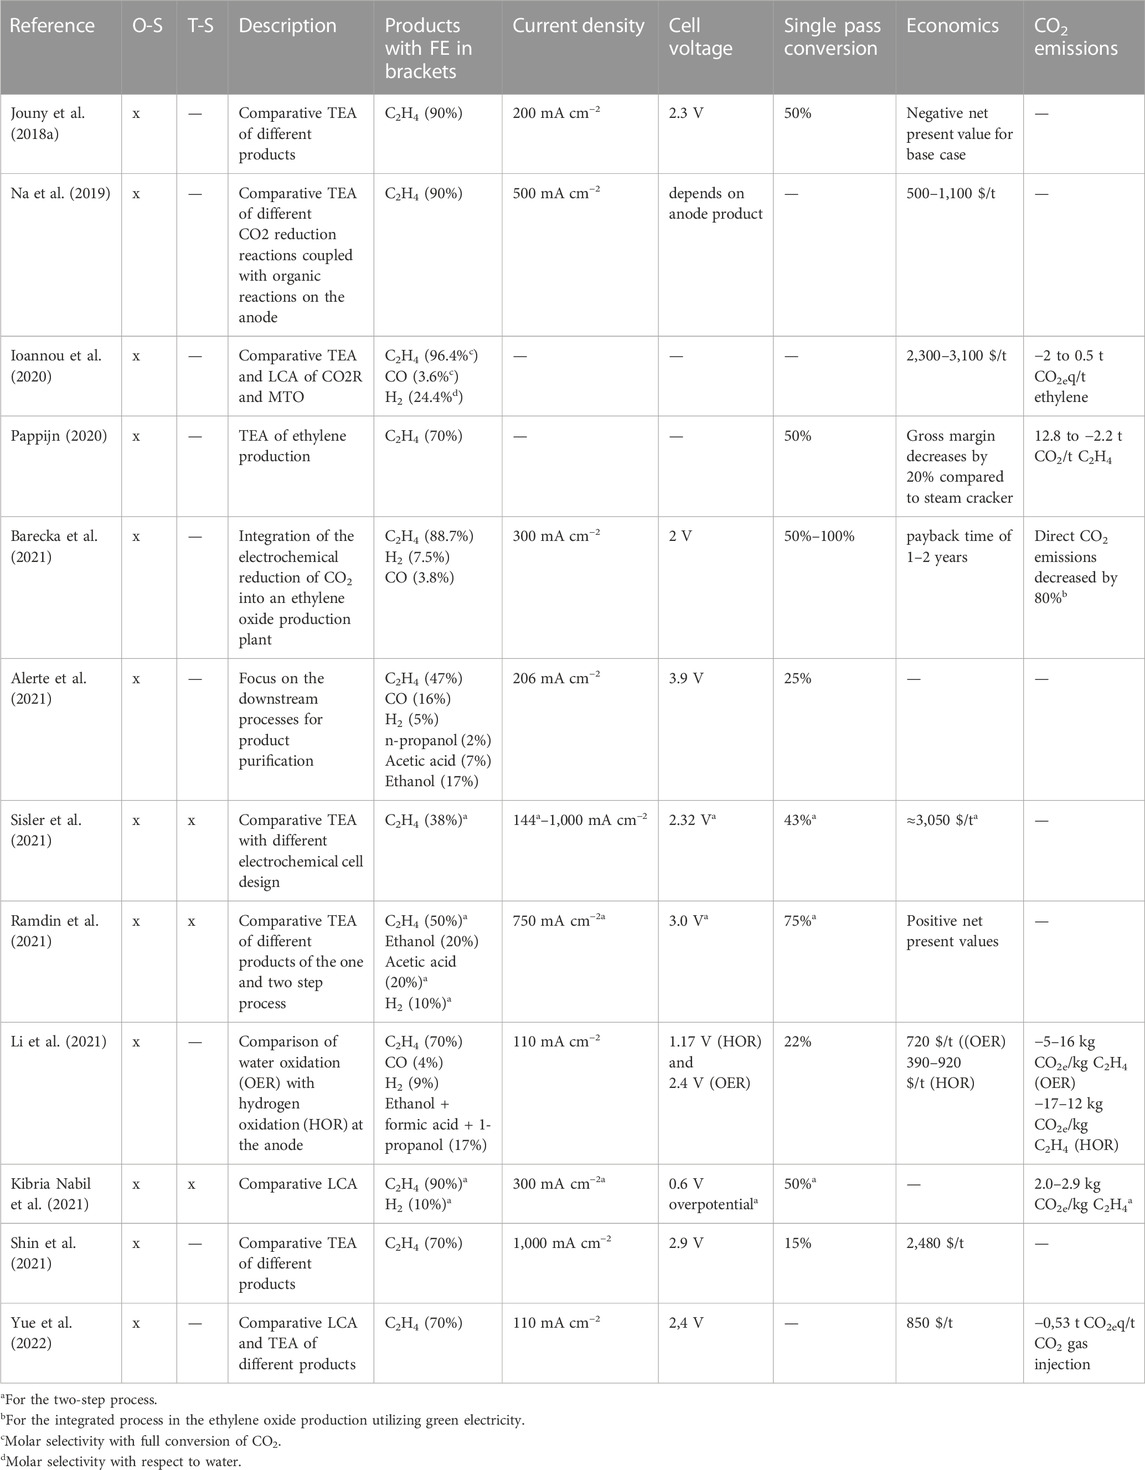
TABLE 2. Overview of process designs and assessments of two-step and one-step electrochemical reduction of CO2 (O-S: one-step process, T-S: two-step process).
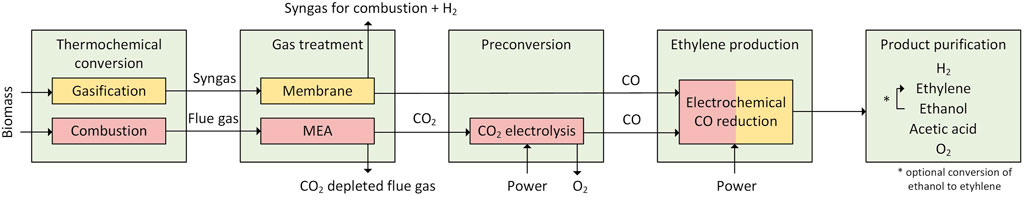
FIGURE 1. Sketch of the two process routes starting from biomass residues with either biomass gasification (orange) or biomass combustion (red).
1.1 Ethylene production and use
Ethylene (ethene) is one of the major building blocks of the chemical industry. The annual worldwide production of ethylene was approximately 170 Mt (2021) (Najari et al., 2021). Ethylene is mostly used for the production of PE which accounted for roughly 60% of the worldwide ethylene produced in 2000 (Zimmermann and Walzl, 2010). Other key products from ethylene include ethylene oxide, ethylene dichloride, ethylene glycol, and ethylbenzene (Zimmermann and Walzl, 2010).
Table 1 reviews the technical processes for ethylene production. Fossil-based processes with small market shares and low ethylene yields are not included. Such examples include the catalytic pyrolysis process (CPP), SUPERFLEX, propane dehydrogenation, Gas stream technologies, hydro-pyrolysis of naphtha, and Mobil Olefins Interconversion (MOI) (REN et al., 2006; Hsu and Robinson, 2017). Besides established and commercialized processes, the table shows emerging technologies which can be based on renewable feedstock.
The most common production route for ethylene production is the steam cracking process (Zimmermann and Walzl, 2010). The feedstock reacts at temperatures at around 750°C–875°C in a fired furnace (Zimmermann and Walzl, 2010). After cooling, the reaction products are separated. Product yields vary depending on process conditions and feedstock properties (Zimmermann and Walzl, 2010). Typical sizes of steam cracker plants are in the range of 1–3 Mt ethylene per year (Zimmermann and Walzl, 2010; Fan et al., 2012). Typical feedstock for steam cracking includes ethane, propane, butane, naphtha, gas oil, or hydrocracker residue (Zimmermann and Walzl, 2010). Fossil feedstock can be replaced by renewable alternatives like hydrodeoxygenated tall oil (Pyl et al., 2012), vegetable oil (Zámostný et al., 2012), bio-oil (Gayubo et al., 2010; Li et al., 2018), or bio-naphtha (Pyl et al., 2011).
Except for the biotechnological process routes and cracking processes, the carbon containing feedstock of the processes included in Table 1 exclusively consist of hydrocarbon fractions at shorter chain lengths, ranging from C1 to C3. Besides the carbon feedstock, some processes require auxiliary reactants like water, oxygen, or chlorine. The C1 feedstocks (syngas, CO2, CO, methane, and methanol) can all be derived from sustainable feedstock at low CO2 emissions. The methanol to olefin process (MTO) is a commercial process available for the production of short olefins (Gogate, 2019). Ethanol and ethane are possible C2 feedstock, while C3 feedstock comprise of propene and glycerol. The process for ethanol dehydration to ethylene is commercialized and multiple plants are running worldwide (Fan et al., 2012; IRENA, 2013). C6 sugars can be converted via the biotechnological route.
2 Electrochemical COx conversion
The electrochemical conversion of CO2 towards C2+ products can be either performed as a one-step or two-step process. In the two-step process, CO2 is converted to CO as intermediate product. CO is further processed in another electrochemical cell under alkaline conditions. The one-step process consists of one electrochemical cell under alkaline conditions for the conversion of CO2 directly to mostly C2+ products. CO is also formed as a main intermediate in the reaction mechanism (Zhu et al., 2017). Therefore, the utilization of CO as feedstock can increase the rate for C-C coupling, yielding more C2+ products (Fu et al., 2021). The two-step process can also be executed in one step using a tandem catalyst (Fu et al., 2021). Major C1 products of CO2R/COR on the cathode side are carbon monoxide, methane, methanol, formaldehyde and formic acid (Qiao et al., 2014). C2+ products are ethanol, acetic acid, n-propanol and ethylene (Romero Cuellar et al., 2020). On the anode, the most frequently used reaction is the oxygen evolution reaction (OER) producing oxygen from water. Copper is the only known catalyst material for the COR yielding C2+ products (Fu et al., 2021).
One major disadvantage of CO2R is the loss of CO2 in the form of carbonates. Under alkaline conditions, CO2 forms carbonates (HCO3− and CO32−) in the electrolyte. For the ethylene production reaction, 75% of the carbon dioxide feed is converted to bicarbonate which accumulates in the electrolyte (Jouny et al., 2019). The carbon dioxide can be recovered from the electrolyte adding 300 $/t ethylene (conservative estimate) to the production cost (Jouny et al., 2019). Operating CO2R under non-alkaline conditions leads to a drop in reaction rate and efficiency (Jouny et al., 2019).
Additionally, Faraday efficiencies (FE) for C2+ products are higher for the two-step process since the reduction of CO requires less electrons than CO2 reduction (Ramdin et al., 2021). Jouny et al. (2018b) showed that the FE for C2+ products decreased from around 80%–55% when switching from CO to CO2 as feedstock, with reduction carried out in a membrane electrode assembly configuration. Additionally, the cell voltage increases by roughly 0.1 V during CO2 reduction (Jouny et al., 2018b). Besides, the lower overpotential in COR, the current density is higher leading, to higher production rates and lower investment cost for the electrochemical cell (Romero Cuellar et al., 2020). Furthermore, CO adsorption on the catalyst surface is stronger, leading to a suppression of the hydrogen evolution reaction, which increases the FE of C2+ products (Fu et al., 2021). Hydrogen evolution is also suppressed at alkaline conditions (Zhang et al., 2019). Furthermore, Ramdin et al. (2021) state that the COR shows higher per pass conversion than CO2R. Xia et al. (2021) state that the C2+ selectivity, catalyst stability, carbon efficiency and single pass conversion are advantages for COR in comparison to CO2R.
The effects of feed gas impurities on the electrochemical cell discussed in literature include changes in efficiency and product distribution. The effect is very much dependent on the studied system. Some impurities, such as O2, can have both positive and negative effects depending on the circumstances (Zhai et al., 2009). Legrand et al. (2020) summarize the effect of impurities on copper, tin and lead as catalysts for the production of formic acid from CO2. Critical components are O2 (oxidation of catalyst), particulate matter (deposition on surface) and SO2 (altered selectivity and FE). N2 and hydrocarbons like methane are assessed as not critical. In lower concentrations, NOx has no, or even positive effects, on the process. Luc et al. (2019) report reduced efficiencies if SO2 is present as impurity, however, the decrease in FE was found reversible for Ag and Sn catalysts. Copper was found more vulnerable, showing a change of products from C2 to formate in presence of SO2 (Luc et al., 2019). Syngas from biomass gasification needs extensive cleaning for the removal of impurities like, for example, H2S, COS, NH3, and HCl before it can be processed in chemical synthesis like methanol or Fischer Tropsch. If COR processes can tolerate higher impurities, this would make the gas cleaning process less costly and more compact.
2.1 Review of process design studies
Table 2 reviews publications concerning process design, modelling, environmental assessment and economic assessment of one-step or two-step electrochemical CO2 reduction processes. Only three studies consider the two-step process (CO as intermediate product) which is widely regarded as being beneficial in terms of efficiency and economics. The studies comparing the one-step with the two-step process report a better economic, environmental and technical performance for the two-step option (Kibria Nabil et al., 2021; Ramdin et al., 2021; Sisler et al., 2021). The energy demand can, according to (Kibria Nabil et al., 2021), be decreased by 27% for the two-step compared to the one-step process. Besides the oxygen evolution reaction on the anode, other reactions can be used to improve economics, as shown by Li et al. (2021) and Na et al. (2019).
General limitations of the reviewed studies include unrealistically high FE, low cell voltages and consideration of only one product from the reduction reaction. One important aspect in process design is also the product separation and purification which can lead to high cost and energy consumption. Greenblatt et al. (2018) elucidate on that topic in the context of electrochemical CO2/CO reduction.
3 Investigated scenarios
Two main routes, both based on the electrochemical reduction of CO, are included. Both routes utilize lignocellulosic waste biomass as feedstock, but differentiate in terms of the employed thermochemical treatment: gasification or combustion.
Figure 1 illustrates the process routes. In case of the gasification route, the biomass is dried and gasified in an oxygen and steam blown fluidized bed gasifier. The CO rich stream is sent to the electrochemical CO reduction. From the purge stream of the membrane separation, hydrogen is recovered via pressure swing adsorption (PSA). The leftover gas is used for heating the reformer.
In case of the combustion-based route, biomass is combusted in a fluidized bed combined heat and power (CHP) plant producing heat and electricity for the operation of the processes. CO2 is separated from the flue gas with a monoethanolamine (MEA) wash. The CO2 is further converted to CO in a CO2 electrolysis unit. The CO is then further processed in the electrochemical CO reduction unit.
During electrochemical reduction, the CO is converted in an electrochemical cell to ethylene, acetic acid, ethanol, oxygen, and hydrogen. Ethanol and acetic acid are separated from the electrolyte via rectification. Oxygen is easily separated from the liquid phase of the anode. Unreacted CO, H2, and ethylene from the cathode are separated via PSA. The unconverted CO together with traces of H2 and ethylene are recycled to the electrochemical cell. Furthermore, the dehydration of ethanol was investigated in selected scenarios to increase the overall ethylene production capacity of the process.
3.1 Scenario definition
For both the combustion and gasification-based route, three distinct scenarios were investigated. Gasification based scenarios are tagged with “G” and combustion-based scenarios are tagged with “C” (see Table 3). For the electrochemical CO reduction, we consider different product yields to study the impact on the process performance. For the improved ethylene yield “-O” we are assuming less by-products and higher ethylene yield in COR. Scenario “−2” consider additional conversion of ethanol to ethylene.
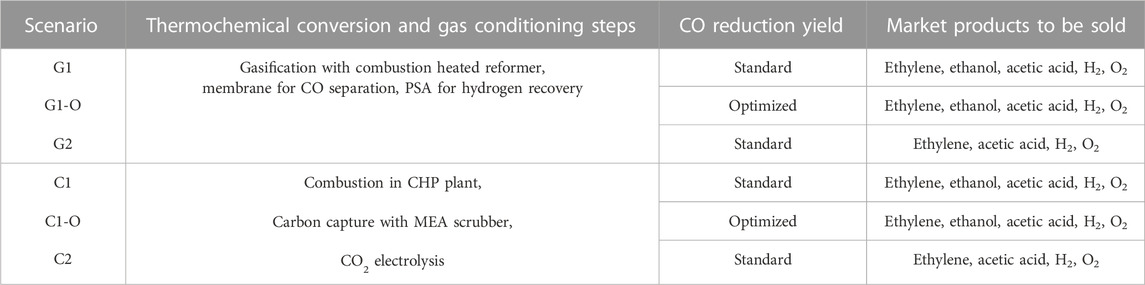
TABLE 3. Investigated scenarios.
4 Process evaluation
4.1 Cost estimation
For a comparative assessment of the scenarios, the levelized cost of ethylene (LCOE) is calculated based on Eq. 1. The LCOE comprises of the annualized capital expenditure (CAPEX), the yearly operating cost (OPEX) and the revenue from by-product sales, which are subtracted. This value is divided by the yearly production of ethylene to give the LCOE in €/t ethylene.
The selling prices for the by-products ethanol (800 €/t), acetic acid (800 €/t), oxygen (10 €/t) and hydrogen (2000 €/t) are used to calculate the revenue. The operating costs include biomass (20 €/MWh), electricity (60 €/MWh), maintenance, labor, refrigeration, heat supply, deionized water for the anode reaction, and CO2 separated from the flue gas. The base year for cost calculations is 2020. The annual full load hours are set at 8,400 h. For calculation of the annuity factor, the interest rate is set at 6%, and project lifetime at 20 years (40 years for power plant). The equipment cost is either derived from the Aspen Cost Estimator or scaled based on reference costs. The investment cost include the chemical plant, the gasification plant and the CHP plant. Details on the cost estimation are presented in the Supplementary Material.
4.2 Carbon efficiency (CE)
Eqs 2–4 show the CE (ηCE) for three different system boundaries: overall process, CO production (gasification or combustion followed by CO2 electrolysis), and electrochemical CO reduction.
4.3 Energy efficiency (EE)
The energy efficiency of the process routes and scenarios are calculated based on the comparison of the product energy content (LHV-basis) to the major energy inputs: biomass and electricity. The energy efficiency is calculated for different balance boundaries or process stages, as shown in Eqs 5–8.
4.4 Specific electrical energy consumption
The specific electrical energy consumption (MJ/kg) per unit of all products is calculated according to Eqs 9, 10.
4.5 CO2 emissions
A simplified calculation of direct and indirect CO2 emissions was performed. The system boundary includes the production phase and not the use phase. Emissions from biomass and electricity generation are considered. The specific supply chain emissions of biomass are assumed at 11.9 kg CO2/t dry biomass (Jäppinen et al., 2014). Based on prior experience, the emissions from electricity generation have the highest impact on the CO2 balance of electrified processes. The electrical power Pel comprises the electricity needed from the grid. In scenarios “C,” a portion of the electricity is produced on-site and therefore not accounted for in the CO2 balance. The emission factor of the grid electricity is varied to see the impact of varying carbon intensity of the used electricity mix. Emissions from additional heat is not accounted for in this calculation since it is assumed to be derived from biomass.
Here, the product-specific emissions are allocated based on the product price, following common practice in case of multiproduct processes. Oxygen is not included in the calculations. The product-specific emission factors are calculated using this equation:
4.6 Heat integration
In order to assess the heat that can be utilized in the processes, heat integration was performed using the pinch methodology. The global minimum temperature difference was set at 20°C, accounting for the large number of gaseous streams within the process. The required (minimum) heating and cooling duties can be derived. Purge streams from processes are combusted for fired heat within the processes (e.g., reformer or reactor preheating in ethanol to ethylene process). Surplus energy from purge streams is used to produce high pressure steam at 250°C to be utilized on-site.
5 Process modelling
Models for the process stages were developed in Aspen Plus V12. If not otherwise stated, the pressure drop of equipment was neglected. The composition of biomass is given in the Supplementary Material. We are using pine biomass residues.
5.1 Gasification-based route
Following Figure 1, the gasification route consists of biomass drying and gasifiction, followed by COR and product separation.
5.1.1 Biomass dryer
Biomass is dried before it can be further processed in gasification. The biomass dryer is designed as a belt dryer operating at a temperature level of 120°C. The thermal energy consumption per t of evaporated water is assumed to be 1.3 MWh (Hannula, 2015). The electrical energy consumption is 32 kWh/t of dry biomass (Hannula, 2015). The biomass dryer is modelled with a simplified mass and energy balance calculation based on the energy consumption values and removed water content. The water content is reduced from 35 to 15 wt.%.
5.1.2 Gasification and gas conditioning
The dried biomass is gasified in an oxygen blown fluidized bed gasifier. A flowsheet of the model is depicted in Figure 2. The Redlich-Kwong-Soave equation of state was used as the property method which is suitable for gas processing (Aspen Technology, 2013). The gasifier is modelled by two reactors. In the decomposition reactor (RYield), the biomass is broken down into its elements, while the subsequent reactor finds the chemical equilibrium by Gibbs energy minimization (RGibbs). This modeling approach is common practice for high temperature thermochemical processes utilizing non-conventional feedstock.
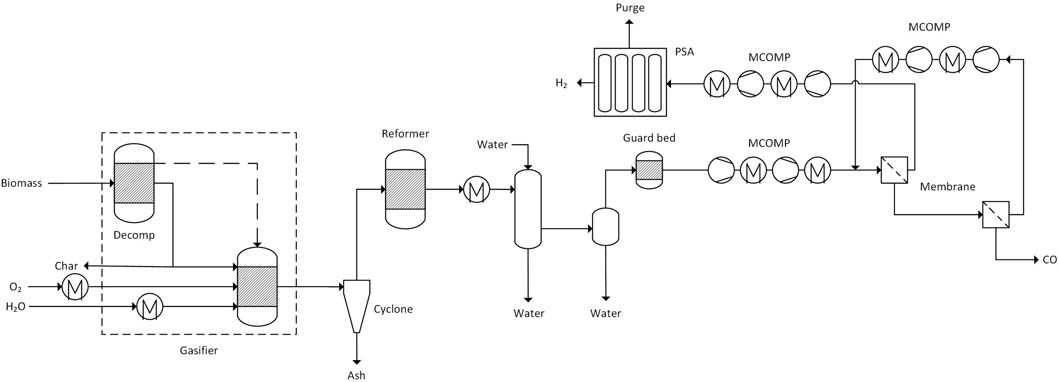
FIGURE 2. Flowsheet of the gasification and gas conditioning section including CO and H2 separation. (dashed lines represent heat flows, solid lines are material flows).
The equilibrium model is corrected for the formation of methane. The methane content of the raw syngas was set to 10 mol% which is in line with experimental data (Simell et al., 2014). In order to account for losses of carbon in the gasification char, 1% of the carbon is removed from the gasifier. Water is evaporated and fed to the gasifier together with oxygen. Both streams are preheated to 350°C. The gasifier itself operates at 900°C and 10 bar.
The cyclone is modelled as in ideal separation step to remove ash from the gas stream. The catalytic reformer operates at 950°C and is heated by combustion of purge streams. In the reformer, methane and tars are converted into carbon monoxide and hydrogen. After the reformer, the syngas is cooled to 80°C. Water-soluble components including ammonia are removed in a water wash column and water is separated in the following flash drum operating at 20°C. Subsequently, sulphur impurities such as H2S and COS are removed using activated carbon and zinc oxide guard beds.
The separation of CO is modeled as a two-stage membrane process reaching purities of above 99.2 vol% (St. Teuner et al., 2001). Before the separation, the syngas is compressed to 20 bar in a two-stage compressor with intercooling to 30°C after each stage. The membrane is modelled as a splitter with split fractions accounting for the permeability of different compounds. The retentate of the first stage is fed to the second stage. The retentate from the second stage yields the carbon monoxide product stream. The permeate of the second stage is recycled to the first stage via a two-stage compressor (intercooling to 30°C).
The pressure drop through the membrane is 18 bar and on the retentate side 0.2 bar. The permeate of the first membrane stage is treated by PSA to recover hydrogen. The PSA feed stream is compressed to 20 bar. The remaining gas components (mainly CO2, CO, CH4, N2) are adsorbed on the bed material whereas hydrogen passes through. Since the stream contains a significant amount of carbon monoxide, zeolites are an effective adsorbent choice due to their higher adsorption selectivity towards CO (selectivity order CO2 > CO > CH4 > N2 > H2) (Liu et al., 2009). In the product stream, we assume a hydrogen concentration of 99.99 mol% with CO as the only impurity. The hydrogen recovery is set to 80%, and the pressure drop of the absorber bed is assumed at 2 bar.
5.2 Combustion-based route
The combustion-based route consists of biomass combustion with CO2 capture, conversion of CO2 by electrolysis, and electrochemical conversion of CO followed by product separation.
5.2.1 CHP plant
In the CHP plant, wet biomass is combusted. The plant is based on a circulating fluidized bed boiler which is an applicable firing technology at scales above 30 MWth (Spliethoff, 2010). For the steam cycle, the STEAMNBS property method was used which is suitable to predict the properties of pure water (Aspen Technology, 2013). The combustion and flue gas sections of the model use the Redlich-Kwong-Soave method suitable for gas processing (Aspen Technology, 2013). The simulated process (Figure 3) can be divided into the steam cycle (lower part Figure 3) and the combustion part (upper part).
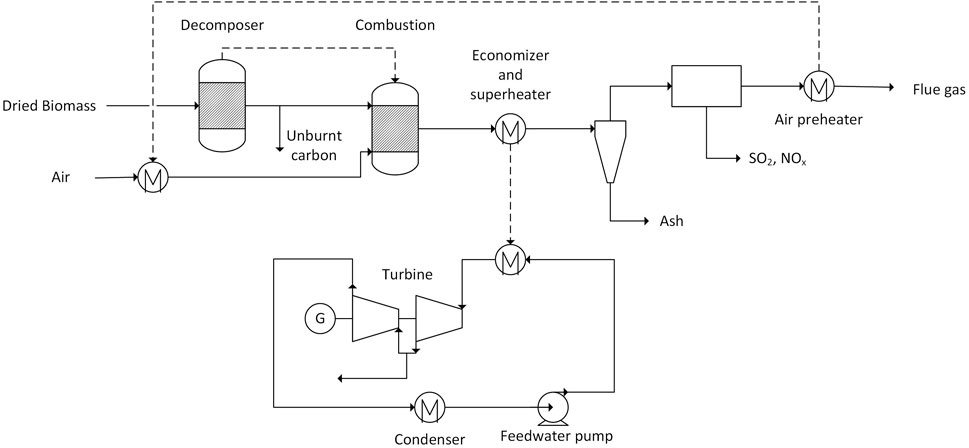
FIGURE 3. Flowsheet of the combined heat and power plant as modelled in Aspen Plus (dashed lines represent heat flows, solid lines are material flows).
Biomass is modelled as a non-conventional stream (composition given in the Supplementary Material). The combustion is modelled as a series of two reactors. In the decomposer (RYield), the biomass is broken down into the elements. 1% of carbon is removed after the decomposer to account for unburnt fuel. The combustion reaction is modelled with a Gibbs energy minimization reactor (RGibbs) in order to find the chemical equilibrium of the reactants. The air for combustion is adjusted to yield a molar fraction of oxygen in the final flue gas of 3 mol%. The air for the combustion is preheated to 200°C by transferring heat from the cleaned flue gas. After the heat transfer to the Rankine cycle, ash and other pollutants like SO2 and NOx are removed from the flue gas. This is modelled as an ideal separation process not considering the specific purification methods.
The heat transfer from combustion to the Rankine cycle is modelled with a single heat exchanger. The constraint of the heat exchanger is a steam outlet temperature of 500°C at 100 bar. The steam parameters are in the range of typical biomass fired CHP plants (Beiron et al., 2022). The water flow rate is adjusted to keep the flue gas outlet temperature at 160°C. The superheated steam enters a two-stage turbine. The outlet pressure and temperature of the first stage is 4 bar and 173°C. After this stage, steam can be extracted in order to supply heat to other process sections (preferential to the MEA scrubber). In the second stage, the steam is further expanded yielding a vapor fraction of 95 wt.%. The outlet pressure is set to 0.08 bar according to information of the Siemens SST-300 steam turbine (Siemens AG, 2018). The isentropic and mechanical efficiency of the turbines were set to 75% and 91%, respectively. After full condensation the pressure of the feedwater is increased to 100 bar by the feedwater pump.
5.2.2 MEA scrubber
The CO2 is separated from the flue gas of the biomass CHP plant. Post-combustion capture by absorption with MEA is selected for CO2 separation as established technology for capturing CO2 from power plant flue gases (IEAGHG, 2019; Kearns et al., 2021).
Reference data was used to calculate the simplified mass and energy balances. The CO2 capture ratio was assumed at 90%. Higher capture rates are possible but cause higher energy demand and cost (IEAGHG, 2019). The reboiler duty is in the range of 3.6–4.0 GJ/t CO2 for a 30 wt.% MEA solution (Bui et al., 2018). With more sophisticated process configurations, the reboiler duty can be decreased to the range of 3.52–2.22 GJ/t CO2 (Ahn et al., 2013). In this paper we assume an energy demand of 3.5 GJ/t CO2 for the reboiler, operating at 120°C (Kuckshinrichs and Hake, 2015; Vega et al., 2020). The demand for cooling was neglected. The electricity demand was assumed to be 0.5 MJ/kg CO2 (Voldsund et al., 2019).
5.2.3 CO2 electrolysis
CO2 is converted electrochemically to CO according Eq. 12 (Küngas, 2020). On the cathode, carbon dioxide is reduced to carbon monoxide, while oxygen is formed on the anode. CO is separated from the product stream and the unreacted CO2, also containing some CO, is recycled back to the electrolysis cell.
The process was modelled based on the information available from Haldor Topsoe on their eCOs™ process (high-temperature solid oxide electrolysis) (Haldor Topsoe). We assumed a carbon efficiency of 100% and calculated the mass balance based on the reaction Eq. 12. The CO stream is assumed to have a purity of 99.5 mol% (Küngas et al., 2017). The process uses electricity for electrolysis and heating. The electrical energy demand was assumed at 7 kWh/mN3 which translates to 5.6 kWh/kg CO (Topsoe, 2020).
5.3 Electrochemical CO reduction and product separation
In the electrochemical reactor, carbon monoxide is converted to mostly C2 products. We assumed ethylene, ethanol, acetic acid, oxygen and hydrogen as products, neglecting other potential by-products. In the CO reduction model, these products are formed following the overall reactions described by Eqs 13–16 (anode and cathode reactions are shown in the Supplementary Material).
Figure 4 shows a flowsheet of the electrochemical reactor and downstream product separation. CO enters at the cathode which is a gas diffusion electrode (GDE). Gaseous products including ethylene and hydrogen are formed on the cathode and leave the compartment together with unreacted CO. The catholyte and anolyte (KOH solution) is constantly pumped through the catholyte and anolyte chamber. Ethanol accumulates in the catholyte chamber. Acetate, modelled as acetic acid, is found in the anolyte chamber. The dissociation to CO2 was not considered. The concentration of each liquid product reaches an assumed maximum of 10 wt.% before the catholyte is sent to product separation which is in line with Ripatti et al. (2019) who showed the production of a 1.1 M acetate stream. The catholyte is separated from the anolyte by an anion exchange membrane (AEM).
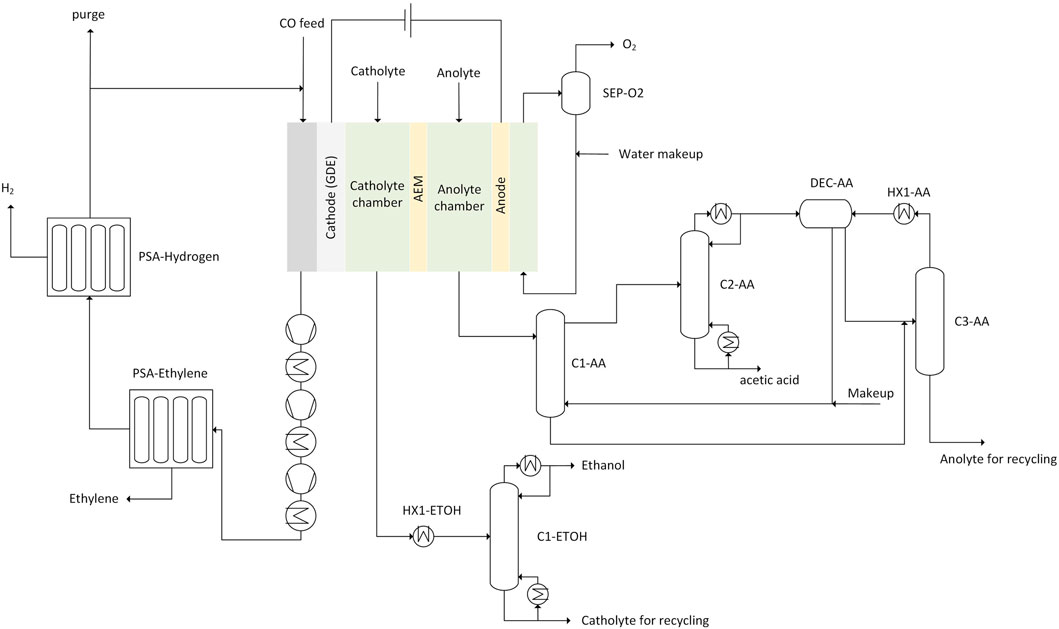
FIGURE 4. Sketch of the electrochemical CO reduction including the downstream product purification and recycle streams (GDE, gas diffusion electrode; AEM, anion exchange membrane) recycle for catholyte and anolyte including makeup not shown in sketch.
In Aspen Plus, the electrochemical conversion was modeled using an RStoic reactor connected with two calculator blocks for the calculation of the energy demand, and the product yields based on FE. The electrochemical reactor is operated at 30°C and 1 bar. The FE are assumed at 60% for ethylene, 10% for acetic acid, 20% for ethanol and 10% for hydrogen, in line with recent publications (Ozden et al., 2021). The product distribution depends on many factors and can be adjusted (Ji et al., 2022). In order to evaluate the impact of product distribution, alternative scenarios with increased selectivity towards ethylene were considered. In the scenarios G1-O and C1-O, the following FE are assumed: 85% for ethylene, 5% for acetic acid, 5% for ethanol, and 5% for hydrogen.
75% single pass conversion of CO was assumed. For instance, Dinh et al. (2019) reported a single pass conversion of 68% in a flow cell. In another study, higher single pass conversions of up to 84% were reached but with less favorable product distributions (Ripatti et al., 2019). Since we are recycling back the unreacted CO after product gas separation, the incoming stream is not pure in CO which leads to hampered mass transfer of CO to the cathode. Therefore, very high single pass conversions seem unreasonable. The cell voltage was assumed at 3.5 V, which is slightly above recent experimental data (Ozden et al., 2021; Ramdin et al., 2021). The current density was set at 300 mA cm−2 (Shin et al., 2021). In their experiments, Xia et al. (2021) showed that higher current densities require a higher overpotential, thus counterbalancing the tradeoff between lower investment cost and higher operating cost.
The outlet of the cathode side contains unreacted CO and the gaseous products ethylene and hydrogen. With two PSA units, the products are separated from CO. The gaseous mixture is compressed to 20 bar in a three-stage compressor. In the first PSA, ethylene is selectively adsorbed. Possible adsorbents for the selective adsorption of ethylene are for example activated carbon (Ramdin et al., 2021), 5A zeolite (van Zandvoort et al., 2019) or metal-organic frameworks (Bachman et al., 2018). The ethylene purity was assumed at 99.5 mol% with CO as the main impurity. The ethylene recovery was set at 80%. The subsequent hydrogen separation yields a 99.99 mol% hydrogen stream at hydrogen recovery of 80%.
For the PSA process the pressure drop along the bed was assumed to be 1 bar and the desorbed gas stream leaves the unit at 1 bar. Separating first ethylene and then hydrogen requires only a single compression step. The residual gas following hydrogen separation contains mainly CO and is recycled to the electrochemical cell. A purge of 5% was introduced to remove impurities like CO2 or CH4 originating from gasification or combustion.
5.3.1 Acetic acid recovery
The acetic acid separation and purification stage was modelled following the scheme suggested in (Ramdin et al., 2021) using the NRTL-HOC property method. The NRTL method can describe the behavior of non-ideal mixtures (as encountered in the model) and the Hyden-O’Connell extension predicts the dimerization of carboxylic acids (acetic acid in this case) in the vapor phase (Aspen Technology, 2013). Separation is carried out by extractive distillation using ethyl acetate as the extracting solvent. Figure 4 gives the corresponding flowsheet. The feed is contacted with the recycled ethyl acetate input containing 4 wt.% water carried from the solvent recovery section. Small make-up of ethyl acetate is added to offset losses. The feed-to-solvent ratio (moles of total feed per moles of ethyl acetate input) is 1.0. The ratio was not rigorously optimized but was found to be near optimal based on test model runs, targeting minimum utility demand in the distillation column.
The extract stream removed from the top of the extraction column is fed to the distillation column, where water and ethyl acetate are distilled, leaving 99.9 wt.% acetic acid as the bottom product. The distillate is fed to a decanter. The separated aqueous fraction is mixed with the raffinate stream (7 wt.% ethyl acetate in water) from the extraction column. The mixed stream is fed to the stripping column where ethyl acetate is stripped using steam generated in the reboiler. The stripped solvent (containing 13 wt.% steam) is condensed prior to recycle to the decanter. 99.9 wt.% water is removed from the bottom of the stripping column.
Unit operation specifications and model inputs are given in the Supplementary Material. The resulting model predicts 99.7 mol% recovery of acetic acid, at ethyl acetate make-up of 5.8 kg/h (losses below 0.01%).
5.3.2 Ethanol separation
The ethanol stream from the electrochemical cell is assumed to have a concentration of 10 wt.%. The limiting factor for rectification is the azeotrope of water ethanol mixture at 95.57 wt.% (97.3 vol%) (Kosaric et al., 2010). In order to overcome the azeotropic point and to produce anhydrous ethanol, pervaporation, azeotropic distillation, or other separation schemes can be used. Azeotropic distillation is used for larger plant sizes, using entrainers like benzene, cyclohexane or ethylene glycol (Kosaric et al., 2010).
In our case the desired concentration of ethanol is below the azeotropic point. The ethanol stream is purified to 94.6 wt.% (96.5 vol%) which is a typical grade for industrial ethanol (Kosaric et al., 2010). Additionally, the ethanol to ethylene process is tolerant for water in the ethanol stream (Zhang and Yu, 2013). The purification process is performed in one rectification column (C1-ETOH, RadFrac model) with 70 stages, as shown in Figure 4. The ethanol-water mixture is preheated to 70°C before entering the column above stage 65. The reflux ratio and the distillate to feed ratio are set to 3.174 and 0.0456, respectively. As property method, we used NRTL to describe the non-ideal behavior of the mixture (Aspen Technology, 2013).
5.4 Ethanol to ethylene
The dehydration of ethanol to ethylene is a commercialized process with multiple plants in operation worldwide (Jamil et al., 2022). The selectivity towards ethylene is above 99% (Zimmermann and Walzl, 2010) and can reach 100% under lab conditions (Wu and Wu, 2017). Figure 5 shows the flowsheet of the modelled process.
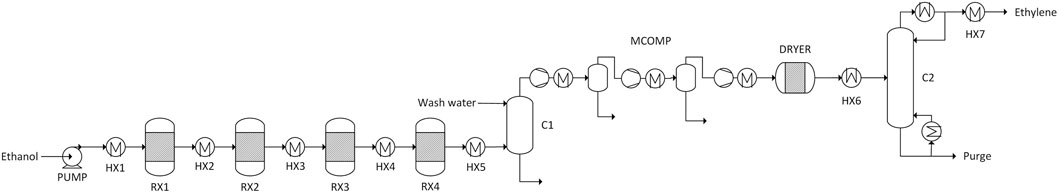
FIGURE 5. Flowsheet of the ethanol to ethylene process.
The Peng-Robinson (PENG-ROB) equation of state model is used except for the washing column where the ELEC-NRTL model was used. The PENG-ROB method is applicable for gas processing (Aspen Technology, 2013). Th ELEC-NRTL model is recommended for processes with electrolytes involved. The treated ethanol stream from the COR (94.6 wt.%) is pumped to 5 bar. In a series of four adiabatic reactors (RX1 to RX4) with interstage heating, the conversion of ethanol to ethylene is accomplished. The reactors contain an alumina-based catalyst. Coke formation is low in presence of water and conversion is above 99% (Morschbacker, 2009; Andrade Coutinho et al., 2013). The inlet temperature to the reactors is 450°C (Morschbacker, 2009). The reactors are modelled with RStoic reactors with a fixed yield distribution (Arvidsson and Lundin, 2011). Besides the main reaction of ethanol dehydration (Eq. 17), seven side reactions are considered according to reaction Eqs 18–24. The conversion in the reactor is adjusted to keep the temperature change between inlet and outlet of the reactor at 100°C (Andrade Coutinho et al., 2013). In the last reactor the outlet temperature is at 377°C. The overall conversion to ethanol is above 99%. The selectivity towards ethanol ends up at 97%, within the reported range of 95%–99% (Morschbacker, 2009).
After the last reactor, the stream is cooled to 40°C and washed in a column with water entering at 30°C. The column has five stages. Here, unreacted ethanol and other water soluble oxygenates are removed. The option to recycle ethanol to the reactor feed was not used due to the low concentration in the wash water. A caustic wash for the removal of carbon dioxide was not implemented since the carbon dioxide concentration in the washed gas stream is very low.
In the next step, the raw ethylene stream is compressed to 25 bar in a multistage compressor, with intercooling at 30°C and liquid knockout after each stage. The remaining water is removed by molecular sieve adsorption, modelled as an ideal split (Morschbacker, 2009). The stream has an ethylene purity of 98 mol% after this step. After precooling the ethylene stream to −10°C, it is further purified in a cryogenic rectification column with 20 stages (feed stage: 5), at distillate to feed ratio of 0.98 and reflux ratio of 2.44. The purity of ethylene is increased to 99.5 mol%. Ethylene and minor impurities from the top of the column are heated to 15°C to recover the low temperature energy. The bottom product, containing mostly 1-butene, is purged.
6 Results
6.1 Key performance indicators
Table 4 summarizes the carbon and energy efficiencies, and specific electrical energy consumption for ethylene production. Since the upstream process for the production of CO is similar for the scenario categories “G” and “C,” their carbon efficiencies are equal. For the gasification-based scenarios (G) the efficiency is lower compared to the combustion scenarios (C). This is mainly due to the syngas stream from the hydrogen separation (PSA) which is sent to combustion. The carbon efficiency of the COR process is equal for all scenarios, at 97%. For reference, the experimental carbon efficiency (single pass) towards C2+ products has been reported at 84% (Xia et al., 2021). The total carbon efficiency is therefore mainly influenced by the upstream process for CO production. Scenarios “C” show distinctly higher efficiencies compared to scenarios “G.” The carbon efficiency for scenarios “C” could be further increased by increasing the capture rate of the MEA scrubber. The impact of carbon losses in the ethanol to ethylene process on the overall carbon efficiency is minor since only a small portion of the overall carbon is treated in the ethanol to ethylene process with a carbon efficiency of 96%.
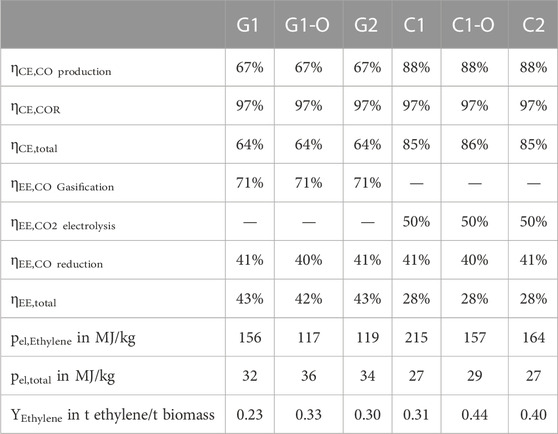
TABLE 4. Key performance indicators.
In contrast to carbon efficiency, the total energy efficiency is significantly higher for scenarios “G” compared to scenarios “C.” The total energy efficiency is also governed by the upstream process for CO production; the energy efficiency of CO production via gasification shows a higher efficiency compared to combustion.
The specific electrical energy demand shows a similar behavior for scenarios “C” and “G.” The scenarios “1” show higher specific energy demand compared to “1-O” and “2.” The electrical energy demand for scenarios “G” is significantly lower than for scenarios “C.” The results indicate that in terms of specific electrical energy demand, the scenarios “2” are in the similar range than scenario “1-O.” When assessing the electrical energy demand for the total mass of products, the picture changes. The scenarios “G” show a higher specific energy demand compared to scenarios “C.” This is due to the production of oxygen in the CO2 electrolysis which impacts immensely the total product mass flow.
The ethylene yield from biomass is generally higher for scenarios “C” compared to “G” due to the higher carbon efficiency of the process. Clearly, “1-O” scenarios, considering optimized ethylene yields from COR, show higher yields for ethylene compared to the other scenarios. The maximum yield of 0.44 t/t biomass is found in case “C1-O.” For reference, Li et al. (2022) report an ethylene yield of 0.30 t/t via first generation bio-ethanol. For second generation bio-ethanol the reported yield drops to 0.10 t/t and for gasification-based routes the yield ranges from 0.10 to 0.17 t/t (Li et al., 2022).
6.2 Mass balance
The mass balances for all process scenarios are given in Table 5. The biomass input is equal for all scenarios. The output of products is generally larger for the combustion-based route “C” compared to their equivalent gasification-based scenarios “G.” The annual ethylene production rate of ethylene ranges from 36.4 to 68.4 kt within the different scenarios.
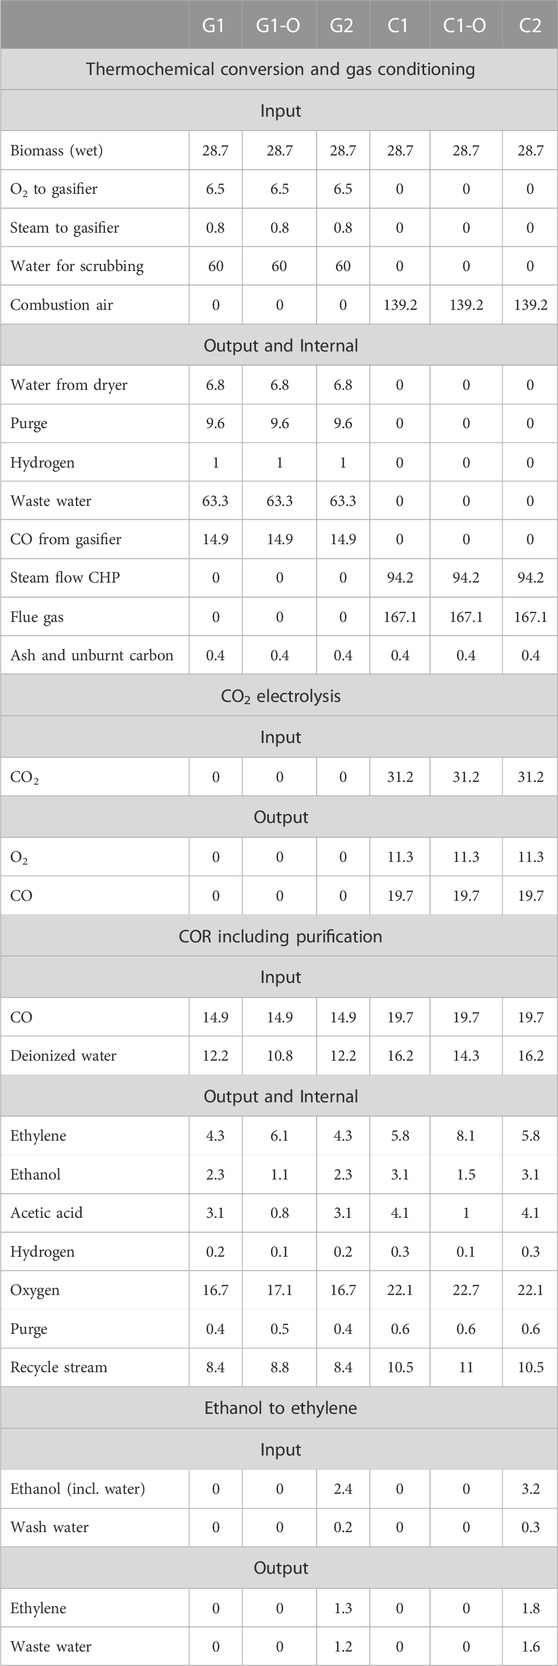
TABLE 5. Scenario mass balances in t/h.
The output of ash and unburnt carbon from combustion or gasification is equal in all scenarios. The scenarios “G” show a huge purge stream that is mostly responsible for the low carbon efficiency of the gasification process. The gasification process also releases a mass flow of 1 t/h H2. In the combustion case, the power plant flue gas consists of 20.7 wt.% CO2, 3.4 wt.% O2, 12.1 wt.% H2O, and 63.8 wt.% N2. The power plant generates 94.2 t of high-pressure steam per hour.
In the CO2 electrolysis, the CO2 is converted to CO and O2. The mass flow of CO in scenarios “G” is 14.9 t/h. In comparison, the CO flow for scenarios “C” is 33% higher, consequently leading to higher products mass flows. The CO stream (99.5 mol%) from CO2 electrolysis contains CO2 as the only impurity. The impurities for the CO stream from gasification (98.75 mol%) include CH4, N2, and CO2.
Since the electrochemical conversion of CO to products is not complete, unreacted CO together with impurities and gaseous products are recycled. The recycle stream is approximately 50% of the incoming raw material stream. The concentration of CO in the recycle streams is approximately 60 mol% and 46 mol% for scenarios “C” and “G,” respectively. Major impurities in scenario “G” are CH4 (22 mol%) and N2 (12 mol%); for “C,” it is CO2 with 18 mol%. The rest of the recycle stream consists of H2 and ethylene. The accumulation of impurities in the recycle stream shows that high purity CO as raw material is important to avoid large recycle streams. Alternatively, a higher purge fraction would be able to remove impurities, leading to loss of CO. Clearly, high per-pass conversion in COR would also reduce the recycle. In scenarios “1-O,” the production of ethylene increases, and the by-product streams decrease due to higher assumed ethylene selectivity in COR. Additionally, these scenarios show slightly larger recycle and purge streams due to a larger gas stream leaving the COR cell.
The global ethylene balance shows that compared to the scenarios “1,” the ethylene output is increased by 42% and 31% for scenarios “1-O” and “2.” All scenarios produce a tremendous amount of O2 from COR and CO2 electrolysis. In case of the gasification-based scenarios, oxygen is needed internally for gasification. Nevertheless, scenarios “G” produce more than 10 t/h of surplus oxygen. The O2 surplus for scenarios “C” is around 34 t/h. The amount of O2 in scenarios “C” would be sufficient for oxyfuel combustion in the power plant, which would avoid energy-intensive post-combustion CO2 capture. Hydrogen is produced in COR and the gasification process. The H2 output from gasification is significant, resulting in a clearly higher H2 output for scenarios “G.”
6.3 Energy balance
Table 6 shows the absolute values of energy flows for all scenarios. All cases are scaled to a biomass input of 100 MWth. The electrochemical reduction of CO is the major electricity consumer. Scenarios “1-O” have a higher electricity demand in COR since the reaction towards ethylene consumes more electrons compared to reactions to acetic acid and hydrogen. The electrical energy input in scenarios “C” is increased by the significant electricity demand of CO2 electrolysis.
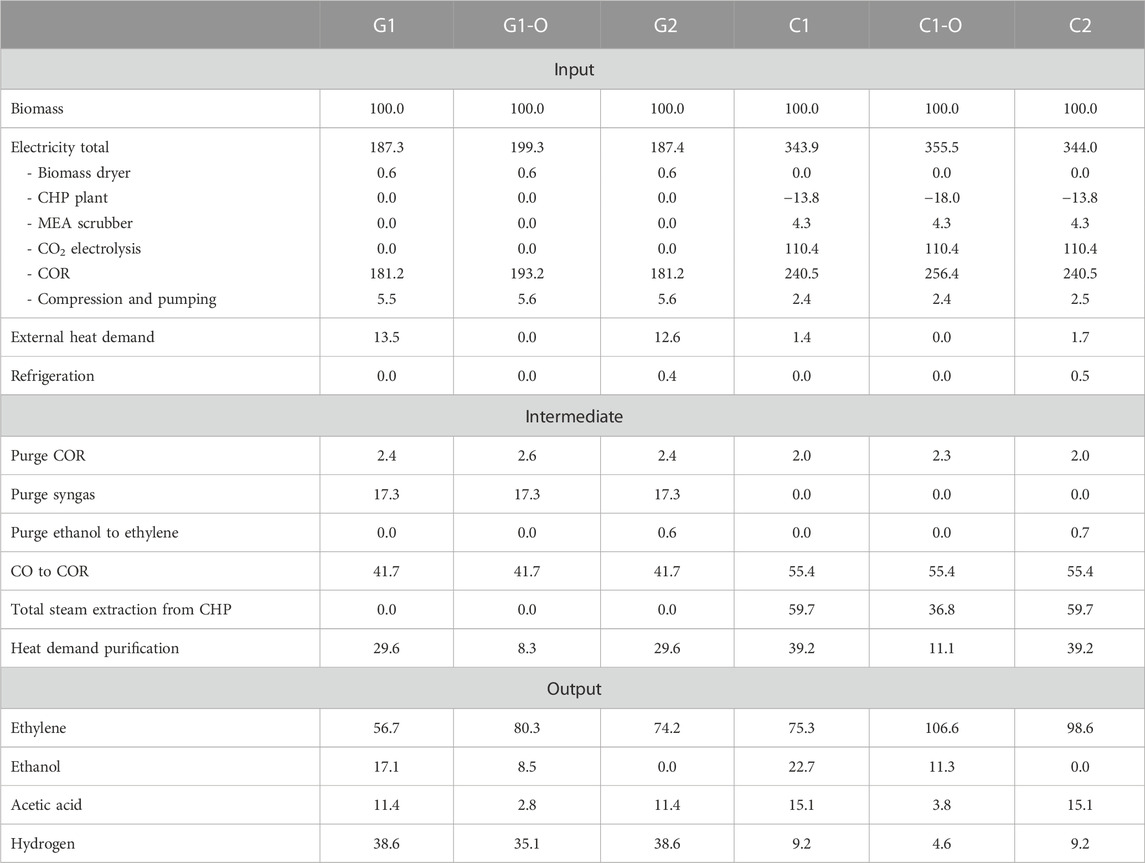
TABLE 6. Scenario energy balances in MW.
The electricity output from the CHP plant varies due to extraction of steam to supply heat to CO2 capture and other process stages. The CHP plant reaches an electrical energy efficiency of 26% in condensation mode, comparable to a reference range of 16%–36% (Lako et al., 2015). Steam extraction from a back pressure turbine results in a drop in the electrical efficiency. In scenarios “C1” and “C2,” all the steam after the first high pressure turbine is used for process heating. Nevertheless, additional process heat is needed for the overall process. The steam demand is lower for the “C1-O” case, resulting in a higher electrical energy output from the CHP plant. The higher electricity demand for compression and pumping in scenarios “G” arises from the gas compressors in the membrane and PSA gas separation steps. The ethanol to ethylene process included in scenarios “−2” requires refrigeration for the cryogenic distillation.
The purge streams from different process sections in scenarios “G” have a high thermal energy content, and are sufficient to supply heat to the reformer and the fired preheaters in the ethanol to ethylene process. The reformer thermal energy demand amounts to 9.3 MW. Surplus energy from purge streams is converted to steam at 250°C.
The CO streams supplied to the COR is higher in scenarios “C,” leading to increased electricity demand. In scenarios “G,” hydrogen production is increased by the hydrogen separated from the syngas stream. The decreased amount of by-products in cases “1-O” leads to a tremendous drop in heating demand for acetic acid and ethanol purification. This shows the importance of COR selectivity in terms of the overall process energy efficiency.
6.4 Heat integration
Pinch analysis was used to calculate the minimum external cooling and heating demand of the processes (Table 7). The corresponding composite curves are shown in the Supplementary Material. In order to reach the calculated targets, the heat exchanger networks would need to be designed and included, leading to additional capital costs; this was not considered in this paper. Additionally, the results represent the maximum heat integration which might be technically possible but probably not economically optimal. The heat for the MEA CO2 capture (scenarios “C”) is not explicitly incorporated in the heat integration since the energy demand is directly satisfied by low pressure steam from the CHP plant.
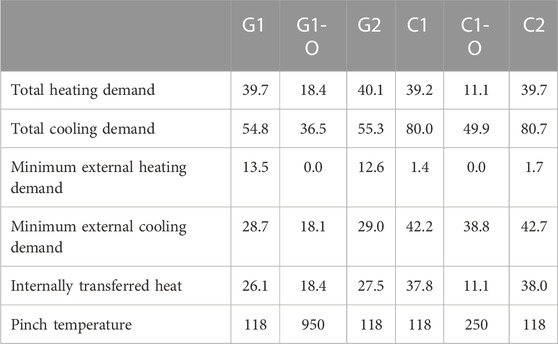
TABLE 7. Scenario heat balances following heat integration: heating and cooling demand (MW) and pinch temperature (°C).
In general, the cooling demand is tremendously higher than heating. Scenarios “1-O” show lower heating and cooling demands with decreased energy inputs to product separation. For these scenarios, no external heating is needed. 14 or 3 MW of low temperature heat for district heating (above 100°C) can be exported in scenarios “G1-O” and “C1-O,” respectively. The heating demand in scenarios “C1” and “C2” can essentially be covered by high pressure steam available from the first turbine stage of the CHP plant. In contrast, scenarios “G1” and “G2” require significant external heat inputs.
6.5 CO2 balance
The ultimate goal of the suggested process routes is to reduce CO2 emissions. The carbon intensity of the electricity used has the highest impact on the process CO2 balance. Figure 6 shows the specific CO2 emission as a function of carbon intensity of electricity input. The emission factors are presented for ethylene and key by-products, following emission allocation by product value. The horizontal lines show the CO2 emission factor for fossil-equivalent product. The vertical lines show the reference emission factor for hydro power, wind power and photovoltaics (PV). The intersection points of the horizontal reference line with the linear curves (scenarios) represent the marginal emission factor for electricity. At this point, the specific emissions of the fossil equivalent and the suggested scenario are equal. It is noted that the reference value, with location- and technology-based variation, influences the marginal emission factor. Details on the reference values and data on overall CO2 emissions for the scenarios are available in the Supplementary Material.
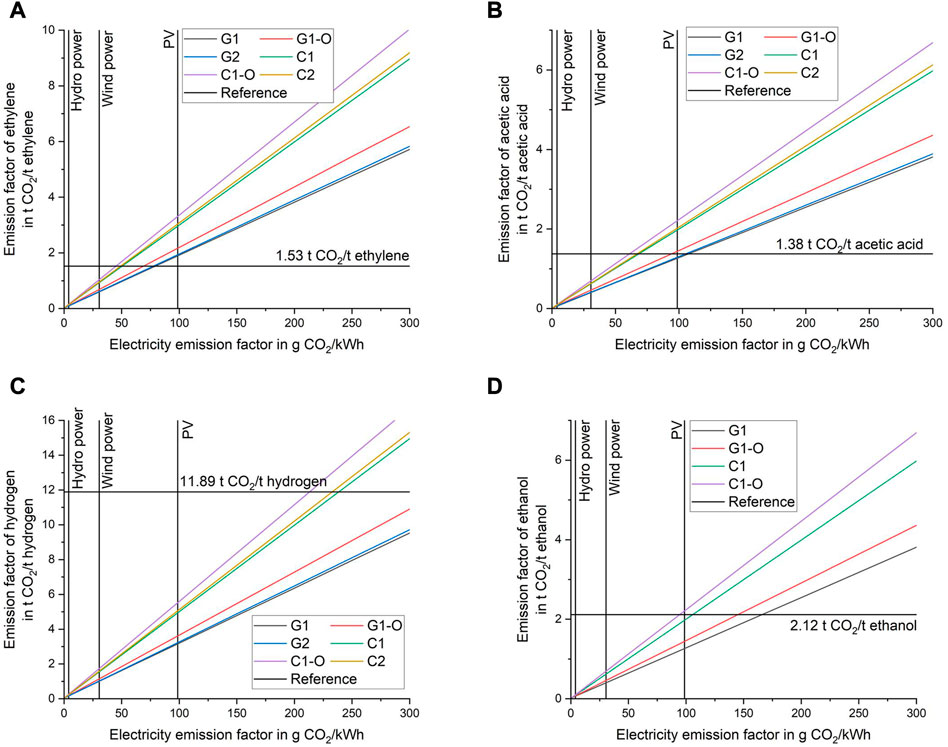
FIGURE 6. Impact of carbon intensity of electricity input on the CO2 emission factor of ethylene (A), acetic acid (B), hydrogen (C), and ethanol (D).
The marginal emission factors generally increase from ethylene, acetic acid, ethanol to hydrogen. For hydrogen it ranges from 213 to well above 300 g/kWh. In comparison, the emission factors for ethylene range from 45 to 79 g/kWh. The results show that the specific CO2 emissions for ethylene cannot be reduced compared to the fossil-equivalent using electricity from PV. Depending on the scenario, PV can reduce CO2 emissions (compared to fossil-equivalent) for acetic acid and ethanol. For hydrogen, the emission factor is reduced in all cases. Wind power can reduce CO2 emissions for all products and scenarios.
The combustion-based routes have lower marginal emission factors compared to the gasification-based routes. Thus, the emission reduction potential is higher for scenarios “G”. Furthermore, scenarios “1-O” with optimized selectivity towards ethylene are inferior in terms of emissions, meaning that improvements in selectivity are not improving the sustainability of the process. The reason is the higher electricity demand for these processes. The difference of CO2 emissions for scenarios 1 and 2 are marginal. External heat supply is not considered in the calculations. Fossil-based heat generation would diminish all benefits of the gasification-based route. In practice, the heat would likely be supplied by biomass combustion, which would result in a reduction in overall energy efficiency.
If wind power is exclusively used as power source, the emissions of ethylene can be decreased by 32%–60% compared to the reference emission factor. The highest reduction potential (55%–60%) is found for scenarios “G” (detailed values for all scenarios in the Supplementary Material). The highest reduction potential can be realized for hydrogen, at up to 92%. The lowest reduction potential for all products is found in the “1-O” cases.
The CO2 balances exclude process related emissions from the combustion of purge streams as they are on the basis of their biogenic origin. At the same time, any potential credits for long-term carbon storage in the products are not considered. As seen, the carbon efficiency of scenarios “C” is higher than that of scenarios “G.” Scenarios “C” emit around 4 t CO2/h, or 36 kt annually. The contribution of purge stream combustion is small compared to the CO2 released with the flue gas (following CO2 capture) from the CHP plant. For scenarios “G,” emissions are around 12 t CO2/h, or 100 kt annually. The highest share of emissions is released from the combustion of the syngas purge.
6.6 Economics
The absolute numbers of the economic assessment are shown in the Supplementary Material. The LCOE is broken down in Figure 7, accounting for by-product sales as credits. The category “Others” includes labor cost, refrigeration, heating and deionized water. Generally, scenarios “C” show higher cost compared to scenarios “G.” Compared to current market prices, the LCOE is six to three-fold higher, respectively. The highest impacts arise from the annuity of investment and the electricity price. The impact of by-product revenue is the largest for scenarios “−1”. The impact of biomass, CO2, and Others are marginal compared to the other cost categories.
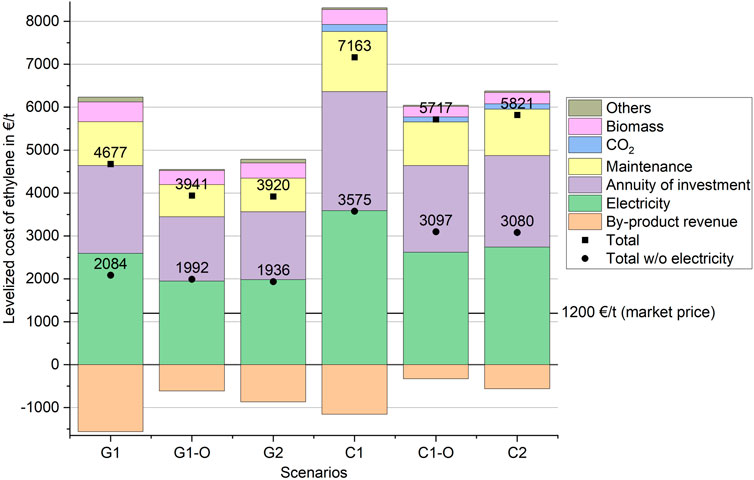
FIGURE 7. LCOE broken down into the main cost categories, the square dot represents the total LCOE and the round dot shows the LCOE leaving out the cost for electricity (data available in Supplementary Material as table).
The economics are dominated by the operating costs, accounting for 67% and 66% of the total annual production costs for scenarios “G” and “C,” respectively. The total fixed capital investment for combustion-based routes (approximately 1.4 billion €) are almost twice of those for the gasification-based routes. This is partly due to higher productivity of scenarios “C,” leading to larger equipment sizes. On the other hand, special cost drivers are CO2 electrolysis (installed cost 221 M€) and the slightly higher cost of the CHP plant in comparison to the gasifier. The installed cost of the electrochemical CO reduction accounts for roughly 85% or 60% of the total capital costs in scenarios “G” and “C,” respectively. The share of CO2 electrolysis is 28% in scenarios “C.” Therefore, cost reductions in COR and CO2 electrolysis can have a significant impact on the CAPEX for the suggested process routes. Electricity accounts for 62%–65% of the operating cost. The second largest share is maintenance at roughly 25%. The impact of biomass cost is higher in scenarios “G” (11%) compared to “C” (6%).
“G1” and “C1” show the highest revenue from by-products. By-product revenues for scenarios “G” are higher compared to the equivalent scenarios “C” due to hydrogen output from the gasification process. Ethanol and acetic acid make up for 77%–87% of the total by-product revenue. Oxygen has a share of below 3% for scenarios “G” but is more significant (5%–13%) in “C” due to higher oxygen production and no internal oxygen demand. By-product revenues are obviously reduced in the cases “1-O” with improved ethylene yields. The LCOE between scenarios “C1-O” and “C2” (or, “G1-O” and “G2”) are similar, showing that improving the ethylene yield in the COR process is not clearly superior in terms of economics compared to the process routes with ethanol dehydration. The scenarios “G1” and “C1,” at lowest overall ethylene yields, show the highest LCOE. Thus, maximizing the ethylene output seems to be favorable in terms of the economics.
Since the electricity price has a big impact on the product price, Figure 7 also shows the total product price excluding cost for electricity. Even at free electricity, no scenario is able to reach the current market price of ethylene. An improved yield of the COR process or the conversion of ethanol to ethylene lower the levelized cost of ethylene for both scenarios “C” and “G.” Since the CO2 electrolysis and COR process show lower technological maturity, cost savings are possible in future. For the CO2 electrolysis lower investment cost are expected (see Supplementary Material). A lower operating voltage would decrease the electricity demand and consequently the operating cost of the COR process. Higher current densities and lower module cost (in €/m2) can lower the investment cost of the COR process.
6.6.1 Sensitivity analysis
The tornado diagrams in Figure 8 show the results of the sensitivity analysis. The highest influence on LCOE comes from the electricity cost. The impact of electricity on the absolute LCOE is more pronounced in scenarios “C” due to the higher specific electricity input.
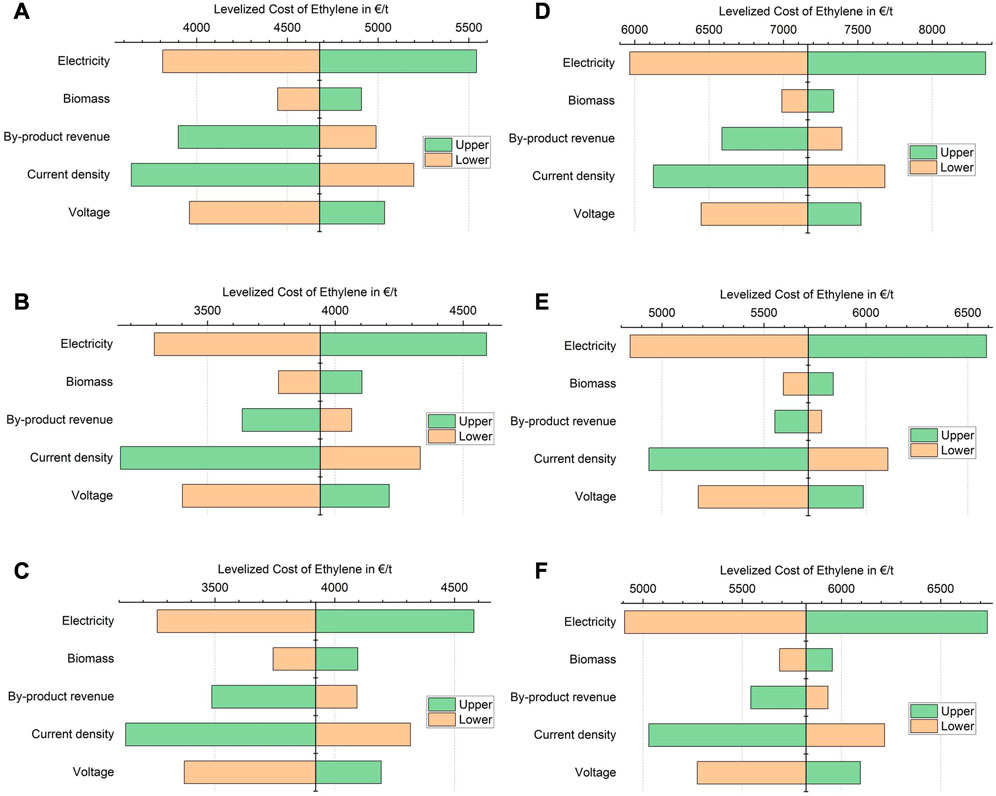
FIGURE 8. Impact of input parameters on the LCOE for G1 (A), G1-O (B), G2 (C), C1 (D), C1-O (E), and C2 (F) (Electricity price: Base: 60 €/MWh, Lower: 40 €/MWh, Upper: 80 €/MWh/Biomass price: Base: 20 €/MWh Lower: 10 €/MWh Upper: 30 €/MWh/Revenue from side products: Base: 100% Lower: −20% Upper: +50%/Current density of COR: Base: 300 mA/cm2, Lower: 250 mA/cm2, Upper: 500 mA/cm2/Voltage of COR: Base: 3, 5 V, Lower: 2, 5 V, Upper: 4 V).
Since the COR process has a low technological readiness level, the cost assumptions are early estimates with high uncertainty. Therefore, the sensitivity of LCOE (via changes in both investment and operating costs) on the current density and operating voltage of the COR process was assessed. Favorable operating voltage can reduce the LCOE by up to 10% or 15% for scenarios “C” and “G,” respectively. Increasing the current density shows a reduction of LCOE by 14% or above 20%, respectively.
By-product (as well as main product) revenues could be increased with potential green premiums over fossil-equivalent prices. In general, the impact of revenue from by-products is higher for scenarios “G” in comparison to scenarios “C.” For scenarios “−2”, the impact of increased by-product revenues is smaller compared to “1,” since ethanol is not sold but converted to ethylene. The impact of changes in biomass cost are generally not very significant but can exceed the effect of by-product revenues in some of the cases. For comparison, Ramdin et al. (2021) found by-product and electricity prices to be the most influential parameters in the two step CO2R process, while current density showed only a small impact.
The sensitivity analysis shows that with the improvement of one variable current market prices cannot be reached. Therefore, a combination of several parameters at advantageous values needs to be realized to reach better economics. As shown in Figure 7, the lowest LCOE at free electricity is at 1936 €/t for scenario “G2.” Therefore, reductions in electricity cost alone are not sufficient to make the processes competitive under present conditions and assumptions. Due to the low maturity, significant reductions in COR capital and operating costs could feasibly take place, improving the competitiveness compared to established process routes.
In order to determine the economic competitiveness with current market prices for ethylene, a multiparametric analysis was used to determine economic conditions under which the process can become more economically competitive to current market prices. The detailed LCOE for all scenarios can be found in the Supplementary Material. However, in all cases of multiparametric analysis, the LCOE of the gasification-based route stays well below the combustion-based routes.
An increased current density (500 mA/cm2), lower operating voltage (2,5 V) and reduced module cost of the electrochemical CO reduction (15,000 €/m2) can lower the operating and investment cost of the COR process. The LCOE can be reduced to 2,829 €/t for “G2.” If also the electricity price is lowered (40 €/MWh), lowest cost are found for “G2” (1803 €/t). With an increased revenue from by-products (+50%), the LCOE drops further to 1,130 to 1,552 €/t for scenarios “G” which is in the range of current market prices. The LCOE for scenarios “C” are in the range of 3,174–3,485 €/t.
To test the scenarios “C” for competitiveness with scenarios “G,” the investment cost of CO2 electrolysis was lowered to 300 €/kW and an electricity price of 40 €/MWh was assumed. Scenarios “C” benefit from these economic conditions due to the impact of investment cost of CO2 electrolysis and higher specific electrical energy demand. The LCOE is between 4,226 and 5,091 €/t for scenarios “C.” The LCOE for scenarios “G” ranges from 3,259 to 3,813 €/t which is still lower compared to the figures reported for scenarios “C.” Scenarios “C” are even with beneficial economic assumptions not cost competitive compared to scenarios “G”.
For a lower electricity price (20 €/MWh) and higher revenue from by-products (100%), the scenarios “G” are close to current market prices (1,392–2030 €/t). LCOE for scenarios “C” are still well above market prices (3,437–3,644 €/t).
7 Discussion
The integration of COR with biomass gasification process showed interesting features in comparison to the combustion based processes. Future research can focus on finding more suitable CO sources for the process like blast furnace gases.
7.1 Impact of by-products
The process design is based on a simplified product spectrum limited to ethylene, ethanol, acetic acid, hydrogen, and oxygen. Since the COR process is at an early development stage, the process is not fully understood yet and further development is needed to make the process technically feasible. The purpose of this study is therefore to stipulate future developments for efficiency and economic improvement, and to develop possible business cases for the technology.
The presence of more products, specifically at lower concentrations, will make the product purification more complex. Some studies (Table 2) consider ethylene as the only product which is very unrealistic and underestimates the effort for product purification. Besides capital expenditures, the heating and cooling demand of the purification processes should not be underestimated. To simplify downstream processing, increasing the selectivity of catalysts to selectively form the desired products will be of extreme importance for commercialization. For example, the presence of 1-propanol causes the issue of forming an azeotrope with water, further increasing the complexity of separation (Wu et al., 2020).
7.2 CO2 emissions
Comparing the CO2 emissions to published estimates on CO2R/COR processes or other renewable routes (such as OCM or MTO) is difficult due to different boundaries and assumptions. Figure 6 showed that for ethylene, the indirect emissions from consumed electricity are very significant. In contrast, the other products can have higher emission factors for electricity to be competitive with the fossil-equivalent product. The CO2 emissions for ethylene via CO2R/COR range from −17 to 16 t CO2eq/t ethylene (Table 2). The wide range of variation underlines the point that relevant comparisons are difficult.
Layritz et al. (2021) investigated the electrified OCM process in comparison to conventional production routes. The results showed that emissions of 0.8 t CO2/t ethylene (value read from diagram) can be achieved, at electricity emission factor of 0.1 t CO2/MWh. Based on this study, at this emission factor, the specific emissions for ethylene double for the best case (Figure 6). Liptow et al. (2013) report fossil CO2 emissions for ethylene from wood fermentation, sugarcane fermentation and gasification (via MTO) of 1.3, 1, and 0.6 t CO2eq/t ethylene. Only the present scenarios “G1” and “G2” can compete with the estimate for gasification-based system, when using electricity from wind power.
7.3 Product price
The production cost estimates obtained here are well above the highest cost presented in other studies (Table 2). The lower reference values are largely due to more favorable economic assumptions, for instance lower cell voltages, no side product formation, and reduced electricity price (e.g., $20/MWh) (Sisler et al., 2021). The electricity cost assumed in this study (60 €/MWh) necessarily leads to high overall production costs due to high share of electricity in total cost.
In comparison to other upcoming technologies, reference estimates are in a similar range to our results. The OCM process was estimated to yield ethylene cost of roughly 5,000 €/t for the year 2020, decreasing to roughly 4,200 €/t in 2050 (Layritz et al., 2021). For the CO2 and H2 based process via methanol synthesis and MTO, the ethylene cost was estimated within the range of 2,160–2,910 €/t, depending on the electricity price (Ioannou et al., 2020). The gasification-based MTO was estimated to give an ethylene cost of 920 €/t (Li et al., 2022). For other processes, based on either fermentation or gasification coupled with ethanol dehydration, costs have been estimated from 712 to 1,876 €/t (Li et al., 2022).
The presented process in this paper is especially economically favorable for smaller plant sizes. Since the investment cost of the electrochemical processes (water electrolysis and COR) are scaled linearly with plant size, the process does not profit from economy of scale. Similarly, the OCM process and MTO process both involving water electrolysis and CO2 hydrogenation suffer from the same constraint. However, the MTO process based on another sustainable source of methanol will be more competitive in larger scales due the economy of scale.
7.4 Conversion of acetic acid to ethylene
In order to further increase the ethylene yield, acetic acid can be hydrogenated to ethanol with subsequent conversion to ethylene. Hydrogenation of acetic acid has been demonstrated experimentally (Rakshit et al., 2020) and a simplified process model was developed in a previous publication (Melin et al., 2022). Based on the model results, ethylene production can be increased by 0.3–1.8 t/h (depending on the scenario) with acetic acid converted to ethylene via ethanol (see Supplementary Material for the calculations). Hydrogen for acetic acid hydrogenation could be provided internally within all of the scenarios, except for “C1” and “C2.” The base ethylene yield for the scenarios, in the range of 0.23–0.44 t ethylene per t biomass, could be improved to the range of 0.31–0.50 t/t (highest for “C2”) with the additional conversion of acetic acid.
8 Conclusion
The paper presented the electrified conversion of biomass to mostly C2 products, with comparison of alternative process configurations and scenarios. Main products of the process are ethylene (36–68 kt/a), ethanol, acetic acid and hydrogen. The biomass is thermochemically converted (gasification or combustion) and resulting CO is converted by electrochemical reduction. The main conclusions are:
- The mass-based ethylene yield per biomass input varies from 0.23 to 0.44 t ethylene/t biomass. Highest yields in each process route are reached for scenarios “1-O” considering optimized ethylene yield in electrochemical conversion of CO.
- Higher ethylene selectivity shows the advantage of reduced energy demand for by-product separation. The corresponding scenarios “G1-O” and “C1-O” are self-sufficient in heat and can export district heating if needed. All other scenarios need external heat supply. The need for gasification-based scenarios is higher compared to the combustion-based equivalents.
- Compared to fossil-equivalent products, reduction of CO2 specific emissions is possible for all scenarios and products if using wind electricity. Use of solar electricity allows emission reductions in some scenarios only. Combustion-based routes have lower marginal emission factors than gasification-based routes, and thus require a lower electricity emission factor for emission reductions.
- In terms of carbon efficiency (CE), the combustion-based scenarios are superior. The CE can be even further increased by an improved carbon capture ratio from flue gas. The gasification-based routes suffer from a low carbon efficiency of the CO production process arising from purging a fraction of the syngas stream.
- The overall energy efficiency of the gasification-based processes is significantly higher resulting from a higher energy efficiency of the CO production process.
- The levelized cost of ethylene (LCOE) ranges between 3,920 and 7,163 €/t. The lowest costs are achieved for the gasification-based routes. For both the gasification and combustion-based routes, the scenarios with improved yield towards ethylene are economically more favorable.
- The LCOE is very sensitive to the electricity price and current density of the COR process. Due to higher electricity consumption, the impact of electricity cost is more severe for combustion-based scenarios. Assuming free electricity, the lowest LCOE would be 1936 €/t via gasification.
- The further conversion of ethanol to ethylene was considered to increase the overall ethylene yield. The impact of the added conversion on the overall carbon and energy efficiency is marginal. The resulting LCOE was found similar to the scenarios that assuming increased ethylene selectivity in electrochemical CO conversion.
The paper showed a very promising and novel route for the conversion of biomass to ethylene and by-products. The gasification-based routes shows advantages in terms of economics and energy efficiency compared to the conventional route (two-step process with CO2 as feedstock) which is extensively discussed in literature. Furthermore, the conversion of ethanol to ethylene for improving the overall ethylene yield is competitive with an optimized COR process for higher ethylene yields. Thus, yield improvements of the COR process seem non-essential for commercialization. Therefore, the gasification-based route should be exploited further in this context. Especially, specific experimental studies following the gasification-based route are needed to further develop and tailor the COR process to the route.
Data availability statement
The original contributions presented in the study are included in the article/Supplementary Material, further inquiries can be directed to the corresponding author.
Author contributions
DK developed the research idea and conceptualized the work. DK, HN, and KM performed the Aspen modelling. DK and HN performed data analysis and calculations. DK wrote the original draft of the manuscript with help from HN. DK, HN, KM, AL, and TK reviewed and edited the manuscript. AL and TK supervised the work. DK managed the project work.
Funding
KM gratefully acknowledges funding from Business Finland Innovation Funding through the Forest Industry Carbon Dioxide Utilization for Materials and Plastics Forest CUMP project. HN acknowledges the funding received from the P2XEnable project primarily funded by Business Finland. The funding received from the HYGCEL project, primarily funded by Business Finland, is acknowledged by AL.
Conflict of interest
The authors declare that the research was conducted in the absence of any commercial or financial relationships that could be construed as a potential conflict of interest.
Publisher’s note
All claims expressed in this article are solely those of the authors and do not necessarily represent those of their affiliated organizations, or those of the publisher, the editors and the reviewers. Any product that may be evaluated in this article, or claim that may be made by its manufacturer, is not guaranteed or endorsed by the publisher.
Supplementary material
The Supplementary Material for this article can be found online at: https://www.frontiersin.org/articles/10.3389/fenrg.2023.1129076/full#supplementary-material
References
Ahn, H., Luberti, M., Liu, Z., and Brandani, S. (2013). Process configuration studies of the amine capture process for coal-fired power plants. Int. J. Greenh. Gas Control 16, 29–40. doi:10.1016/j.ijggc.2013.03.002
Alerte, T., Edwards, J. P., Gabardo, C. M., O’Brien, C. P., Gaona, A., Wicks, J., et al. (2021). Downstream of the CO 2 electrolyzer: Assessing the energy intensity of product separation. ACS Energy Lett. 6, 4405–4412. doi:10.1021/acsenergylett.1c02263
Amghizar, I., Vandewalle, L. A., van Geem, K. M., and Marin, G. B. (2017). New trends in olefin production. Engineering 3, 171–178. doi:10.1016/J.ENG.2017.02.006
Andrade Coutinho, P. L. de, Morita, A. T., Cassinelli, L. F., Morschbacker, A., and Werneck Do Carmo, R. (2013). “Braskem's ethanol to polyethylene process development,” in Catalytic process development for renewable materials. Editors P. Imhof, and J. C. van der Waal (Wiley), Hoboken, NJ, USA, 149–165.
Arvidsson, M., and Lundin, B. (September, 2011). Process integration study of a biorefinery producing ethylene from lignocellulosic feedstock for a chemical cluster. 6th Dubrovnik Conference on Sustainable Development of Energy, Water and Environment Systems, Dubrovnik, Croatia.
Aspen Technology, (2013). Aspen physical property system - physical property method. Cambridge, MA: Aspen Technology.
Bachman, J. E., Reed, D. A., Kapelewski, M. T., Chachra, G., Jonnavittula, D., Radaelli, G., et al. (2018). Enabling alternative ethylene production through its selective adsorption in the metal–organic framework Mn 2 (m -dobdc). Energy Environ. Sci. 11, 2423–2431. doi:10.1039/C8EE01332B
Barecka, M. H., Ager, J. W., and Lapkin, A. A. (2021). Economically viable CO 2 electroreduction embedded within ethylene oxide manufacturing. Energy Environ. Sci. 14, 1530–1543. doi:10.1039/D0EE03310C
Basf, Linde, and Sabic, (2022). BASF, SABIC and Linde start construction of the world’s first demonstration plant for large-scale electrically heated steam cracker furnaces. https://www.basf.com/global/en/media/news-releases/2022/09/p-22-326.html (Accessed October 06, 2022).
Beiron, J., Normann, F., and Johnsson, F. (2022). A techno-economic assessment of CO2 capture in biomass and waste-fired combined heat and power plants – a Swedish case study. Int. J. Greenh. Gas Control 118, 103684. doi:10.1016/j.ijggc.2022.103684
Bioplastics, European (2022). Bioplastics market data. https://www.european-bioplastics.org/market/(Accessed October 20, 2022).
Blass, S. D., Hermann, R. J., Persson, N. E., Bhan, A., and Schmidt, L. D. (2014). Conversion of glycerol to light olefins and gasoline precursors. Appl. Catal. A General 475, 10–15. doi:10.1016/j.apcata.2014.01.013
Bui, M., Adjiman, C. S., Bardow, A., Anthony, E. J., Boston, A., Brown, S., et al. (2018). Carbon capture and storage (CCS): The way forward. Energy Environ. Sci. 11, 1062–1176. doi:10.1039/C7EE02342A
Butera, G., Jensen, S. H., Ahrenfeldt, J., and Clausen, L. R. (2021). Techno-economic analysis of methanol production units coupling solid oxide cells and thermochemical biomass conversion via the TwoStage gasifier. Fuel Process. Technol. 215, 106718. doi:10.1016/j.fuproc.2020.106718
Chernyak, S. A., Corda, M., Dath, J.-P., Ordomsky, V. V., and Khodakov, A. Y. (2022). Light olefin synthesis from a diversity of renewable and fossil feedstocks: State-of the-art and outlook. Chem. Soc. Rev. 51, 7994–8044. doi:10.1039/D1CS01036K
Chen, Y.-H., Hsieh, W., Chang, H., and Ho, C.-D. (2022). Design and economic analysis of industrial-scale methanol-to-olefins plants. J. Taiwan Inst. Chem. Eng. 130, 103893. doi:10.1016/j.jtice.2021.05.040
Coolbrook, (2022). Coolbrook. https://coolbrook.com/(Accessed October 06, 2022).
Dinh, C.-T., Li, Y. C., and Sargent, E. H. (2019). Boosting the single-pass conversion for renewable chemical electrosynthesis. Joule 3, 13–15. doi:10.1016/j.joule.2018.10.021
Eckert, C., Xu, W., Xiong, W., Lynch, S., Ungerer, J., Tao, L., et al. (2014). Ethylene-forming enzyme and bioethylene production. Biotechnol. Biofuels 7, 33. doi:10.1186/1754-6834-7-33
EcoCatalytic, (2022). Innovative technologies for the fuels of the future. https://bio2electric.com/(Accessed October 19, 2022).
Eryazici, I., Ramesh, N., and Villa, C. (2021). Electrification of the chemical industry—Materials innovations for a lower carbon future. MRS Bull. 46, 1197–1204. doi:10.1557/s43577-021-00243-9
Fan, D., Dai, D.-J., and Wu, H.-S. (2012). Ethylene Formation by catalytic dehydration of ethanol with industrial considerations. Mater. (Basel) 6, 101–115. doi:10.3390/ma6010101
Fu, X., Zhang, J., and Kang, Y. (2021). Electrochemical reduction of CO 2 towards multi-carbon products via a two-step process. React. Chem. Eng. 6, 612–628. doi:10.1039/D1RE00001B
Gao, Y., Neal, L., Ding, D., Wu, W., Baroi, C., Gaffney, A. M., et al. (2019). Recent advances in intensified ethylene production—a review. ACS Catal. 9, 8592–8621. doi:10.1021/acscatal.9b02922
Gayubo, A. G., Valle, B., Aguayo, A. T., Olazar, M., and Bilbao, J. (2010). Olefin production by catalytic transformation of crude bio-oil in a two-step process. Ind. Eng. Chem. Res. 49, 123–131. doi:10.1021/ie901204n
Gogate, M. R. (2019). Methanol-to-olefins process technology: Current status and future prospects. Petroleum Sci. Technol. 37, 559–565. doi:10.1080/10916466.2018.1555589
Greenblatt, J. B., Miller, D. J., Ager, J. W., Houle, F. A., and Sharp, I. D. (2018). The technical and energetic challenges of separating (Photo)Electrochemical carbon dioxide reduction products. Joule 2, 381–420. doi:10.1016/j.joule.2018.01.014
Hannula, I. (2015). Co-production of synthetic fuels and district heat from biomass residues, carbon dioxide and electricity: Performance and cost analysis. Biomass Bioenergy 74, 26–46. doi:10.1016/j.biombioe.2015.01.006
Haribal, V. P., Chen, Y., Neal, L., and Li, F. (2018). Intensification of ethylene production from naphtha via a redox oxy-cracking scheme: Process simulations and analysis. Engineering 4, 714–721. doi:10.1016/j.eng.2018.08.001
Hsu, C. S., and Robinson, P. R. (2017). Springer handbook of petroleum technology. Berlin, Germany: Springer International Publishing.
Ieaghg, (2019). Towards zero emissions CCS in power plants using higher capture rates or biomass. https://ieaghg.org/publications/technical-reports/reports-list/9-technical-reports/951-2019-02-towards-zero-emissions (Accessed October 12, 2022).
Ioannou, I., D'Angelo, S. C., Martín, A. J., Pérez-Ramírez, J., and Guillén-Gosálbez, G. (2020). Hybridization of fossil- and CO2 -based routes for ethylene production using renewable energy. ChemSusChem 13, 6370–6380. doi:10.1002/cssc.202001312
Irena, (2013). Production of bio-ethylene - technology brief. https://irena.org/-/media/Files/IRENA/Agency/Publication/2013/IRENA-ETSAP-Tech-Brief-I13-Production_of_Bio-ethylene.pdf.
Jamil, F., Aslam, M., Al-Muhtaseb, A. H., Bokhari, A., Rafiq, S., Khan, Z., et al. (2022). Greener and sustainable production of bioethylene from bioethanol: Current status, opportunities and perspectives. Rev. Chem. Eng. 38, 185–207. doi:10.1515/revce-2019-0026
Jäppinen, E., Korpinen, O.-J., Laitila, J., Ranta, T., et al. (2014). Greenhouse gas emissions of forest bioenergy supply and utilization in Finland. Renewable Sustainable Energy Rev. 29 (2), 369–382. doi:10.1016/j.rser.2013.08.101
Ji, Y., Guan, A., and Zheng, G. (2022). Copper-based catalysts for electrochemical carbon monoxide reduction. Cell Rep. Phys. Sci. 3, 101072. doi:10.1016/j.xcrp.2022.101072
Jouny, M., Hutchings, G. S., and Jiao, F. (2019). Carbon monoxide electroreduction as an emerging platform for carbon utilization. Nat. Catal. 2, 1062–1070. doi:10.1038/s41929-019-0388-2
Jouny, M., Luc, W., and Jiao, F. (2018a). General techno-economic analysis of CO 2 electrolysis systems. Ind. Eng. Chem. Res. 57, 2165–2177. doi:10.1021/acs.iecr.7b03514
Jouny, M., Luc, W., and Jiao, F. (2018b). High-rate electroreduction of carbon monoxide to multi-carbon products. Nat. Catal. 1, 748–755. doi:10.1038/s41929-018-0133-2
Kearns, D., Liu, H., and Consoli, C. (2021). Technology readiness and costs of CCS. Docklands, Australia: Global CCS Institute. Available at: https://www.globalccsinstitute.com/wp-content/uploads/2021/03/Technology-Readiness-and-Costs-for-CCS-2021-1.pdf. (Accessed October 12, 2022).
Khojasteh Salkuyeh, Y., and Adams, T. A. (2015). A novel polygeneration process to co-produce ethylene and electricity from shale gas with zero CO2 emissions via methane oxidative coupling. Energy Convers. Manag. 92, 406–420. doi:10.1016/j.enconman.2014.12.081
Kibria Nabil, S., McCoy, S., and Kibria, M. G. (2021). Comparative life cycle assessment of electrochemical upgrading of CO 2 to fuels and feedstocks. Green Chem. 23, 867–880. doi:10.1039/D0GC02831B
Kolesnichenko, N. V., Goryainova, T. I., Biryukova, E. N., Yashina, O. V., and Khadzhiev, S. N. (2011). Synthesis of lower olefins from dimethyl ether in the presence of zeolite catalysts modified with rhodium compounds. Pet. Chem. 51, 55–60. doi:10.1134/S0965544111010105
Kolesnichenko, N. V., Ezhova, N. N., and Snatenkova, Y. M. (2020). Lower olefins from methane: Recent advances. Russ. Chem. Rev. 89, 191–224. doi:10.1070/RCR4900
Kosaric, N., Duvnjak, Z., Farkas, A., Sahm, H., Bringer-Meyer, S., Goebel, O., et al. (2010). Ullmann's encyclopedia of industrial chemistry. Weinheim, Germany: Wiley online library: Wiley-VCH, 1–72.Ethanol
Kuckshinrichs, W., and Hake, J.-F. (2015). Carbon capture, storage and use. New York, NY, USA: Springer International Publishing.
Küngas, R., Blennow, P., Heiredal-Clausen, T., Holt, T., Rass-Hansen, J., Primdahl, S., et al. (2017). eCOs - a Commercial CO 2 Electrolysis System Developed by Haldor Topsoe. ECS Trans. 78, 2879–2884. doi:10.1149/07801.2879ecst
Küngas, R. (2020). Review—electrochemical CO 2 reduction for CO production: Comparison of low- and high-temperature electrolysis technologies. J. Electrochem. Soc. 167, 044508. doi:10.1149/1945-7111/ab7099
Lako, P., Koyama, M., and Nakada, S. (2015). Biomass for heat and power - technology brief. https://www.irena.org/-/media/Files/IRENA/Agency/Publication/2015/IRENA-ETSAP_Tech_Brief_E05_Biomass-for-Heat-and-Power.pdf (Accessed October 05, 2022).
Layritz, L. S., Dolganova, I., Finkbeiner, M., Luderer, G., Penteado, A. T., Ueckerdt, F., et al. (2021). The potential of direct steam cracker electrification and carbon capture & utilization via oxidative coupling of methane as decarbonization strategies for ethylene production. Appl. Energy 296, 117049. doi:10.1016/j.apenergy.2021.117049
Legrand, U., Apfel, U.-P., Boffito, D. C., and Tavares, J. R. (2020). The effect of flue gas contaminants on the CO2 electroreduction to formic acid. J. CO2 Util. 42, 101315. doi:10.1016/j.jcou.2020.101315
Li, F., Ding, S., Wang, Z., Li, Z., Li, L., Gao, C., et al. (2018). Production of light olefins from catalytic cracking bio-oil model compounds over La 2 O 3 -modified ZSM-5 zeolite. Energy fuels. 32, 5910–5922. doi:10.1021/acs.energyfuels.7b04150
Li, H., Zhang, S., Zhou, J., Wang, Z., Zhao, X., and Qiu, T. (2022). Toward carbon-neutral ethylene production: Assessment of the application potential of b io-ethylene production pathways in China. Biofuels Bioprod. Bioref 16, 1568–1582. doi:10.1002/bbb.2406
Li, W., Feaster, J. T., Akhade, S. A., Davis, J. T., Wong, A. A., Beck, V. A., et al. (2021). Comparative techno-economic and life cycle analysis of water oxidation and hydrogen oxidation at the anode in a CO 2 electrolysis to ethylene system. ACS Sustain. Chem. Eng. 9, 14678–14689. doi:10.1021/acssuschemeng.1c01846
Linde, (2022). Linde EDHOX ethylene technology. https://www.linde-engineering.com/en/images/52222_LE_Petrochemicals_EDHOX_flyer_2021_DIN_A4_RZ_VIEW_tcm19-609833.pdf (Accessed October 06, 2022).
Liptow, C., Tillman, A.-M., Janssen, M., Wallberg, O., and Taylor, G. A. (2013). Ethylene based on woody biomass—what are environmental key issues of a possible future Swedish production on industrial scale. Int. J. Life Cycle Assess 18 (5), S. 1071–1081. doi:10.1007/s11367-013-0564-6
Liu, K., Song, C., and Subramani, V. (2009). Hydrogen and syngas production and purification technologies. Hoboken, NJ, USA: John Wiley & Sons, Inc.
Liu, Y., Kamata, H., Ohara, H., Izumi, Y., Ong, D. S. W., Chang, J., et al. (2020). Low-olefin production process based on fischer–tropsch synthesis: Process synthesis, optimization, and techno-economic analysis. Ind. Eng. Chem. Res. 59, 8728–8739. doi:10.1021/acs.iecr.0c00542
Luc, W., Ko, B. H., Kattel, S., Li, S., Su, D., Chen, J. G., et al. (2019). SO2-Induced selectivity change in CO2 electroreduction. J. Am. Chem. Soc. 141, 9902–9909. doi:10.1021/jacs.9b03215
Melin, K., Nieminen, H., Klüh, D., Laari, A., Koiranen, T., and Gaderer, M. (2022). Techno-economic evaluation of novel hybrid biomass and electricity-based ethanol fuel production. Front. Energy Res. 10. doi:10.3389/fenrg.2022.796104
Mohsenzadeh, A., Zamani, A., and Taherzadeh, M. J. (2017). Bioethylene production from ethanol: A review and techno-economical evaluation. ChemBioEng Rev. 4, 75–91. doi:10.1002/cben.201600025
Morschbacker, A. (2009). Bio-ethanol based ethylene. Polym. Rev. 49, 79–84. doi:10.1080/15583720902834791
Mynko, O., Amghizar, I., Brown, D. J., Chen, L., Marin, G. B., Alvarenga, R. F. de, et al. (2022). Reducing CO2 emissions of existing ethylene plants: Evaluation of different revamp strategies to reduce global CO2 emission by 100 million tonnes. J. Clean. Prod. 362, 132127. doi:10.1016/j.jclepro.2022.132127
Na, J., Seo, B., Kim, J., Lee, C. W., Lee, H., Hwang, Y. J., et al. (2019). General technoeconomic analysis for electrochemical coproduction coupling carbon dioxide reduction with organic oxidation. Nat. Commun. 10, 5193. doi:10.1038/s41467-019-12744-y
Najari, S., Saeidi, S., Concepcion, P., Dionysiou, D. D., Bhargava, S. K., Lee, A. F., et al. (2021). Oxidative dehydrogenation of ethane: Catalytic and mechanistic aspects and future trends. Chem. Soc. Rev. 50, 4564–4605. doi:10.1039/d0cs01518k
Ozden, A., Wang, Y., Li, F., Luo, M., Sisler, J., Thevenon, A., et al. (2021). Cascade CO2 electroreduction enables efficient carbonate-free production of ethylene. Joule 5, 706–719. doi:10.1016/j.joule.2021.01.007
Pan, X., Jiao, F., Miao, D., and Bao, X. (2021). Oxide-zeolite-based composite catalyst concept that enables syngas chemistry beyond fischer-tropsch synthesis. Chem. Rev. 121, 6588–6609. doi:10.1021/acs.chemrev.0c01012
Pappijn, C. A. (2020). Challenges and opportunities of carbon capture and utilization: Electrochemical conversion of CO2 to ethylene, Front. Energy Res., 8.
Plastics Europe, (2021). Plastics -The facts 2021. https://plasticseurope.org/wp-content/uploads/2021/12/Plastics-the-Facts-2021-web-final.pdf (Accessed October 20, 2022).
Putta, K. R., Pandey, U., Gavrilovic, L., Rout, K. R., Rytter, E., Blekkan, E. A., et al. (2022). Optimal renewable energy distribution between gasifier and electrolyzer for syngas generation in a power and biomass-to-liquid fuel process. Front. Energy Res. 9. doi:10.3389/fenrg.2021.758149
Pyl, S. P., Dijkmans, T., Antonykutty, J. M., Reyniers, M.-F., Harlin, A., van Geem, K. M., et al. (2012). Wood-derived olefins by steam cracking of hydrodeoxygenated tall oils. Bioresour. Technol. 126, 48–55. doi:10.1016/j.biortech.2012.09.037
Pyl, S. P., Schietekat, C. M., Reyniers, M.-F., Abhari, R., Marin, G. B., and van Geem, K. M. (2011). Biomass to olefins: Cracking of renewable naphtha. Chem. Eng. J. 176-177, 178–187. doi:10.1016/j.cej.2011.04.062
Qiao, J., Liu, Y., Hong, F., and Zhang, J. (2014). A review of catalysts for the electroreduction of carbon dioxide to produce low-carbon fuels. Chem. Soc. Rev. 43, 631–675. doi:10.1039/c3cs60323g
Rakshit, P. K., Pathak, S., Voolapalli, R. K., and Upadhyayula, S. (2020). Thermodynamic analysis, kinetics modeling, and reactor model development for acetic acid hydrogenation reaction over bimetallic Pt–Sn catalyst. Energy fuels. 34, 3640–3648. doi:10.1021/acs.energyfuels.9b04070
Ramdin, M., Mot, B. de, Morrison, A. R. T., Breugelmans, T., van den Broeke, L. J. P., Trusler, J. P. M., et al. (2021). Electroreduction of CO2/CO to C2 products: Process modeling, downstream separation, system integration, and economic analysis. Ind. Eng. Chem. Res. 60, 17862–17880. doi:10.1021/acs.iecr.1c03592
Ren, T., Patel, M., and Blok, K. (2006). Olefins from conventional and heavy feedstocks: Energy use in steam cracking and alternative processes. Energy 31, 425–451. doi:10.1016/j.energy.2005.04.001
Ripatti, D. S., Veltman, T. R., and Kanan, M. W. (2019). Carbon monoxide gas diffusion electrolysis that produces concentrated C2 products with high single-pass conversion. Joule 3, 240–256. doi:10.1016/j.joule.2018.10.007
Roh, K., Bardow, A., Bongartz, D., Burre, J., Chung, W., Deutz, S., et al. (2020). Early-stage evaluation of emerging CO 2 utilization technologies at low technology readiness levels. Green Chem. 22, 3842–3859. doi:10.1039/c9gc04440j
Romero Cuellar, N. S., Scherer, C., Kaçkar, B., Eisenreich, W., Huber, C., Wiesner-Fleischer, K., et al. (2020). Two-step electrochemical reduction of CO2 towards multi-carbon products at high current densities. J. CO2 Util. 36, 263–275. doi:10.1016/j.jcou.2019.10.016
Saito, H., and Sekine, Y. (2020). Catalytic conversion of ethane to valuable products through non-oxidative dehydrogenation and dehydroaromatization. RSC Adv. 10, 21427–21453. doi:10.1039/d0ra03365k
Schneider, V., and Frölich, P. K. (1931). Mechanism of formation of aromatics from lower paraffins. Industrial Eng. Chem. 23, 1405–1410. doi:10.1021/ie50264a023
Shin, H., Hansen, K. U., and Jiao, F. (2021). Techno-economic assessment of low-temperature carbon dioxide electrolysis. Nat. Sustain 4, 911–919. doi:10.1038/s41893-021-00739-x
Siemens, A. G. (2018). Siemens steam turbine SST-300. https://assets.siemens-energy.com/siemens/assets/api/uuid:07137baa-e796-4876-b99b-8a056835cb3e/sst-300-interactivepraes.pdf (Accessed October 12, 2022).
Simell, P., Hannula, I., Tuomi, S., Nieminen, M., Kurkela, E., Hiltunen, I., et al. (2014). Clean syngas from biomass—Process development and concept assessment. Biomass Conv. bioref. 4, 357–370. doi:10.1007/s13399-014-0121-y
Sisler, J., Khan, S., Ip, A. H., Schreiber, M. W., Jaffer, S. A., Bobicki, E. R., et al. (2021). Ethylene electrosynthesis: A comparative techno-economic analysis of alkaline vs membrane electrode assembly vs CO 2 –CO–C 2 H 4 tandems. ACS Energy Lett. 6, 997–1002. doi:10.1021/acsenergylett.0c02633
Spallina, V., Velarde, I. C., Jimenez, J. A. M., Godini, H. R., Gallucci, F., and van Sint Annaland, M. (2017). Techno-economic assessment of different routes for olefins production through the oxidative coupling of methane (OCM): Advances in benchmark technologies. Energy Convers. Manag. 154, 244–261. doi:10.1016/j.enconman.2017.10.061
Spliethoff, H. (2010). Power generation from solid fuels. Berlin, Heidelberg: Springer Berlin Heidelberg.
Statista, (2022). Annual production of plastics worldwide from 1950 to 2020. https://www.statista.com/statistics/282732/global-production-of-plastics-since-1950/ (Accessed October 20, 2022).
St. Teuner, C., Neumann, P., and Linde, F. von (2001). CO through CO2 reforming - the calcor standard and calcor economy processes. OIL Gas. Eur. Mag., 44–46.
Sturman, M., and Oelgemöller, M. (2021). Process parameters in the electrochemical reduction of carbon dioxide to ethylene. ChemBioEng Rev. 8, 149–188. doi:10.1002/cben.202100004
Sypox, (2022). Sypox. https://www.sypox.eu/ (Accessed October 06, 2022).
Topsoe, Haldor (2020). Tailored to your business - eCOs™. https://www.topsoe.com/processes/carbon-monoxide (Accessed September 20, 2021).
Tran, N.-H., Duong, H. P., Rousse, G., Zanna, S., Schreiber, M. W., and Fontecave, M. (2022). Selective ethylene production from CO2 and CO reduction via engineering membrane electrode assembly with porous dendritic copper oxide. ACS Appl. Mater Interfaces 14, 31933–31941. doi:10.1021/acsami.2c06068
van Zandvoort, I., van der Waal, J. K., Ras, E.-J., Graaf, R. de, and Krishna, R. (2019). Highlighting non-idealities in C2H4/CO2 mixture adsorption in 5A zeolite. Sep. Purif. Technol. 227, 115730. doi:10.1016/j.seppur.2019.115730
Vega, F., Baena-Moreno, F. M., Gallego Fernández, L. M., Portillo, E., Navarrete, B., and Zhang, Z. (2020). Current status of CO2 chemical absorption research applied to CCS: Towards full deployment at industrial scale. Appl. Energy 260, 114313. doi:10.1016/j.apenergy.2019.114313
Voldsund, M., Gardarsdottir, S., Lena, E. de, Pérez-Calvo, J.-F., Jamali, A., Berstad, D., et al. (2019). Comparison of technologies for CO2 capture from cement production—Part 1: Technical evaluation. Energies 12, 559. doi:10.3390/en12030559
Wilson, J., Gering, S., Pinard, J., Lucas, R., and Briggs, B. R. (2018). Bio-production of gaseous alkenes: Ethylene, isoprene, isobutene. Biotechnol. Biofuels 11, 234. doi:10.1186/s13068-018-1230-9
Wu, Y., Meng, D., Yao, D., Liu, X., Xu, Y., Zhu, Z., et al. (2020). Mechanism analysis, economic optimization, and environmental assessment of hybrid extractive distillation–pervaporation processes for dehydration of n -propanol. ACS Sustain. Chem. Eng. 8, 4561–4571. doi:10.1021/acssuschemeng.0c00263
Wu, C.-Y., and Wu, H.-S (2017). Ethylene formation from ethanol dehydration using ZSM-5 catalyst. ACS omega 2 (8), S. 4287–4296. doi:10.1021/acsomega.7b00680
Xia, R., Lv, J.-J., Ma, X., and Jiao, F. (2021). Enhanced multi-carbon selectivity via CO electroreduction approach. J. Catal. 398, 185–191. doi:10.1016/j.jcat.2021.03.034
Xia, R., Overa, S., and Jiao, F. (2022). Emerging electrochemical processes to decarbonize the chemical industry. JACS Au 2, 1054–1070. doi:10.1021/jacsau.2c00138
Yu, B.-Y., and Chien, I.-L. (2016). Design and optimization of the methanol-to-olefin process. Part I: Steady-state design and optimization. Chem. Eng. Technol. 39, 2293–2303. doi:10.1002/ceat.201500654
Yue, P., Fu, Q., Li, J., Zhu, X., and Liao, Q. (2022). Comparative life cycle and economic assessments of various value-added chemicals' production via electrochemical CO 2 reduction. Green Chem. 24, 2927–2936. doi:10.1039/d1gc04270j
Zakaria, Z. Y., Amin, N. A. S., and Linnekoski, J. (2013). A perspective on catalytic conversion of glycerol to olefins. Biomass Bioenergy 55, 370–385. doi:10.1016/j.biombioe.2013.02.014
Zámostný, P., Bělohlav, Z., and Šmidrkal, J. (2012). Production of olefins via steam cracking of vegetable oils. Resour. Conservation Recycl. 59, 47–51. doi:10.1016/j.resconrec.2011.03.007
Zhai, Y., Chiachiarelli, L., and Sridhar, N. (2009). Effect of gaseous impurities on the electrochemical reduction of CO 2 on copper electrodes. ECS Trans. 19, 1–13. doi:10.1149/1.3220175
Zhang, H., Li, J., Cheng, M.-J., and Lu, Q. (2019). CO electroreduction: Current development and understanding of Cu-based catalysts. ACS Catal. 9, 49–65. doi:10.1021/acscatal.8b03780
Zhang, M., and Yu, Y. (2013). Dehydration of ethanol to ethylene. Ind. Eng. Chem. Res. 52, 9505–9514. doi:10.1021/ie401157c
Zhao, Z., Jiang, J., and Wang, F. (2021). An economic analysis of twenty light olefin production pathways. J. Energy Chem. 56, 193–202. doi:10.1016/j.jechem.2020.04.021
Zhu, S., Jiang, B., Cai, W.-B., and Shao, M. (2017). Direct observation on reaction intermediates and the role of bicarbonate anions in CO2 electrochemical reduction reaction on Cu surfaces. J. Am. Chem. Soc. 139 (44), S. 15664–15667. doi:10.1021/jacs.7b10462
Zimmermann, H., and Walzl, R. (2010). “Ethylene,” in Ullmann's encyclopedia of industrial chemistry (Weinheim, Germany: Wiley online library: Wiley-VCH).
Glossary
AEM anion exchange membrane
CAPEX capital expenditure
CE carbon efficiency
CHP combined heat and power
CO carbon monoxide
CO2 carbon dioxide
CO2R electrochemical CO2 reduction
COR electrochemical CO reduction
CPP catalytic pyrolysis process
ECM electrochemical methane coupling
EE energy efficiency
FE Faraday efficiency
FTO Fischer Tropsch to olefin
GDE gas diffusion electrode
GTO glycerol to olefins
HOR hydrogen oxidation reaction
LCA life cycle assessment
LCOE levelized cost of ethylene
MCTO methyl chloride to olefins
MCTO methyl chloride to olefins
MEA monoethanolamine
MOI mobil olefins interconversion
MTO methanol-to-olefins
NCM non-oxidative coupling of methane
NPV net present value
OCM oxidative coupling of methane
OER oxygen evolution reaction
OPEX operating cost/expenditure
PBtX power-/biomass-to-X
PE polyethylene
PSA pressure swing adsorption
PV photovoltaics
TEA techno economic assessment
Nomenclature
Abbreviations
C cost, €/MWh or €/t
EF emission factor, t CO2/MWh or t CO2/t product
LCOE levelized cost of ethylene, €/t
LHV lower heating value, MJ/kg
m mass, kg
Pel electrical power, MW
pel specific electrical energy demand, MJ/kg
YEthylene ethylene yield, t ethylene/t biomass
Keywords: biomass gasification, ethylene, techno-economic, power-/biomass-to-X, electrification, electrochemical CO2 reduction, process simulation
Citation: Klüh D, Nieminen H, Melin K, Laari A and Koiranen T (2023) Assessment of electrified ethylene production via biomass gasification and electrochemical CO reduction. Front. Energy Res. 11:1129076. doi: 10.3389/fenrg.2023.1129076
Received: 21 December 2022; Accepted: 31 March 2023;
Published: 13 April 2023.
Edited by:
John Bøgild Hansen, Haldor Topsoe, DenmarkReviewed by:
Ali Bakhtyari, Shiraz University, IranBijoy Biswas, Auburn University, United States
Arnab Dutta, Birla Institute of Technology and Science, India
Marcin Sajdak, Silesian University of Technology, Poland
Copyright © 2023 Klüh, Nieminen, Melin, Laari and Koiranen. This is an open-access article distributed under the terms of the Creative Commons Attribution License (CC BY). The use, distribution or reproduction in other forums is permitted, provided the original author(s) and the copyright owner(s) are credited and that the original publication in this journal is cited, in accordance with accepted academic practice. No use, distribution or reproduction is permitted which does not comply with these terms.
*Correspondence: Daniel Klüh, ZGFuaWVsLmtsdWVoQHR1bS5kZQ==