 Boyu Qin
 Wen Shi
 Ruoquan Fang2
 Hongzhen Wang
- 1State Key Laboratory of Electrical Insulation and Power Equipment, Xi’an Jiaotong University, Xi’an, China
- 2Jiangsu Transportation Engineering Construction Bureau, Nanjing, China
High penetration of renewable energy is becoming an important development trend in new generation power system. However, frequent extreme weather events and fragile renewable energy sources pose a huge challenge to the power system resilience. As an important support technology of renewables, energy storage system is of great significance in improving the resilience of the power system. In this paper, a resilience enhancement method for power systems with high penetration of renewable energy based on underground energy storage systems (UESS) is proposed. Firstly, a resilience assessment model is established and the influence of extreme weather is quantified as the failure rate of power system components. Secondly, a bi-level optimization model for UESS operation and planning under extreme weather is built, and the life cycle of UESS is considered. Finally, taking the modified IEEE RTS-79 as an example, the optimal scheme for UESS configuration and operation is given, the investment and effectiveness of UESS is also analyzed. The results show that UESS can significantly enhance the power system resilience under extreme weather events.
1 Introduction
Climate change and energy issues are currently prominent global challenges (Breyer et al., 2022; Kim and Park, 2023). On the one hand, the depletion of fossil energy and the massive emission of greenhouse gases have exacerbated environmental pressure (Chen et al., 2020). On the other hand, frequent extreme weather has put forward higher requirements for energy supply security (Schweikert and Deinert, 2021). As an important part of the energy system, power system is responding to these challenges by promoting renewable energy utilization and power system transformation (Du et al., 2019; Yang et al., 2022). However, in the face of large-scale and destructive natural disasters, power system with high penetration of renewable energy is insufficient for the resistance and recovery due to their complex energy structure and high dependence on renewable energy resources (Ma et al., 2022). Therefore, it is of great significance to improve power system resilience against extreme weather events.
Natural disasters, malicious attacks, cascading failures and other internal and external threats are the main challenges to power system resilience. Extreme weather events have caused large blackouts and significant damage to grid, resulting in economic losses and prolonged outages (Bhusal et al., 2020; Plotnek and Slay, 2021). The research on power system resilience mainly focused on the following two aspects: resilience assessment and resilience enhancement (Huang et al., 2021a). The basic process of resilience assessment includes disaster data acquisition, disaster modeling, fault scenario selection and resilience index assessment (Sabouhi et al., 2020). The power system resilience assessment indices are divided into two categories: static and dynamic resilience assessment indices. Static resilience assessment index is established based on network topology, component redundancy and resource abundance. Bajpai et al. (2018) proposed a methodology to quantify resilience for power distribution system using graph theoretic approach and Choquet integral. Yang et al. (2018) developed a quantitative resilience assessment framework for power transmission systems operated under typhoon weather considering weather intensity and duration, fault location of components, restoration resources, and emergency response plans. Li et al. (2021) studied the local topological summaries derived under a framework of topological data analysis to assess the transmission grid resilience. Dynamic resilience index is formed based on the response process of the system to extreme events (Lu et al., 2018; Gasser et al., 2021), which is mainly build on the resilience curve in disaster response shown in Figure 1. The resilience curve can reflect the robustness and vulnerability of the system to a certain extent (Panteli et al., 2017). Luo et al. (2018) formulated a vulnerability curve of components and selected the weighted loss of loads as the assessment index of resilience. Bessani et al. (2019) developed a normalized resilience index to allow comparison between different systems. In terms of resilience enhancement, previous studies generally focus on the certain power system components or certain extreme events. Villamarin-jacome et al. (2022) provided a mixed-integer linear programming approach for investments in transmission lines and hardening of substations to increase the resilience of the power system under earthquake-related outage scenarios. Haces-Fernandez (2020) developed an undergrounding current transmission line as a long-term solution to the transmission line failures caused by wildfires in California. Kim and Dvorkin (2019) proposed a mobile energy storage unit to enhance flexible scheduling of energy storage and avoid the expected load shedding caused by disasters. However, these resilience enhancement does not consider both facility enhancement and operation control, which is necessary to consider the balance between cost of power grid retrofit and benefit of resilience improvement.
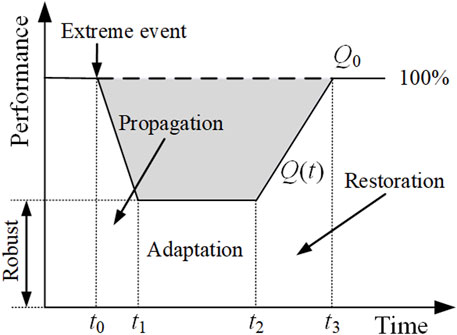
FIGURE 1. Power system resilience curve.
Several studies have investigated the resilience enhancement for power system with high penetration of renewable energy under extreme weather events. Wind and photovoltaic power generation, which are highly weather-dependent, hardly provide reliable power support and even cause fundamental damage to the power grid once shut down (Qin et al., 2022a). To make matters worse, extreme high or low temperature-induced reduction in transmission capacities coincides with higher electric demand on the system (Choobineh et al., 2019). With the bidirectional power characteristics and flexible adjustment ability, energy storage system plays an significant role in suppressing the output fluctuation of renewable energy, balancing the system electricity, and improving the stability and reliability of the power system (Qin et al., 2022b). Hutchinson et al. (2022) developed a resilience enhancement method for building-level electrical distribution systems with energy storage using the probability of outage survival curve. In a high penetration scenario for rooftop photovoltaic generation, Confrey et al. (2020) studied an architecture of energy storage system on the power grid for resilience to faults caused by extreme disturbance events. Khezri et al. (2022) developed resiliency-oriented optimal planning models for power grid with renewables and energy storage systems considering load interruption. Zhao et al. (2022) provided a review of the use of energy storage methods for black start services. Huang et al. (2021b) studied the role of energy storage as an available resource in enhancing the resilience of power systems with high penetrations of renewable energies under emergencies. Energy storage system plays an important role in improving the resilience of the power system with high penetration of renewable energy. However, energy storage system used in resilience enhancement suffers from several research gaps. First, the current energy storage configured for the power supply, grid and load is mainly used to respond to short-term demand, and it is insufficient to ensure stable power support for the duration of disasters which can take several days. Second, the energy storage system facilities are installed on the ground like other power facilities, and the structural and functional integrity of the energy storage system is still at great risk in extreme weather. Winter storms in 2021 had a significant impact on Texas, which disrupted the production of thermal and wind energy, damaged the power infrastructure, and cut off electricity to more than 3 million people (Wang et al., 2021; Yan et al., 2021). Therefore, it is imperative to build a reliable and safe energy storage system to cope with extreme weather events with long duration and great destructiveness.
Unlike overhead lines and wind farms, energy storage systems do not need large span and open space, so more efficient solutions should be considered. Underground space, a significant and abundant land resource with broad application prospects (Xia et al., 2022), can provide a novel solution for the planning and operation of energy storage systems. First, underground space can provide a stable and ample operation space for the energy storage system, protecting the devices from the impacts of extreme weather like rainstorms, typhoons, and blizzards (Zhang et al., 2021). Second, the stability of underground space can offer suitable and stable conditions for the energy storage system in terms of temperature and humidity (Yu et al., 2020), which can increase the energy storage system’s operation effectiveness and service life (Li et al., 2022). Third, underground space may decrease the effects of accidents, lessen damage to nearby facilities, and offer safety protection for the energy storage system in case of safety incidents (Zhang et al., 2021). Finally, development of underground space can save land resources above ground and make efficient use of space resources. This paper proposes the resilience enhancement using underground energy storage system (UESS) for power system with high penetration of renewable energy resources. The bi-level optimization model is proposed to obtain the optimal scheme of operation and planning. The main contributions are as follows:
1) A method of resilience enhancement of power system based on underground energy storage system is proposed. The natural protection and stability of underground space provide reliable power guarantee for power system in extreme weather.
2) An operation and planning model for UESS by considering the whole life cycle is established, where the costs are translated into each year.
3) The bi-level optimization method is formulated, and upper-lower correlation and linearization are performed for the solution.
The remainder of this paper is organized as follows. Section 2 studies the influence of extreme weather events on component failure rates, and establishes resilience assessment model. Section 3 proposes the operation model of UESS under extreme weather events. Section 4 develops the planning model of UESS. Section 5 formulates the bi-level optimization model and proposes the technique for solution. Section 6 presents the case study that quantifies the feasibility and effectiveness of UESS. Section 7 gives the conclusion of the research.
2 Extreme weather events modeling
In this section, a resilience model is described for power system under extreme weather events. First, a power system resilience assessment model is developed. Then, the failure rates of power system components are modeled to quantify the influence of extreme weather events on power system.
2.1 Resilience assessment model
A dynamic resilience assessment index is developed for assessing the ability of the power system to resist extreme events. The resilience curve for the power system in Figure 1 shows the performance following an extreme event. Under normal operation, the performance of the system can be expressed by
where
Resilience assessment index
2.2 Influence of extreme weather events
Extreme weather events affect power systems in many ways. Among them, overhead lines with wide span and fragile structure are highly vulnerable to damage and failure, which will result in forced load shedding of the whole system (Lian et al., 2023). Renewable energy is also highly dependent on weather conditions. However, different from normal weather, the failure rate of electric power equipment in extreme weather is higher and more difficult to properly quantify, mostly using historical data and statistical analysis (Bollen, 2001).
In the absence of historical data, the failure rate of overhead lines can be obtained by empirical formulas. Eqs 3, 4 are failure rate estimation formulas for overhead lines under ice coating and typhoon conditions, respectively (Wang et al., 2021).
where
It is clear from Eqs 3, 4 that extreme weather has a significant impact on overhead power lines. The failure rate of overhead lines will rapidly climb to 100% failure rate level once the rated ice thickness and wind speed are surpassed. Consequently, attention must be paid to the performance of overhead lines in extreme weather.
Different kind of extreme weathers have different influence mechanism on wind and photovoltaic generation equipment. For wind power generation equipment, the wind turbine blades are covered with ice due to the cold wave, resulting in the failure of normal operation. Under the typhoon, the excessive wind speed will also cause the shutdown to protect the power generation equipment. For photovoltaic power generation equipment, the photovoltaic panels are covered with snow for a long time in snowstorm, which makes it difficult to receive solar radiation. When the sandstorm comes, the irradiance decreases, and the photovoltaic output will also fluctuate and decline significantly. For instance, the wind turbine will cut off from the grid when wind speeds are below cut-in speed or above cut-out speed (Qin et al., 2019). The formula of wind generation output varying with wind speed is as follows.
where
where
Modeling approaches for photovoltaic power generation bear similarities to those employed for wind power. Typically, there exists a strong correlation between photovoltaic output and light intensity. During extreme weather events, the available light intensity frequently falls short of maintaining the rated power of photovoltaic systems. Under rated light intensity conditions, a linear relationship between light intensity and power is observed. Over a specified time period, light intensity is assumed to follow a Beta distribution, with its corresponding probability density function outlined below (Luo et al., 2021; Prakash and Meena, 2021).
In this context,
Where
3 Operation model for UESS
This section provides a detailed formulation of the optimization model to minimize operational costs and load shedding costs of power system. The operation of traditional generation units, renewable energy generations and UESS are considered as components in this model. In particular, battery energy storage can be configured more flexibly for power and capacity, and has sufficient performance to adapt to the operating environment of the power grid (Rouholamini et al., 2022). Therefore, UESS is modeled in the following according to the operating characteristics of battery energy storage.
3.1 Objective function for operation
Under extreme weather events, UESS collaborates with other components of the power system, balancing system power and consuming renewable energy. Furthermore, it can be considered that when the ground facilities of the power system suffer damage that cannot be restored in a short time, UESS can still provide power support for the loads in the system and reduce the loss of load shedding. Therefore, the operation costs considered are the unit generation cost, the penalty costs for curtailment of wind and solar, and the penalty costs of load shedding. The optimal daily operation cost of the system is expressed as follows.
where
3.2 Constraints for operation
The operation constraints should be fulfilled to maintain reliable operation of power system. In this paper, generation, renewables and UESS during dispatching are considered. These constraints are explained as follows.
(1) Power balance supply and demand of the system
Where
(2) DC power flow of the system
To avoid the nonlinear equations when solving a full AC power flow model, DC power flow is adopted to reduce the complexity to a set of linear equations. In DC power flow, the difference of node voltage and branch resistance are ignored (Yan et al., 2015). Voltage phase angle is also constrained, and the phase angle of slack node is set to 0.
Where
(3) Transmission capacity constraints
Where
(4) Upper and lower power generation limits
Where
(5) Climbing constraints for generators
Where
(6) Upper and lower power generation limits for wind and photovoltaic generation
Where
(7) Load shedding constraints
The above objectives and constraints complete the modeling of operation at the system level. The model takes the power flow equation as the core, and is developed with multi-node, multi-period and multi-device. In addition to system-level constraints, the energy storage system mentioned above is the main equipment for operation optimization. It also has more complex operation characteristics, and more detailed operation constraints need to be carried out.
(1) Upper and lower charging and discharging power limits for UESS
Where
(2) Power balance constraints for UESS
Where
(3) SOC constraints for UESS
The state of charge (SOC) represents the percentage of available capacity in the current battery that can be released under specified discharge conditions. The percentage of SOC status ranges from 0% to 100%. However, considering the chemical cell reaction characteristics: threshold boundary, static and dynamic differences, multiplication differences, estimation accuracy differences, etc., SOC estimation needs to set aside buffer intervals to ensure that the battery always works in a safe area.
Where
(4) Operation state constraints for UESS
Energy storage system can only be in one of the three states of charging, discharging, and not charging and discharging at each moment. The initial electricity storage and the last electricity storage should be equal to ensure that the energy storage system has the same control performance in the new dispatching cycle.
4 Planning model for UESS
Building on the operation model of UESS in Section 3, this section constructs a planning model to optimizes the configuration of UESS. The purchasing cost, building cost, maintenance cost and residual revenue of UESS are considered. The objective function of the planning model can be formulated as
where
(1) Purchasing cost
There are two parts of the purchasing cost: the initial purchasing cost and the replacement cost. The initial purchase cost is related to the capacity and power of the energy storage system. The capacity purchase cost includes the purchase, transportation and installation costs of energy storage batteries and capacity-related ancillary equipment. Power purchase cost includes energy storage converter and boost equipment. The replacement cost is related to the initial purchase cost and the replacement plan.
Where
(2) Building cost
The building cost includes land cost and architecture cost, which is one of the differences between UESS and ground energy storage system in cost. Generally, these costs are related to the energy storage capacity and can be approximately proportional.
Where
(3) Maintenance cost
The maintenance cost of UESS generally increases linearly with energy storage power and annual power generation, but the annual power generation is generally not easy to determine, so this part of the cost is approximately converted into energy storage power.
Where
(4) Residual revenue
After the end of the project execution cycle or the completion of a device replacement, the performance of UESS has not been completely exhausted, and this part will be deducted from the cost.
Where
To ensure the optimization results of energy storage capacity and power within a suitable range, the influence and restrictions of the UESS installation site and operation scenario must be considered, and the upper and lower limits of energy storage capacity and power configuration are stated as follows.
where
Base on the relation between operation and planning model, a bi-level optimization model is adopted to describe the collaborative optimization of UESS. The structure of the bi-level optimization model is shown in Figure 2. The upper model represents the planning, and establishes the objective function with the minimum annual investment cost. The lower model builds the optimal operation scheme of UESS, and establishes the objective function with the minimum daily operation cost considering the penalty of load shedding. The upper model passes the rated capacity and rated power of UESS to the lower model. The lower model uploads the daily operation cost to update the configuration of UESS. The collaborative optimization model can be defined as follows.
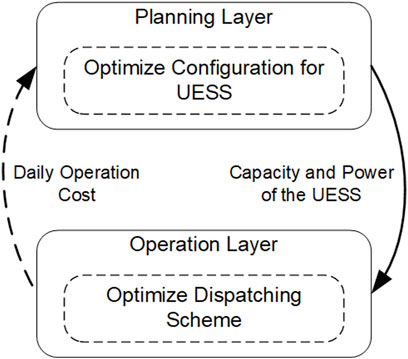
FIGURE 2. Structure of bi-level optimization model.
5 Solution technique
The bi-level optimization model is developed in Eq. 27 to address the issue of integrated planning and operation. The operational and planning layers are separately established in Sections 3, 4, necessitating parameter exchange between the upper and lower layers during the iterative cycle. This process can decrease the model’s solving efficiency or render it unsolvable (Ben-Ayed et al., 1988). To mitigate this issue, the first step involves consolidating the objective functions and decision variables of both layers into a single-layer model for more straightforward resolution. Subsequently, the transformed single-layer problem remains a nonlinear programming challenge, requiring the nonlinear component to be linearized to satisfy the requirements of the commercial solver.
5.1 Single-level transformation
Bilevel programming has been proved to be an NP-hard problem, and its transformation is necessary to solve it. The first step of transformation is to establish a relation of objective function and decision variables between the lower and upper model mathematically. According to the above analysis of the model, the rated capacity and rated power of UESS in the upper planning model are equivalent to the capacity and power limit parameters of the energy storage in the lower operating model, which can be expressed as follows.
After establishing the relationship between the upper model and the lower model, the model can be solved by the upper and lower interactive iteration method. However, this reciprocating iteration of the upper and lower parameters will reduce the efficiency of the solution, and a more efficient way is to merge into a single-layer programming. The obvious difference is that the time scale of the planning layer is year, and the day of the operating layer. The difference between the two can be unified by the following equation.
Where
For the planning layer, the objective function of the operation layer is one of its constraints, but considering that the optimization is carried out in the whole life cycle of the system, the cost of planning and operation is included in the total cost, and the total objective function is formed as follows.
Where
The lower layer parameters can be directly replaced by the upper model decision variables in the transformed model. In addition, the objective function of the operation layer is associated with the planning cost to form a new objective function. The transformed model can be equivalent as follow.
5.2 Linearized constraints
Even if the bi-level optimization model is transformed into a single layer, this model is still a nonlinear programming model. The nonlinearity is mainly reflected in two aspects: the quadratic term expression and the nonlinear logical constraints. Among them, the quadratic term can be expressed by the piecewise linearization method, and the nonlinear logic constraint can be transformed by the large M method.
When conducting the generation cost of the units in Eq. 9, the objective function contains a nonlinear item because the coal consumption of the generation units is a quadratic function about the output. The piecewise linearization method is used to convert the quadratic function into piecewise linear function. The generation cost of the units after processing can be expressed as follows.
where N is the number of segments.
Eqs 18, 20a are nonlinear logic constraints, which are determined by the charging and discharging characteristics of energy storage. Eq. 20a will be replaced by the following equations to linearize the charging and discharging constraints of energy storage.
where M is high penalty, always large positive number.
6 Case study
6.1 Case description
To verify the feasibility and effectiveness of UESS, a modified version of the IEEE Reliability Test System 1979 (RTS-79) shown in Figure 3 is used in this paper as a test case (Subcommittee, 1979). Starting from the RTS-79, renewables are added as follows. Three wind farms with maximum output of 200, 150, and 100 MW are located at bus 8, 19, and 21. Three photovoltaic fields with maximum output of 60, 100, and 150 MW are located at bus 4, 5, and 17. Daily output curves for each wind farm and photovoltaic field are shown in Figure 4. In order to establish a new balance between power source and load demand, the rated capacity of select units within the original system is decreased, with renewable energy sources compensating for the diminished output power. In the modified RTS79, the renewable energy share surpasses 20%, thus classifying the system as one characterized by high renewable energy penetration. The lithium iron phosphate batteries are adopted as the energy storage technology of UESS. It is assumed that the UESS has an initial SOC of 10% at the beginning of the dispatching cycle. The planning and operation parameters of UESS are shown in Table 1.
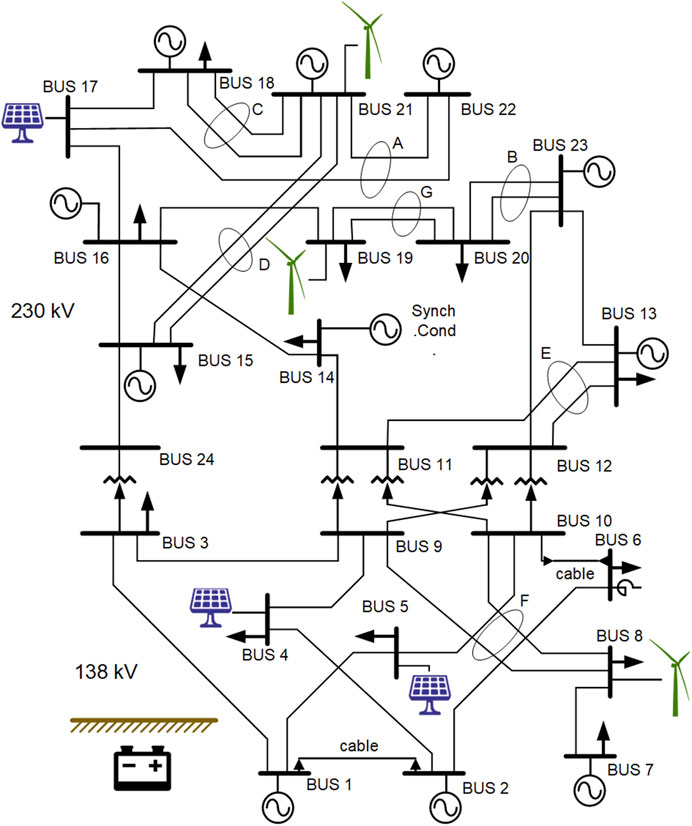
FIGURE 3. A modified version of RTS-79.
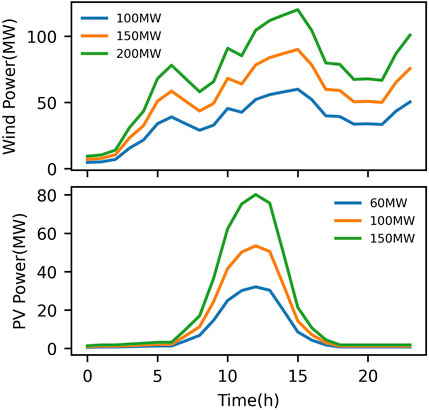
FIGURE 4. Daily output curves of renewables.
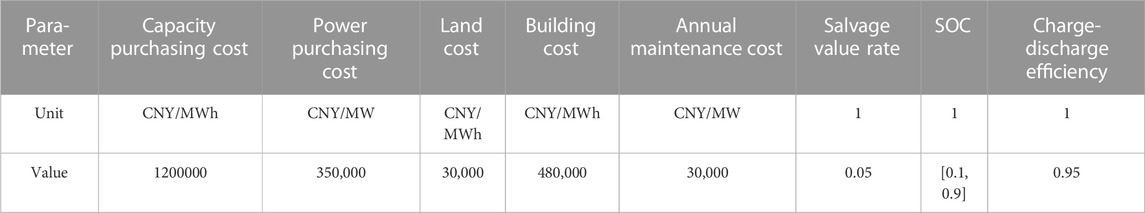
TABLE 1. Planning and operation parameters of UESS.
Under extreme weather events, the failure rates of power system components are calculated preliminary according to Eqs 3–8 and historical data. Different extreme weather events are considered, and the scenario set is formed in Table 2. The meteorological parameters of diverse extreme weather events, such as temperature and wind speed, serve as direct indicators of the severity of these conditions. Upon normalizing this data, the failure rates of overhead lines and renewable energy generation systems can be determined using empirical and probabilistic equations. To account for the distinct impacts of extreme weather on UESS, failure rates are estimated by referencing failure incidents from similar underground facilities. Although the calculated failure rates may not be precise, they primarily function to classify extreme weather events in order to demonstrate their varying effects within this study. It is assumed that failure rates are equal to the performance loss of the power system components.
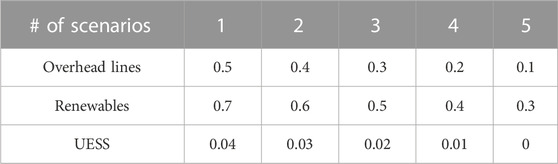
TABLE 2. Scenario set with failure rates.
In the optimization, the penalty coefficient for load shedding is FLS = 800 CNY/MWh, and the penalty coefficient for curtailment of wind and solar is Fab = 100 CNY/MWh. The determination of the aforementioned penalty coefficients embodies a particular inclination towards optimization problems, including a preference for renewable energy utilization and enhanced system resilience, which may not inherently possess market significance. The establishment of specific values necessitates referencing other parameters within the model, such as unit generation costs, energy storage configuration costs, which are contingent upon market pricing. The time period is set as 1 hour in operation. All simulations have been conducted using Gurobi 9.5.2 on Python 3.10.1 and the MIP gap is set at 0.01%.
6.2 Results and discussions
The collaborative optimization model in Eq. 29 is solved with one scenario from the scenario set in Table 2, i.e., λT = 0.30, λR = 0.50, λU = 0.02. The project life is set to 30 years, while the normal life of lithium iron phosphate battery is 15 years, that is, there will be a replacement in the middle of the project. The resulting investment decisions for UESS including sizing and siting are presented in Table 3. First, node 3, 4, and 18 were selected for UESS added to the grid, by following the sizing policy explained in Section 3. Second, with a share of more than 80%, the purchasing cost is the largest component of the investment. However, the purchasing cost is independent of whether the installation location is aboveground or underground. Finally, construction cost and maintenance cost account for a relatively small proportion of investment, although these costs of UESS are generally higher than those of the aboveground energy storage system.
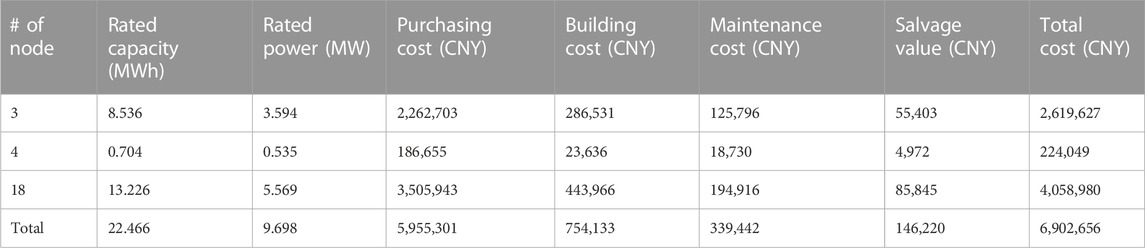
TABLE 3. Investment for UESS.
Over the 30 years of the project life, the annual expenditure for UESS will be 6,902,656 CNY. Following the defined penalty cost for load shedding, this expenditure will be covered assuming UESS supports all of the loads in RTS-79 for 3 h per year. In the case scenario of severe extreme weather, the planning results are economically acceptable. Considering the characteristics of various costs such as purchase, construction, and maintenance, the ground energy storage system does not have a strong advantage over UESS in terms of cost. Moreover, the contribution of UESS in consuming renewable energy, optimizing power quality and improving load characteristics is not included.
The case study considering operation of UESS is conducted following the scenario selected in investment for UESS. The daily operation state of UESS installed at nodes 3, 4. and 18 is shown in Figure 5. The battery power flow is positive when charging and negative when discharging, and the SOC of the battery changes accordingly. It can be seen that the charge-discharge power of the battery mainly jumps frequently in the rated charging power, 0 and rated discharge power, even during loops. This can be considered, on the one hand, UESS performs actively and plays a significant role in the operation of the system, on the other hand, the system still has a large demand for UESS. Therefore, the parameters are set conservatively, which is primarily caused by the cost of load shedding generated artificially and scenario setting, which will be further discussed at the end of this section.
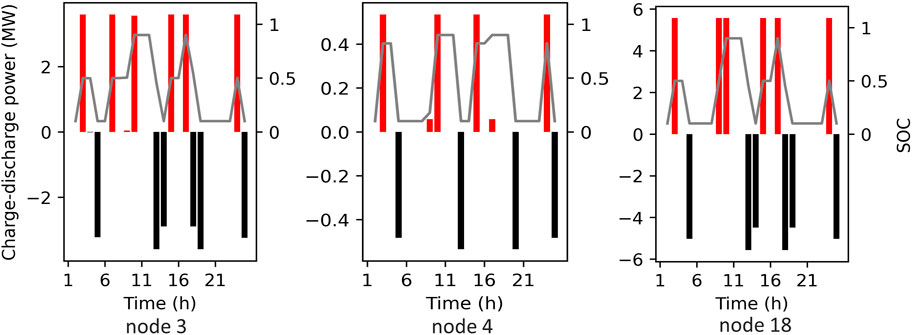
FIGURE 5. Daily operation of UESS at nodes 3, 4, and 18.
The primary benefits of UESS in extreme weather are to minimize the value of lost load and ensure power supply. It is essential to mention that although while UESS is distributed in each node, it serves the power system as a whole. Therefore, the mechanism of load shedding at each node should be examined. The resilience index developed in Eq. 2 can effectively indicate the value of lost load of the system, and Figure 6 displays the resilience and the value of lost load for each node. The resilience index, strictly, is used to evaluate the level of resilience for the entire system, but it can also be addressed for each node considered as a subsystem. As can be observed, there are 15 nodes without load shedding (including nodes without load), while node 13 has lost far more load than other nodes, and nodes 10 and 19 are the nodes with the most load lost among the other nodes. In order to further analyze the mechanisms of load shedding, the three nodes with the most value of lost load are selected to evaluate the load curve, as shown in Figure 7. As one can see, the peak of the load curve is where the load cutting periods are all located. The difference is that, during hours 17, 18, 19, and 20, node 13 totally failed to give sufficient power support for the load. Node 19 made load shedding in hours 17 and 19, and only about half of the load was removed in hour 19, while node 10 only lost the load in hour 19. The reason for this result can be analyzed as follow. After the 16th hour, the load reached to the second peak, but the units output remained stable, the renewables output was also relatively flat, and only the UESS installed at node 18 could provide temporary power support. In Figure 6, UESS at node 18 discharged continuously at a high power in hours 17 and 18 to supply the load at nodes 15, 16, 18, and 19. However, due to the limitation of energy storage capacity, there was no more discharge after the load curve dropped. After the 19th hour, the load at the aforementioned nodes all suffered similar degree of load shedding, but none experienced peak load shedding. It should be noticed that the UESS placed at node 3 has a lower capacity and power than node 18, and the load at node 3 also had a large value of lost load at peak, so the UESS at node 3 had little contributions to the power supply for other nodes during the peak.
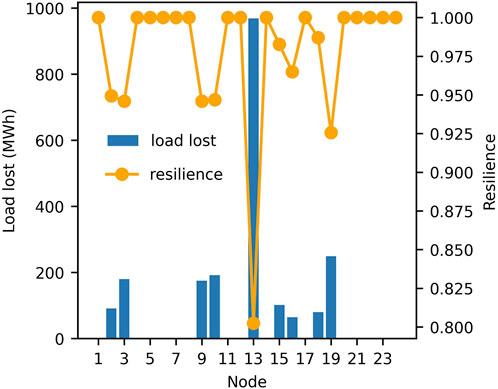
FIGURE 6. Resilience and load lost of each node.
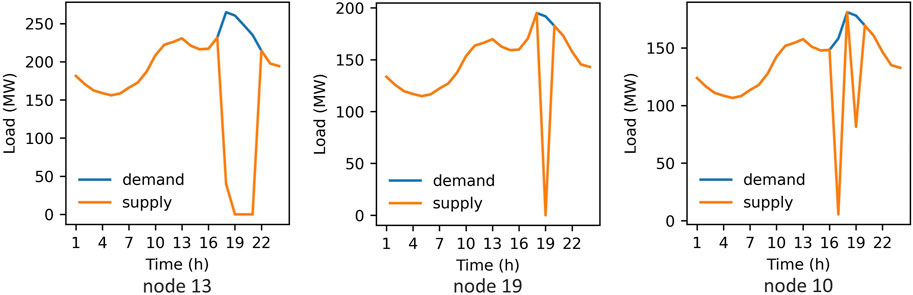
FIGURE 7. Load shedding at nodes 13, 19, and 10.
The implementation of the UESS not only enhances the reserve capacity of the power system, but also warrants attention to two critical points. Firstly, it establishes a defensive bottom line for the power system that is vulnerable to extreme weather conditions. Secondly, the flexible adjustment capacity of the UESS enables the system to dispatch limited resources to avoid severe losses. Since the modified RTS-79 system is connected to a high proportion of renewable energy, the optimal configuration of UESS should not solely prioritize resilience enhancement. Therefore, analyzing the results of sizing and siting from a singular perspective is difficult. However, it is evident that nodes equipped with UESS are profoundly affected by the volatility of renewable energy, resulting in a sharp decline in output during extreme weather events. These nodes are the weakest links in the system and are vital to maintaining system stability. By balancing the configuration requirements in normal and extreme scenarios, UESS can achieve a more economical and effective implementation plan.
Furthermore, the optimization objectives and resilience enhancements under different extreme weather scenarios are calculated and analyzed in Figure 8. In scenarios 1 to 5, the impact of extreme weather is decreasing, and the probability of occurrence is also increasing. The two cases of whether UESS is configured are also involved in the comparison. From the horizontal analysis, the worse the extreme weather, the greater the target value, and as the impact weakens, the target value also tends to be gentle, which is obvious: the system needs to configure a larger UESS to resist more extreme conditions. At the same time, although the system resilience is improved with the weakening of extreme weather effects, in the case of configuring UESS, the improvement from scenario 1 to scenario 2 is the largest, indicating that in the worst scenario, UESS is also difficult to maintain the system resilience at a high level, but this extremely low probability of occurrence will not occupy too much weight in decision-making. From the longitudinal analysis, in the most extreme cases, the gap between the target values with and without UESS is doubled. These gaps are mainly contributed by the cost of UESS, which makes the use of UESS to improve the resilience of the system will bear a very high cost. In other scenarios, the gap between the target values is not large. In scenarios 4 and 5, because UESS can reduce the penalty cost, its target value is even higher than that without UESSS, but in either scenario, the improvement of resilience by UESS is above 0.15. The significant effect of this enhancement also proves the feasibility and effectiveness of UESS.
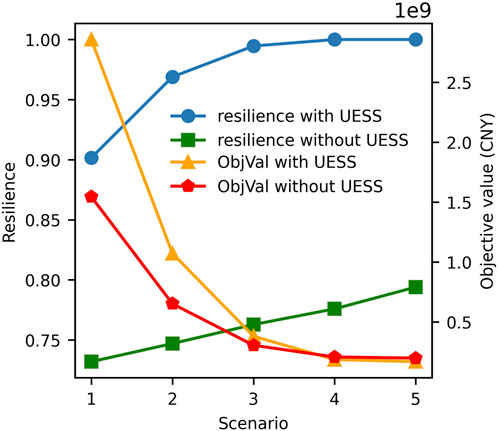
FIGURE 8. Comparison of resilience in different scenarios.
7 Conclusion
This paper develops a resilience enhancement approach of high penetration renewable energy power system with UESS as the core for disaster scenarios under extreme weather events. Under harsh conditions like primary energy block and power equipment damage, UESS can provide power support for the power system. The proposed optimization is a bi-level optimization model that takes into account the two stages of operation and planning, and the model is transformed into the MILP model for solution. The simulation results demonstrate that UESS can enhance the resilience of the power system in disaster scenarios, and it is more significant when extreme weather has a severe impact on the power system.
However, it is essential to mention that this paper simplifies the power flow calculation in the operation model. The contribution of UESS to power quality needs to be highlighted through more accurate power flow analysis. The local influence of extreme weather events on power system and its components will be considered in future work.
Data availability statement
Publicly available datasets were analyzed in this study. This data can be found here: https://ieeexplore.ieee.org/document/4113721/.
Author contributions
BQ: writing-original draft, editing conceptualization, and methodology. WS: investigation, software, data curation. RF: investigation, methodology. DW: conceptualization, methodology. YZ: writing-review, validation. HW: conceptualization, validation. All authors contributed to the article and approved the submitted version.
Funding
This work is supported by the Key Science and Technology Projects of Jiangsu Transportation in 2022 (2022QD01).
Conflict of interest
Authors RF, DW, and YZ was employed by the company Jiangsu Transportation Engineering Construction Bureau.
The remaining authors declare that the research was conducted in the absence of any commercial or financial relationships that could be construed as a potential conflict of interest.
Publisher’s note
All claims expressed in this article are solely those of the authors and do not necessarily represent those of their affiliated organizations, or those of the publisher, the editors and the reviewers. Any product that may be evaluated in this article, or claim that may be made by its manufacturer, is not guaranteed or endorsed by the publisher.
References
Bajpai, P., Chanda, S., and Srivastava, A. K. (2018). A novel metric to quantify and enable resilient distribution system using graph theory and Choquet integral. IEEE Trans. Smart Grid 9 (4), 2918–2929. doi:10.1109/tsg.2016.2623818
Ben-Ayed, O., Boyce, D. E., and Blair, C. E. (1988). A general bilevel linear programming formulation of the network design problem. Transp. Res. Part B Methodol. 22 (4), 311–318. doi:10.1016/0191-2615(88)90006-9
Bessani, M., Massignan, J. A. D., Fanucchi, R. Z., Camillo, M. H. M., London, J. B. A., Delbem, A. C. B., et al. (2019). Probabilistic assessment of power distribution systems resilience under extreme weather. IEEE Syst. J. 13 (2), 1747–1756. doi:10.1109/JSYST.2018.2853554
Bhusal, N., Abdelmalak, M., Kamruzzaman, M., and Benidris, M. (2020). Power system resilience: Current practices, challenges, and future directions. IEEE Access 8, 18064–18086. doi:10.1109/ACCESS.2020.2968586
Bollen, M. H. J. (2001). Effects of adverse weather and aging on power system reliability. IEEE Trans. Industry Appl. 37 (2), 452–457. doi:10.1109/28.913708
Breyer, C., Khalili, S., Bogdanov, D., Ram, M., Oyewo, A. S., Aghahosseini, A., et al. (2022). On the history and future of 100% renewable energy systems research. IEEE Access 10, 78176–78218. doi:10.1109/access.2022.3193402
Chen, S., Liu, P., and Li, Z. (2020). Low carbon transition pathway of power sector with high penetration of renewable energy. Renew. Sustain. Energy Rev. 130, 109985. doi:10.1016/j.rser.2020.109985
Choobineh, M., Speake, A., Harris, M., Tabares-Velasco, P. C., and Mohagheghi, S. (2019). End-User-aware community energy management in a distribution system exposed to extreme temperatures. IEEE Trans. Smart Grid 10 (4), 3753–3764. doi:10.1109/TSG.2018.2834572
Confrey, J., Etemadi, A. H., Stuban, S. M. F., and Eveleigh, T. J. (2020). Energy storage systems architecture optimization for grid resilience with high penetration of distributed photovoltaic generation. IEEE Syst. J. 14 (1), 1135–1146. doi:10.1109/JSYST.2019.2918273
Du, E., Zhang, N., Hodge, B. M., Wang, Q., Lu, Z., Kang, C., et al. (2019). Operation of a high renewable penetrated power system with CSP plants: A look-ahead stochastic unit commitment model. IEEE Trans. Power Syst. 34 (1), 140–151. doi:10.1109/TPWRS.2018.2866486
Gasser, P., Lustenberger, P., Cinelli, M., Kim, W., Spada, M., Burgherr, P., et al. (2021). A review on resilience assessment of energy systems. Sustain. Resilient Infrastructure 6 (5), 273–299. doi:10.1080/23789689.2019.1610600
Haces-Fernandez, F. (2020). Wind energy implementation to mitigate wildfire risk and preemptive blackouts. Energies 13 (10), 2421. doi:10.3390/en13102421
Huang, C. L., Wu, Y. K., and Li, Y. Y. “A review on the resilience assessment of power systems under disasters,” in 2021 7th International Conference on Applied System Innovation (ICASI)), Chiayi, Taiwan, September, 2021a, 71–74.
Huang, Y., Li, P., Zhang, X., Mu, B., Mao, X., and Li, Z. (2021b). A power dispatch optimization method to enhance the resilience of renewable energy penetrated power networks. Front. Phys. 9. doi:10.3389/fphy.2021.743670
Hutchinson, S., Heredia, W. G. B., and Ghatpande, O. A. “Resilience metrics for building-level electrical distribution systems with energy storage,” in 2022 IEEE Conference on Technologies for Sustainability (SusTech)), Sunny Riverside, CA, USA, April, 2022, 71–78.
Khezri, R., Mahmoudi, A., and Aki, H. (2022). Resiliency-oriented optimal planning for a grid-connected system with renewable resources and battery energy storage. IEEE Trans. Industry Appl. 58 (2), 2471–2482. doi:10.1109/TIA.2021.3133340
Kim, J., and Dvorkin, Y. (2019). Enhancing distribution system resilience with mobile energy storage and microgrids. IEEE Trans. Smart Grid 10 (5), 4996–5006. doi:10.1109/tsg.2018.2872521
Kim, S. K., and Park, S. (2023). Impacts of renewable energy on climate vulnerability: A global perspective for energy transition in a climate adaptation framework. Sci. Total Environ. 859, 160175. doi:10.1016/j.scitotenv.2022.160175
Li, B., Ofori-Boateng, D., Gel, Y. R., and Zhang, J. (2021). A hybrid approach for transmission grid resilience assessment using reliability metrics and power system local network topology. Sustain. Resilient Infrastructure 6 (1-2), 26–41. doi:10.1080/23789689.2019.1708182
Li, H., Qin, B., Jiang, Y., Zhao, Y., and Shi, W. (2022). Data-driven optimal scheduling for underground space based integrated hydrogen energy system. IET Renew. Power Gener. 16 (12), 2521–2531. doi:10.1049/rpg2.12386
Lian, X., Qian, T., Li, Z., Chen, X., and Tang, W. (2023). Resilience assessment for power system based on cascading failure graph under disturbances caused by extreme weather events. Int. J. Electr. Power and Energy Syst. 145, 108616. doi:10.1016/j.ijepes.2022.108616
Lu, J., Guo, J., Jian, Z., Yang, Y., and Tang, W. “Dynamic assessment of resilience of power transmission systems in ice disasters,” in 2018 International Conference on Power System Technology (POWERCON)), Guangzhou, China, November, 2018, 7–13.
Luo, D., Xia, Y., Zeng, Y., Li, C., Zhou, B., Yu, H., et al. (2018). Evaluation method of distribution network resilience focusing on critical loads. IEEE Access 6, 61633–61639. doi:10.1109/access.2018.2872941
Luo, Y., Nie, Q., Yang, D., and Zhou, B. (2021). Robust optimal operation of active distribution network based on minimum confidence interval of distributed energy Beta distribution. J. Mod. Power Syst. Clean Energy 9 (2), 423–430. doi:10.35833/mpce.2020.000198
Ma, Z., Yang, M., Jia, W., and Ding, T. (2022). Decentralized robust optimal dispatch of user-level integrated electricity-gas-heat systems considering two-level integrated demand response. Front. Energy Res. 10. doi:10.3389/fenrg.2022.1030496
Panteli, M., Mancarella, P., Trakas, D. N., Kyriakides, E., and Hatziargyriou, N. D. (2017). Metrics and quantification of operational and infrastructure resilience in power systems. IEEE Trans. Power Syst. 32 (6), 4732–4742. doi:10.1109/TPWRS.2017.2664141
Plotnek, J. J., and Slay, J. (2021). Power systems resilience: Definition and taxonomy with a view towards metrics. Int. J. Crit. Infrastructure Prot.
Prakash, P., and Meena, D. C. (2021). Optimal siting of solar based distributed generation (DG) in distribution system for constant power load model. Int. J. Emerg. Electr. Power Syst. 22 (5), 595–606. doi:10.1515/ijeeps-2021-0050
Qin, B., Liu, W., Li, H., Ding, T., Ma, K., and Liu, T. (2022a). Impact of system inherent characteristics on initial-stage short-circuit current of MMC-based MTDC transmission systems. IEEE Trans. Power Syst. 37 (5), 3913–3922. doi:10.1109/tpwrs.2021.3140061
Qin, B., Sun, H., Ma, J., Li, W., Ding, T., Wang, Z., et al. (2019). Robust ${H_\infty }$ control of doubly fed wind generator via state-dependent riccati equation technique. IEEE Trans. Power Syst. 34 (3), 2390–2400. doi:10.1109/tpwrs.2018.2881687
Qin, B., Wang, W., Li, W., Li, F., and Ding, T. (2022b). Multiobjective energy management of multiple pulsed loads in shipboard integrated power systems. IEEE Syst. J. 17, 371–382. doi:10.1109/jsyst.2022.3147268
Rouholamini, M., Wang, C., Nehrir, H., Hu, X., Hu, Z., Aki, H., et al. (2022). A review of modeling, management, and applications of grid-connected Li-ion battery storage systems. IEEE Trans. Smart Grid 13 (6), 4505–4524. doi:10.1109/tsg.2022.3188598
Sabouhi, H., Doroudi, A., Fotuhi-Firuzabad, M., and Bashiri, M. (2020). Electrical power system resilience assessment: A comprehensive approach. IEEE Syst. J. 14 (2), 2643–2652. doi:10.1109/JSYST.2019.2934421
Schweikert, A. E., and Deinert, M. R. (2021). Vulnerability and resilience of power systems infrastructure to natural hazards and climate change. Wiley Interdiscip. Reviews-Climate Change 12 (5). doi:10.1002/wcc.724
Subcommittee, P. M. (1979). IEEE reliability test system. IEEE Trans. Power Apparatus Syst. PAS- 98 (6), 2047–2054. doi:10.1109/tpas.1979.319398
Villamarin-jacome, A., Velasquez-lozano, A., and Saltos-rodriguez, M. “Resilient transmission planning of the ecuadorian power system against earthquakes,” in 2022 IEEE Sixth Ecuador Technical Chapters Meeting (ETCM), Quito, Ecuador, October, 2022.
Wang, W., Lin, W., He, G., Shi, W., and Feng, S. (2021a). Enlightenment of 2021 Texas blackout to the renewable energy development in China. Proc. Chin. Soc. Electr. Eng. 41 (12), 4033–4042.
Wang, Y., Huang, T., Li, X., Tang, J., Wu, Z., Mo, Y., et al. (2021b). A resilience assessment framework for distribution systems under typhoon disasters. IEEE Access 9, 155224–155233. doi:10.1109/ACCESS.2021.3128967
Xia, G., Xie, X., Wan, J., and Zhao, W. “Usability evaluation and maintenance decision of the optical cable based on Weibull Proportional Hazard Model,” in 2020 International Conference on Virtual Reality and Intelligent Systems (ICVRIS), Zhangjiajie, China, July, 2020.
Xia, H., Lin, C., Liu, X., and Liu, Z. (2022). Urban underground space capacity demand forecasting based on sustainable concept: A review. Energy Build. 255, 111656. doi:10.1016/j.enbuild.2021.111656
Yan, D., Wen, J., Du, Z., Yang, D., Yao, W., Zhao, H., et al. (2021). Analysis of Texas blackout in 2021 and its enlightenment to power system planning management. Power Syst. Prot. Control 49 (9), 121–128.
Yan, J., Tang, Y., He, H., and Sun, Y. (2015). Cascading failure analysis with DC power flow model and transient stability analysis. IEEE Trans. Power Syst. 30 (1), 285–297. doi:10.1109/TPWRS.2014.2322082
Yang, Y., Javanroodi, K., and Nik, V. M. (2022). Climate change and renewable energy generation in europe-long-term impact assessment on solar and wind energy using high-resolution future climate data and considering climate uncertainties. Energies 15 (1), 302. doi:10.3390/en15010302
Yang, Y., Tang, W., Liu, Y., Xin, Y., and Wu, Q. (2018). Quantitative resilience assessment for power transmission systems under typhoon weather. IEEE Access 6, 40747–40756. doi:10.1109/ACCESS.2018.2858860
Yu, H., Gao, Y., and Zhou, R. (2020). Oxidative stress from exposure to the underground space environment. Front. Public Health 8, 579634. doi:10.3389/fpubh.2020.579634
Zhang, C., Wang, F., and Bai, Q. (2021). Underground space utilization of coalmines in China: A review of underground water reservoir construction. Tunn. Undergr. Space Technol. 107, 103657. doi:10.1016/j.tust.2020.103657
Keywords: resilience, underground space, energy storage, renewable energy, bi-level optimization model
Citation: Qin B, Shi W, Fang R, Wu D, Zhu Y and Wang H (2023) Underground energy storage system supported resilience enhancement for power system in high penetration of renewable energy. Front. Energy Res. 11:1138318. doi: 10.3389/fenrg.2023.1138318
Received: 05 January 2023; Accepted: 15 May 2023;
Published: 23 May 2023.
Edited by:
Yanbo Chen, North China Electric Power University, ChinaReviewed by:
Jianquan Zhu, South China University of Technology, ChinaErcüment Karakaş, Kocaeli University, Türkiye
Copyright © 2023 Qin, Shi, Fang, Wu, Zhu and Wang. This is an open-access article distributed under the terms of the Creative Commons Attribution License (CC BY). The use, distribution or reproduction in other forums is permitted, provided the original author(s) and the copyright owner(s) are credited and that the original publication in this journal is cited, in accordance with accepted academic practice. No use, distribution or reproduction is permitted which does not comply with these terms.
*Correspondence: Hongzhen Wang, aHp3YW5nQHN0dS54anR1LmVkdS5jbg==