 Bojie Liu1,2
 Binbin Peng3Fei Lu4Jiang Hu2Li Zheng3,5*Meifang Bo2Xin Shang2Weiwei Liu6Yichi Zhang2Xiafei Zhou7Pengfei Jia8
 Gengyuan Liu1*
- 1State Key Joint Laboratory of Environmental Simulation and Pollution Control, School of Environment, Beijing Normal University, Beijing, China
- 2China Nuclear Power Engineering Co., Ltd., Beijing, China
- 3College of Management and Economics, Tianjin University, Tianjin, China
- 4Research Center for Eco-Environmental Sciences, Chinese Academy of Sciences, Beijing, China
- 5National Marine Data and Information Service (NMDIS), Ministry of Natural Resources of China, Tianjin, China
- 6Beijing Key Laboratory of Wetland Ecological Function and Restoration, Institute of Ecological Conservation and Restoration, Chinese Academy of Forestry, Beijing, China
- 7The Center for Eco-Environmental Accounting, Chinese Academy of Environmental Planning, Beijing, China
- 8China Academy of Urban Planning and Design, Beijing, China
Nuclear power plays a crucial role in achieving the target of carbon neutrality to build a sustainable society. However, it is not “carbon-free” when considering its entire life cycle. Therefore, accurate accounting and monitoring of its generated carbon emissions are required to avoid miscalculations of nuclear energy as a clean energy source. In this study, the life-cycle carbon emissions of nuclear power plants (NPPs) with different reactor types are reviewed. In addition to the characteristic differences among different reactors, disparities in the review results originate from the varying emissions at the respective stages of the nuclear fuel cycle, technology choices at each stage and accounting methods and boundaries. The carbon emissions resulting from NPP construction and operation are underestimated due to the limited data and methods, which creates uncertainty in the evaluation of NPP carbon emissions. An integrated framework for carbon emissions accounting considering the construction and operation of NPPs (CACO-NPP) is proposed. This integrated framework aims to improve the accounting accuracy for carbon emissions originating from NPPs. An emerging Generation III NPP with the latest technology, HPR1000 (an advanced pressurized water reactor), was adopted as a case study. The results show that the total emissions resulting from vegetation loss, equipment manufacturing and labor input during construction and operation are 1232.91 Gg CO2 with a carbon intensity of 1.31 g CO2/kWh, indicating the notable mitigation capability of Generation III NPPs. By combining the maturity of HPR1000 technology with successive design improvements, the carbon emissions of such reactor types could be further reduced. This development is very important for realizing China’s carbon neutrality target.
1 Introduction
China has pledged to realize CO2 emission peaking by 2030 and achieve carbon neutrality by 2060, which is referred to as the carbon peaking and neutrality targets (Yan et al., 2022). The required speed and scale of China’s emission reduction efforts are unique relative to other countries because the time is limited for China to reach the above targets (Guan et al., 2021). Since the power sector is the major source of carbon emissions during electricity generation and consumption, clean energy is an ideal choice to curb emissions (Li et al., 2018; Naimoğlu, 2022). Reportedly, to achieve the 1.5°C target, clean energy should account for 50% of the total energy sources by 2050 (IEA, 2019).
Nuclear energy supplies high base-load electricity, which is more reliable, sustainable and economic than other clean energy sources, such as hydropower, solar power and wind power (Rawat et al., 2017). Moreover, pursuing nuclear energy has become prominent to reach the Sustainable Development Goals (SDGs) including SDG 13 (climate action), SDG 7 (affordable, reliable and modern energy sources), SDG 12 (sustainable consumption and production modes) and SDG 11 (sustainable cities and communities) (Acheampong et al., 2017; Gunnarsdottir et al., 2021; Wang et al., 2023a). As a result of the SDG agenda adopted in 2015, countries are more eager than ever to deploy nuclear power aiming to pursue a sustainable environment and economic growth (Wang et al., 2023a).
Nuclear energy contributes to energy security and hence secures economic progress and social wellbeing in populous countries (Wu et al., 2022a). At the end of 2020, the world’s total nuclear power capacity reached 392.6 GW(e), generated by 442 operational nuclear power reactors in 32 countries, accounting for 10% of the world’s total electricity generation (IAEA, 2021). China has been committed to developing nuclear power in an active, safe and orderly way (Xi, 2022), witnessing a steady increase in electricity generation by nuclear power since 2010 (Gungor and Sari, 2022). China’s nuclear power generation in 2021 amounted to 407.14 billion kWh, increasing 11% over 2020 levels (Zhang et al., 2021). Generation III nuclear power plants (NPPs), represented by the latest technology (HPR1000), could have a promising future development potential, with 6–8 units constructed annually (Zhang et al., 2021).
Although no carbon is directly generated or released in the fission reaction due to the lack of fossil fuel consumption during nuclear electricity production, indirect carbon emissions are generated from the extraction and conversion of raw materials, construction of power plants and other process steps in the entire nuclear fuel cycle (Beerten et al., 2009). The nuclear fuel cycle is generally classified into two types: the once-through cycle (OTC) and the twice-through cycle (TTC). Spent fuels are directly discharged in the former mode, while unused fissionable materials are recycled through reprocessing in the latter mode. Both the OTC and TTC modes involve complex stages, including the front end (uranium mining and milling, conversion, enrichment and fuel fabrication), construction and operation of NPPs, back end (interim storage, conditioning, and reprocessing) and a final stage involving plant decommissioning (Atz and Fratoni, 2023). Varying estimates have focused on the carbon emissions of the nuclear fuel cycle (expressed in g CO2/kWh) for a specific reactor type or fuel cycle mode. However, few studies have compared carbon emissions originating from different reactor types and fuel cycle modes. Moreover, the critical stages and technological factors influencing carbon emissions from NPPs must be determined. Since carbon accounting is relevant in terms of reaching the Chinese carbon peaking and neutrality targets and is also the foundation of establishing a cap-and-trade system for carbon emissions (Xi, 2022), it is important to clarify the carbon emissions originating from different nuclear reactor types and formulate suggestions to reduce emissions of NPPs.
In this study, we aimed to provide a comprehensive and critical review of carbon emissions originating from NPPs with different reactor types, including pressurized water reactors (PWRs), light water reactors (LWRs), heavy water reactors (HWRs), boiling water reactors (BWRs), fusion reactors (FRs), fast breeding reactors (FBRs) and gas-cooled reactors (GCRs). The disparity of the review results was analyzed in terms of the various stages involved in the nuclear fuel cycle and process selection at each stage. Moreover, method-related factors, including accounting methods and accounting boundaries, were investigated to clarify the source of discrepancy in the review results. Furthermore, viable pathways were proposed to curb these carbon emissions within the context of the whole nuclear fuel cycle. Based on the abovementioned review and analysis, we established an integrated methodological framework to improve the accuracy of NPP emissions accounting. Based on the proposed framework, we analyzed the mitigation capability of a Generation III NPP using the latest technology (HPR1000) in China and elucidated the techno-economic aspects of this nuclear reactor type to provide a greater understanding. Finally, conclusions and implications were outlined, aiming to improve the sustainable development of the nuclear power industry toward achieving carbon neutrality.
2 Review of the carbon accounting results for NPPs based on different nuclear reactors
Traditionally, estimates of carbon emissions of NPPs are based on the nuclear fuel cycle, focusing on the carbon emissions resulting from respective stages including mining, milling, refinery, conversion, enrichment and fuel fabrication in the front end, construction and operation of NPPs as well as interim storage, reprocessing, mixed oxide (MOX) fuel fabrication and final disposal in the back end. Moreover, the transportation of spent fuels and radioactive wastes is included. Table 1 provides an overview of the reviewed studies on carbon emissions based on the nuclear fuel cycle. The carbon emission results are reported as g CO2/kWh. Different studies show a wide disparity due to the diverse reactor types, various technological processes at each stage of the nuclear fuel cycle, applied accounting methods and considered accounting boundaries (Pomponi and Hart, 2021).
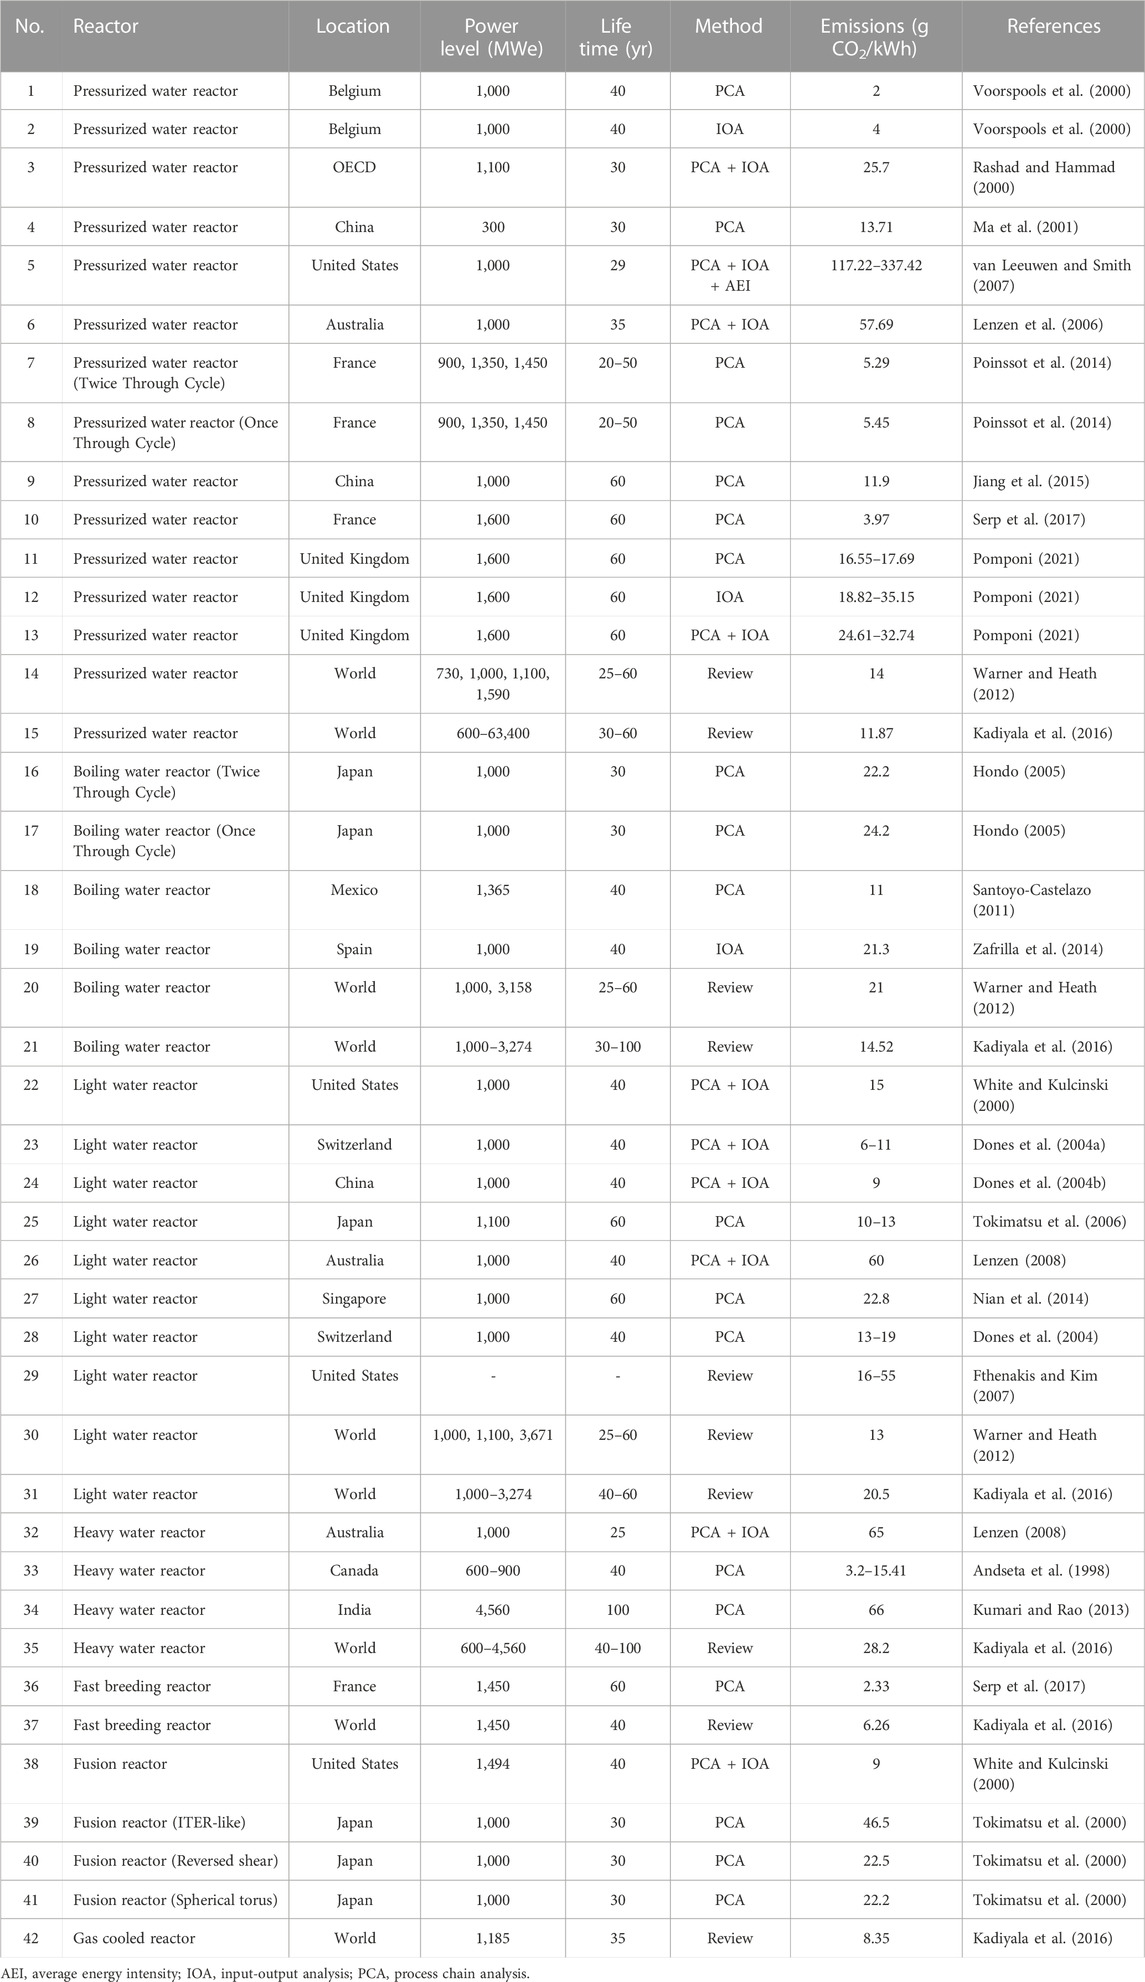
TABLE 1. Reviewed carbon emissions of NPPs.
Figure 1 shows the carbon emissions in the respective studies for different nuclear reactor types. The number of case studies for LWRs, PWRs, BWRs, HWRs, FRs, FBRs, and GCRs are 10, 15, 6, 2, 4, 2, and 1, respectively (Table 1). The carbon emissions of LWRs, PWRs, BWRs, HWRs, FRs, FBRs and GCRs reach 6∼60, 2∼337.42, 11∼24.2, 3.2∼66, 9∼46.52, 2.33∼6.26 and 8.35 gCO2/kWh, respectively. Notably, the disparity of the results is larger for PWRs than for the other reactor types because the number of PWR-related studies is the largest with varying NPP locations and operational periods, as well as distinct accounting methods and research boundaries. The average carbon emissions of LWRs, PWRs, BWRs, HWRs, FRs and FBRs are 17.88, 42.94, 19.68, 37.40, 25.05, and 4.30 g CO2/kWh, respectively. The average emissions of PWRs are higher than those of HWRs because HWRs can be fueled with natural uranium or slightly enriched uranium (below 2%) (Wu et al., 2022b). Compared to PWRs, HWRs provide the advantage of not requiring an enrichment process for fuel fabrication, resulting in reduced energy consumption and carbon emissions. Compared to those of the other reactor types, FBRs produce the lowest carbon emissions on average because the uranium resource consumption and corresponding energy use in the front end and the volume of high-level radioactive waste are reduced due to the higher levels of uranium and plutonium recycling (Bodi et al., 2022). This result is consistent with the studies of Kadiyala et al. (2016) and Poinssot and Bourg (2021). The median carbon intensity of FRs is the highest due to its complex design and construction based on current conditions. Because the number of studies on GCR emissions is small, the objective results for these reactors and a comparison to other types of reactors should be further investigated in the future.
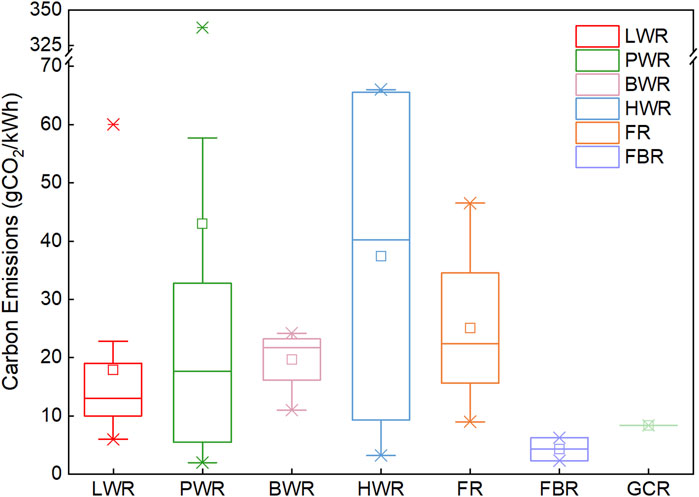
FIGURE 1. Quartile boxes figure of carbon emissions originating from the different types of nuclear reactors (PWR, pressurized water reactor; BWR, boiling water reactor; FR, fusion reactor; FBR, fast breeding reactor; GCR, gas cooled reactor).
3 Review of the carbon accounting results for NPPs based on the different stages in the nuclear fuel cycle
To clarify the disparity among the reviewed studies, it is necessary to expand our focus and consider the whole nuclear fuel cycle, involving the front end, construction and operation of NPPs and back end. The considerable variability of carbon emissions at the respective stages is due to the differences in energy and material inputs. Moreover, the technology choices at each stage of the nuclear fuel cycle influence the carbon emissions of NPPs. Therefore, studying the carbon emissions at each stage of the nuclear fuel cycle and identifying the main factors influencing these emissions could be conducive to a comprehensive understanding of the disparity mentioned in Section 2.
3.1 Carbon emissions at the front end
The carbon emissions of the nuclear fuel cycle are related to the technology applied at each stage of the front-end nuclear fuel cycle. The carbon emissions produced in the front end, especially uranium mining, milling and enrichment, dominate the whole nuclear fuel cycle (Fthenakis and Kim, 2007; Sovacool, 2008).
3.1.1 Mining and milling
The carbon emissions resulting from mining and milling vary mainly due to the differences in mine type and ore grade. Uranium is mined via either open pit, underground excavation or in situ leaching methods. Compared to those of the latter two processes, open pits release higher carbon emissions due to the higher energy and material inputs (Lenzen, 2008; Sovacool, 2008). In contrast, in situ leaching involves the lowest energy and material consumption as milling is avoided. However, carbon emissions could also be generated due to the use of acid and lime in the process of uranium leaching and neutralization of leached tailings (Krūmiņš and Kļaviņš, 2023).
Ore grade is another factor affecting carbon emissions resulting from mining and milling. Emissions increase with decreasing uranium ore quality due to the higher energy and material consumption levels in mining and milling. When the uranium ore grade declines by a factor of ten, the energy inputs to mining and milling increase by at least a factor of ten (Mark and Peter, 2006). Parker et al. (2016) estimated carbon emissions resulting from uranium mining and milling in Canada, reporting that emissions increased from 0.9 to 2.2 g CO2e/kWh when the ore grade declined from 4.53% to 0.74%. Compared to other estimates, the highest carbon emissions resulting from mining and milling (24.73 g CO2e/kWh) were reported by van Leeuwen and Smith (2007), where the uranium ore grade reached only 0.06%, while the lowest emissions (0.1 g CO2e/kWh) were reported by Fthenakis and Kim (2007), where the uranium ore grade was 12.7%.
3.1.2 Enrichment
Enrichment is an indispensable stage in the front end of the nuclear fuel cycle involving uranium enrichment from the natural concentration to approximately 3% (typical for LWRs). Generally, the adopted enrichment methods mainly include gas diffusion and gas centrifugation. Gas diffusion is a much more energy-intensive technique and emits more carbon than gas centrifugation (Dones et al., 2005). Lenzen (2008) reviewed the energy requirements (in units of kWh/kg separative work unit (SWU)) for gas diffusion and gas centrifugation. The energy input of gas diffusion (2,400∼3,100 kWh/kg SWU) was significantly higher than that of gas centrifugation (40∼282 kWh/kg SWU) (Lenzen, 2008). Correspondingly, the carbon emissions resulting from gas diffusion could also be significantly higher than those resulting from gas centrifugation (Lenzen, 2008). The emissions resulting from gas diffusion (80 g CO2e/kWh) were approximately 10 times higher than those resulting from gas centrifugation (9 g CO2e/kWh), in which the electricity supplied for the former process is obtained from fossil fuels, while the electricity supplied for the latter process is obtained from renewable energy sources (Dones et al., 2004a). Moreover, the carbon emissions resulting from enrichment are prominent throughout the whole nuclear fuel cycle, accounting for 61.9% and 55.8% of the total emissions of the nuclear fuel cycle in the OTC and TTC strategies, respectively. The amount of carbon emissions resulting from enrichment is directly related to the source of the electricity supply (Hondo, 2005). Similarly, Lenzen (2008) reported that the emissions resulting from enrichment dominate the nuclear fuel cycle, accounting for approximately 37%∼65% of the total emissions. The contribution varied due to the different sources of the electricity supply. Adopting gas centrifugation and using renewable sources for electricity generation are effective measures to curb the carbon emissions resulting from enrichment and thus reduce the emissions of NPPs.
3.2 Carbon emissions resulting from the NPP construction and operation
The carbon emissions generated during the construction of NPPs result from the use of bulk materials and fossil fuels. Estimates of the carbon emissions resulting from construction and operation vary widely due to the methods adopted (IO or process chain analysis (PCA)), studied reactor type, input data and estimates and assumptions (Lenzen, 2008; Beerten et al., 2009). Sovacool et al. (2008) demonstrated that, compared to front-end emissions, the emissions originating from the construction phase are lower, accounting for approximately 12% of the total emissions of the nuclear fuel cycle. However, Poinssot et al. (2014) published contradictory findings, revealing that the contribution of the emissions resulting from construction is approximately the same as that of the front-end emissions. Similar results were also reported by van Leeuwen and Smith (2007) and Jiang et al. (2015). Compared to those of the commonly adopted PWRs and BWRs, the emissions resulting from the construction of advanced reactors, namely, FBRs and HWRs, are higher due to their more complex design and additional components (Bodi et al., 2022).
The carbon emissions stemming from the construction phase are currently underestimated. Studies on s NPP construction emissions are mainly based on approximate accounting of the emissions resulting from the consumption of steel, concrete, copper and cement (Ma et al., 2001; Fthenakis and Kim, 2007). However, detailed information on the input data is lacking, and accurate emissions accounting cannot be realized solely based on rough material consumption estimates (Beerten et al., 2009). Moreover, the construction of NPPs, especially nuclear islands, involves equipment with a large gross mass using advanced stainless steel for safety reasons. For instance, the total weights of the reactor pressured vessel and steam generator are approximately 418 and 365 tons, respectively, using 16MnD5 (the designation of carbon steel plates used specifically in nuclear power construction) as the main material, which is carbon intensive (Xing and Wu, 2020; Ju et al., 2022). The omission of carbon emissions resulting from equipment manufacturing could result in the underestimation of carbon emissions stemming from NPP construction. In addition to equipment manufacturing, there are other factors influencing carbon emissions during the construction phase that should be further investigated.
Similar to the construction stage, the carbon emissions resulting from the operation of NPPs vary widely. The reported emissions at this stage are low, accounting for approximately 6%∼17% of the total carbon emissions of the nuclear fuel cycle (Lenzen et al., 2006; Sovacool, 2008; Pomponi and Hart, 2021). In current studies, the emissions at this stage are underestimated because the emissions resulting from the manufacturing of equipment and replacement nuclear fuels and fossil fuel consumption for material transportation are generally omitted. Moreover, detailed input data for carbon accounting, such as the consumption of chemicals, electricity and diesel used during operation and maintenance, are difficult to obtain and analyze (Pomponi and Hart, 2021). Therefore, a systematic approach for accurate accounting of the emissions at the operation stage is needed.
3.3 Carbon emissions at the back end
The carbon emissions at the back end mainly result from the final disposal (in the OTC case) and reprocessing of spent fuels (in the TTC case). Sovacool (2008) estimated that the emissions at the back end only accounted for approximately 13% of the total carbon emissions of the nuclear fuel cycle. Similarly, Hondo (2005) reported that the OTC- and TTC-based emissions at the back end accounted for 3.4% and 6% of the total emissions of the nuclear fuel cycle, respectively. Poinssot et al. (2014) also found that back-end emissions only accounted for 7% or even less of the total cycle emissions. Although the reported emissions seem low relative to the total emissions of the nuclear fuel cycle, the results exhibit high uncertainty. The input data for back-end facilities are very limited because projects involving final repositories and reprocessing are generally confidential, and relevant input data are difficult to acquire. Therefore, back-end emissions are difficult to accurately estimate, and the present results may exhibit high uncertainty.
4 Review of the accounting methods for NPP carbon emissions
4.1 Development of methods
Life-cycle assessment (LCA) is a widely utilized methodology to determine the environmental impacts of a given product or system on a life-cycle basis (Nitschelm et al., 2021). LCA has been used to evaluate the life-cycle carbon emissions of NPPs (Anshassi et al., 2021; Pomponi and Hart, 2021). The accounting methods for carbon emissions of the nuclear fuel cycle broadly involve bottom-up and top-down approaches (Pomponi and Hart, 2021).
PCA is a bottom-up approach that enables carbon accounting at the process level with high granularity (Nian et al., 2014). In PCA, process steps are systematically itemized and decomposed into subprocesses, where input factors relevant to carbon emissions are itemized, such as materials and energy (Ehmsen et al., 2021). PCA provides high granularity in accounting for carbon emissions resulting from each stage of the nuclear fuel cycle because it considers the materials and energy consumption of each engineering process (Liu et al., 2019). This method could provide useful insights given specific research objectives (products and processes) and when detailed inventory data are available (Pomponi et al., 2022). However, it is often difficult to acquire extensive and highly accurate data. Moreover, due to inconsistent and incomplete research boundaries, the PCA method fails to capture carbon emissions associated with auxiliary processes, services and supply chains (Xiong et al., 2021; Yu et al., 2021). For instance, some processes cannot be expressed as materials or energy used, and thus, corresponding emissions are impossible to determine via this approach (Voorspools et al., 2000). For instance, in large construction projects, it is very difficult to obtain detailed process-based carbon emission factors for equipment manufacturing with only monetary data (Li et al., 2021).
The top-down approach mainly includes the input-output (IO) method, which is a robust method for evaluating energy systems at the macroeconomic level by formulating IO tables. Embedded carbon emissions in end-products or services can be determined based on the average carbon emission intensity of each economic sector (Zhang et al., 2022). Regional IO and multiregional input-output (MRIO) models are two approaches to the IO method (Ali et al., 2018). The IO approach considers sectoral interactions and facilitates the quantification of complex linkages, providing a useful tool to clarify the embedded emissions in the whole production chain (Zhang et al., 2022). Generally, the IO method can be employed to effectively estimate and analyze direct and indirect sectoral carbon emissions (Li et al., 2023; Liu et al., 2023). However, some stages cannot be applied to all economic sectors, and thus, their emissions cannot be evaluated via the IO method. In addition, this approach imposes a time lag effect on carbon emission analysis (Zhou et al., 2023), lacks granularity at the engineering process level and fails to provide specific results for products and processes (Xiong et al., 2021).
White and Kulcinski (2000) compared the IO and PCA methods, demonstrating that the former approach could exhibit overestimation of the results because costs not directly relevant to carbon emissions originating from materials are involved as input. Moreover, the PCA method probably underestimates carbon emissions due to the neglect of embodied emissions in the supply chain. Previous work has shown that carbon emissions accounted for by the IO method are higher than those accounted for by the PCA method (Pomponi and Hart, 2021; Pomponi et al., 2022).
Considering the advantages and drawbacks of each method, a hybrid LCA approach combining both the IO and PCA methods has been widely applied, denoted as a hybrid LCA (HLCA) model (Xiong et al., 2021). The HLCA model provides a holistic perspective for carbon emissions accounting, and it has been reported that this hybrid method can yield more accurate results (Pomponi and Lenzen, 2018).
The materials used in the nuclear industry are normally expensive, labor intensive and energy intensive. The material cost generally integrates the costs of instrumentation- and control-related energy, extra energy for manufacturing and specification and labor use. These extra consumption aspects and corresponding indirect emissions are not involved in PCA (Fthenakis and Kim, 2007; Tang et al., 2022). Thus, the HLCA method has been applied in a series of studies to account for the carbon emissions of NPPs, combining the use of the IO and PCA methods (White, 2000; Lenzen et al., 2006; van Leeuwen and Smith, 2007; Lenzen, 2008; Warner and Heath, 2012; Pomponi and Hart, 2021). When possible, the PCA method can be employed, while the IO method can be adopted for carbon accounting of nonmaterial processes and complex equipment.
In addition to the LCA methodology, the average energy intensity (AEI) method has been applied to calculate the carbon emissions resulting from NPP construction (Pomponi and Hart, 2021). In the AEI method, the total cost is multiplied by the national AEI value. This method is easy to use but can suffer overestimation, with approximately 10 and 5 times higher emissions than those obtained using the PCA and IO methods, respectively (Lenzen et al., 2008).
4.2 Research boundary
In 21 of the 24 studies reviewed in this paper, the carbon emissions of NPPs were estimated based on the whole nuclear fuel cycle (Table 2), involving the front end, construction and operation of NPPs and back end. Voorspools et al. (2000) estimated carbon emissions resulting from the construction, maintenance and demolition of PWR-type NPPs. The estimated emissions were 2 and 4 g CO2/kWh based on the PCA and IOA methods, respectively, which are on the lower end of the range of estimates for PWRs (2∼337.42 g CO2/kWh). This finding can be explained by the narrower accounting boundary relative to other studies. Similarly, Pomponi (2021) investigated carbon emissions resulting from the construction and operation of a European pressurized reactor (EPR) based on the PCA and IOA methods. However, the results obtained with the PCA (16.55∼17.69 g CO2/kWh) and IOA (18.82∼35.15 g CO2/kWh) methods were higher than previous results. The reactor studied by Voorspools et al. (2000) is a Generation II PWR, while the EPR is a Generation III PWR, which is a more energy- and material-intensive reactor type during its construction and operation phase and more expensive than the former reactor type (Pomponi and Hart, 2021). Parker et al. (2016) comprehensively assessed the carbon emissions resulting from the mining and milling of uranium, aiming to improve the data accuracy for the accounting of carbon emissions of NPPs. Other studies covered the whole nuclear fuel cycle. All the phases of the front end of the cycle were considered in these studies, but the stages of the back end were considered in different ways among the various studies. The reason lies in the type of nuclear fuel cycle (OTC or TTC) studied.
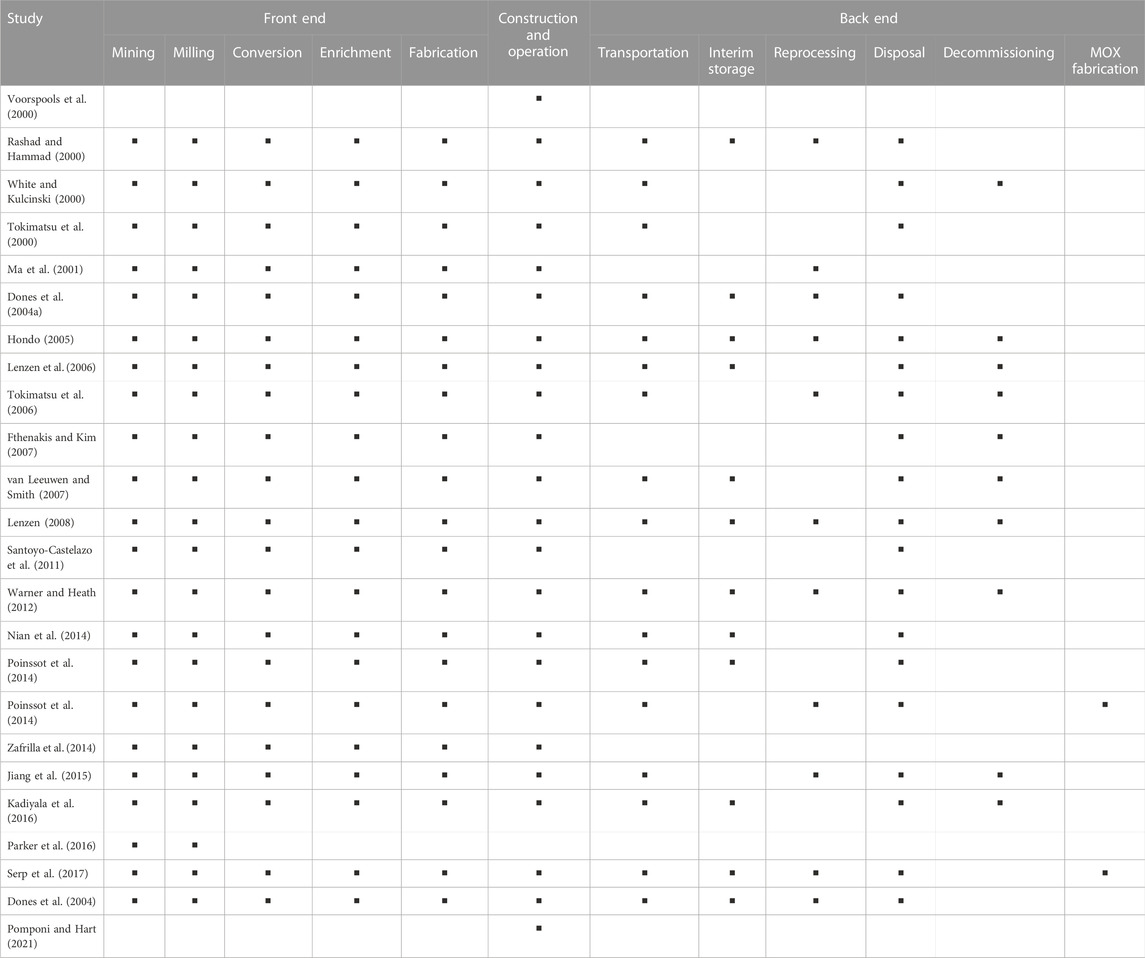
TABLE 2. Research boundaries of the different studies.
Since PWRs are the most common nuclear power reactors, the breakdown of carbon emissions among the front end, construction and operation of NPPs and back end of the nuclear fuel cycle was analyzed (Figure 2; Supplementary Materials). The average carbon emissions at the front end, construction and operation and the back end were 11.45, 7.82 and 3.07 g CO2/kWh, respectively. The front-end emissions comprised the largest component, accounting for approximately half of the total emissions of the nuclear fuel cycle, followed by the emissions resulting from the construction and operation of NPPs and the back end. The carbon emissions at the front end were mainly generated from mining and milling as well as enrichment. However, different studies have reported contradictory results regarding the composition of front-end emissions. Poinssot et al. (2014), Jiang et al. (2015) and Serp et al. (2017) revealed that emissions resulting from mining and milling were the most prominent component, accounting for approximately 62%–78% of the total front-end emissions. However, Ma et al. (2001), Hondo (2005), Fthenakis and Kim (2007) and Nian et al. (2014) demonstrated the opposite findings whereby the enrichment emissions constituted the largest part, accounting for approximately 75%∼88% of the total front-end emissions. Such conflicting results can be attributed to the different technology choices and sources of consumed energy at each stage of the front end within the respective studies (Section 3.1).
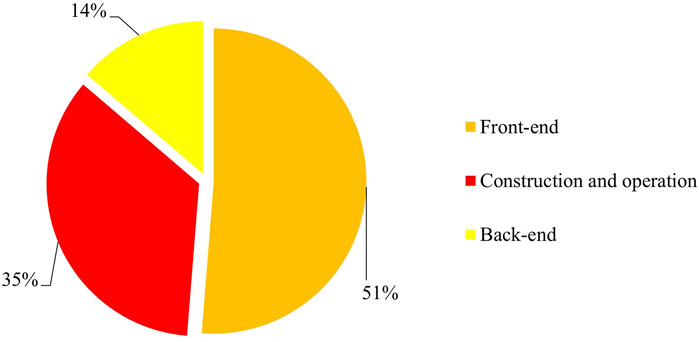
FIGURE 2. Breakdown of the carbon emissions of the nuclear fuel cycle of PWRs.
5 Pathway to curb carbon emissions based on the nuclear fuel cycle
The nuclear fuel cycle involves both the OTC and TTC strategies. In the OTC mode, spent nuclear fuels are regarded as highly radioactive waste materials to be finally disposed, which is also called the open cycle (Figure 3). In contrast, in the TTC mode, spent nuclear fuels are reprocessed to recycle U and Pu and fabricate MOX fuels, also called the closed cycle (Yang, 2016) (Figure 4). Compared to the OTC mode, the TTC mode is more environmentally friendly with less disturbance to the ecological environment. Among the 24 studies, 10 considered the TTC strategy, and thus, the carbon emissions stemming from reprocessing were involved in the fuel cycle (Table 2). The carbon emissions in the OTC mode (5.45 g CO2/kWh) were higher than those in the TTC mode (5.29 g CO2/kWh). This agrees with the study of Poinssot and Bourg (2021), who estimated that the carbon emissions resulting from the TTC strategy were approximately 3% lower than those resulting from the OTC strategy. When shifting from the TTC to OTC mode, the carbon emissions resulting from mining, conversion and enrichment could significantly increase due to the increased natural uranium consumption as well as energy consumption in the front end (Poinssot et al., 2014; Poinssot and Bourg, 2021). Although the TTC mode involves reprocessing of nuclear spent fuels, the contribution of emissions resulting from reprocessing to the whole cycle emissions is low (lower than 7%) (Poinssot et al., 2014). Moreover, the carbon emissions resulting from the disposal of the large volume of high-level radioactive waste produced in the OTC strategy could be two times higher than those produced in the TTC strategy (Poinssot et al., 2014).
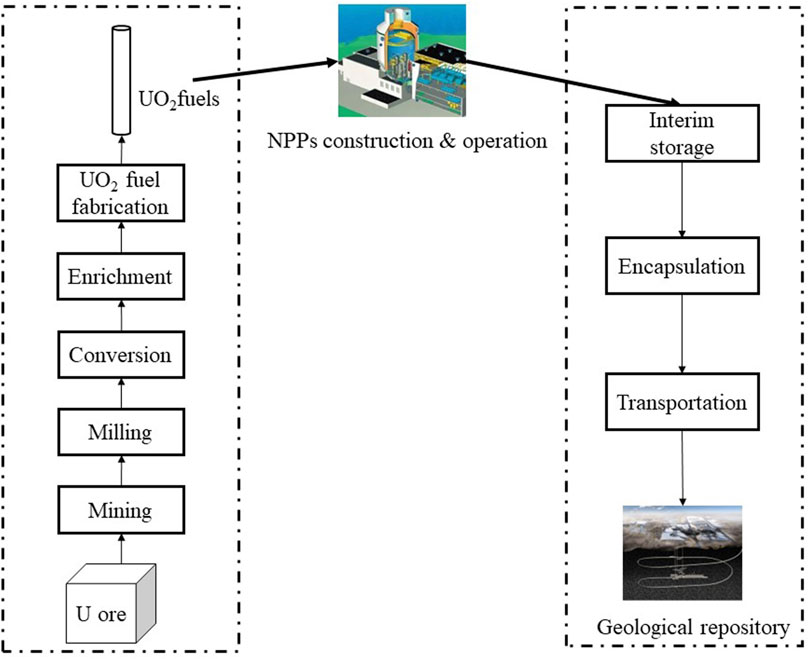
FIGURE 3. Schematic diagram of the once-through cycle (OTC).
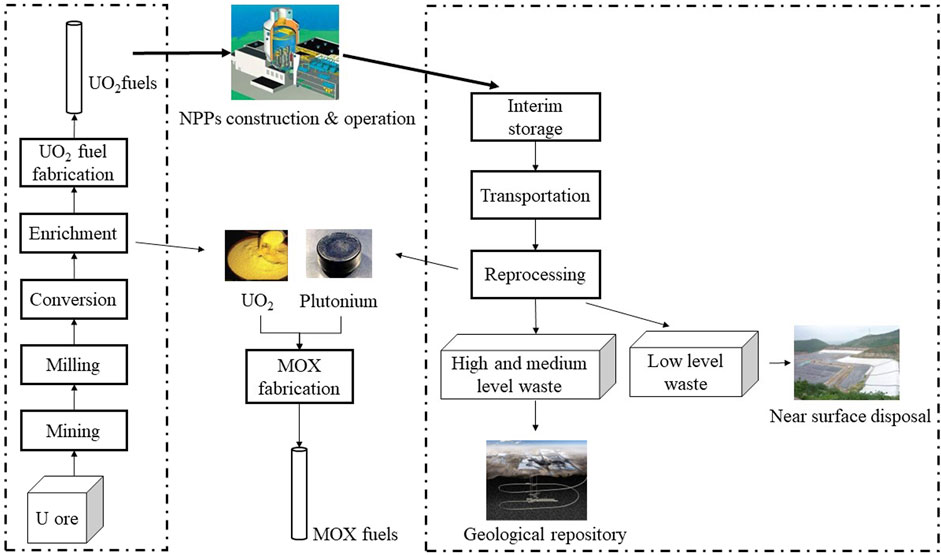
FIGURE 4. Schematic diagram of the twice-through cycle (TTC).
Under the same discount rate, there was no apparent discrepancy in the unit cost of the back end between the OTC and TTC strategies, even considering the external cost (The Boston Consulting Group for AREVA, 2006; Tang, 2021; Kim et al., 2022). Based on the whole nuclear fuel cycle, Taylor et al. (2022) verified the approximate economics of the OTC and TTC strategies regarding the levelized cost of electricity (LCOE) attributed to the minor component of back-end costs. Moreover, compared to the TTC mode, the higher volume of high-level radioactive waste in the OTC mode necessitates the construction and operation of a deep geologic repository, resulting in higher carbon emissions and financial input over a long timescale (Taylor, 2022).
Therefore, the TTC strategy is advantageous in terms of the efficient use of natural resources, reduction in the waste volume and radiotoxicity and carbon mitigation without exerting unfavorable impacts on the total cost of nuclear power generation. In particular, with the expansion of China’s nuclear power, the external dependence on uranium resources has increased, posing great risks to nuclear power development (Guo et al., 2023). Within the context of advocating the circular economy in China, implementing the TTC strategy could be a viable pathway to enhance the mitigation capability of NPPs.
6 Discussion
6.1 Modified framework for carbon emissions accounting for the construction and operation of NPPs (CACO-NPP)
In the nuclear fuel cycle, front-end emissions have been extensively studied relative to the back end and the construction and operation phase. Moreover, back-end emissions account for only 14% of the total emissions of the nuclear fuel cycle, and the input data are difficult to acquire due to the confidentiality of reprocessing projects. As mentioned in Section 3, the estimated carbon emissions resulting from construction and operation are highly contradictory among the different studies, accounting for an average of 35% of the total carbon emissions of the nuclear fuel cycle, and these emissions are currently underestimated due to the limited input data and incomplete methodologies. Such uncertainty in the carbon emissions stemming from construction and operation could hinder the objective and comprehensive evaluation of the carbon emissions of the nuclear fuel cycle, impeding the accurate estimation of the emission mitigation capability of NPPs. Since the construction sector contributes almost 30% to the global carbon emissions, it plays a significant role in achieving SDGs and carbon neutrality (Alawneh et al., 2018; Opoku et al., 2022).
Developing an appropriate model to comprehensively and accurately identify emissions resulting from NPP construction and operation is urgent. The Intergovernmental Panel on Climate Change (IPCC) 2006 Guidelines for National Greenhouse Gas Inventories and the updated 2019 document proposed three tiers for carbon emission estimation (IPCC, 2006; IPCC, 2019). Tier 3 is the highest level of carbon accounting with more complex models and higher resolution input data, and it can better capture variability in local conditions (Sperow, 2020). This is especially necessary for China, where HPR1000, a Generation III nuclear power reactor, will be the dominant reactor type in the future, and the emissions of such emerging reactors are still unclear due to the new design concepts and system components.
Constructed NPPs and their surrounding environments could be regarded as social-economic-natural complex ecosystems (Wang and Ouyang, 2012). Emissions accounting should also be comprehensive, not only involving energy and material consumption, as was considered in previous studies, but also involving the influence of NPP construction and operation on the ecological system as well as emissions resulting from human activities. Figure 5 shows a schematic framework of the proposed CACO-NPP methodology, by which emissions can be determined within the context of social-economic-natural complex ecosystems.
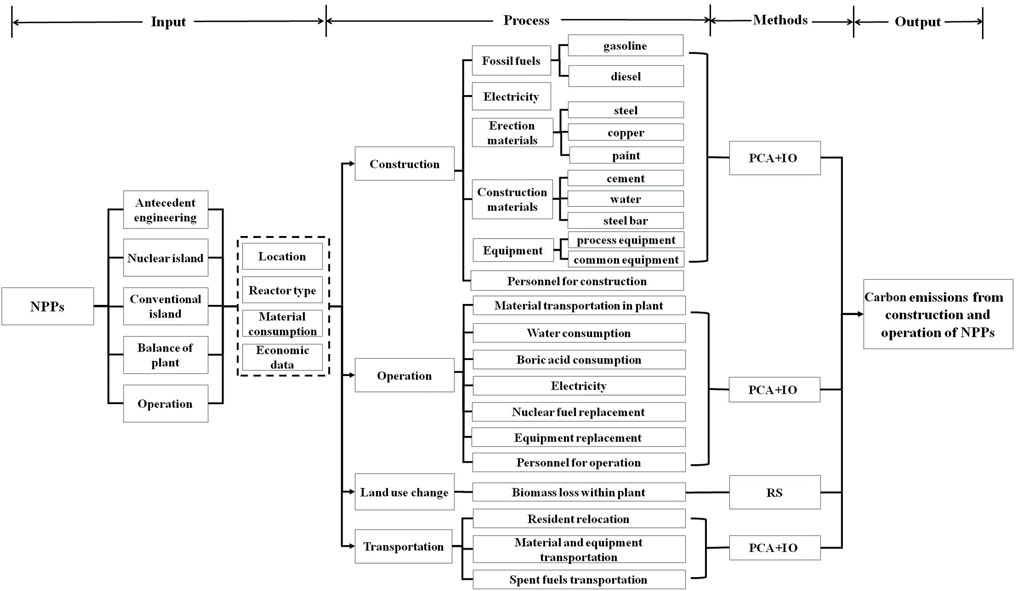
FIGURE 5. Integrated framework for carbon emissions accounting for the construction and operation of NPPs (CACO-NPP) PCA, Process chain analysis; IO, Input‒output analysis; RS, Remote sensing.
Human activities are the most active element in the social-economic-natural complex ecosystem and dominate the NPP construction and operation stage (Ma and Wang, 1984). Moreover, the construction and operation of NPPs could influence the natural ecosystem by altering the land use type from vegetative land to industrial land. Such transformation could result in the loss of on-site vegetation and biomass carbon. Equipment is of paramount importance to NPP operation. Numerous equipment types occur at NPPs distributed across nuclear island, balance of plant and conventional island. Equipment manufacturing exhibits the characteristics of a strong foundation and high industrial linkages, which provides important support to promote industrial and economic development. Equipment manufacturing not only consumes many raw materials and much energy but also promotes the development of downstream service industries. It has the industrial characteristics of connecting the preceding and the following. Equipment manufacturing depends on input obtained from other national economic sectors.
Estimation of the carbon emissions resulting from vegetation loss, human activities and equipment manufacturing is essential to quantify the impact of NPPs on the social-economic-natural complex ecosystem as well as to bridge the gap in regard to the current underestimation of carbon emissions resulting from NPP construction and operation. In this study, relevant data for Zhangzhou NPP Units 1 and 2, an emerging Generation III NPP with the latest technology (HPR1000), were acquired to quantitatively estimate emissions originating from the abovementioned sources.
6.2 Carbon emissions from vegetation deterioration
The construction of NPPs could cause vegetation deterioration in the ecosystem, resulting in corresponding biomass carbon loss. NPPs in China generally occur in the coastal area of southeastern China, where the forest carbon density is the highest (2.88 t C/hm2) (Liu Z. et al., 2022). An NPP, normally comprising 6 units, covers approximately 200 ha of land, indicating that NPP construction could lead to the immediate loss of 2,112 t CO2 (Peng, 2021). Cui et al. (2016) used remote sensing data to model the carbon sequestration rate of vegetation from 2001 to 2010 and reported that the carbon sequestration rate in southeastern China reached over 600 g/(m2·a). Thus, the vegetation lost due to NPP construction could have sequestered 78,000 t C given the life period of 65 years for both the construction and operation of Generation III NPPs.
Remote sensing is a feasible vegetation monitoring means, which is vital for the sustainability of NPPs (Lu et al., 2018). NPP construction and operation could result in vegetation carbon loss at the construction site and in the proximity of the plant. Such carbon loss should be evaluated using remote sensing techniques (Figure 5). At the construction stage, remote sensing contributes to the siting and site evaluation process, aiming to identify the land use type and avoid unacceptable environmental impacts (Baskurt and Aydin, 2018). During the operation period, medium-resolution satellite remote sensing sources could be used via continuous monitoring to compare the vegetation biomass and biomass carbon sink around the plant to past conditions at the same location (Chen et al., 2019). The application of remote sensing as a supplement to the methodology of carbon accounting for NPPs is essential to comprehensively evaluate the effects of NPPs on the regional carbon budget.
According to the land use data for Zhangzhou NPP Units 1 and 2 retrieved from the preliminary project research report and the carbon stock of respective ecosystems, including forestlands, grasslands, croplands, gardens and wetlands in Fujian Province 2015, the carbon emissions due to vegetation loss resulting from NPP construction were estimated (Table 3) (National Development and Reform Commission NDRC and National Bureau of Statistics of China NBSC, 2022). The direct carbon loss results from vegetation deterioration during preliminary NPP construction, while the potential carbon loss is the carbon sequestration potential of the destroyed vegetation during the operation period of NPPs (60 years). The total carbon emissions resulting from vegetation loss during NPP construction and operation reached 842.6 t CO2, 84.91% of which was the potential carbon loss during the operation period.
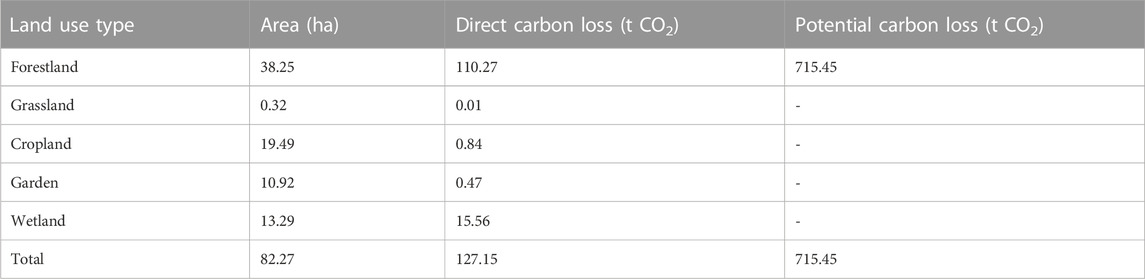
TABLE 3. Vegetation carbon loss due to NPP construction.
6.3 Embodied carbon emissions from equipment manufacturing
In this section, we investigate the embodied carbon emissions in equipment manufacturing based on a whole life-cycle perspective and quantitatively assess the embodied carbon emissions by constructing a top-down IO-LCA model. This method can achieve comprehensive assessment of carbon emissions accounting. Previous studies of carbon emissions of NPPs did not involve emissions resulting from equipment manufacturing, which should also be considered. Adopting China’s Zhangzhou NPP Units 1 and 2 as an example, the number of process equipment and valves in the nuclear island reaches over 1,600 and 8,500, respectively. Moreover, much utility equipment is required for instrumentation and control (I&C), ventilation, power supply, communication and fire production. It is difficult to count the detailed energy and material consumption levels for each equipment manufacturing process. Therefore, it is unreasonable to use the PCA method in this case. As mentioned in Section 4, the IO method can be adopted to estimate the carbon emissions resulting from equipment manufacturing. The emissions resulting from equipment manufacturing can be calculated via the equipment procurement expenses and the carbon emission coefficient values of the corresponding sectors (Liu et al., 2020; Li et al., 2021).
The IO-LCA model requires data derived from national or regional IO tables, which greatly reduces the difficulty of data acquisition over the bottom-up life-cycle method (PCA) (Wang et al., 2022). To ensure consistency with China’s 42-sector classification of the national IO table in 2017 (National Bureau of Statistics of China, 2018; National Bureau of Statistics of China, 2020), we used the 42-sector IO table for Fujian Province in the calculation process. According to the 2017 IO table of Fujian Province, the equipment used in NPPs can be categorized into 5 corresponding sectors, namely, the manufacture of ordinary machinery, equipment for special purposes, electric equipment and machinery, electronic and telecommunications equipment, and instruments and meters. Detailed formulas of the model are presented in the Supplementary Materials.
Figure 6 shows our estimated embodied carbon emissions of equipment manufacturing in the respective sectors based on the nuclear island (NI), balance of plant (BOP), conventional island (CI) and preliminary engineering (PE) categories. The total embodied carbon emissions resulting from equipment manufacturing of Zhangzhou NPP Units 1 and 2 reached 1,048.18 Gg CO2 of which the NI, BOP, CI and PE emissions accounted for 59.26%, 13.09%, 27.13% and 0.53%, respectively. NI is the core part of NPPs and embodies important systems, including nuclear reactors, reactor cooling systems, reactor fuel storage systems, specialized safety systems and nuclear auxiliary systems (Zhou, 2012). Further focusing on the NI emission mix, the emissions of equipment for special purposes accounted for 72.16% of the total NI emissions (Figure 6). The equipment for special use in the NI category normally involves the use of specialized steel (for instance, the material of the reactor pressure vessel is 16MND5) with high safety standards, leading to energy-intensive properties (Zhu et al., 2022). The manufacturing of such special equipment in NI involves higher energy, material and labor inputs, and thus, the emission intensity of equipment for special purposes is approximately 70.1 kg CO2/103 RMB.
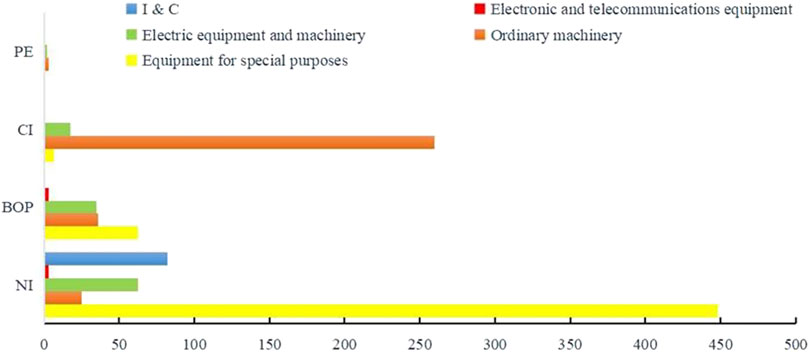
FIGURE 6. Embodied carbon emissions of equipment manufacturing in each sector (Gg CO2).
Regarding the whole NPP, the emissions of equipment for special purposes and ordinary machinery constitute the two largest parts, accounting for 49% and 31%, respectively, of the total emissions (Figure 7), followed by the emissions originating from electric equipment and machinery, I & C and electronic and telecommunications equipment.
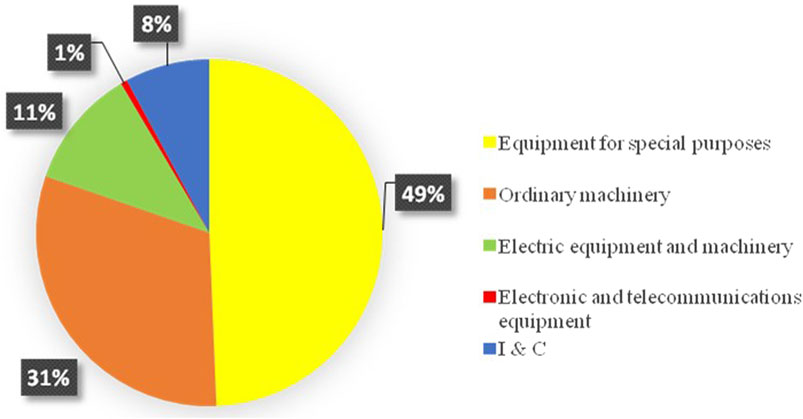
FIGURE 7. Emission composition of equipment manufacturing.
6.4 Embodied carbon emissions from labor
During NPP construction and operation, a portion of the resources and materials is consumed to sustain workers and staff. Thus, the emissions resulting from labor should also be considered. The annual carbon emissions of China’s labor use are 3.63 tons CO2/capita (Liu et al., 2020). More specifically, Qu et al. (2018) reported annual carbon emissions in different regions of China. The yearly emissions of labor use in southeastern China, where most Chinese NPPs are located, reached 3.2 tons CO2/capita.
Labor use at NPPs mainly includes four parts: personnel of the owner of the NPP for the preparation of operations and startups, staff of general contractors supplying support for NPP construction, workers of the construction unit and staff of the owner of the NPP for its operation. According to the construction experience of Zhangzhou NPP Units 1 and 2, the total labor inputs of the NPP owner for the preparation of operations and startups were 1,941 and 522 individuals, respectively (Xu, 2020a; 2020b). The number of personnel contributed by the general contractor during NPP construction was 1,094 individuals (Xu, 2020c). Construction of NPPs is labor intensive, and the total labor input for civil engineering and installation is 14,000 individuals (Wang, 2016; Xu, 2020c). The number of staff members committing to operation is 800 individuals (Xing, 2020). Figure 8 shows the embodied carbon emissions of the labor input at the different stages for NPP construction and operation. The total personnel emissions reached 183,882 t CO2 and the emissions during the operation period were prominent, accounting for 83.53% of the total labor emissions due to the continuous labor input during 60 years of operation. The personnel emissions resulting from the other phases were minor relative to the operation phase.
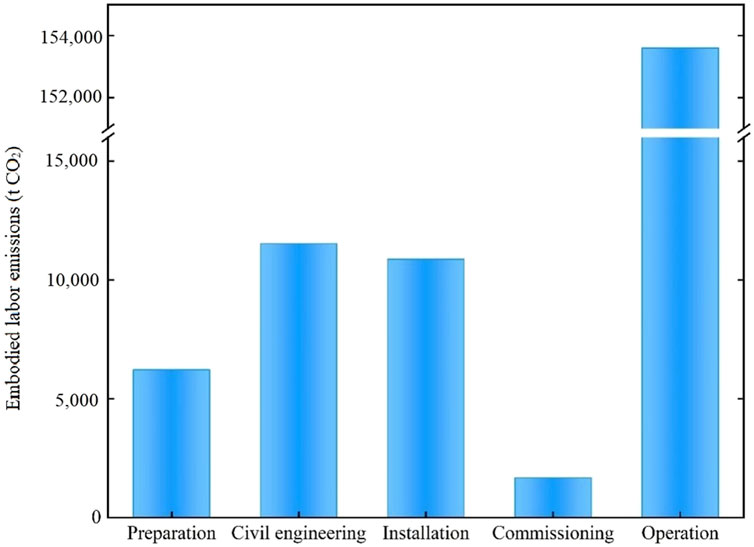
FIGURE 8. Embodied labor emissions at the respective stages for the construction and operation of NPPs.
6.5 Mitigation capability and economic competitiveness of HPR1000
The life-cycle power generation of Zhangzhou NPP Units 1 and 2 is 947 × 103 GWh, and the emission intensity of the abovementioned emissions during construction and operation is 1.31 g CO2/kWh. Compared to the reviewed studies of PWR emissions resulting from construction and operation, our result is lower, indicating the notable mitigation capability of China’s Generation III NPPs.
The unit capital cost of Zhangzhou NPP Units 1 and 2 ranges from 16,000 to 17,000 RMB/kW (2,247∼2,388 $/kW), which is 10%∼18% lower than that of other Generation III NPPs, including AP1000 reactors and EPRs (Liang, 2017). The economic competitiveness and notable mitigation capability of this nuclear technology could promote the popularity of HPR1000, especially the export of such technology to regional developing countries under major international initiatives (Kocak et al., 2023). Cárdenas et al. (2023) revealed that the current high cost of nuclear electricity generation over wind power is disadvantageous for nuclear power grid penetration. Research and development of new equipment as well as redundancy design concepts for first-of-a-kind (FOAK) units could result in high equipment procurement costs, accounting for 40–50% of the total construction cost of Zhangzhou NPP Units 1 and 2 (Liu et al., 2022). With the design optimization and technological maturity of nth-of-a-kind (NOAK) units, the investment of HPR1000 could be lowered. As China’s dominant reactor type in the future with competitive economics, the increased participation of HPR1000 could play a very significant role in reducing carbon emissions resulting from electricity generation (Pereira and Posen, 2020).
7 Conclusions and implications
In this paper, we critically reviewed carbon emissions of NPPs. The results showed that the carbon emissions of LWRs, PWRs, BWRs, HWRs, FRs, FBRs, and GCRs are 6∼60, 2∼337.42, 11∼24.2, 3.2∼66, 9∼46.52, 2.33∼6.26, and 8.35 g CO2/kWh, respectively. The disparity of the review results originates from the varying emissions at the respective stages of the nuclear fuel cycle, technology choices at each stage and adopted accounting methods and boundaries. Within the nuclear fuel cycle, the emissions at the front end, including mining, milling and enrichment, are prominent. Implementing the TTC strategy is advantageous in carbon mitigation in the front end without exerting unfavorable impacts on the total cost of nuclear power generation. Emissions resulting from NPP construction and operation are underestimated due to the limited accounting methods and lack of detailed input data. An integrated CACO-NPP framework was proposed to comprehensively evaluate carbon emissions resulting from NPP construction and operation. Adopting China’s Generation III NPP with the latest technology HPR1000 as a case study, we applied the CACO-NPP framework to estimate the emissions resulting from vegetation deterioration, equipment manufacturing and labor input, which were not considered in previous studies. The total emissions of these sources reached 1,232.91 Gg CO2 with a carbon intensity of 1.31 gCO2/kWh. Considering its competitive techno-economic characteristics over other mainstream Generation III NPPs, HPR1000 is both affordable in supplying base-load electricity and conducive to reducing China’s carbon emissions. As China’s future dominant nuclear power reactor, with its technological maturity and successive design improvements, the carbon emissions of HPR1000 reactors could be further reduced, playing a more vital role in realizing China’s dual carbon goal.
It is imperative to adopt measures in the nuclear fuel cycle to decrease emissions and improve the true emission reduction capability of NPPs. Underground excavation or in situ leaching is advocated for uranium mining and milling, while gas centrifugation is more “carbon friendly” than gas diffusion in the enrichment process. Moreover, the source of electricity for NPPs is very important, especially for energy-intensive processes, including mining, milling and enrichment. Furthermore, as mentioned in Section 6, much materials, energy and personnel are needed in NPP construction and operation, and the mitigation capability of NPPs could be elevated by implementing measures in the NPP construction and operation process. During the preconstruction period, the potential vegetation carbon loss should be considered during site selection, while during the construction period, the amount of materials and energy used could be lowered by reducing design redundancy, conducting design optimization, and narrowing the construction period. Moreover, during the operation period, 5G technology and artificial intelligence (AI) are recommended to empower the digital transformation of NPPs so that they can be operated much smarter with lower personnel dependence and emissions accordingly.
The TTC mode is ecologically friendlier than the OTC mode due to the lower energy consumption and corresponding carbon emissions in the front end. Moreover, although reprocessing is involved, there are no unfavorable economic impacts on the power generation costs in the TTC strategy. Since global nuclear power development could result in an increasing uranium resource demand (Gao and Ko, 2014), adopting the TTC strategy could contribute to both nuclear and ecological sustainability, which is also a feasible path for nuclear development in China within the context of its commitment to emission mitigation and promoting nuclear power generation.
China has committed itself to achieving the carbon peaking and neutrality targets through electricity and clean substitution efforts. Nuclear power is a viable option for China to pursue such ambitions with notable disincentive effects on carbon emissions and without negative impacts on the national economy (Liu et al., 2022b; Wang et al., 2023b). As of the end of 2021, China was home to 53 NPPs with a total electricity generation of 407.14 billion kWh (Department of Energy Statistics and National Bureau of Statistics, 2021), accounting for approximately 15% of the total non-fossil fuel power generation (The State Council Information Office of the People’s Republic of China, 2021; Zhang et al., 2021). It is expected that nuclear power generation will reach 970∼1,000 billion kWh in 2030 (Wen and Diao, 2022). Since PWRs will remain the dominant nuclear power reactor type in China for the foreseeable future, according to the reviewed average carbon emissions originating from PWRs (42.94 g CO2/kWh) as well as the carbon emissions resulting from fossil energy use in China (900∼1,000 g CO2/kWh) (Xuan, 2020), the substitution of nuclear power with fossil electricity could reduce emissions by approximately 349∼390 Tg CO2 and 831∼957 Tg CO2 at present and by 2030, respectively. Based on the latest report of China’s National Greenhouse Gas Inventory, the total carbon emissions reached 12.3 billion tons CO2 (Wei et al., 2015). The mitigation capability of NPPs could counteract 3% of China’s total carbon emissions in 2021, which could increase to 8% in 2030. Therefore, nuclear power has a very high potential for emission reduction and could contribute to the realization of China’s carbon peaking and neutrality targets.
Author contributions
BL, BP, JH, XS, and PJ reviewed the carbon emissions of NPPs and identified the influencing factors. BL, FL, and MB established the CACO-NPP framework. LZ, WL, YZ, and XZ accounted for carbon emissions resulting from equipment manufacturing, vegetation carbon loss and labor input. BL, GL, FL, BP, and LZ wrote the manuscript. All authors contributed to the article and approved the submitted version.
Funding
Financial support was provided by the R&D project of China Nuclear Power Engineering Co., Ltd. (KY22246), National Natural Science Foundation of China (71904141, 72174192), Research Center for Eco-Environmental Sciences, Chinese Academy of Sciences (RCEES-TDZ-2021-8), and Major Research Program of Hebei Province Grants (21373902D).
Conflict of interest
Authors BL, JH, MB, XS, and YZ were employed by the company China Nuclear Power Engineering Co., Ltd.
The authors declare that this study received funding from China Nuclear Power Engineering Co., Ltd. The funder had the following involvement in the study design, data collection and analysis, decision to publish.
The remaining authors declare that the research was conducted in the absence of any commercial or financial relationships that could be construed as a potential conflict of interest.
Publisher’s note
All claims expressed in this article are solely those of the authors and do not necessarily represent those of their affiliated organizations, or those of the publisher, the editors and the reviewers. Any product that may be evaluated in this article, or claim that may be made by its manufacturer, is not guaranteed or endorsed by the publisher.
Supplementary material
The Supplementary Material for this article can be found online at: https://www.frontiersin.org/articles/10.3389/fenrg.2023.1147016/full#supplementary-material
References
Acheampong, M., Ertem, F. C., Kappler, B., and Neubauer, P. (2017). In pursuit of sustainable development goal (SDG) number 7: Will biofuels be reliable? Renew. Sustain. Energy Rev. 75, 927–937. doi:10.1016/j.rser.2016.11.074
Alawneh, R., Ghazali, F. E. M., Ali, H., and Asif, M. (2018). Assessing the contribution of water and energy efficiency in green buildings to achieve United Nations Sustainable Development Goals in Jordan. Build. Environ. 146, 119–132. doi:10.1016/j.buildenv.2018.09.043
Ali, Y., Pretaroli, R., Socci, C., and Severini, F. (2018). Carbon and water footprint accounts of Italy: A multi-region input-output approach. Renew. Sustain. Energy Rev. 81, 1813–1824. doi:10.1016/j.rser.2017.05.277
Andseta, S., Thompson, M. J., Jarrell, J. P., and Pendergast, D. R. “CANDU reactors and greenhouse gas emissions,” in Proceedings of the 11th Pacific Basin Nuclear Conference, Banff, Canada, May, 1998 (Canadian Nuclear Association, Toronto), 3–7.
Anshassi, M., Sackles, H., and Townsend, T. G. (2021). A review of LCA assumptions impacting whether landfilling or incineration results in less greenhouse gas emissions. Resour. Conserv. Recycl. 174, 105810. doi:10.1016/j.resconrec.2021.105810
Atz, M. I., and Fratoni, M. (2023). Estimation of waste package inventories and characteristics from different advanced fuel cycles. Nucl. Technol. 209, 677–695. doi:10.1080/00295450.2022.2146475
Baskurt, Z. M., and Aydin, C. C. (2018). Nuclear power plant site selection by weighted linear combination in GIS environment, Edirne, Turkey. Prog. Nucl. Energy. 104, 85–101. doi:10.1016/j.pnucene.2017.09.004
Beerten, J., Laes, E., Meskens, G., and D’haeseleer, W. (2009). Greenhouse gas emissions in the nuclear life cycle: A balanced appraisal. Energy Policy 37, 5056–5068. doi:10.1016/j.enpol.2009.06.073
Bodi, J., Ponomarev, A., and Mikityuk, K. (2022). Analysis of sodium boiling initiated by unprotected loss of flow in European sodium fast reactor core with different subassembly designs. Nucl. Eng. Des. 399, 112014. doi:10.1016/j.nucengdes.2022.112014
Cárdenas, B., Ibanez, R., Rouse, J., Swinfen-Styles, L., and Garvey, S. (2023). The effect of a nuclear baseload in a zero-carbon electricity system: An analysis for the UK. Renew. Energy. 205, 256–272. doi:10.1016/j.renene.2023.01.028
Chen, Y., Guerschman, J. P., Cheng, Z., and Guo, L. (2019). Remote sensing for vegetation monitoring in carbon capture storage regions: A review. Appl. Energy. 240, 312–326. doi:10.1016/j.apenergy.2019.02.027
Cui, L., Du, H., Shi, J., Chen, Z., and Guo, W. (2016). Spatial and temporal pattern of vegetation NPP and its relationship with climate in the southeastern China. Sci. Geogr. Sin. 36, 787–793. doi:10.13249/j.cnki.sgs.2016.05.018
Department of Energy Statistics, , and National Bureau of Statistics, (2021). China energy statistical Yearbook. Beijing, China: China Statistics Press.
Dones, R., Heck, T., Emmenegger, M. F., and Jungbluth, N. (2005). Life cycle inventories for the nuclear and natural gas energy systems, and examples of uncertainty analysis (14 pp). Int. J. Life Cycle Assess. 10, 10–23. doi:10.1065/lca2004.12.181.2
Dones, R., Heck, T., and Hirschberg, S. (2004). Greenhouse gas emissions from energy systems, comparison, and overview. Encycl. Anthr. 3, 77–95. doi:10.1016/B0-12-176480-X/00397-1
Dones, R., Heck, T., and Hirschberg, S. (2004a). Greenhouse gas emissions from energy systems, comparison and overview. Encycl. Energy. 3, 77–95. doi:10.1016/B0-12-176480-X/00397-1
Dones, R., Zhou, X., and Tian, C. (2004b). Life Cycle Assessment (LCA) of Chinese energy chains for Shandong electricity scenarios. Int. J. Glob. Energy Issues. 22, 199–224. doi:10.1504/ijgei.2004.005894
Ehmsen, S., Yi, L., and Aurich, J. C. (2021). Process chain analysis of directed energy deposition: Energy flows and their influencing factors. Procedia CIRP 98, 607–612. doi:10.1016/j.procir.2021.01.162
Fthenakis, V. M., and Kim, H. C. (2007). Greenhouse-gas emissions from solar electric- and nuclear power: A life-cycle study. Energy Policy 35, 2549–2557. doi:10.1016/j.enpol.2006.06.022
Gao, F., and Ko, W. I. (2014). Modeling and system analysis of fuel cycles for nuclear power sustainability (I): Uranium consumption and waste generation. Ann. Nucl. Energy. 65, 10–23. doi:10.1016/j.anucene.2013.10.014
Guan, Y., Shan, Y., Huang, Q., Chen, H., Wang, D., and Hubacek, K. (2021). Assessment to China's recent emission pattern shifts. Earth's Future. 9, e2021EF002241. doi:10.1029/2021ef002241
Gungor, G., and Sari, R. (2022). Nuclear power and climate policy integration in developed and developing countries. Renew. Sustain. Energy Rev. 169, 112839. doi:10.1016/j.rser.2022.112839
Gunnarsdottir, I., Davidsdottir, B., Worrell, E., and Sigurgeirsdottir, S. (2021). Sustainable energy development: History of the concept and emerging themes. Renew. Sustain. Energy Rev. 141, 110770. doi:10.1016/j.rser.2021.110770
Guo, X., Zhang, X., Ren, D., and Lin, K. (2023). Research on risk management and control strategy of uranium resource procurement in China. Energy Sources A Recovery Util. Environ. Eff. 45, 4178–4194. doi:10.1080/15567036.2023.2203083
Hondo, H. (2005). Life cycle GHG emission analysis of power generation systems: Japanese case. Energy 30, 2042–2056. doi:10.1016/j.energy.2004.07.020
Ipcc, (2019). Refinement to the 2006 IPCC Guidelines for National Greenhouse Gas Inventories. Editors E. Calvo Buendia, K. Tanabe, A. Kranjc, J. Baasansuren, M. Fukuda, and S. Ngarize, Switzerland: IPCC).Published
Jiang, Z., Pan, Z., Xing, J., and Yu, F. (2015). Greenhouse gas emissions from nuclear power chain life cycle in China. China Environ. Sci. 35, 3502–3510. doi:10.3969/j.issn.1000-6923.2015.11.040
Ju, H., Zhuo, S., Liu, J., Chen, Z., Cui, H., Wang, Y., et al. (2022). Effects of long-term thermal aging on the microstructure and mechanical behaviors of 16MND5/Alloy 152 dissimilar metal weld. J. Mat. Res. Technol. 18, 3961–3970. doi:10.1016/j.jmrt.2022.04.086
Kadiyala, A., Kommalapati, R., and Huque, Z. (2016). Quantification of the lifecycle greenhouse gas emissions from nuclear power generation systems. Energies 9, 863. doi:10.3390/en9110863
Kim, S., Kim, K., Kim, J., Kim, G., Cho, D., and Bang, S. (2022). External cost analysis of nuclear fuel cycle comparing direct disposal and pyroprocessing in Korea. Nucl. Energy. 154, 104480. doi:10.1016/j.pnucene.2022.104480
Kocak, E., Ulug, E. E., and Oralhan, B. (2023). The impact of electricity from renewable and non-renewable sources on energy poverty and greenhouse gas emissions (GHGs): Empirical evidence and policy implications. Energy 272, 127125. doi:10.1016/j.energy.2023.127125
Krūmiņš, J., and Kļaviņš, M. (2023). Investigating the potential of nuclear energy in achieving a carbon-free energy future. Energies 16, 3612. doi:10.3390/en16093612
Kumari, S., and Rao, B. (2013). Electricity from nuclear power: Is it a solution to greenhouse gas emissions in India. Int. J. Sci. Technol. Res. 2, 242–247.
Lenzen, M., Dey, C., Hardy, C., and Bilek, M. (2006). “Life-cycle energy balance and greenhouse gas emissions of nuclear energy in Australia,”. Report to the Prime Minister’s Uranium Mining, Processing and Nuclear Energy Review (UMPNER) (Sydney, Australia: ISA, University of Sydney)
Lenzen, M. (2008). Life cycle energy and greenhouse gas emissions of nuclear energy: A review. Energy Convers. Manag. 49, 2178–2199. doi:10.1016/j.enconman.2008.01.033
Li, H., Luo, Z., Xu, X., Cang, Y., and Yang, L. (2021). Assessing the embodied carbon reduction potential of straw bale rural houses by hybrid life cycle assessment: A four-case study. J. Clean. Prod. 303, 127002. doi:10.1016/j.jclepro.2021.127002
Li, J., Sun, S., Sharma, D., Ho, M. S., and Liu, H. (2023). Tracking the drivers of global greenhouse gas emissions with spillover effects in the post-financial crisis era. Energy Policy 174, 113464. doi:10.1016/j.enpol.2023.113464
Li, X., Liao, H., Du, Y. F., Wang, C., Wang, J. W., and Liu, Y. (2018). Carbon dioxide emissions from the electricity sector in major countries: A decomposition analysis. Environ. Sci. Pollut. Res. 25, 6814–6825. doi:10.1007/s11356-017-1013-z
Liang, G. L. (2017). Research on the cost and control measures of HPR nuclear power engineering. Constr. Econ. 38, 66–68. doi:10.14181/j.cnki.1002-851x.201703066
Liu, B. J., Lai, X. F., Bo, M. F., Sun, L. W., Zhu, G. Z., Bu, Z. Y., et al. (2022). Study on the effect of “FOAK & single unit layout” on project costs in the demonstration project of China fast reactor 600. China Nucl. Power. 14, 831–834.
Liu, B., Zhang, L., Lu, F., Deng, L., Zhao, H., Luo, Y., et al. (2019). Greenhouse gas emissions and net carbon sequestration of the beijing-tianjin sand source control project in China. J. Clean. Prod. 225, 163–172. doi:10.1016/j.jclepro.2019.03.184
Liu, M., Yang, X., Wen, J., Wang, H., Feng, Y., Lu, J., et al. (2023). Drivers of China's carbon dioxide emissions: Based on the combination model of structural decomposition analysis and input-output subsystem method. Environ. Impact Assess. Rev. 100, 107043. doi:10.1016/j.eiar.2023.107043
Liu, S., Jiang, Y., Yu, S., Tan, W., Zhang, T., and Lin, Z. (2022b). Electric power supply structure transformation model of China for peaking carbon dioxide emissions and achieving carbon neutrality. Energy Rep. 8, 541–548. doi:10.1016/j.egyr.2022.10.085
Liu, Z.-H., Zhang, W.-M., Xiao, Z.-Y., Sun, J.-B., and Li, D. (2020). Research on extended carbon emissions accounting method and its application in sustainable manufacturing. Procedia Manuf. 43, 175–182. doi:10.1016/j.promfg.2020.02.132
Liu, Z., Lu, F., and Zhu, B. Q. (2022a). Climate Change strategy: China’s road to carbon neutrality. Zhengzhou, China: Henan Science and Technology Press.
Lu, F., Hu, H., Sun, W., Zhu, J., Liu, G., Zhou, W., et al. (2018). Effects of national ecological restoration projects on carbon sequestration in China from 2001 to 2010. Proc. Natl. Acad. Sci. U. S. A. 115, 4039–4044. doi:10.1073/pnas.1700294115
Ma, S., and Wang, R. S. (1984). The social-economic-natural complex ecosystem. Acta Ecol. Sin. 4, 1–9. doi:10.3321/j.issn:1000-8187.2001.01.003
Ma, Z. H., Pan, Z. Q., Xie, J. L., and Xiu, B. L. (2001). Study of greenhouse gases emission factor for nuclear power chain of China. Radiat. Prot. 21, 19–24.
Mark, D., and Peter, C. (2006). CO2 emissions from the nuclear fuel cycle. Sydney, Australia: Energyscience.org.
Naimoğlu, M. (2022). The impact of nuclear energy use, energy prices and energy imports on CO2 emissions: Evidence from energy importer emerging economies which use nuclear energy. J. Clean. Prod. 373, 133937. doi:10.1016/j.jclepro.2022.133937
National Bureau of Statistics of China, (2018). China statistical Yearbook. Beijing, China: China Statistics Press.
National Bureau of Statistics of China, (2020). Input-output tables of China 2017. Beijing, China: China Statistics Press.
National Development and Reform Commission (Ndrc), , and National Bureau of Statistics of China (Nbsc), (2022). Accounting regulations for the gross ecosystem product. Beijing, China: Renmin Press.
Nian, V., Chou, S. K., Su, B., and Bauly, J. (2014). Life cycle analysis on carbon emissions from power generation – The nuclear energy example. Appl. Energy. 118, 68–82. doi:10.1016/j.apenergy.2013.12.015
Nitschelm, L., Flipo, B., Auberger, J., Chambaut, H., Dauguet, S., Espagnol, S., et al. (2021). Life cycle assessment data of French organic agricultural products. Data Br. 38, 107356. doi:10.1016/j.dib.2021.107356
Opoku, A., Deng, J., Elmualim, A., Ekung, S., Hussien, A. A., and Abdalla, S. B. (2022). Sustainable procurement in construction and the realisation of the sustainable development goal (SDG) 12. J. Clean. Prod. 376, 134294. doi:10.1016/j.jclepro.2022.134294
Parker, D. J., Mnaughton, C. S., and Sparks, G. A. (2016). Life cycle greenhouse gas emissions from uranium mining and milling in Canada. Environ. Sci. Technol. 50, 9746–9753. doi:10.1021/acs.est.5b06072
Peng, H. M. (2021). “Research on site selection decision method of inland nuclear power plant based on Z-NUMBERS,”. master thesis (Hengyang, China: University of South China).
Pereira, L., and Posen, I. D. (2020). Lifecycle greenhouse gas emissions from electricity in the province of Ontario at different temporal resolutions. J. Clean. Prod. 270, 122514. doi:10.1016/j.jclepro.2020.122514
Poinssot, C., and Bourg, S. (2021). Assessment of the relative environmental footprint of nuclear energy and its fuel cycle. Encycl. Nucl. Energy., 675–683. doi:10.1016/b978-0-12-819725-7.00162-8
Poinssot, C., Bourg, S., Ouvrier, N., Combernoux, N., Rostaing, C., Vargas-Gonzalez, M., et al. (2014). Assessment of the environmental footprint of nuclear energy systems. Comparison between closed and open fuel cycles. Energy 69, 199–211. doi:10.1016/j.energy.2014.02.069
Pomponi, F., and Hart, J. (2021). The greenhouse gas emissions of nuclear energy – life cycle assessment of a European pressurised reactor. Appl. Energy. 290, 116743. doi:10.1016/j.apenergy.2021.116743
Pomponi, F., and Lenzen, M. (2018). Hybrid life cycle assessment (LCA) will likely yield more accurate results than process-based LCA. J. Clean. Prod. 176, 210–215. doi:10.1016/j.jclepro.2017.12.119
Pomponi, F., Li, M., Saint, R., Lenzen, M., and D'Amico, B. (2022). Environmental benefits of material-efficient design: A hybrid life cycle assessment of a plastic milk bottle. Sustain. Prod. Consum. 30, 1044–1052. doi:10.1016/j.spc.2022.01.028
Qu, J. S., Liu, L. N., Zeng, J. J., Zhang, Z. Q., Pei, H. J., Dong, L. P., et al. (2018). Household CO2 emissions: An assessment based a large sample survey in China. Chin. Sci. Bull. 63, 547–557. doi:10.1360/n972017-00765
Rashad, S. M., and Hammad, F. H. (2000). Nuclear power and the environment: Comparative assessment of environmental and health impacts of electricity-generating systems. Appl. Energy. 65, 211–229. doi:10.1016/s0306-2619(99)00069-0
Rawat, B. S., Pachchigar, V., and Desai, V. “Nuclear fission energy, a viable, carbon –free option for high base –load electricity, hydrogen production and desalination, while containing global temperature rise below 2°C,” in 2017 International Conference on Energy, Communication, Data Analytics and Soft Computing (ICECDS), Chennai, India, August, 2017 (IEEE), 3262–3265.
Santoyo-Castelazo, E., Gujba, H., and Azapagic, A. (2011). Life cycle assessment of electricity generation in Mexico. Energy 36, 1488–1499. doi:10.1016/j.energy.2011.01.018
Serp, J., Poinssot, C., and Bourg, S. (2017). Assessment of the anticipated environmental footprint of future nuclear energy systems. Evidence of the beneficial effect of extensive recycling. Energies 10, 1445. doi:10.3390/en10091445
Sovacool, B. K. (2008). Valuing the greenhouse gas emissions from nuclear power: A critical survey. Energy Policy 36, 2950–2963. doi:10.1016/j.enpol.2008.04.017
Sperow, M. (2020). Updated potential soil carbon sequestration rates on U.S. agricultural land based on the 2019 IPCC guidelines. Soil Tillage Res. 204, 104719. doi:10.1016/j.still.2020.104719
Tang, Q. H. (2021). Economic analysis of spent fuel reprocessing and direct disposal. thesis for senior engineer application (Beijing, China: China Nuclear Power Engineering).
Tang, Y., Zhu, S., Luo, Y., and Duan, W. (2022). Input servitization, global value chain, and carbon mitigation: An input-output perspective of global manufacturing industry. Econ. Model. 117, 106069. doi:10.1016/j.econmod.2022.106069
Taylor, R., Bodel, W., and Butler, G. (2022). A review of environmental and economic implications of closing the nuclear fuel cycle—part two: Economic impacts. Energies 15, 2472. doi:10.3390/en15072472
The Boston Consulting Group for Areva, (2006). Economic assessment of used nuclear fuel management in the United States. Boston, MA,USA: The Boston Consulting Group.
The State Council Information Office of the People’s Republic of China, (2021). Responding to climate Change: China’s policies and actions. Beijing, China: Renmin Press.
Tokimatsu, K., Hondo, H., Ogawa, Y., Okano, K., Yamaji, K., and Katsurai, M. (2000). Energy analysis and carbon dioxide emission of Tokamak fusion power reactors. Fusion Eng. Des. 48, 483–498. doi:10.1016/s0920-3796(00)00157-5
Tokimatsu, K., Kosugi, T., Asami, T., Williams, E., and Kaya, Y. (2006). Evaluation of lifecycle CO2 emissions from the Japanese electric power sector in the 21st century under various nuclear scenarios. Energy Policy 34, 833–852. doi:10.1016/j.enpol.2004.08.011
van Leeuwen, J. W. S., and Smith, P. B. (2007). Nuclear power–the energy balance. Netherlands: Ceedata Consultancy.
Voorspools, K. R., Brouwers, E. A., and D'Haeseleer, W. D. (2000). Energy content and indirect greenhouse gas emissions embedded in ‘emission-free’ power plants: Results for the low countries. Appl. Energy. 67, 307–330. doi:10.1016/s0306-2619(00)00016-7
Wang, C., Raza, S. A., Adebayo, T. S., Yi, S., and Shah, M. I. (2023a). The roles of hydro, nuclear and biomass energy towards carbon neutrality target in China: A policy-based analysis. Energy 262, 125303. doi:10.1016/j.energy.2022.125303
Wang, J. B. (2016). “Study on multi project human resources development during nuclear power installation engineering in CNI23,”. master thesis (Nanning, China: Guangxi University).
Wang, Q., Guo, J., Li, R. R., and Jiang, X. T. (2023b). Exploring the role of nuclear energy in the energy transition: A comparative perspective of the effects of coal, oil, natural gas, renewable energy, and nuclear power on economic growth and carbon emissions. Environ. Res. 221, 115290. doi:10.1016/j.envres.2023.115290
Wang, R. S., and Ouyang, Z. Y. (2012). Social-economic-natural complex ecosystem and sustainability. Bull. Chin. Acad. Sci. 27, 337–345. doi:10.3969/j.issn.1000-3045.2012.03.012
Wang, Y., Xiong, S., and Ma, X. (2022). Carbon inequality in global trade: Evidence from the mismatch between embodied carbon emissions and value added. Ecol. Econ. 195, 107398. doi:10.1016/j.ecolecon.2022.107398
Warner, E. S., and Heath, G. A. (2012). Life cycle greenhouse gas emissions of nuclear electricity generation. J. Ind. Ecol. 16, S73–S92. doi:10.1111/j.1530-9290.2012.00472.x
Wei, W., Ren, X. B., Cai, Z. C., Hou, Q. L., Liu, Y., and Li, Q. Q. (2015). Research on China’s greenhouse gas emission——Progress on emission inventory from the CAS strategic priority research program. Bull. Chin. Acad. Sci. 30, 839–847.
Wen, L., and Diao, P. (2022). Simulation study on carbon emission of China's electricity supply and demand under the dual-carbon target. J. Clean. Prod. 379, 134654. doi:10.1016/j.jclepro.2022.134654
White, S. W., and Kulcinski, G. L. (2000). Birth to death analysis of the energy payback ratio and CO2 gas emission rates from coal, fission, wind, and DT-fusion electrical power plants. Fusion Eng. Des. 48, 473–481. doi:10.1016/s0920-3796(00)00158-7
Wu, J., Fu, Q., Sial, M. S., Pavel, C. D., Samad, S., and Matac, L. M. (2022a). Causal relationship between nuclear energy, carbon-di-oxide emission and economic growth. Empirical evidence from China. Front. Energy Res. 10, 993818. doi:10.3389/fenrg.2022.993818
Wu, J., Zou, C., Yu, C., Cai, X., and Chen, J. (2022b). Study of natural uranium utilization in a heavy water moderated molten salt reactor. Prog. Nucl. Energy. 146, 104144. doi:10.1016/j.pnucene.2022.104144
Xi, J. P. (2022). “Hold high the great banner of socialism with Chinese characteristics and strive in unity to build a modern socialist country in all respects,”. Report to the 20th National Congress of the Communist Party of China (Beijing, China: People's Publishing House)
Xing, J., and Wu, L. (2020). HPR1000: China’s advanced pressurized water reactor NPP. Beijing, China: Science Press.
Xiong, S., Wang, Y., Bai, B., and Ma, X. (2021). A hybrid life cycle assessment of the large-scale application of electric vehicles. Energy 216, 119314. doi:10.1016/j.energy.2020.119314
Xu, P. F. (2020b). Innovation and practice of the demonstration project of HPR 1000 (commissioning). Beijing, China: China Atomic Energy Press.
Xu, P. F. (2020c). Innovation and practice of the demonstration project of HPR 1000 (construction). Beijing, China: China Atomic Energy Press.
Xu, P. F. (2020a). Innovation and practice of the demonstration project of HPR 1000 (project management). Beijing, China: China Atomic Energy Press.
Xuan, L. (2020). “Study on the spatial-temporal pattern and influencing factors of carbon emission intensity in thermal power industry,”. master thesis (Shanghai, China: Shanghai Jiao Tong University).
Yan, M., Sun, H., and Gu, K. (2022). Driving factors and key emission reduction paths of xinjiang industries carbon emissions: An industry chain perspective. J. Clean. Prod. 374, 133879. doi:10.1016/j.jclepro.2022.133879
Yang, C. L. (2016). The back-end of nuclear fuel cycle in China. Beijing, China: China Atomic Energy Press.
Yu, M., Wiedmann, T., and Langdon, S. (2021). Assessing the greenhouse gas mitigation potential of urban precincts with hybrid life cycle assessment. J. Clean. Prod. 279, 123731. doi:10.1016/j.jclepro.2020.123731
Zafrilla, J. E., Cadarso, M.-Á., Monsalve, F., and de la Rúa, C. (2014). How carbon-friendly is nuclear energy? A hybrid MRIO-LCA model of a Spanish facility. Environ. Sci. Technol. 48, 14103–14111. doi:10.1021/es503352s
Zhang, T. J., Xu, Q. C., and Wen, L. G. (2022). Research on the embedded carbon emissions of the Yangtze River Economic Belt based on multi-regional input-output model. Enterp. Econ., 142–151.
Zhang, T. K., Li, M. R., and Yin, W. P. (2021). The report on the development of China’s nuclear energy. Beijing, China: Social Sciences Academic Press.
Zhou, B., Li, Y., Ding, Y., Huang, G., and Shen, Z. (2023). An input-output-based bayesian neural network method for analyzing carbon reduction potential: A case study of guangdong province. J. Clean. Prod. 389, 135986. doi:10.1016/j.jclepro.2023.135986
Zhou, T. (2012). Systems and equipment in pressurized water reactor. Beijing, China: China Electric Power Press.
Keywords: nuclear power plants (NPPs), carbon emissions, CACO-NPP, HPR1000, carbon neutrality target
Citation: Liu B, Peng B, Lu F, Hu J, Zheng L, Bo M, Shang X, Liu W, Zhang Y, Zhou X, Jia P and Liu G (2023) Critical review of nuclear power plant carbon emissions. Front. Energy Res. 11:1147016. doi: 10.3389/fenrg.2023.1147016
Received: 07 February 2023; Accepted: 26 July 2023;
Published: 19 September 2023.
Edited by:
Hitesh Bindra, Kansas State University, United StatesReviewed by:
Anoop Singh, Ministry of Science and Technology, IndiaFarrukh Khalid, Indian Institute of Technology Guwahati, India
Copyright © 2023 Liu, Peng, Lu, Hu, Zheng, Bo, Shang, Liu, Zhang, Zhou, Jia and Liu. This is an open-access article distributed under the terms of the Creative Commons Attribution License (CC BY). The use, distribution or reproduction in other forums is permitted, provided the original author(s) and the copyright owner(s) are credited and that the original publication in this journal is cited, in accordance with accepted academic practice. No use, distribution or reproduction is permitted which does not comply with these terms.
*Correspondence: Li Zheng, emhlbmdsaV82NjhAMTI2LmNvbQ==; Gengyuan Liu, bGl1Z2VuZ3l1YW5AYm51LmVkdS5jbg==