 Arijit Ganguli
 Viraj Bhatt
- School of Engineering and Applied Science, Ahmedabad University, Ahmedabad, India
Hydrodynamics of fluidized beds with binary mixtures of particles is important in many industrial applications. The binary particles are generally in the Geldart particle range. In our earlier work, (Part I) of this work simulations were carried out and qualitative analysis was presented. Quantitative predictions of gas velocity and particle velocity profiles have been presented in the present work, which is Part II of the two-part work on computational fluid dynamics (CFD) simulations of binary fluidized beds. It was observed that the dynamics of the bed vary for different binary mixtures and are a strong function of superficial velocity and bed height. Mixing and segregation in beds for two different initial bed heights and six different binary mixtures and superficial velocities have been identified. Segregation is prominent for binary mixtures with 20 wt.% and 80 wt.% of large particles, whereas mixing is observed in 40 wt.% and 60 wt.% large particle mixtures. Bypassing of gas near the walls is prominently seen for 60 wt.% large particles with gas velocities as high as 5 m/s. Time-averaged axial particle volume fractions have been observed to be lower in the dilute phase with large undulations in the middle whenever the bed is well mixed for central axial profiles. The axial volume fraction profiles also confirm the mixing and segregation for the 40 wt.% and 20 wt.% composition of large particles for the operating conditions considered for the study. Bed height expansion is linear until a certain superficial velocity with the increase or decrease depending on the superficial velocity or bed height of operation. Furthermore, correlations for minimum fluidization velocity and pressure drops from the literature have been compared with experimental results. The simulated data have been considered for the development of a correlation for minimum fluidization velocity. The predicted results match experimental data with a 10%–15% deviation.
1 Introduction
Fluidized beds are one of the most important multiphase reactors having gas–solid, liquid–solid, or gas–liquid–solid flows. Some of the most common applications of fluidization include catalytic cracking and coal gasification. Hydrodynamics is critical for the good performance of fluidized beds because it involves spatial and temporal variation of the phases that affect the transport phenomena (heat and mass transfer characteristics). While unary fluidized beds have been extensively studied for many decades, binary fluidized beds continue to interest researchers. With the advent of computational fluid dynamics (CFD) and advanced experimental techniques to measure velocity and volume fraction distributions of both phases, researchers have conducted interesting studies on binary fluidized beds. Furthermore, an important aspect in binary particle-based fluidized beds is that the minimum fluidization velocity varies non-linearly with bottom or top particles in contrast to a uniformly sized bed, and the particle velocity increases with an increase in the superficial velocity. A comprehensive literature review on the work carried out by the various authors using experimental techniques (Čársky et al., 1987; Hoffmann et al., 1993; Chehbouni et al., 1994; Gauthier et al., 1999; Leu and Wu, 2000; Harris et al., 2002; Ellis et al., 2004; Chew et al., 2010; Mazzei et al., 2010; Rao et al., 2010; Jayarathna and Halvorsen, 2011; Sau and Biswal, 2011; Di Maio et al., 2012; Obuseh et al., 2012; Lan et al., 2014; Philippsen et al., 2015; Leion et al., 2018; Menéndez et al., 2019; Penn et al., 2019; Chew and Cocco, 2021; Emiola-Sadiq et al., 2021; Gupta and De, 2021) and mathematical modeling/CFD (Cooper and Coronella, 2005; Du et al., 2006; Gao et al., 2009; Pei et al., 2010; Zaabout et al., 2010; Chang et al., 2012; Mostafazadeh et al., 2013; Benzarti et al., 2014; Sahoo and Sahoo, 2016; Bakshi et al., 2017; Agrawal et al., 2018; Chang et al., 2019; Daryus et al., 2019; Khezri et al., 2019; Shrestha et al., 2019; Kotoky et al., 2020) has been presented in Part I of our work (Ganguli and Bhatt, 2023). In Part II (the present work), the major focus is to understand the prominent experimental works dealing with the gas and particle velocity distribution across the bed, along with prominent correlations on minimum fluidization velocity and pressure drop for binary fluidized beds in the published literature.
With the advent of the 21st century, researchers (Zhang et al., 2006) emphasized the need for studies on the bed dynamics of the Geldart B type of particles and binary mixtures. Furthermore, experimental studies on binary mixtures gained importance at the end of the 20th century (Noda et al., 1986; Chyang et al., 1989) because the bed dynamics differed from the single-particle beds. In fluidized beds with binary systems, the fraction that mostly forms the top layer of the bed or the one that floats is called the flotsam, and the one at the bottom layer or the one that sinks is called the jetsam. A major challenge in binary systems is that the beds reach equilibrium with either mixing or segregation of particles as two extremes. In applications like coal gasification, where synthetic gas (syngas) is the desired output, the segregation of particles may lead to the coal particles remaining unreacted, reducing the syngas yield (Roy et al., 2021). Furthermore, segregation is observed when binary mixtures of particles with varying densities are present in the bed, whereas mixing is observed when mixtures of varying sizes are present. In such beds, the bubbles rise through the center of the bed, and the rise velocity of the bubbles increases with the superficial velocity of the gas. Recently, interesting and significant progress in studies on bed dynamics of binary fluidized beds using experimental techniques for bubbling fluidized beds related to velocity distribution of bubble and solid particles (both flotsam and jetsam) have been carried out (Zhang et al., 2017; Kalo et al., 2019; Singh et al., 2019; Roy et al., 2021). The bed dynamics of fluidized beds with binary mixtures have been studied by advanced experimental techniques that include non-intrusive techniques like 1. electrical capacitance tomography (ECT) (Singh et al., 2019), 2. radioactive particle tracking (RPT) (Roy et al., 2021), 3. digital image analysis, 4. magnetic resonance imaging (MRI), and 5. positron emission particle tracking and intrusive techniques like 1. pressure probes for measuring pressure drops and quality of fluidization and 2. optical probes for measuring particle diameter, particle velocity, etc.
1.1 Experimental studies on fluidized beds involving unary and binary systems
Hoffmann et al. (1993) carried out experimental investigations in binary mixtures to study mixing and segregation behavior. A new empirical correlation was developed for bubble wake angles for Geldart B particles. The rate of material interchange between the wake of a rising bubble and the surrounding bubbles is independent of minimum fluidization velocity. The authors modeled mixing/segregation behavior in binary systems.
Singh et al. (2019) carried out mixing and segregation studies for unary and binary beds using ECT measurements to understand the temporal particle velocity and bubble size distribution in binary beds. The authors investigated the effect of different parameters like the same and different size ratios, namely, 96 μm, 430 μm, 922 μm, and 3,500 μm, on the hydrodynamics of beds with binary mixtures and unary beds of particle sizes 96 μm and 922 μm. The gas superficial velocity was varied in the range of 0.006–0.684 m/s. The authors found extremely novel and interesting facts on the dynamics of beds with binary mixtures in transient situations and segregating beds. Some salient features revealed were the characterization of segregated regions in the bed large diameter ratios (96 μm and 922 μm), the effect of bubbling behavior on segregation, and the effects of gas velocity and mixture composition on transient segregation of binary beds. The authors also found the importance of a higher amount of smaller particles in the reduction of segregation in beds. According to the authors, the data provided by their study would be helpful in building robust Eulerian–Eulerian CFD models for predicting dynamics of segregation and mixing in unary and binary fluidized beds.
Kalo et al. (2019) studied the dynamics of unary and binary fluidized conical beds using RPT composed of particle sizes of 0.6 and 1 mm, respectively. The authors found interesting results in terms of gas–solid and particle–particle interactions in conical beds using time-averaged quantities (mean and rms velocities). One of the major findings was the ability of conical beds to provide better mixing even at lower superficial velocities compared to cylindrical beds. Furthermore, the authors observed that gas–solid interactions played a vital role at the bottom while particle–particle interactions played an important role at the top in the dynamics of binary conical beds with 50–50 wt.% composition.
Gupta and De (2021) performed experimental measurements for a dual fluidized bed under a fast fluidization regime. The authors found that poly-disperse binary mixtures have different pressure profiles than unary (uniformly sized) sand particles with narrow particle size distribution. Segregation is high in the bubbling fluidized bed riser and decreases with increases in superficial velocities. Furthermore, the authors highlighted the influence of pressure drop on poly-disperse mixtures and presented an analytical model to justify their results. The authors also found that the trends of pressure drop with an increase in superficial velocities were similar to those of bubbling fluidized beds.
Roy et al. (2021) carried out experimental investigations to study bed dynamics in a binary fluidized bed with different particle sizes (0.5 and 2 mm sized particles). The authors found that with an increase in the 2 mm fraction from 10 wt.% to 40 wt.%, the computed bubble-rise velocity decreased, which in turn caused a decrease in the velocity of particles. This is in contrast to the results for a bed of uniformly sized particles (also termed a unary bed), where the influence of superficial velocity on bubble diameter and rise velocity has an increasing trend (Penn et al., 2019). In unary beds, as the ratio of superficial velocity (
1.2 Objective of the present work
The following points have been deduced from the literature review: 1. few numerical investigations on velocity and volume fraction distributions of both phases in binary fluidized beds exist, while experimental data for binary systems for bubbling fluidized beds are available using RPT and ECT. 2. Researchers have found that more than a 50 wt.% presence of small particles in a binary mixture caused changes in the axial profiles of particle holdup and abrupt changes in the bed height at the final steady state. 3. Few correlations predict minimum fluidization velocity and pressure drop for binary mixtures and Geldart B particles.
This study envisages the following numerical simulations using six different binary mixtures: 1. Characterization of the bubbling fluidized bed in terms of time-averaged mean gas and particle velocities (of both small and large particle sizes) in the bottom, middle, and dilute zones. 2. Characterization of bed dynamics in terms of time-averaged solid holdup in the axial direction. 3. Investigation of the effect of operating parameters like superficial velocity and initial bed height on bed dynamics (minimum fluidization velocity and pressure drop). 4. Development of correlations for minimum fluidization velocity and pressure drop for binary systems.
2 Numerical modeling
2.1 Models
Two-phase modeling has been performed using the Eulerian–Eulerian multiphase model coupled with an RNG k–ε model. The Syamlal et al. (1993) model was used for the modeling of granular viscosity, while the Syamlal and O’Brien (1987) model was used for modeling the drag of the system. The Schaeffer (1987) model (Schaeffer model) was used for simultaneous calculations of frictional pressure and viscosity. Granular bulk viscosity was modeled by the Lun et al. (1984) model; the Ahmadi and Ma (1990) model was used for simultaneous modeling of solids pressure and radial distribution. All the models and governing equations and various other parameters were kept the same in Ansys Fluent 18.1. A detailed description can be found in Ganguli and Bhatt (2023).
2.2 Geometry details
A 3D cylindrical geometry of height 1.4 m and diameter of 0.072 m was chosen for simulations. Figure 1A shows the 2D schematic of the geometry created in Ansys Fluent 18.1. Three different radial positions were used for collection of data, as shown in Figure 1A.
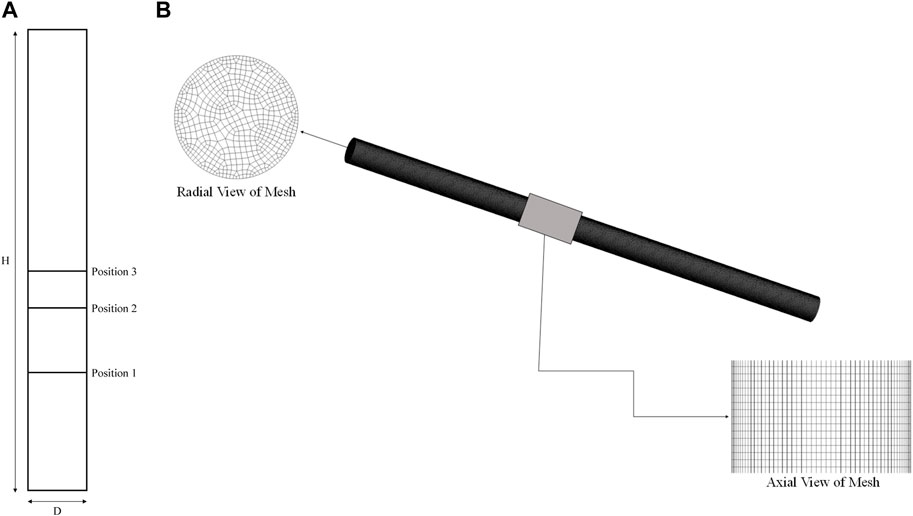
FIGURE 1. (A) Schematic of 2D plane (from Ansys Fluent 18.1) showing radial positions for data collection. (B) Different views of Mesh 2.
2.3 Material properties
Air as a fluid phase with a combination of glass particles as a solid phase is used in the system. The density of air is 1.22 kgm−3, and the dynamic viscosity is 0.000017 kgm−1s−1. The glass particles have a varying diameter between 154 μm (fine particles) and 488 μm (large particles) (with a size ratio of 3.2) based on the percentage of large particles in the mixture. The density of glass particles is 2,485 kgm−3, and the dynamic viscosity is 0.00082 kgm−1s−1. The phase properties have also been used for simulation purposes by Jayarathna and Halvorsen (2011).
2.4 Grid sensitivity
Figure 2 shows the radial gas velocity profile at Position 2 of Figure 1A for three different meshes. The mesh elements are as follows: Mesh 1 has 173,040 elements, Mesh 2 has 267,786 elements, and Mesh 3 has 497,568 elements. As the mesh number increases, the mesh refinement near the wall also increases. The error between Mesh 1 and Mesh 2 is 10%, while that between Mesh 2 and Mesh 3 is 2%. Therefore, Mesh 2 was used for further simulations. Figure 1A shows axial and radial views of Mesh 2. The mesh used is the same as the one used by Ganguli and Bhatt (2023).
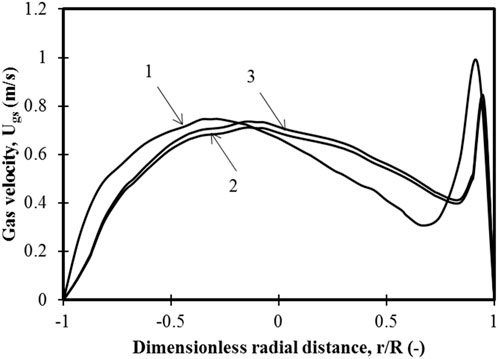
FIGURE 2. Variation in gas velocity for three different grids for Position 2 of Figure 1 at a steady state for superficial velocity of 0.3 m/s and 100 wt.% small particles of the binary mixture 1. 173,040 mesh elements, 2. 267,786 mesh elements, and 3. 497,568 mesh elements.
2.5 Simulation details
The solution method for all the simulations is the same as our previous work (Ganguli and Bhatt, 2023). Only a brief description is provided. The convergence criterion was kept as 10−3 for the continuity equation and 10−4 for the other equations. A first-order implicit scheme was used for the transient formations. Pressure–velocity coupling was achieved using the phase-coupled SIMPLE scheme. For the calculations of volume fraction, momentum, turbulent dissipation rate, and turbulent kinetic energy, the first-order upwinding scheme was used. Table 1 gives the details of the simulations about the mixture types, particle size, initial bed heights, and superficial gas velocities.
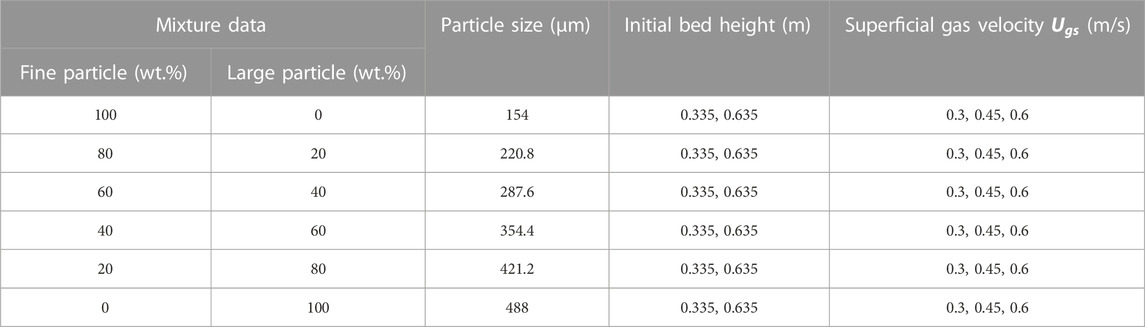
TABLE 1. Parametric data for the simulations.
3 Results and discussion
In this section, the gas and particle velocity profiles for both unary and binary beds have been presented for two bed heights and three superficial velocities for each bed height and all compositions. The velocity profiles (radial profiles) are presented at three different axial positions from the time-averaged data of 7 s. Furthermore, axial particle volume fraction profiles of the centerline are presented for two compositions for the superficial velocities and bed heights considered. An empirical correlation between pressure drop and minimum fluidization velocity has been obtained by regression of the data generated from the validated CFD model. All compositions referred to in the work are in weight percentage (wt.%).
3.1 Model validation
The validated model used in our previous work has been used (Ganguli and Bhatt, 2023). Further validation of the model for pressure drop has been performed with additional data available for the mixtures of 40 wt.% large particles and 60 wt.% large particles, while for work to determine the mean velocity distribution of small and large particles has been performed with the experimental data of Roy et al. (2021). For pressure drop predictions, simulations were performed for a bed with an initial bed height of 0.235 m, and the superficial gas velocity was varied in a range of
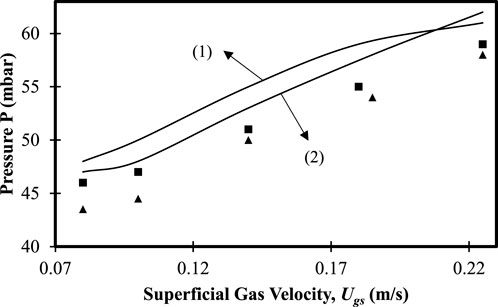
FIGURE 3. Variation in pressure drop as a function of gas superficial velocity (
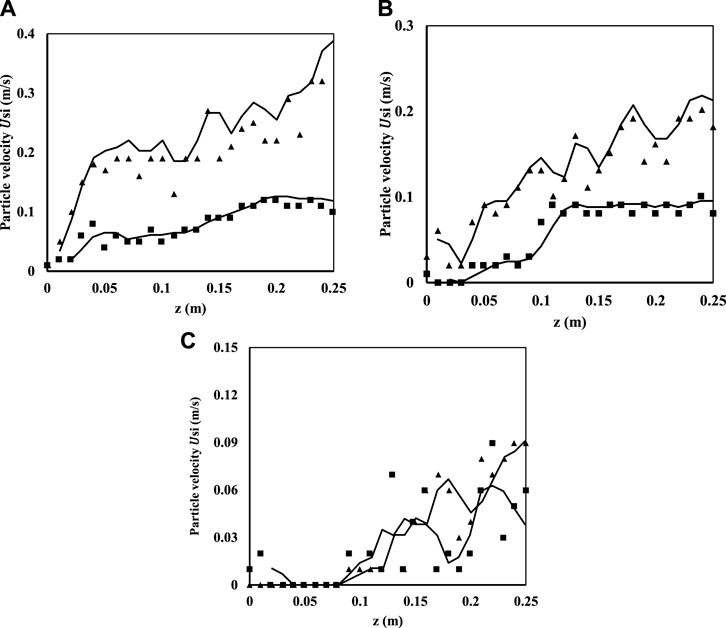
FIGURE 4. Comparison of model predictions with experimental data of Roy et al. (2021) for 10 wt.% large particles (2 mm size) and 90 wt.% small particles (0.5 mm size). (A)
3.2 Effect of mixture composition, superficial velocity, and bed height on gas and particle velocity profiles
The gas and particle dynamics for both small and large particles are quantified in the validated model by plotting each of the mean velocity profiles for all particle mixtures at three different superficial velocities for three different bed heights. For understanding, the dynamics of solid particle quantification have been further determined in the form of particle axial volume fraction profiles for the centerline. The axial locations at which the radial velocity profiles have been calculated are shown in Table 2.
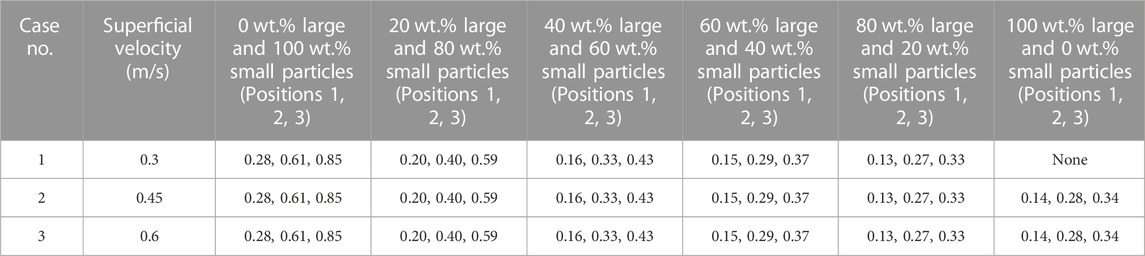
TABLE 2. Dimensionless axial locations for various superficial velocities for all binary mixtures.
The gas and particle velocity profiles at different axial locations for different superficial velocities and bed heights for the 20 wt.%, 40 wt.%, 60 wt.%, and 80 wt.% mixtures of large-sized particles are plotted in Figures 5–8, while those for the 0 wt.%, 80 wt.%, and 100 wt.% mixtures of large-sized particles are provided in the Supplementary Material because the main focus of the present work is understanding segregation and mixing in binary beds. Numbers have been used to denote the axial locations for the collection of axial velocity data in radial positions. The axial positions are chosen in the bottom, middle, and dilute zone based on the experimental data collection positions as per Jayarathna and Halvorsen (2011). Furthermore, the axial positions depend on the bed height considered. The axial positions and radial variations have been represented in dimensionless form for all figures. This is because the steady state bed height is different for different initial bed heights, and the axial positions are non-dimensionalized using the final steady state bed height. The mean gas and particle velocities have been time-averaged over 7 s before the results are presented. Similarly, the particle volume fractions for the vertical centerline of the bed have been presented after time-averaging. The size ratio has been considered constant as 3.2 for all simulations, and only compositions have been varied [binary mixtures having 0 wt.%, 20 wt.%, 40 wt.%, 60 wt.%, 80 wt.%, and 100 wt.% of large particles (488 μm), respectively].
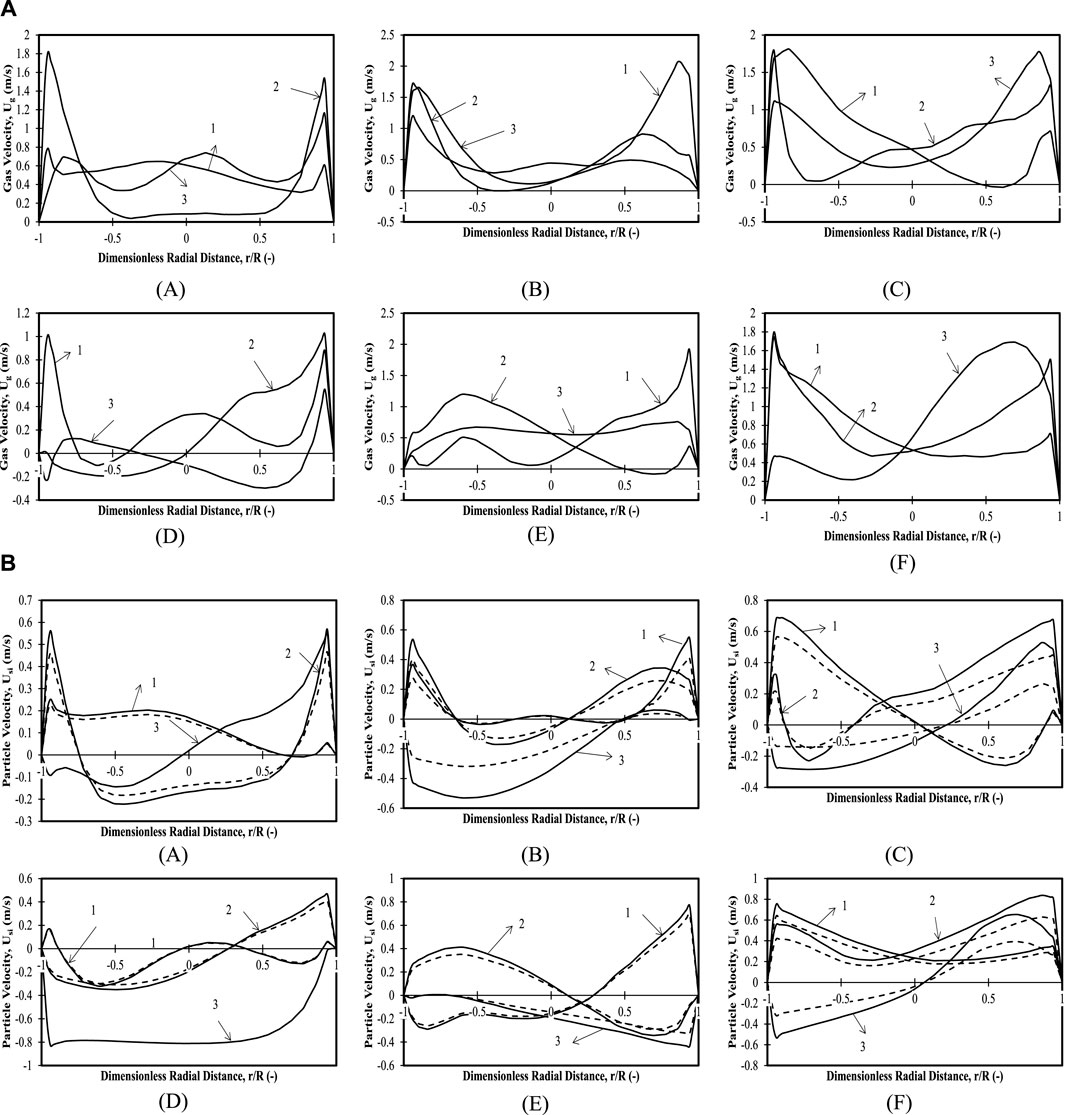
FIGURE 5. (A) Time-averaged mean axial gas velocity profiles for 20 wt.% large particles in mixture: 0.335 m (z/H = 0.24) initial bed height with (A)
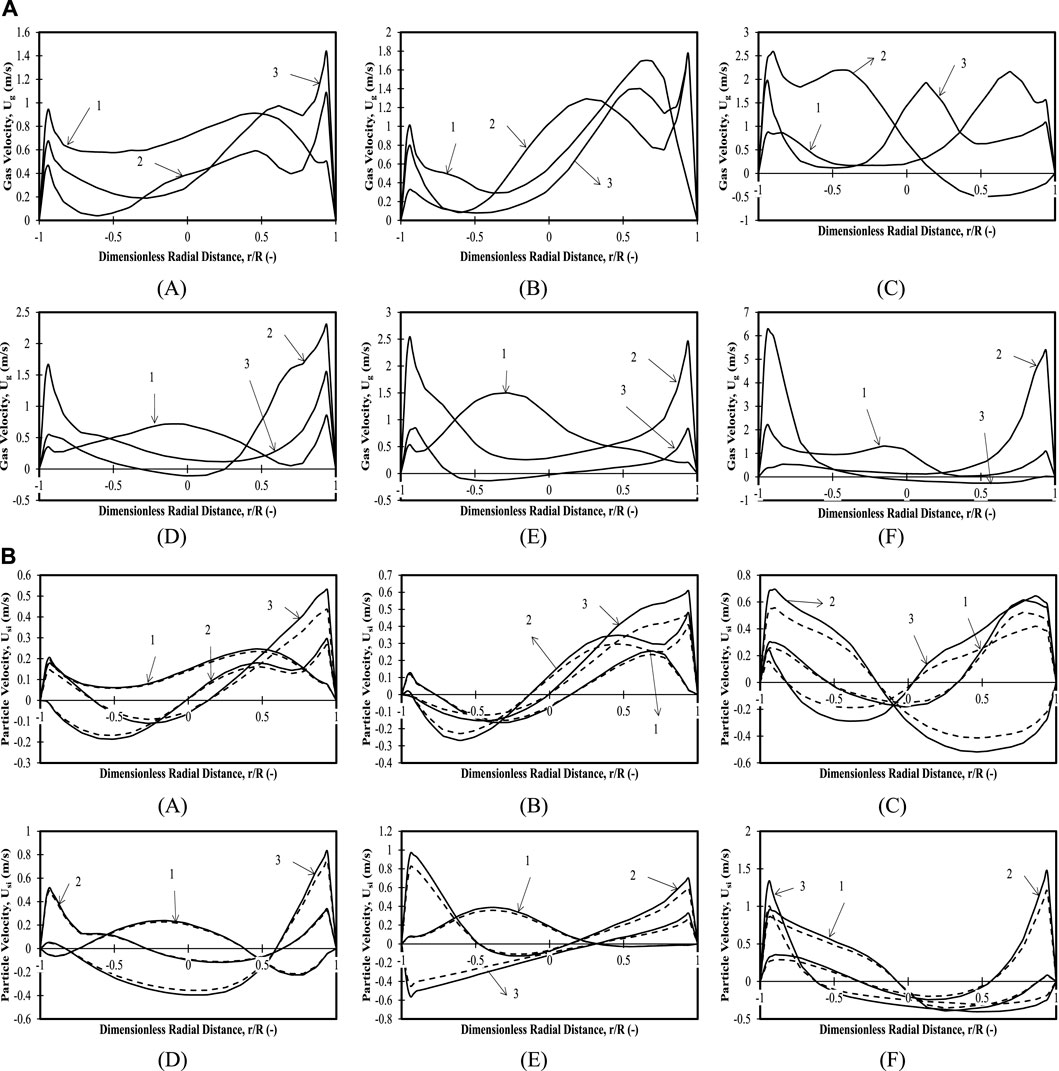
FIGURE 6. (A) Time-averaged mean axial gas velocity profiles for 40 wt.% large particles in the mixture and 0.335 m (z/H = 0.24) initial bed height with (A)
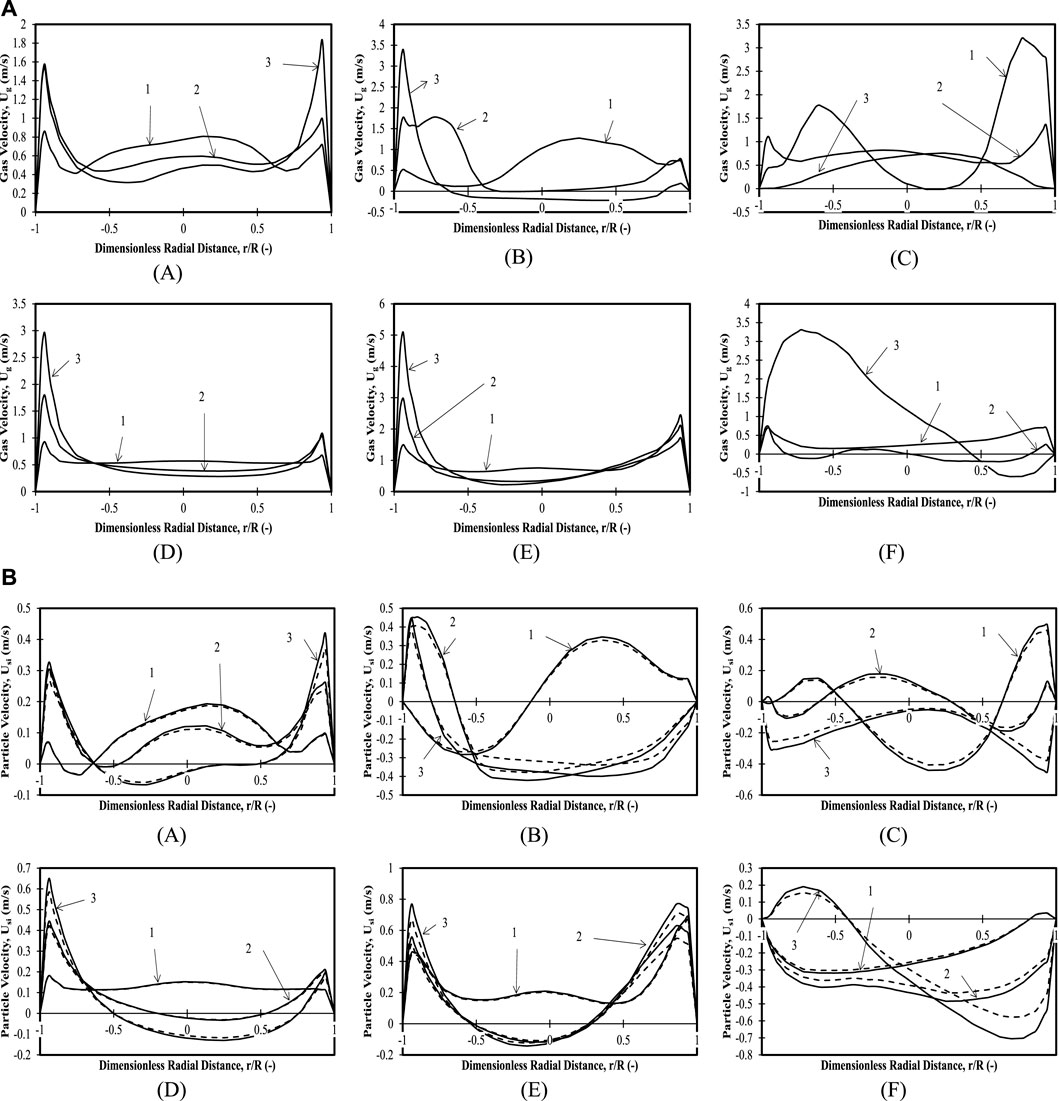
FIGURE 7. (A) Time-averaged mean axial gas velocity profiles for 60 wt.% mixture and 0.335 m (z/H = 0.24) initial bed height with (A)
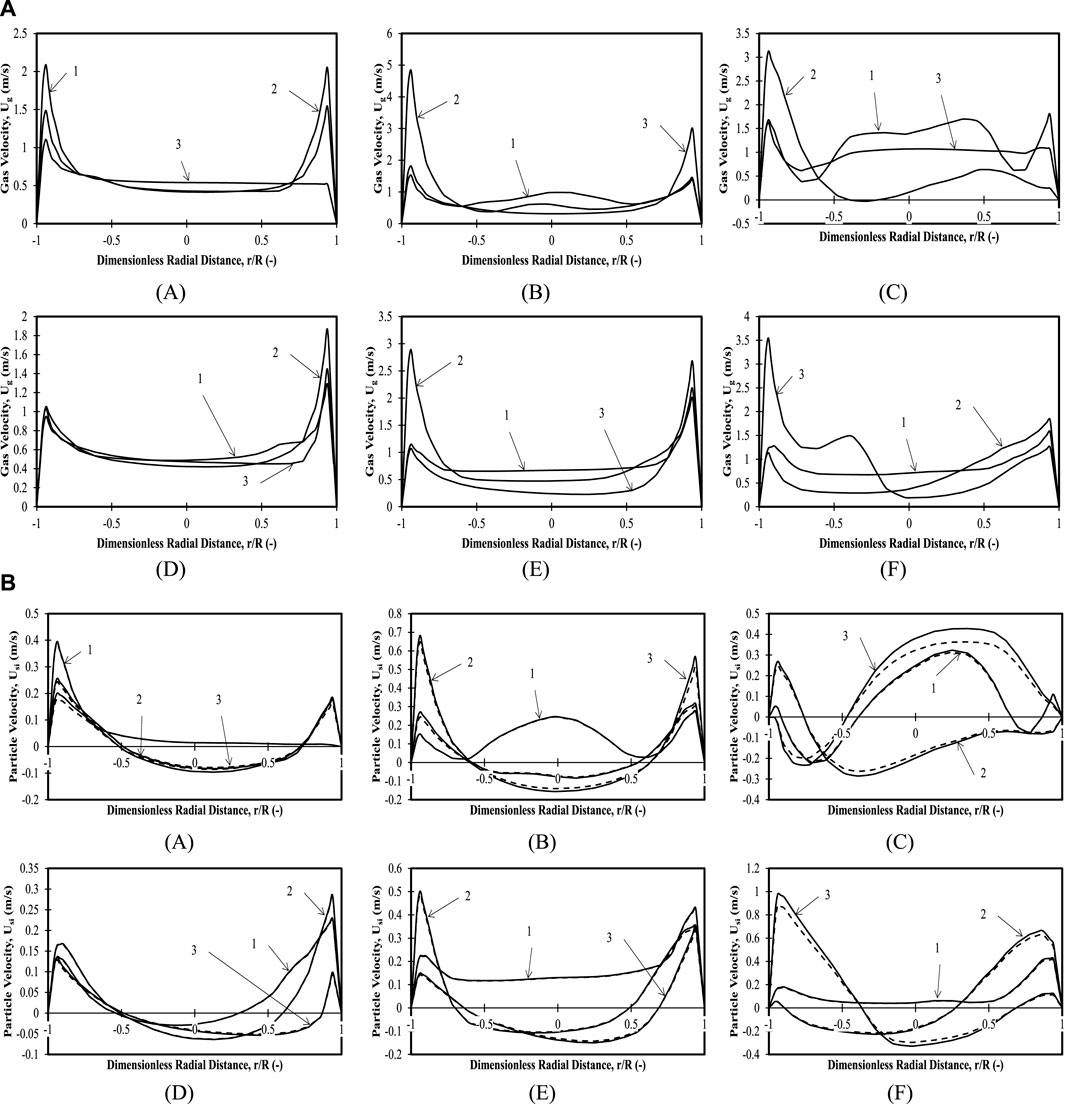
FIGURE 8. (A) Time-averaged mean axial gas velocity profiles for 80 wt.% mixture and 0.335 m (z/H = 0.24) initial bed height with (A)
The dimensionless distance range is taken as −1 < r/R < 1. During the profile analysis, the start position is the leftmost radial position (or left-hand wall), and the end position is the rightmost radial position (right-hand wall). The terminology for axial positions and superficial velocities describing velocity profiles for an initial bed height of 0.335 m (z/H = 0.24) and 0.635 m (z/H = 0.45) has been tabulated in Table 2.
3.2.1 Binary mixture with 0 wt.% large particles and 100 wt.% small particles: initial bed height of 0.635 m (z/H = 0.45)
The information for the unary bed of the present case is shown in Supplementary Figure S2. The gas velocity and particle velocity profiles for the binary mixture with 0 wt.% large particles and an initial bed height of 0.635 m (z/H = 0.45) are first presented. For a superficial velocity of
For a superficial velocity of
For superficial velocity of
Particle velocities for Cases 1, 2, and 3 have been demonstrated in Supplementary Figure S2. At Position 1 Case 1, a parabolic profile is observed at the central portion with downward particle velocities near the walls (asymmetric in nature), which indicates fully developed flow in the central portion. For Position 2, an asymmetric parabolic profile with peak velocities at the right and downward velocities only at the left wall is observed, which indicates a drift of upward particle flow toward the right and downward particle flow toward the left. For position 3, a tectonic shift is observed in the particle velocity profile with upward velocities on the left and downward velocities on the right. The profile is a mirror image of the one for Position 2 with higher velocities for both upward and downward flows. The velocity magnitudes increase as we go from position 1 to 3 in the axial direction.
For Case 2 and Position 1, upward velocities with maxima approximately
For Case 3 and Position 1, a profile similar to Case 2 is observed with higher maximum velocities. Position 2 is characterized by downward velocities near the left wall and upward velocities from r/R = −0.4, with a maximum of
Thus, fully developed profiles for all velocities in the bottom, middle, and top portions are observed for lower superficial velocities. As the superficial velocity is increased, asymmetric sinusoidal profiles are observed. Magnitudes of maximum particle velocities are higher as the superficial velocities increase, ranging from
3.2.2 Binary mixture with 20 wt.% large particles and 80 wt.% small particles: initial bed height of 0.335 m (z/H = 0.24)
Figures 5A–C shows the gas velocity profiles for the binary mixture with 20 wt.% large particles and an initial bed height of 0.335 m (z/H = 0.24). It can be observed that gas velocity profiles for all three superficial velocities and all axial positions considered are less than
Figures 5A–C shows the variation in particle velocities for the binary mixture for both large and small particles at an initial bed height of 0.335 m (z/H = 0.24). For Case 1, Position 1 shows upward velocities for all radial locations. Furthermore, lower particle velocities are observed for all axial positions with downward velocities for Position 2 in bulk and upward velocities near the wall. Both small and large particles demonstrate the same trends with a slight difference in their magnitudes (the smaller particles have higher velocities than the larger particles). An asymmetric profile with downward particle velocities of smaller diameter particles in the left portion of the bed and upward velocities in the right portion of the bed has been observed for Position 3. The particle velocities for larger particles are not observed for this axial position (Position 3) superficial velocity bed height. This might be attributed to the difference in dispersion height of the bed as also observed by Singh et al. (2019). For Case 2 Position 1, the particle velocities are found to be nearly zero with upward velocities near both walls (in region 0 < r/R < −0.4; 0.5 < r/R < 1) for smaller particles, while the larger particle velocity magnitudes are lower for the entire bed, indicating that the kinetic energy of larger particles depends on the particle–particle collisions, gas–particle collisions, and collisions with the walls. Position 2 shows a very different profile with upward velocities in the region 0 < r/R < −0.4, downward velocities in the region 0 < r/R < 0.1, and upward velocities in the region (0.1 < r/R < 1) for both diameters of particles (with a difference in velocity magnitudes). For Position 3, downward velocities with maximum velocity magnitudes of −0.34 m/s (for smaller particles) on the left-hand side and upward velocities on the right-hand side are observed. On the right-hand side, a maximum is seen at position r/R = 0.8. For Case 3, an asymmetric profile with upward velocities in the left portion of the wall (in region 0 < r/R < 0.2) and downward velocities on the right half is observed for Position 1. Positions 2 and 3 have downward velocities with maximum velocity magnitudes of −0.56 m/s (for smaller particles), respectively, on the left-hand walls (in region 0 < r/R < 0.5).
To summarize, the particle velocities for larger particles are always lower than those of the smaller particles for this composition. This is evident for all superficial velocities and all positions. At lower superficial velocities, the larger particles do not reach the topmost position due to difference in dispersion height. Bypassing of the gas for lower superficial velocities takes place through the near-wall region with clear segregation of the bed as observed from the particle velocity profiles. This is explained as follows: because the particle velocities of both particle sizes are higher than minimum fluidization velocities, they move at different velocities. The larger particles reach a particular height and either move axially or radially in the case of mixing or remain at a constant position. The smaller particles, however, move to a higher height and keep moving both radially and axially. Hence, for the highest position and the highest superficial velocity, there is no presence of larger particles for the composition under consideration. In other words, the larger particles are segregated in the bottom, while smaller particles are segregated at the top.
3.2.3 Binary mixture with 20 wt.% large particles and 80 wt.% small particles: initial bed height of 0.635 m (z/H = 0.45)
Figure 5D–F shows the gas velocity profiles for the binary mixture with 20 wt.% large particles and an initial bed height of 0.635 m (z/H = 0.45). Gas velocity profiles for all three superficial velocities and all axial positions considered are less than
Figure 5D–F shows the variation in particle velocities for the binary mixture with 20 wt.% large particles for both particle sizes and an initial bed height of 0.635 m (z/H = 0.45). For Case 1, Position 1 starts with high upward velocities and shows a minimum at r/R = −0.5 and r/R = 0.7 and a maximum at r/R = 0.1. Position 2 shows an upward velocity moving from the left wall to the right wall. Position 3 shows small particles moving in the downward direction with velocities up to 0.8 m/s and a flat velocity profile. The larger particles, however, are not observed at this position. This might be due to the difference in dispersion height indicating segregation for the case considered. For Case 2, the trends of particle velocities for both particle sizes are similar, with magnitudes of particle velocities depending on the particle sizes. Position 1 shows decreasing velocities from the left wall to r/R < 0.3 and upward velocities near the right wall. Position 2 shows a maximum at r/R = −0.5 and a decreasing trend from there to the right wall. Position 3 shows a decreasing upward velocity profile from −1<r/R < −0.4 and an increasing upward velocity profile in the remaining portion. Position 1 Case 3 shows a stagnant downward velocity of 0.8 m/s (for smaller particles) from the left wall to r/R = 0.5 and an increasing behavior to the right wall. Position 2 shows a continuous decreasing downward velocity trend starting with 0 m/s at the left wall. Position 3 shows an increasing downward velocity from the left wall to the right wall with a maximum at r/R = 0.6. The maxima in particle velocities near walls denote the core annular structure with a concave region in the center. These observations have also been observed in circulating fluidized bed risers by Zaabout et al. (2010). It is also noticed that the superficial velocities where core-annular structures form are in the range suggested by Van den Moortel et al. (1998).
For the present case, it has been observed that as the superficial velocity increases, the gas–solid (GS) interactions increase, and there is a reduction in the particle–particle frictional forces. The maximum GS interaction happens at the highest superficial velocities, and the minimum interactions happen at the lowest superficial velocity. This promotes mixing as observed in the top position (Position 3) of the last case for both large and small particle velocities. For the lowest superficial velocity, the particle–particle interactions are higher, causing the segregation of the bed. It should also be noted that bed height plays an important role along with superficial velocity in determining the segregation and mixing phenomena for a particular composition.
3.2.4 Binary mixture with 40 wt.% large particles and 60 wt.% small particles: initial bed height of 0.335 m (z/H = 0.24)
Figures 6A–C shows that the gas velocities for all the cases and positions show a similar trend of low velocities in the entire bed except on the right-hand side. The only exceptions are Case 2 Positions 2 and 3, which show maxima at different r/R locations, and Case 3 Position 2, where upward velocities are seen on the left-hand side, and downward velocities are seen on the right-hand side. The maxima indicate the presence of either a bigger bubble or smaller bubbles that can be observed from the comparison of the particle velocity because the trends are the same, but the particle velocities are not present at some spatial locations, indicating only the presence of gas that indirectly indicates gas bubbles.
Figures 6A–C shows that particle velocities for both particle sizes for all cases and positions have symmetric or asymmetric profiles with upward and downward velocities on the left- and right-hand sides, respectively. The asymmetric profiles might be attributed to the presence of gas bubbles, which is also evident when one compares the particle velocity trends with the gas velocity trends for the operating conditions and the spatial locations. This shows that an increase in superficial velocity causes a corresponding increase in intermixing. It should also be noted that mixing is evident in all the cases for the composition considered in terms of both the operating condition and the bed height.
3.2.5 Binary mixture with 40 wt.% large particles and 60 wt.% small particles: initial bed height of 0.635 m (z/H = 0.45)
Figures 6D–F shows that gas velocity magnitudes are higher for lower axial positions with maxima on the left-hand side for Positions 2 and 3, Cases 2 and 3. Similarly, for higher superficial velocities (Cases 2 and 3) and the axial position (Position 3), there is a maximum on the right-hand side of the bed. This shows that a fully developed flow for the gas phase occurs for higher superficial velocities at higher axial positions, and a steady state is reached.
Figures 6D–F shows particle velocities for both sized particles. A swirling action can be seen from lower to higher axial positions because, at higher axial positions (Positions 2 and 3) and higher superficial velocity (Case 3), the particles attain an off-center parabolic profile on the right-hand side, while for Position 3, the maximum and parabolic profile is on the right. Such trends have been reported by Zaabout et al. (2010). However, an important conclusion that can be made is that with an increase in bed height, the amount of mixing is lowered at lower superficial velocities of 0.3 and 0.45 m/s, and good mixing is only observed at 0.6 m/s.
For the present case, both gas and particle velocities for Cases 2 and 3 show mixing patterns corresponding to a bubbling regime. Furthermore, a comparison of particle and gas velocities indicates the presence of bubbles near the walls instead of in the center as in the previous case of lower bed height. Furthermore, it can be concluded that bypassing occurs at lower superficial velocities, reducing the mixing in the bed, although segregation is not observed. This also reiterates the fact that bed height plays an important role in the dynamics of fluidized beds.
3.2.6 Binary mixture with 60 wt.% large particles and 40 wt.% small particles: initial bed height of 0.335 m (z/H = 0.24)
Figures 7A–C shows the gas velocities for the aforementioned composition of binary mixture. For the different positions, the analysis shows that for Case 1, as the position increases, the gas velocities decrease, and a flat velocity is observed at the topmost position. The existence of gas bubbles may be interpreted at the lowermost position away from the centers with high velocity magnitudes. An increase in superficial velocity causes bypassing of the gas with an increase in the spatial position, with the gas passing nearly uniformly across the bed in the lowermost position for Case 2 and slowly decreasing across the bed and bypassing near the left wall.
Particle velocities (for both particle sizes) in Figures 7A–C however, show rapid mixing patterns in the form of sinusoidal waveforms for Cases 2 and 3 for Positions 2 and 1, respectively. Downward velocities are observed for Positions 2 and 3 and Case 2, while in Position 3 and Case 3, a flat profile in the bulk in the downward direction can be observed. Overall rapid mixing for both Case 2 and Case 3 are observed. It is important to note that for this composition, there is no difference in dispersion height for the entire range of superficial velocities considered across all positions for the present bed height.
For the present combination, both gas and particles are present in the bed causing good mixing with the characteristics of a bubbling regime for Cases 2 and 3.
3.2.7 Binary mixture with 60 wt.% large particles and 40 wt.% small particles: initial bed height of 0.635 m (z/H = 0.45)
Figures 7D–F shows gas velocity profiles for a higher bed height. For mostly all cases and all positions, high velocities near the left walls are seen with flat velocity profiles in the bulk. For the highest superficial velocity, the gas velocities undergo a maximum at the highest position. This may be attributed to the existence of the bubble that occurs at the dispersed height of the bed. The existence of the bubbles has been already described in detail in Part I of our analysis (Ganguli and Bhatt, 2023). These bubbles also play a role in carrying the larger particles and increasing the kinetic energy of the larger particles by transferring part of their own kinetic energy to the larger particles.
Figures 7D–F shows particle velocities for both particle sizes for the aforementioned case. Particle velocity profiles are similar to gas velocity profiles for Cases 1 and 2 with a velocity magnitude that is five times smaller. Similarly, for Case 3 and all axial locations, downward velocities are observed for all the positions. The higher velocities near the walls and lower velocities at the center form a concave structure (core annular profile) similar to the ones observed by Zaabout et al. (2010). It can also be observed that mixing occurs at the highest superficial velocity (0.6 m/s) for this case with GS interactions dominating over particle–particle interactions. For lower velocities, however, the bed acts more or less as a distributor, with higher particle velocities restricted only near the walls due to the gas bypassing that occurs. This also denotes segregation at the superficial velocities of 0.3 and 0.45 m/s at a bed height of 0.635 m (z/H = 0.45) with particle–particle interactions causing frictional forces to dominate over GS interactions. These represent patterns similar to the ones predicted by Lan et al. (2014).
3.2.8 Binary mixture with 80 wt.% large particles and 20 wt.% small particles: initial bed height of 0.335 m (z/H = 0.24)
Figures 8A–C shows a flat profile in the bulk and higher gas velocities near the wall, indicating that most of the gas exits from the near-wall regions. The magnitudes of gas velocities are highest in Position 1 of Case 3. Figures 8D–F show the particle velocities for the mixture composition considered. The bed is seen to be well mixed for all positions for Case 3 or the highest superficial velocity. Upward velocities in bulk are observed for Positions 1 and 3 for Case 2 and only for Position 1 for Case 3. Downward velocities in bulk are observed for all other positions. Near-wall maxima with different velocity magnitudes are seen in most of other positions and cases except Case 1. The profiles represent a concave structure (core annular profile) similar to the ones observed by Zaabout et al. (2010).
3.2.9 Binary mixture with 80 wt.% large particles and 20 wt.% small particles: initial bed height of 0.635 m (z/H = 0.45)
Figures 8A–C show that when the bed height is increased, the trends of the gas velocity profiles remain the same, with nearly half the magnitudes the same as for a lower bed height case. The particle velocities for both particle sizes in Figures 8D–F also show mixing in the case of the highest superficial velocity. This clearly suggests that the trends for this particular composition are similar and differ only in magnitudes for both bed heights. It can be concluded that the dynamics of the bed are independent of the bed height for the present case of operating conditions considered for this particular composition.
3.2.10 Binary mixture with 100 wt.% large particles and 0 wt.% small particles: initial bed height of 0.335 m (z/H = 0.24)
This analysis has been included in the Supplementary Material. In this case (refer to Supplementary Figure S3), during simulations, no gas or particle dynamics was observed for Case 1, and the bed acts as a fixed bed. Hence, only Cases 2 and 3 were analyzed, and Case 1 is not reported. Figures (A) and (B) show that gas velocities show similar dynamics as seen for higher amounts of large particles. The particle velocities (for 488 micron), however, show undulations in the entire bed for Positions 2 and 3 and Cases 2 and 3 except for Position 2 of Case 3.
3.2.11 Binary mixture with 100 wt.% large particles and 0 wt.% small particles: initial bed height of 0.635 m (z/H = 0.45)
The gas and particle velocity profiles are demonstrated in Supplementary Figure S3. Both gas and particle velocities are stagnant in the bulk of the bed, while very high values are present near the walls. Furthermore, the particle velocities for all cases and positions considered are downward showing that for the superficial velocities considered for this composition, the bed acts as a distributor irrespective of bed height. Some cases have not been considered for the study because they act as a fixed bed at the superficial velocities.
3.3 Effect of superficial velocity and initial bed height on axial solid phase volume fraction profiles
In this section, solid phase volume fractions across the axial centerline of the final bed height have been presented for the three superficial velocities and two mixture compositions considered, namely, 20 wt.% and 40 wt.%. Both bed heights have been chosen for each of the compositions. The discussion has been restricted to only two compositions to demonstrate the segregation and mixing that can be analyzed using the solid volume fractions. The other compositions also have similar trends with slight differences due to the presence of higher amounts of large particles but have not been included.
Figure 9A, B shows solid fraction profiles for both large and small volume fractions for the 20 wt.% mixture case for both bed heights. Similar profiles have been reported by Lan et al. (2014). For all three superficial velocities and the lower bed height of 0.335 m (z/H = 0.24), segregation is observed in the bottom layer with a larger amount of large particles and a relatively lower volume fraction of smaller particles, and vice versa in the top layer. The middle layer showed some mixing between the large and small particles. Furthermore, the dispersion height was found to be higher for smaller particles for all three superficial velocities. For the lowest superficial velocity of 0.3 m/s, the dispersion height for large particles is 0.31 m (z/H = 0.22), while the dispersion height for small particles is 0.36 m. This also compliments the findings observed in the velocity distributions where the particle velocities are not observed for Position 3. However, volume fractions lower than 0.0005 are observed for the superficial velocity of 0.6 m/s, while corresponding volume fraction for 0.45 m/s is 0.007. This is due to the higher kinetic energy of the gas and the smaller particles, and only a very few large particles are carried over. Because very few particles reach the top or the dilute zone, the velocity distributions depict the larger particles in the profiles. Dispersion heights, however, are 0.5–0.7 m. Furthermore, the undulations or decrease in volume fractions indicate bubble-containing solids and can also be seen in volume fraction contours as depicted in our earlier work (Ganguli and Bhatt, 2023). These patterns confirm a bubbling regime and well mixed patterns. For an initial height of 0.635 m (z/H = 0.45), complete segregation is observed in all the layers with all small particles in the top layer and large particles in the bottom layer. Interestingly, here, two layers are formed, while three layers are formed in the previous case with a lower bed height. Some large particles, however, reach the top layer in all three cases, although the dispersion heights for all three heights are different.
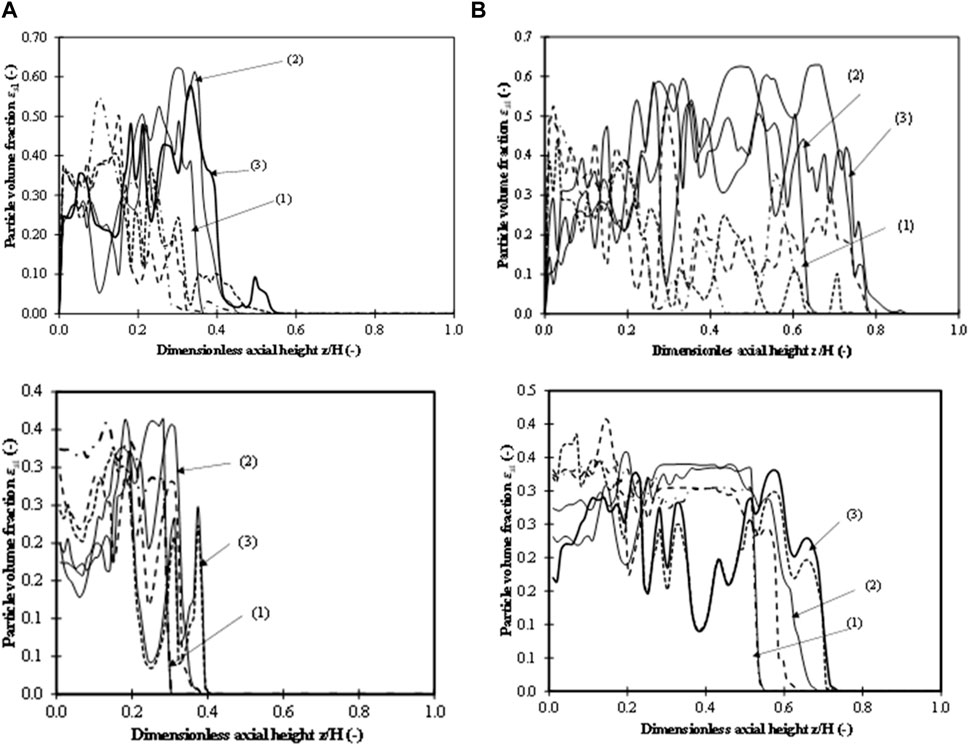
FIGURE 9. Time-averaged axial particle volume fraction profiles for (i) 20 wt.% mixture; (ii) 40 wt.% mixture. (A) Initial bed height of 0.335 m (z/H = 0.24). (B) Initial bed height of 0.635 m (z/H = 0.45). (1)


Figure 9A, B shows solid fraction profiles for the 40 wt% mixture case for both bed heights. For the lower initial bed height (z/H = 0.24), segregation at the bottom layer is evident for all superficial velocities, and the highest segregation occurs at 0.3 m/s. However, from z/H = 0.15, some amount of mixing is observed until the dispersed bed height is reached. The volume fractions of both large and small particles are similar in the middle of the bed (starting at z/H = 0.12 and evident until z/H = 0.3 for all superficial velocities), with small particles becoming higher at the top of the bed (or the dilute zone), especially for superficial velocities of 0.3 and 0.45 m/s. The mixing is most evident for z/H = 0.13 to 0.4 for a superficial velocity of 0.6 m/s, where substantial volume fractions of large particles are observed compared to small particles, indicating good mixing. This may be attributed to three major factors: the influence of gas velocity and bubbles that increase the kinetic energy of large particles, higher GS interactions dominating the particle–particle interactions, and lower hindrance of small particles. For a bed height of 0.635 m (z/H = 0.45), the particle volume fraction profiles also depict segregation at the bottom (volume fractions of larger particles are higher by 10%–35%) and mixing at both the middle and top layers with small particles having higher volume fractions (15%–20% higher) compared to larger particles. The undulations at the middle and top portions depict the presence of bubbles. For
3.4 Effect of superficial velocity on final bed height
Figures 10A, B represent the final bed height for the fluidized bed after reaching a steady state for two initial bed heights, 0.335 m (z/H = 0.24) and 0.635 m (z/H = 0.45). The bed height considered does not indicate the bed height for two different particle sizes, but the highest bed height that can be observed at a steady state is taken, which mostly consists of small particles. In Figure 10A, it can be observed that for a mixture with 20 wt.% large particles, there is a linear increase in the bed expansion ratio for all superficial velocities. Furthermore, the bed expands 1.5 times the initial bed height for a superficial velocity of
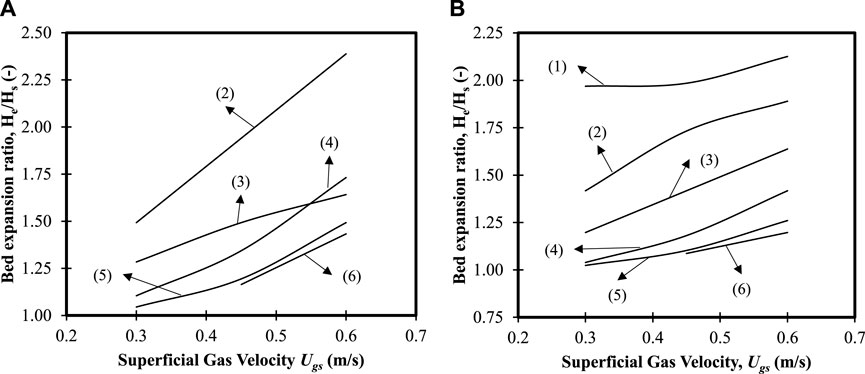
FIGURE 10. Bed expansion ratio profiles for different superficial velocities for (A) initial bed height of 0.335 m (z/H = 0.24); (B) initial bed height of 0.635 m (z/H = 0.45). (1) 0 wt.% mixture, (2) 20 wt.% mixture, (3) 40 wt.% mixture, (4) 60 wt.% mixture, (5) 80 wt.% mixture, and (6) 100 wt.% mixture.
Figure 10B shows the effect of superficial velocity on bed expansion for all the binary mixtures considered with an initial bed height of 0.635 m (z/H = 0.45). It can be observed that for the 0 wt.% large particles, the bed expands to approximately two times the initial bed height. However, there is no significant effect on the bed expansion for the superficial velocities considered. For 20 wt.% large particles in the binary mixture, the bed expansion is 1.4 times for the lowest superficial velocity and then tapers for a velocity of
3.5 Correlation development
Table 3 summarizes the correlations for minimum fluidization velocities and pressure drops available in the literature. Because a comprehensive analysis in terms of quantification of pressure drop and velocity distribution of both gas and particle velocities has been made in the present work, it was thought worthwhile to find a correlation between minimum fluidization velocity and pressure drop. To determine the pressure drop, simulations for different superficial velocities (0.02–0.75 m/s) starting from fixed bed to fluidized bed were carried out for all the binary mixtures and bed pressure drop versus superficial velocity were plotted. The minimum fluid velocity was determined from the intersection of the linear graph where the bed changes from fixed to fluidized bed. The corresponding gas volume fraction in the bed was found by taking the time-averaged volume fraction of the bed after 7 s for all the cases while the particles were considered to be spherical [as per experimental data of Jayarathna and Halvorsen (2011)] with sphericity equal to 1. Because the pressure drop was found to be a function of the initial bed height to column diameter ratio, it was also considered for the correlation of pressure drop, although only two bed heights have been considered.
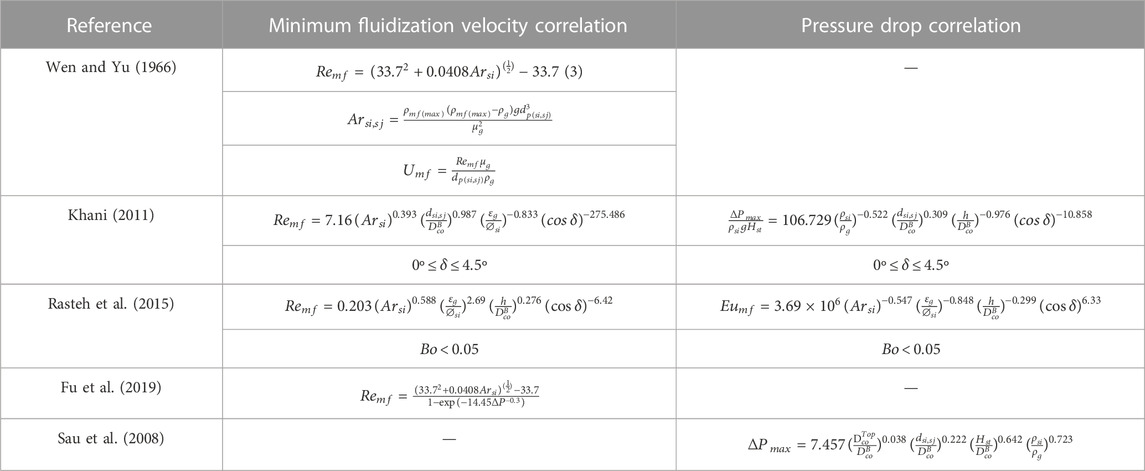
TABLE 3. Correlations for minimum fluidization velocity and pressure drop available in the literature.
A new correlation for minimum fluidization velocity is given by the following equation:
The correlation for maximum pressure drop is given by
Figure 11A shows the parity plot of minimum fluidization velocity predicted by previous works with respect to the experimental data used from the literature. It can be observed that the predictions from the correlation developed fall within a ±15% deviation from experimental data. The correlations available in the literature predict with deviations of more than 80%. This is due to the fact that the superficial velocities considered by the authors are much lower than the ones considered in the present analysis. Figure 11B shows the parity plot of pressure drop with experimental data. The developed correlation predicts well within ±15% deviation. The predictions of Sau et al. (2008) also fall within a ±15% deviation from experimental data, while other correlations show very high deviations (>80%).
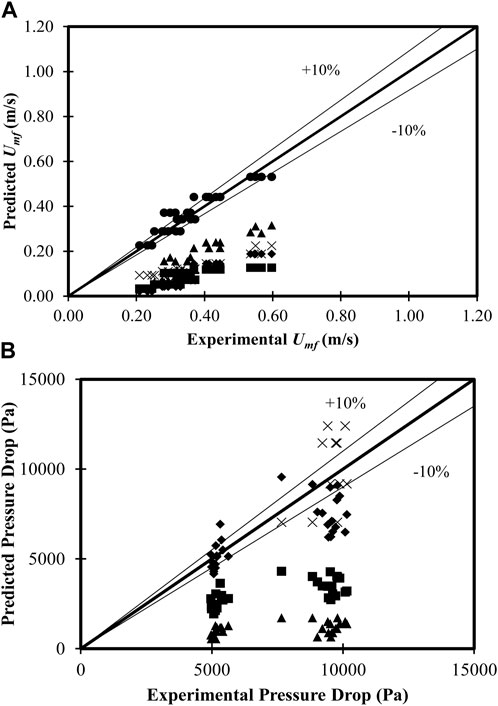
FIGURE 11. Parity plot for the newly developed correlations. (A) Minimum fluidization velocity: ♦ Wen and Yu (1966), ■ Khani (2011), ▲ Fu et al. (2019), × Rasteh et al. (2015), and ● Present work. (B) Pressure drop: ♦ Sau et al. (2008), ■ Khani (2011), ▲ Rasteh et al. (2015), and × present work.
4 Conclusion
Radial gas and particle velocity profiles for different axial locations and vertical centerline particle volume fraction profiles have been presented for each of seven binary mixtures using three different superficial velocities and two different bed heights. Correlations for minimum fluidization velocity and pressure drop are also presented. The following conclusions can be drawn:
1. For unary beds of small and large particles, the gas and particle velocities depicts characteristics of fluidized bubbling similar to the velocities observed in the literature. This is the case for all superficial velocities and all bed heights.
2. For the 20 wt.% mixture of larger particles, segregation is observed for a lower bed height both at the bottom and top of the beds. Particle velocities are higher for smaller particles with higher superficial velocities, and a mixed pattern is observed. Although larger particles are also observed in the velocity distribution profiles, solid volume fraction profiles show that only a few large particles might reach the top of the bed.
3. For the 40 wt.% mixture, the bed is segregated at the bottom and well mixed at the middle and top, with the volume fraction of smaller particles larger than that of larger particles. The gas velocities for lower fractions of large particles up to 40 wt.% show a convex structured profile and bypassing near the walls for all superficial velocities and bed heights considered. Particle velocities are also higher near the walls and lower in the middle. Positive and negative velocities of particles are observed, representative of good mixing. This is also confirmed by observing the solid volume fraction profiles.
4. For the 60 wt.% mixture, the bed is slightly segregated at the bottom while well mixed at the middle and top, similar to the 40 wt.% mixture. The only difference is the percentage of large particles is higher in all three layers of the final bed height. Furthermore, with an increase in particle size, that is, 60 wt.% large particles, the bypassing of gas velocities increases as high as
5. For the 80 wt.% large particle mixture, the bed acts as a distributor with little increase in its final height. Higher gas velocities near the walls are observed.
6. The axial particle volume fraction profiles show undulations in the middle zone of the fluidized bed with low volume fractions in the top/dilute zone for binary mixtures up to 60 wt.% large particles. For higher percentages of large particles, profiles confirm that the bed remains stagnant for all superficial velocities considered.
7. Bed height expansion is seen to be a linear function for superficial velocities up to
8. Correlations for minimum fluidization velocity and the pressure drop for binary mixtures have been made. Predictions are compared with correlations available in the literature as well as the experimental data from the literature (Jayarathna and Halvorsen, 2011). A good agreement between predictions and experiments is found.
The conclusions drawn from the flow patterns and profiles could help design a better fluidized bed by choosing the operating window based on the binary mixture at hand.
Data availability statement
The original contributions presented in the study are included in the article/Supplementary Material, further inquiries can be directed to the corresponding author.
Author contributions
Conceptualization: AG; CFD modeling: VB; model validation: AG and VB; writing the manuscript: AG and VB; reviewing: AG; supervision: AG; formal analysis: AG and VB; data curation: VB and AG. All authors contributed to the article and approved the submitted version.
Acknowledgments
The authors would like to thank School of Engineering and Applied Sciences, Ahmedabad University, for their continuous support during the entire project.
Conflict of interest
The authors declare that the research was conducted in the absence of any commercial or financial relationships that could be construed as a potential conflict of interest.
Publisher’s note
All claims expressed in this article are solely those of the authors and do not necessarily represent those of their affiliated organizations, or those of the publisher, the editors, and the reviewers. Any product that may be evaluated in this article, or claim that may be made by its manufacturer, is not guaranteed or endorsed by the publisher.
Supplementary material
The Supplementary Material for this article can be found online at: https://www.frontiersin.org/articles/10.3389/fenrg.2023.1150943/full#supplementary-material
References
Agrawal, V., Shinde, Y., Shah, M. T., Utikar, R. P., Pareek, V. K., and Joshi, J. B. (2018). Effect of drag models on CFD–DEM predictions of bubbling fluidized beds with Geldart D particles. Adv. Powder Technol. 29, 2658–2669.
Ahmadi, G., and Ma, D. (1990). A thermodynamical formulation for dispersed multiphase turbulent flows—1: Basic theory. Int. J. Multiph. Flow 16, 323–340.
Bakshi, A., Ghoniem, A., and Altantzis, C. (2017). Mixing dynamics in bubbling fluidized beds. AIChE J. 63, 4316–4328.
Benzarti, S., Mhiri, H., Bournot, H., and Occelli, R. (2014). Numerical simulation of turbulent fluidized bed with Geldart B particles. Adv. Powder Technol. 25, 1737–1747.
Čársky, M., Pata, J., Veselý, V., and Hartman, M. (1987). Binary system fluidized bed equilibrium. Powder Technol. 51, 237–242.
Chang, J., Wang, G., Gao, J., Zhang, K., Chen, H., and Yang, Y. (2012). CFD modeling of particle–particle heat transfer in dense gas-solid fluidized beds of binary mixture. Powder Technol. 217, 50–60.
Chang, J., Wu, Z., Wang, X., and Liu, W. (2019). Two-and three-dimensional hydrodynamic modeling of a pseudo-2D turbulent fluidized bed with Geldart B particle. Powder Technol. 351, 159–168.
Chehbouni, A., Chaouki, J., Guy, C., and Klvana, D. (1994). Characterization of the flow transition between bubbling and turbulent fluidization. Industrial Eng. Chem. Res. 33, 1889–1896.
Chew, J. W., and Cocco, R. A. (2021). Fast versus turbulent fluidization of Geldart Group B particles. AIChE J. 67, e17216.
Chew, J. W., Wolz, J. R., and Hrenya, C. M. (2010). Axial segregation in bubbling gas-fluidized beds with Gaussian and lognormal distributions of Geldart Group B particles. AIChE J. 56, 3049–3061.
Chyang, C. S., Kuo, C. C., and Chen, M. Y. (1989). Minimum fluidization velocity of binary mixtures. Can. J. Chem. Eng. 67, 344–347.
Cooper, S., and Coronella, C. J. (2005). CFD simulations of particle mixing in a binary fluidized bed. Powder Technol. 151, 27–36.
Daryus, A., Siswantara, A. I., BudiarsoGunadi, G. G. R., and Pujowidodo, H. “CFD simulation of multiphase fluid flow in a two-dimensional gas-solid fluidized bed using two different turbulence models,” in Proceedings of the AIP Conference Proceedings, Bali, Indonesia, November 2019, 020016.
Schaeffer, D. G. (1987). Instability in the evoluations describing incompressible granular flow. J. Differ. Equations 66, 19–50.
Di Maio, F. P., Di Renzo, A., and Vivacqua, V. (2012). A particle segregation model for gas-fluidization of binary mixtures. Powder Technol. 226, 180–188.
Du, W., Bao, X., Xu, J., and Wei, W. (2006). Computational fluid dynamics (CFD) modeling of spouted bed: Influence of frictional stress, maximum packing limit and coefficient of restitution of particles. Chem. Eng. Sci. 61, 4558–4570.
Ellis, N., Bi, H., Lim, C., and Grace, J. (2004). Hydrodynamics of turbulent fluidized beds of different diameters. Powder Technol. 141, 124–136.
Emiola-Sadiq, T., Wang, J., Zhang, L., and Dalai, A. (2021). Mixing and segregation of binary mixtures of biomass and silica sand in a fluidized bed. Particuology 58, 58–73.
Fu, Z., Zhu, J., Barghi, S., Zhao, Y., Luo, Z., and Duan, C. (2019). Minimum fluidization velocity growth due to bed inventory increase in an Air Dense Medium Fluidized Bed. Chem. Eng. J. 359, 1372–1378.
Ganguli, A., and Bhatt, V. (2023). CFD simulations to study bed characteristics in gas-solid fluidized beds with binary mixtures of geldart-B particles: I qualitative analysis. Front. Energy Res. 11, 72.
Gao, J., Lan, X., Fan, Y., Chang, J., Wang, G., Lu, C., et al. (2009). Hydrodynamics of gas–solid fluidized bed of disparately sized binary particles. Chem. Eng. Sci. 64, 4302–4316.
Gauthier, D., Zerguerras, S., and Flamant, G. (1999). Influence of the particle size distribution of powders on the velocities of minimum and complete fluidization. Chem. Eng. J. 74, 181–196.
Gupta, S., and De, S. (2021). Investigation of hydrodynamics and segregation characteristics in a dual fluidized bed using the binary mixture of sand and high-ash coal. Adv. Powder Technol. 32. doi:10.1016/j.apt.2021.04.023
Harris, A., Davidson, J., and Thorpe, R. (2002). The prediction of particle cluster properties in the near wall region of a vertical riser (200157). Powder Technol. 127, 128–143.
Hoffmann, A., Janssen, L., and Prins, J. (1993). Particle segregation in fluidised binary mixtures. Chem. Eng. Sci. 48, 1583–1592.
Jayarathna, C., and Halvorsen, B. (2011). Experimental and computational study of pressure drop and void fraction in a bubbling fluidized bed. WIT Trans. Eng. Sci. 70, 177–188.
Kalo, L., Pant, H. J., Cassanello, M. C., and Upadhyay, R. K. (2019). Time series analysis of a binary gas-solid conical fluidized bed using radioactive particle tracking (RPT) technique data. Chem. Eng. J. 377, 119807.
Khani, M. (2011). Models for prediction of hydrodynamic characteristics of gas–solid tapered and mini-tapered fluidized beds. Powder Technol. 205, 224–230.
Khezri, R., Karim Ghani, W. A., Masoudi Soltani, S., Awang Biak, D. R., Yunus, R., Silas, K., et al. (2019). Computational fluid dynamics simulation of gas–solid hydrodynamics in a bubbling fluidized-bed reactor: Effects of air distributor, viscous and drag models. Processes 7, 524.
Kotoky, S., Dalal, A., and Natarajan, G. (2020). A computational analysis of the role of particle diameter on the fluidization behavior in a bubbling gas–solid fluidized bed. Comput. Part. Mech. 7, 555–565.
Lan, X., Yan, W., Xu, C., Gao, J., and Luo, Z.-H. (2014). Hydrodynamics of gas–solid turbulent fluidized bed of polydisperse binary particles. Powder Technol. 262, 106–123.
Leion, H., Frick, V., and Hildor, F. (2018). Experimental method and setup for laboratory fluidized bed reactor testing. Energies 11, 2505.
Leu, L. P., and Wu, C. N. (2000). Prediction of pressure fluctuations and minimum fluidization velocity of binary mixtures of geldart group B particles in bubbling fluidized beds. Can. J. Chem. Eng. 78, 578–585.
Lun, C., Savage, S. B., Jeffrey, D., and Chepurniy, N. (1984). Kinetic theories for granular flow: Inelastic particles in Couette flow and slightly inelastic particles in a general flowfield. J. fluid Mech. 140, 223–256.
Mazzei, L., Casillo, A., Lettieri, P., and Salatino, P. (2010). CFD simulations of segregating fluidized bidisperse mixtures of particles differing in size. Chem. Eng. J. 156, 432–445.
Menéndez, M., Herguido, J., Bérard, A., and Patience, G. S. (2019). Experimental methods in chemical engineering: Reactors—Fluidized beds. Can. J. Chem. Eng. 97, 2383–2394.
Mostafazadeh, M., Rahimzadeh, H., and Hamzei, M. (2013). Numerical analysis of the mixing process in a gas–solid fluidized bed reactor. Powder Technol. 239, 422–433.
Noda, K., Uchida, S., Makino, T., and Kamo, H. (1986). Minimum fluidization velocity of binary mixture of particles with large size ratio. Powder Technol. 46, 149–154.
Obuseh, C. C., Feng, Z.-G., and Paudel, B. D. (2012). An experimental study on fluidization of binary mixture in particulate flows. J. dispersion Sci. Technol. 33, 1379–1384.
Pei, P., Wu, G., Zhang, K., Yu, B., Jiang, J., and Wen, D. (2010). CFD simulation of jet behaviors in a binary gas-solid fluidized bed: Comparisons with experiments. Front. Chem. Eng. China 4, 242–249.
Penn, A., Boyce, C. M., Conzelmann, N., Bezinge, G., Pruessmann, K. P., and Müller, C. R. (2019). Real-time magnetic resonance imaging of fluidized beds with internals. Chem. Eng. Sci. 198, 117–123.
Philippsen, C. G., Vilela, A. C. F., and Dalla Zen, L. (2015). Fluidized bed modeling applied to the analysis of processes: Review and state of the art. J. Mater. Res. Technol. 4, 208–216.
Rao, A., Curtis, J. S., Hancock, B. C., and Wassgren, C. (2010). The effect of column diameter and bed height on minimum fluidization velocity. AIChE J. 56, 2304–2311.
Rasteh, M., Farhadi, F., and Bahramian, A. (2015). Hydrodynamic characteristics of gas–solid tapered fluidized beds: Experimental studies and empirical models. Powder Technol. 283, 355–367.
Roy, S., Pant, H. J., and Roy, S. (2021). Velocity characterization of solids in binary fluidized beds. Chem. Eng. Sci. 246, 116883.
Sahoo, P., and Sahoo, A. (2016). CFD simulation for hydrodynamic behaviour of fine particles in a fluidized bed. Indian J. Chem. Technol. (IJCT) 23, 253–261.
Sau, D., and Biswal, K. (2011). Computational fluid dynamics and experimental study of the hydrodynamics of a gas–solid tapered fluidized bed. Appl. Math. Model. 35, 2265–2278.
Sau, D., Mohanty, S., and Biswal, K. (2008). Correlations for critical fluidization velocity and maximum bed pressure drop for heterogeneous binary mixture of irregular particles in gas–solid tapered fluidized beds. Chem. Eng. Process. Process Intensif. 47, 2386–2390.
Shrestha, S., Kuang, S., Yu, A., and Zhou, Z. (2019). Bubble dynamics in bubbling fluidized beds of ellipsoidal particles. AIChE J. 65, e16736.
Singh, B. K., Roy, S., and Buwa, V. V. (2019). Dynamics of segregation and fluidization of binary mixtures in a cylindrical fluidized bed. AIChE J. 65, e16682.
Syamlal, M., and O’brien, T. (1987). The derivation of a drag coefficient formula from velocity-voidage correlations. Morgantown, WV, United States: US Department of energy, Office of Fossil Energy NETL.
Syamlal, M., Rogers, W., and Obrien, T. J. (1993). MFIX documentation theory guide. Morgantown, WV, United States: USDOE Morgantown Energy Technology Center.
Van Den Moortel, T., Azario, E., Santini, R., and Tadrist, L. (1998). Experimental analysis of the gas–particle flow in a circulating fluidized bed using a phase Doppler particle analyzer. Chem. Eng. Sci. 53, 1883–1899.
Wen, C., and Yu, Y. (1966). A generalized method for predicting the minimum fluidization velocity. AIChE J. 12, 610–612.
Zaabout, A., Bournot, H., Occelli, R., and Kharbouch, B. “Characterization of turbulent regime behavior in the dilute zone of a circulating fluidized bed riser,” in Proceedings of the 13th International Conference on Fluidization - New Paradigm in Fluidization Engineering, Korea, May 2010.
Zhang, D., Deen, N., and Kuipers, J. (2006). Numerical simulation of the dynamic flow behavior in a bubble column: A study of closures for turbulence and interface forces. Chem. Eng. Sci. 61, 7593–7608.
Zhang, Y., Zhao, Y., Lu, L., Ge, W., Wang, J., and Duan, C. (2017). Assessment of polydisperse drag models for the size segregation in a bubbling fluidized bed using discrete particle method. Chem. Eng. Sci. 160, 106–112.
Nomenclature
Keywords: fluidized bed, binary mixtures, computational fluid dynamics modeling, minimum fluidization gas velocity, KTGF model, pressure drop, hydrodynamics
Citation: Ganguli A and Bhatt V (2023) CFD simulations to study bed characteristics in gas–solid fluidized beds with binary mixtures of Geldart B particles: II quantitative analysis. Front. Energy Res. 11:1150943. doi: 10.3389/fenrg.2023.1150943
Received: 25 January 2023; Accepted: 22 May 2023;
Published: 07 July 2023.
Edited by:
Abdolali K. Sadaghiani, Sabancı University, TürkiyeReviewed by:
Miryan Celeste Cassanello, University of Buenos Aires, ArgentinaChenlong Duan, China University of Mining and Technology, China
Copyright © 2023 Ganguli and Bhatt. This is an open-access article distributed under the terms of the Creative Commons Attribution License (CC BY). The use, distribution or reproduction in other forums is permitted, provided the original author(s) and the copyright owner(s) are credited and that the original publication in this journal is cited, in accordance with accepted academic practice. No use, distribution or reproduction is permitted which does not comply with these terms.
*Correspondence: Arijit Ganguli, Z2FuZ3VsaWFyaWppdEBnbWFpbC5jb20=