 Junji Kondoh
- Department of Electrical Engineering, Faculty of Science and Technology, Tokyo University of Science, Noda, Chiba, Japan
On a day with unusually low temperatures in March 2022, there was a risk of a shortage in the power supplied by the eastern Japan (Tohoku and Tokyo) power systems owing to the spiked demand. Mass-installed photovoltaic power systems cannot be considered as winter supply capacity because they generate almost no electricity during such heavy demand in winter. Conversely, wind power, which is currently installed in much less capacity, is promising in these areas owing to the high output due to the East Asian winter monsoon. This study clarifies that, in the Tohoku power system, the winter capacity values of wind power are sufficiently high and higher than the annual capacity factors. The study concluded that increasing offshore wind farms along the Tohoku area can effectively supply part of the tight winter electricity demand that needs to be fulfilled by power systems in eastern Japan. Moreover, it increases the share of renewable energy sources.
1 Introduction
The penetration of wind and photovoltaic (PV) power is necessary to mitigate fossil fuel consumption and prevent global warming. Thus, installed capacities for wind and PV power generation have been drastically increasing worldwide. As shown in Figure 1A, the cumulative installed capacity of wind and PV power generation has increased by a factor of 50–100 over the last 2 decades and is more than double the operable installed capacity of nuclear power generation.
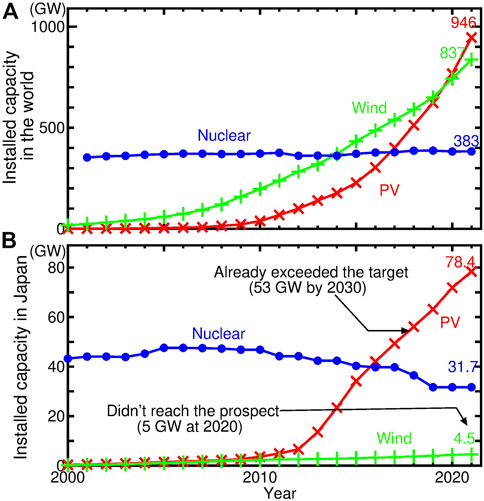
FIGURE 1. Trends of the cumulative installed capacities of wind and PV power and operable capacity of nuclear power (A) at global scale and (B) in Japan, based on published values from GWEC, IEA-PVPS, IAEA, and WNA.
Wind and PV power systems are called variable generation systems because their output power is variable, uncertain, and less controllable than that of conventional power plants. Since their generation profiles (i.e., the timing of power generation) differ, balancing their shares in the total power sources is crucial to ensure sufficient reserves in power systems. However, Figure 1B indicates that wind power penetration has been relatively lower in Japan than that of PV power. The ratio of wind/PV power is abnormally low (only 6%) in Japan compared to other countries, as described in Table 1, although available wind resources are large, particularly when offshore wind power is considered. One of the main reasons hindering the penetration of wind power in Japan is the grid connection problem (Mizuno, 2014); at a regular press conference in May 2008, the Federation of Electric Power Companies of Japan, which consists of ten electric power companies in Japan, announced that the acceptable capacities over Japan were 10 GW of PV power (28 GW under application of curtailment) and 5 GW of wind power (Katsumata, 2008). In 2009, the Japanese government announced the target of installing 28 GW of PV power by 2020 and 53 GW by 2030 (Yamamoto et al., 2010), but set the maximum wind power capacity to only 5 GW by 2020 (Kogaki, 2012). Furthermore, although the 53 GW target for PV power generation by 2030 has already been achieved, the 5 GW prospect for wind power generation by 2020 has not been achieved, as illustrated in Figure 1B. This discrepancy in shares causes a lack of reserves in the power systems.
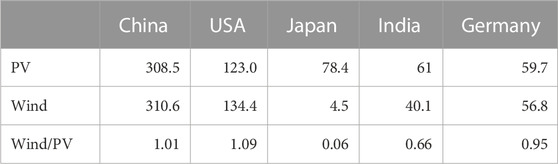
TABLE 1. Cumulative installed capacities (GW) of wind and PV power in the top five countries for PV power in 2021, based on published values from GWEC (GWEC, 2022) and IEA-PVPS (IEA PVPS, 2022).
The annual electricity demand in Japan exhibits two peaks: one in the afternoon during the hot summer owing to the air-conditioning loads, and the other at night during the cold winter due to the heating loads. PV power exhibits certain positive correlations with heavy summer loads in sunny afternoons; however, it does not contribute to the heavy winter load at night or on snowy days. On 22 March 2022, there was a risk of a shortage in the power supplied by the Tohoku and Tokyo power systems, primarily because of the spiked demand caused by snowfall and unusually low temperatures (0°C and 2°C at Sendai and Tokyo at noon, respectively) in eastern Japan, and the government repeatedly appealed to the public to save electricity (Asahi Shimbun, 2022). On that day, the power output from the mass-installed PV power systems in the Tokyo power system accounted for only a small percentage of the total supply capacity (Takahashi, 2022). The Tohoku and Tokyo power systems are strongly connected to each other via AC tie lines; however, all connections with other power systems are via HVDC transmissions or BTBs with a limited capacity. Therefore, the number of power sources that produce high power during heavy winter loads should be increased in eastern Japan. Wind power is promising because of its high output owing to the East Asian winter monsoon.
In 2021, the total offshore wind power capacity in Japan was only 0.05 GW (Watanabe, 2022). However, the Japanese government has set specific targets for the introduction of offshore wind power of 10 GW by 2030 and has created a map to anticipate the introduced capacities in specific areas (Public-Private Council, 2020). According to the map, the capacities of the offshore wind power in the Tohoku and Tokyo power systems will be 4.1–5.3 GW and 0.4 GW, respectively, by 2030. It is important to estimate their supply capabilities in winter to determine the adequacy of the eastern Japan power systems in the future.
In a previous study, the author reported the capacity values of wind power in winter using the peak-period capacity factor (PPCF) method in the Tohoku and Tokyo areas and concluded that it was higher than the capacity factor in Tohoku, but lower in Tokyo (Kondoh, 2022). However, the reasons for this have not yet been elucidated. This study clarifies the reasons for this based on air temperature dependence and compares it with PV power generation.
The remainder of this paper is organized as follows: Section 2 presents the objective areas and datasets used in subsequent sections. Section 3 analyzes the air temperature dependence of the relationships between electricity demand and the generation probabilities of wind and PV power. Section 4 calculates the winter capacity values of wind and PV power, and describes the reasons for their differences. Section 5 summarizes the discussion and provides concluding remarks.
2 Objective areas and datasets
2.1 Electricity demand
The Tohoku power system covers seven prefectures (six prefectures in the Tohoku area and Niigata prefecture), as shown in light yellow in Figure 2. The Tokyo power system covers seven prefectures (Tokyo metropolitan area, six prefectures in the Kanto area, Yamanashi prefecture, and the eastern part of the Shizuoka prefecture), as indicated by the light purple area in Figure 2. The hourly electricity demand data from the Tohoku and Tokyo power systems were downloaded from the utility websites and used in this study.
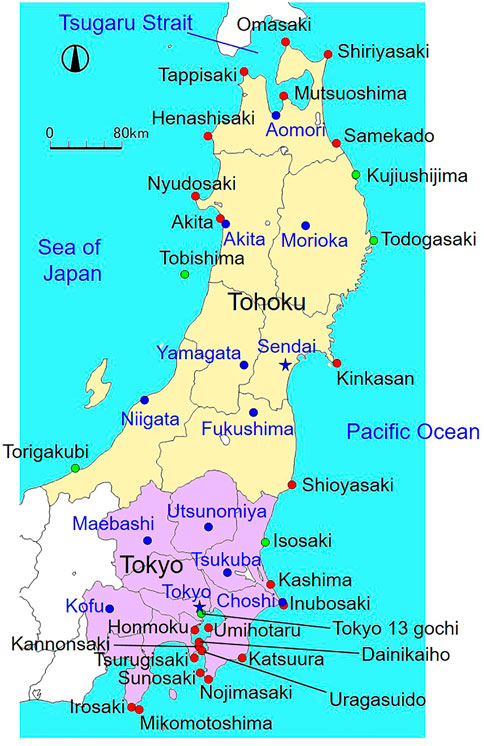
FIGURE 2. Areas of Tohoku and Tokyo power systems and observation locations for wind speed (red and green circles), solar irradiance, and air temperature (blue stars and circles).
2.2 Wind power output
The locations (14 in Tohoku and 15 in Tokyo) of the lighthouses are indicated by red or green circles in Figure 2. The 10-min average wind speed data measured every 30 min at the lighthouses were downloaded from the website of the Japan Oceanographic Data Center, and the obtained data were used to simulate the wind power output from wind farms. The annual average wind speeds at the observation height in the Tohoku and Tokyo areas are listed in Table 2A and Table 3A, respectively. First, the wind speed
where the power index
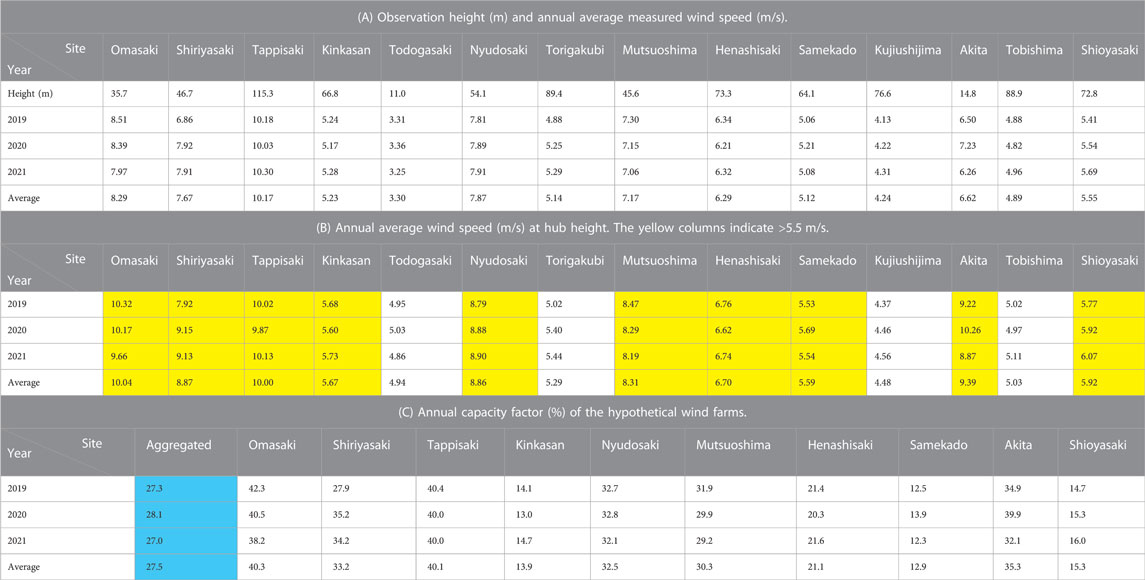
TABLE 2. Average wind speeds and capacity factors of the hypothetical wind farms at respective sites in Tohoku.
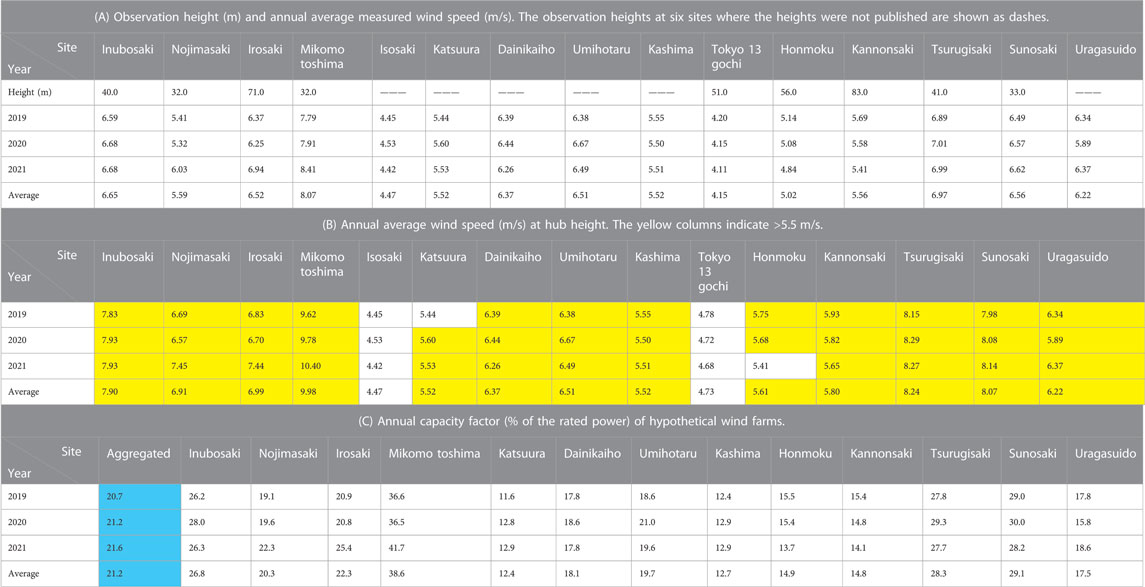
TABLE 3. Average wind speeds and capacity factors of the hypothetical wind farms at respective sites in Tokyo.
Subsequently, locations with an average wind speed >5.5 m/s were selected as suitable sites for wind power generation. Table 2B, Table 3B indicate that 10 and 13 locations in the Tohoku and Tokyo areas, respectively, have an average wind speed >5.5 m/s, as indicated by the red circles in Figure 2. Wind farms with the same rated power were assumed to be deployed at their respective sites. The generated power was simulated from the wind speed at the hub height using the equivalent power curve of an offshore wind farm1, as shown in Figure 3A (McLean, 2008). Considering the wake effect, availability, and electrical losses, the peak value of the normalized power curve was limited to 89%. The annual averages of the normalized output power (the same as the capacity factors) from the hypothetical wind farms in the Tohoku and Tokyo areas are listed in Table 2C, Table 3C, respectively. The aggregated wind power given in Table 2C, Table 3C indicates the total output power from all hypothetical wind farms, and the capacity factors are approximately 28% and 21% in the Tohoku and Tokyo areas, respectively. In terms of capacity factor, wind power generation is more suitable in the Tohoku area than in Tokyo. In addition, the wide variation in the capacity factor of each site listed in Table 2C, Table 3C indicates an uneven distribution of suitable sites for wind power generation.
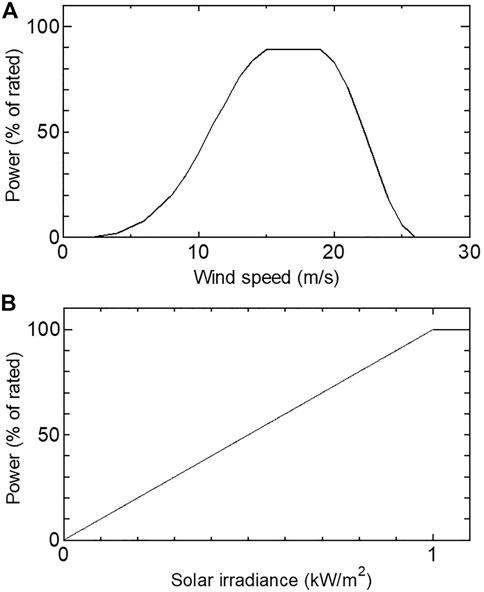
FIGURE 3. Equivalent normalized power curve models of (A) an offshore wind farm and (B) a PV power system.
2.3 PV power output and air temperature
The locations (seven in Tohoku and six in Tokyo) of the automatic surface observations of air temperature and solar irradiance by the Japan Meteorological Agency are shown by blue stars and circles in Figure 2. The data measured every minute were obtained from the Japan Meteorological Business Support Center. The 1-h averages of the solar irradiance data were used to simulate the hourly PV power output from hypothetical PV power plants deployed at the respective sites by assuming a proportional relationship with the solar irradiance and reaching the rated power with a solar irradiance of 1 kW/m2, as shown in Figure 3B. The effects of the snow cover were ignored in the simulation. In the calculation of the aggregated PV power in each area, all the PV power plants at the respective sites were assumed to have the same rated power. The annual averages of the normalized output power (same as the capacity factors) from the hypothetical PV power plants in Tohoku and Tokyo are listed in Table 4. The aggregated PV power in Table 4 indicates the total output power from all hypothetical PV power plants with the same rated power, and the capacity factors are approximately 15% and 16% in the Tohoku and Tokyo areas, respectively. The small difference in the capacity factors among the sites in Table 4 compared with those in Table 2C, Table 3C indicates an almost even distribution of solar energy resources.
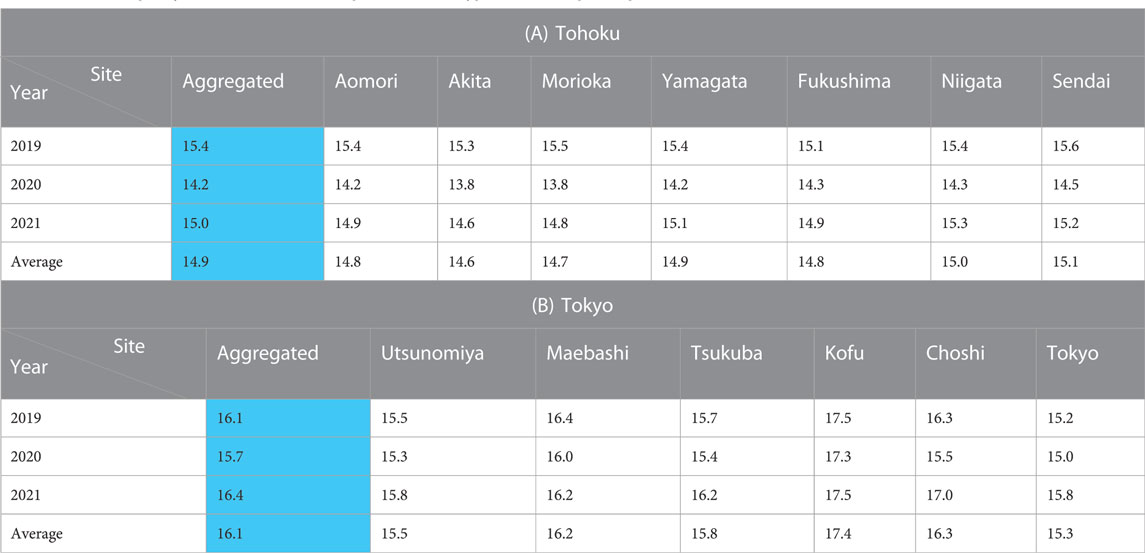
TABLE 4. Annual capacity factor (% of the rated power) of the hypothetical PV power plants.
2.4 Monthly variation
The monthly variation in the average wind power in 2021 in the Tohoku and Tokyo power systems with maximum electricity demand is shown in Figure 4. As sufficient generation facilities should be prepared to cover the maximum electricity demand, a high generation output in the season with the maximum electricity demand is desirable. Figure 4 shows that the monthly maximum electricity demand is high in January (winter) and August (summer). In contrast, as shown in Figure 4A, except for the sites (Samekado, Kinkasan, and Shioyasaki) facing the Pacific Ocean, wind power has a notable tendency to be higher in winter, primarily owing to the East Asian winter monsoon in the Tohoku power system. As shown in Figure 4B, in the Tokyo power system, wind power is still low in summer, but its advantage in winter is less clear, with the exception of Irosaki.
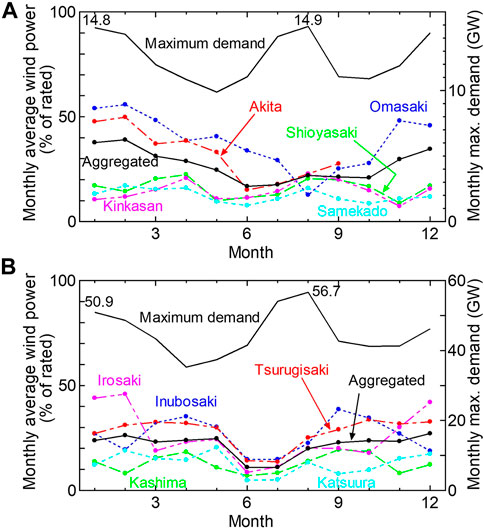
FIGURE 4. Monthly average wind power and peak demand in 2021 in (A) Tohoku and (B) Tokyo power systems.
The monthly variation in the average PV power in 2021 in the Tohoku and Tokyo power systems with maximum electricity demand is shown in Figure 5. Figure 5 indicates that the PV power is higher in spring and summer than in autumn and winter, according to the difference in solar altitude.
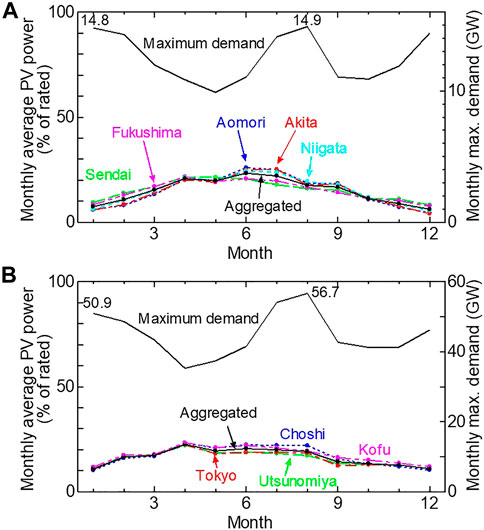
FIGURE 5. Monthly average PV power and peak demand in 2021 in (A) Tohoku and (B) Tokyo power systems.
3 Temperature dependence
3.1 Electricity demand
Scatter plots of hourly data regarding electricity demand and air temperature in the Tohoku and Tokyo power systems from 2019 to 2021 are shown in Figure 6. Air temperatures measured in the largest cities, Sendai and Tokyo, shown by the blue stars in Figure 2, were used for the analysis. In Figure 6, the maximum demand at each air temperature in 1-degree intervals are shown by connecting the black curves. As described in Section 2.4, sufficient generation facilities should be prepared to meet the maximum demand, so therefore, maximum demand is crucial for power systems. The black curves indicate that the maximum demand is highly dependent on air temperature, although the electricity demand is also affected by time slots (morning, afternoon, evening, and night) and days (weekdays, weekends, and holidays). In both the Tohoku and Tokyo power systems, the maximum demand has a bottom at an air temperature of approximately 19 °C, and whether it is higher or lower, it increases further away from the temperature because of the requirement for air conditioning or heating.
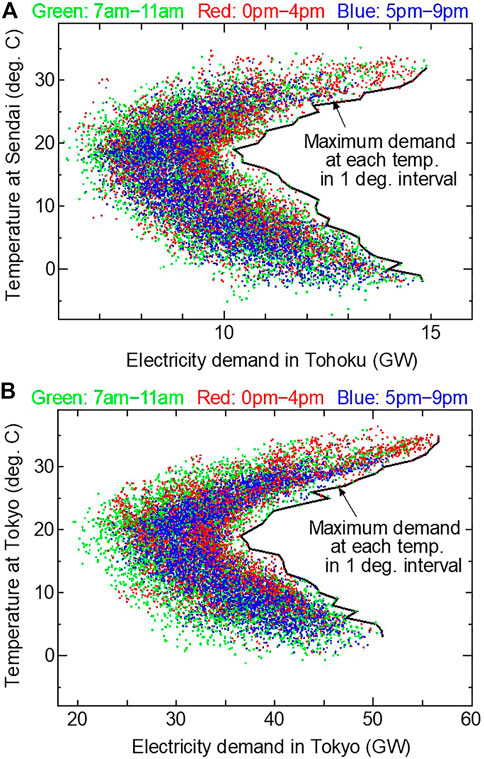
FIGURE 6. Scatter plots of hourly data regarding electricity demand and air temperature in (A) Tohoku and (B) Tokyo power systems for 3 years from 2019 to 2021.
In Figure 6, the time zones are distinguished by color: green, red, and blue correspond to morning, afternoon, and evening, respectively. Figure 6 indicates that a high electricity demand in cold winters occurs even in the evening when the PV power does not work owing to sunset. Meanwhile, another high electricity demand in hot summers does not occur in the evening, but often in the afternoon and occasionally in the morning, when the PV power can work well.
3.2 Wind power output
Scatter plots of hourly data regarding aggregated wind power and air temperature in the Tohoku and Tokyo power systems from 2019 to 2021 are shown in Figure 7. The average and maximum powers at each air temperature in 1-degree intervals are shown as bold and normal black curves, respectively. For variable power sources such as wind and PV power generation, the average power is more important than the maximum power because the expected supply capability must be evaluated using a probabilistic approach. The bold black curves indicate that the colder the air temperature, the higher is the average aggregated wind power in both the Tohoku and Tokyo power systems. This trend is clearer in Tohoku than in Tokyo; in particular, the average aggregated wind power rises drastically when the air temperature at Sendai drops below 3 °C and reaches approximately 40% of the rated power below freezing temperatures. This feature makes wind power a promising power source for cold winters, when the electricity demand increases in the Tohoku power system.
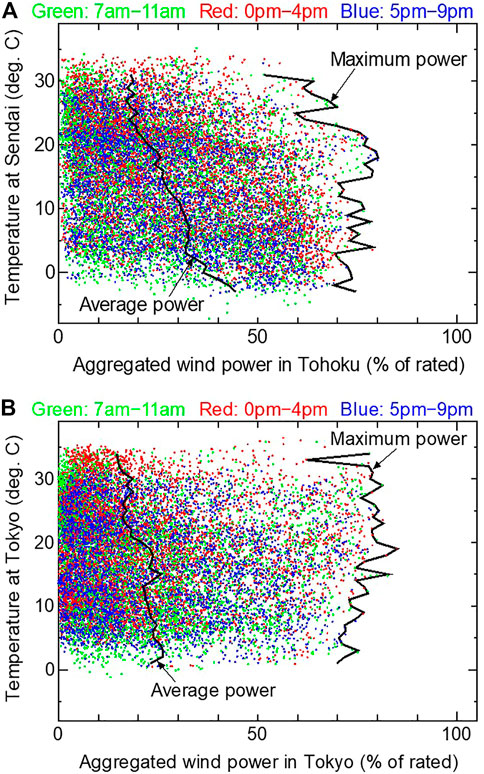
FIGURE 7. Scatter plots of hourly data regarding aggregated wind power and air temperature in (A) Tohoku and (B) Tokyo power systems for 3 years from 2019 to 2021.
In Figure 7, the time zones are distinguished by color: green plots correspond to the morning, red to the afternoon, and blue to the evening. Figure 7 shows that the aggregated wind power is not related to the time zone.
3.3 PV power output
Scatter plots of hourly data regarding the aggregated PV power and air temperature in the Tohoku and Tokyo power systems from 2019 to 2021 are shown in Figure 8. In principle, high PV power can only be expected at noon and several hours before and after the Sun reaches high altitudes. Thus, in Figure 8, the time zones are distinguished by color: red plots correspond to the period from 9 a.m. to 2 p.m., and green to daytime hours, excluding the red time zone. In Figure 8, the average and maximum powers at each air temperature in 1-degree intervals during the red time zone from 9 a.m. to 2 p.m. are shown by connecting purple and black curves, respectively. The purple curves indicate that the average aggregated PV power increased as the air temperature increased in both the Tohoku and Tokyo power systems, although some fluctuations were observed. In particular, the average aggregated PV power during the red time zone exceeds 40% and 60% of the rated power above 20°C and 30 °C, respectively. In contrast, the black curves indicate that at temperatures below 10 °C, the maximum power of the aggregated PV power generation decreases significantly as the temperature decreases because of bad weather conditions. The maximum power for 3 years is less than 50% of the rated power below the freezing temperature. These features make PV power a promising power source for hot summers but not for cold winters in both the Tohoku and Tokyo power systems.
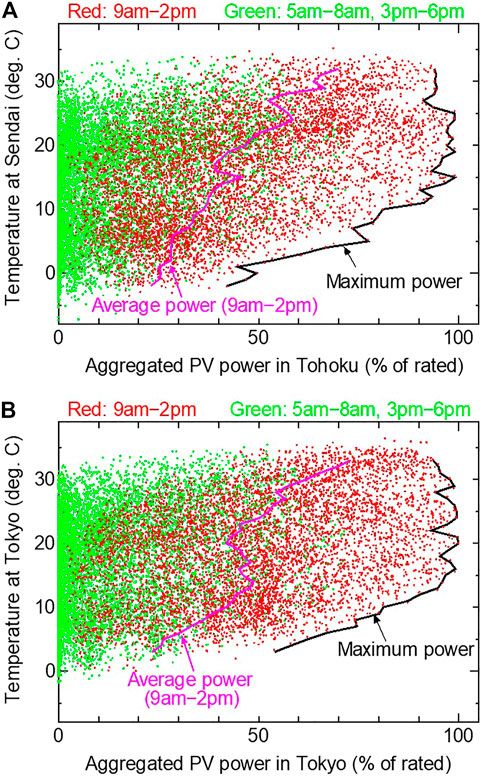
FIGURE 8. Scatter plots of hourly data regarding aggregated PV power and air temperature in (A) Tohoku and (B) Tokyo power systems for 3 years from 2019 to 2021.
4 Winter capacity values
4.1 Methodology
The capacity value of a power plant refers to the additional load that can be served by the addition of the plant to the electrical power system while maintaining existing reliability levels. This index is used to estimate whether the power system has sufficient total capacity to meet the electricity demand. The effective load-carrying capability method, which is based on the loss of load expectation, is popular and is considered the most accurate method for evaluating the capacity values of variable generation (Keane, 2011); however, it requires complicated analysis with detailed data of the generator and load, including forced outage rates and maintenance schedules for conventional power units in the electrical power system. By contrast, the PPCF method, which uses capacity factors with a confidence (exceedance) level (or average capacity factors) over a certain peak load period, is clearer and simpler in concept (Lu, 2012). In this study, the winter capacity values of wind and PV power generation in the Tohoku and Tokyo power systems were analyzed using the PPCF method with a 90% confidence level2. This method with the same confidence level is referred to as the K90 method in the literature; this was authored by researchers working at the Tokyo Electric Power Company, which owned and operated the Tokyo power system and almost all conventional power plants (Miyazaki, 2004). The procedure for evaluating the winter capacity values is as follows.
1. System load duration curves were drawn in winter for 4 months (January–March and December), and a high-ranking 50 h was extracted for each year. Since hourly data were used in this study, 50 data points were extracted from the 2,904 data points.
2. The generated power output data in the extracted 50 h were arranged in decreasing order, representing the duration curve during the winter peak demand period. The curves with less than 50 data points owing to a lack of data were drawn up to 50 h.
3. The winter capacity values were determined by the generated power at 90% of the time in the duration curve; that is, the 45th generated power in the 50 data points in the case without a lack of data.
4.2 Wind power
The duration curves of wind power during the winter peak demand period are shown in Figure 9. The stepped curves of the respective wind farms were due to the coarse wind speed resolution of 1 m/s. The slopes of the duration curves of the aggregated wind power are more moderate than those of the respective wind farms owing to the smoothing effect (Holttinen, 2012), which almost eliminates time without power output; the wind is always blowing somewhere in the area. Consequently, the capacity values increased by aggregating the outputs of the geographically distributed wind farms.
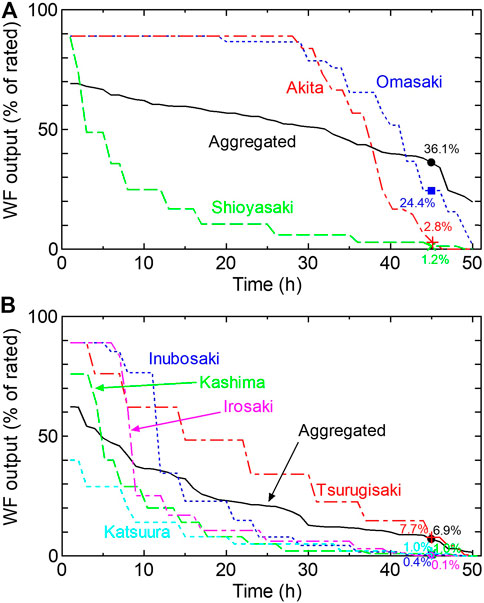
FIGURE 9. Duration curves of the wind power output from respective hypothetical wind farms and the aggregated power output at high demand 50 h in winter 2021 in (A) Tohoku and (B) Tokyo power systems.
Table 5 lists the winter capacity values evaluated for wind power. Table 5A indicates that, in the Tohoku power system, the winter capacity values of the aggregated wind power are approximately 40%, which are sufficiently high and higher than the annual capacity factors (
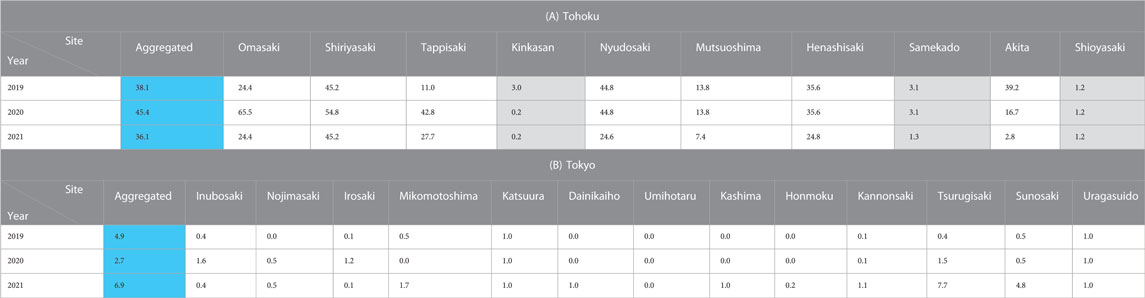
TABLE 5. winter capacity values (% of the rated power) of each hypothetical wind farm and aggregated wind power.
Table 5B indicates that in the Tokyo power system, the winter capacity values of the aggregated wind power are low (
4.3 PV power
The duration curves of PV power during the winter peak demand period are illustrated in Figure 10. This indicates that even the maximum output is at most 55% of the rated power in the top 50 h, with a high electricity demand in winter. Furthermore, approximately 30% of the top 50 h occurred at 5 p.m. or 6 p.m., when the Sun was almost set. Consequently, the PPCF method with a 90% confidence level evaluated the winter capacity values at all zeros in both the Tohoku and Tokyo power systems for the aggregated PV power and the respective PV power plants.
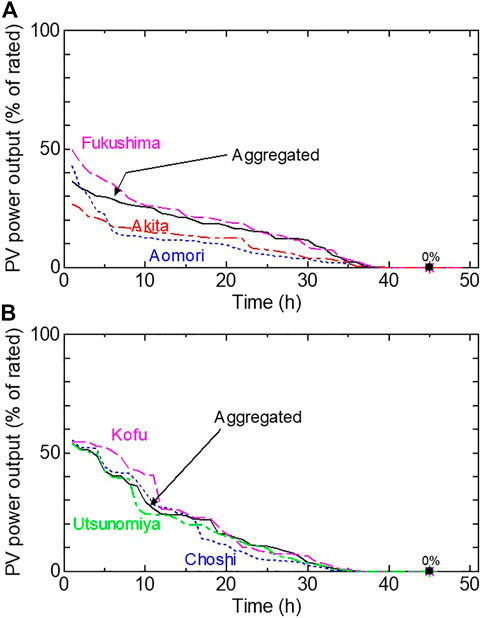
FIGURE 10. Duration curves of the PV power output from the respective hypothetical PV power plants and the aggregated power output at high demand 50 h in winter 2021 in (A) Tohoku and (B) Tokyo power systems.
5 Conclusion
In Japan, wind power penetration has been relatively lower than that of PV power. This discrepancy in shares causes a lack of reserves in the power systems. On a day with an unusually low temperature in March 2022, there was a risk of a power shortage supplied by the Tohoku and Tokyo power systems owing to the spiked demand. Mass-installed PV power systems cannot be considered as winter supply capacity because they generate almost no electricity during such heavy demand in winter. In contrast, wind power is promising in these areas because of its high output owing to the East Asian winter monsoon. This is clarified quantitatively using the electricity demand data, wind speed data measured at lighthouses, and data of air temperature and solar irradiance collected at weather stations of the Japan Meteorological Agency, and the following results were obtained.
• The electricity demand decreases at an air temperature of approximately 19 °C, and whether it is higher or lower, the demand increases further away from the temperature because of the requirement for air conditioning or heating.
• The colder the air temperature, the higher the wind power, and this trend is clearer in Tohoku than in Tokyo.
• The PV power at noon and several hours before and after increased with increasing air temperatures. In contrast, at temperatures below 10 °C, even the maximum power decreased significantly as the temperature decreased.
• The winter capacity values of wind power in the Tohoku power system are approximately 40%, which is sufficiently high and higher than the annual capacity factors (
• The winter wind power capacity values in the Tokyo power system, where all coasts are on the Pacific Ocean side, are low (
• The winter capacity values of PV power for both the Tohoku and Tokyo power systems were zero. This is because approximately 30% of the top 50 h of high electricity demand occurred at 5 p.m. or 6 p.m., when the Sun was almost set.
The above results indicate that increasing offshore wind farms along the Tohoku area is effective for supplying part of the tight winter electricity demand of the power systems in eastern Japan and for increasing the share of renewable energy sources. In general, extreme deviations in the installed capacities of different variable-generation technologies should be avoided because their appropriate combination can reduce the variability and uncertainty of individual variable-generation technologies.
Data availability statement
The datasets presented in this article are not readily available because the generated datasets are the intellectual property of the author's affiliation, so they can be provided if permission is obtained from the affiliation. Requests to access the datasets should be directed to JK, ai5rb25kb2hAcnMudHVzLmFjLmpw.
Author contributions
JK has made a substantial, direct, and intellectual contribution to the work.
Funding
This research was partially funded by the JSPS KAKENHI (grant number: JP19H02380).
Conflict of interest
The authors declare that the research was conducted in the absence of any commercial or financial relationships that could be construed as a potential conflict of interest.
Publisher’s note
All claims expressed in this article are solely those of the authors and do not necessarily represent those of their affiliated organizations, or those of the publisher, the editors and the reviewers. Any product that may be evaluated in this article, or claim that may be made by its manufacturer, is not guaranteed or endorsed by the publisher.
Footnotes
1Although the power curve of a lowland onshore wind farm was previously used (Kondoh, 2022), the power curve of an offshore wind farm is used in this study.
2In principle, the higher the confidence level, the lower (more conservative) the capacity value, which was confirmed by the comparison of analytical results at 50%, 70%, and 90% confidence levels (Lu, 2012). Additionally, 90% confidence level was used to reflect the availability of coal-fired plants in China (Hu, 2019).
References
Asahi Shimbun (2022). TEPCO urges power savings, warns of possible Tokyo blackout. Available at: https://www.asahi.com/ajw/articles/14578643.
Central Research Institute of Electric Power Industry (CRIEPI) (2002). Investigation on stabilization of wind power and power systems. Report of NEDO Project, 111. (in Japanese).
Holttinen, H., and Hirvonen, R. (2012). “Power system impacts of wind power,” in Chapter 6 in wind Power in power systems, (Wiley), 105–130.
Hu, J., Harmsen, R., Crijns-Graus, W., and Worrell, E. (2019). Geographical optimization of variable renewable energy capacity in China using modern portfolio theory. Appl. Energy 253, 113614. doi:10.1016/j.apenergy.2019.113614
IEA PVPS (2022). Trends in photovoltaic applications 2022, T1-43, Paris, France. International Energy Agency, 2022.
Katsumata, T. (2008). Summary of comments made by tsunehisa katsumata, FEPC chairman. The Federation of Electric Power Companies of Japan. Press Conference on May 23 Available at: https://www.fepc.or.jp/english/news/conference/__icsFiles/afieldfile/2008/08/27/200805.pdf.
Keane, A., Milligan, M., Dent, C. J., Hasche, B., D'Annunzio, C., Dragoon, K., et al. (2011). Capacity value of wind power. IEEE Trans. Power Syst. 26, 564–572. doi:10.1109/TPWRS.2010.2062543
Kogaki, T. (2012). IEA WIND 2011 annual report, 123. https://usercontent.one/wp/iea-wind.org/wp-content/uploads/2022/12/2011-IEA-Annual-Report.pdf.
Kondoh, J. (2022). Winter capacity values of wind power in eastern Japan power systems. Web Conf. 1-4. Proceedings of the Grand Renewable Energy 2022, December 2022, 10.24rated power for high winterdemand at thes752/gre.2.0_24
Lu, S., Diao, R., Samaan, N., and Etingov, P. (2012). Capacity value of PV and wind generation in the NV energy system. Pacific Northwest National Laboratory, Richland, WA. PNNL-22117.
McLean, J. R. (2008). Equivalent wind power curves. TradeWind technical report, WP2.6. Available at: http://www.trade-wind.eu/.
Miyazaki, S., Abe, H., Yamaji, K., and Tsuzuku, K. (2004). An evaluation of kW-value with an analysis of measured data of PV systems for houses. IEEJ Trans. Power & Energy 124, 1293–1299. (in Japanese). doi:10.1541/ieejpes.124.1293
Mizuno, E. (2014). Overview of wind energy policy and development in Japan. Renew. Sustain. Energy Rev. 40, 999–1018. doi:10.1016/j.rser.2014.07.184
Public-Private Council on Enhancement of Industrial Competitiveness for Offshore Wind Power Generation (2020). Vision for offshore wind power industry (1st), Ministry of Economy, Trade and Industry. Available at: https://www.enecho.meti.go.jp/category/saving_and_new/saiene/yojo_furyoku/dl/vision/vision_first_en.pdf.
Takahashi, Y., Asakawa, T., and Nakatsugawa, H. (2022). Power shortage sheds light on inadequate post-quake response by Japan gov't, utility firms, Japan, The Mainichi Newspapers. Available at: https://mainichi.jp/english/articles/20220323/p2a/00m/0na/014000c.
Watanabe, Y. (2022). IEA WIND country report 2011 Japan, 2. Available at: https://iea-wind.org/wp-content/uploads/2022/12/IEA_Wind_TCP_AR2021_Japan.pdf.
Yamamoto, M., and Ikki, O. (2010). National survey report of PV power applications in Japan 2009, 1, Paris, France. IEA PVPS Task, 42. Available at: https://iea-pvps.org/wp-content/uploads/2020/01/nsr_2009_JPN.pdf.
Appendix A: Impact of estimation errors of wind speed at hub height
The impact of a missing
According to the power curve shown in Figure 3A,
Therefore, in this study, the range of variation in
Keywords: wind power, photovoltaic power (PV), electricity demand, capacity value, air temperature
Citation: Kondoh J (2023) Validity of wind power for heavy winter demand in eastern Japan power systems. Front. Energy Res. 11:1185961. doi: 10.3389/fenrg.2023.1185961
Received: 14 March 2023; Accepted: 03 May 2023;
Published: 25 May 2023.
Edited by:
Yolanda Vidal, Universitat Politecnica de Catalunya, SpainReviewed by:
Emilio Gomez-Lazaro, University of Castilla-La Mancha, SpainKishan Prudhvi Guddanti, Pacific Northwest National Laboratory (DOE), United States
Copyright © 2023 Kondoh. This is an open-access article distributed under the terms of the Creative Commons Attribution License (CC BY). The use, distribution or reproduction in other forums is permitted, provided the original author(s) and the copyright owner(s) are credited and that the original publication in this journal is cited, in accordance with accepted academic practice. No use, distribution or reproduction is permitted which does not comply with these terms.
*Correspondence: Junji Kondoh, ai5rb25kb2hAcnMudHVzLmFjLmpw