 Dongjun Cui
 Jinghan He1
 Zhao Liu
- 1School of Electrical Engineering, Beijing Jiaotong University, Beijing, China
- 2Capital Power Exchange Center Co., Ltd., Beijing, China
In the paper of the participation of multiple types of market members, such as photovoltaics, wind power, and distributed energy storage, in market-based trading, the development of new power systems hinges on strengthening the adaptability of power systems to accommodate various types of market participants and improving their flexibility. The establishment of a modern power system also faced major challenges. Such as how to achieving collaborative operation between the main grid, regional distribution networks, and distributed power generation and consumption devices, and how to improving the flexibility of grid operation, and how to increasing device utilization, and reducing operating costs. In view of above-mentioned issues, this study proposed employing the traceability and anti-tampering features of blockchain technology tackle the issue of establishing mutual trust among different types of market participants and, considering the high volatility of new energy output, studies the configuration of a flexible power system in response to output deviations resulting from day-ahead forecasting-intraday operation (DAF-IDO). A market-based trading mechanism involving multiple types of market participants has been established to smooth out the deviation in output from different types of participants, improving the economic benefits of system operation. This study has made innovative contributions as follows: First, this study employed blockchain technology to enable the participation of various types of market participants in trading activities together. Second, this study proposed a method for determining DAF-IDO energy storage action deviations to allow regional distribution networks based on distribution network operators to quantitatively calculate their energy storage supply and demand, providing crucial methodological support for their participation in market trading in the future. Third, the study developed a trading mechanism based on combinatorial auctions for multiple types of market participants, and incorporated an valley compensation mechanism into the pricing mechanism to encourage active and autonomous participation of users, while also considering the economic benefits of all parties involved. Ultimately, numerical simulations were conducted to verify the feasibility and rationality of the trading mechanism, taking into account the DAF-IDO energy storage action deviations while multiple regional networks are participating.
1 Introduction
In view of the gradual increase in the installed capacity of global renewable energy, the volatility and uncertainty of wind and photovoltaic output has posed significant challenges to the power systems, which can be tackled through the development of market-based trading mechanisms that enhance power system flexibility. At the same time, energy storage devices can be used to efficiently store and discharge energy, providing the necessary flexibility and stability for power systems, thereby facilitating the construction of the energy internet (Zhang et al., 2018). Based on their scale and distribution characteristics, energy storage devices can be broadly categorized into two types: centralized and distributed. Distributed energy storage, in contrast to centralized energy storage, is predominantly installed on the user end to smooth out the variability of renewable energy output. The energy revolution inevitable renders the collaborative operation of renewable energy and distributed energy storage. In addition, with the increasing proportion of renewable energy connected to the grid, there will be a growing demand for distributed energy storage and associated services on the user end (Liu et al., 2017). However, the current underdeveloped commercial models (Li Jianlin et al., 2022), high investment costs (Li Jianlin et al., 2022), and low utilization rates of devices (Li Shanshan et al., 2022) have hindered the development of distributed energy storage, leading to a decrease in user enthusiasm for its configuration (Zhou et al., 2018). Therefore, the exploration of new strategies for user-end distributed energy storage to participate in market activities has emerged as an important research direction in the field of distributed energy trading.
As one of the important application scenarios for distributed energy storage, regional distribution networks are equipped with renewable energy devices, such as wind turbines and photovoltaics. The uncertainty in their output can lead to deviations in day-ahead forecasting-intraday operation (DAF-IDO). On this basis, scholars have conducted research on operation scheduling and market mechanisms. Reference (Huang et al., 2023) proposed a scheduling method for the mutual complementation of multiple energy sources, such as wind, photovoltaics, and storage, on multiple time scales to smooth out the joint output volatility of wind and photovoltaic power. Taking source-load uncertainty into consideration, the authors of reference (Nan et al., 2023) made flexible adjustments to the scheduling plan during the intraday phase based on the day-ahead comprehensive energy system scheduling plan. In terms of operation scheduling, existing literature has primarily concentrated on the collaborative operation of energy storages with wind and photovoltaic power sources that smooths out deviations by adjusting the specific amount of energy storage charging and discharging during the intraday phase to fulfill energy requirements. The authors of reference (Chen Xi et al., 2023) took into account both day-ahead and intraday scenarios during the scenario generation phase and, on this basis, proposed a master-slave gaming model that involves microgrid clusters and shared energy storage operators for trading. However, there has been a relatively limited amount of research conducted on the utilization of market mechanisms to address DAF-IDO deviations despite its importance. In addition, research in this area is often based on the specific amount of energy storage action required to satisfy electricity demand and smooth out DAF-IDO deviations during day-ahead and intraday phases. In short, existing literature on DAF-IDO uncertainty primarily focuses on the amount of energy storage charging and discharging action determined, while disregarding the correlation between the specific day-ahead and intraday amount of action and their market applicability.
In recent years, the booming sharing economy model has facilitated the participation of energy storage in market trading by overcoming the limitations of conventional economic models (Li Shanshan et al., 2022). The model of shared energy storage involves the investment and operation of public energy storage devices by third parties (Li Jianlin et al., 2022) or through joint efforts of all users (Tushar et al., 2016), thereby providing energy storage services to multiple users (Dai et al., 2021). Reference (YAN and CHEN, 2022) provided a detailed introduction to the concept and application scenarios of shared energy storage, and summarized and analyzed the relevant business models and pricing mechanisms associated with this model. The authors of reference (Chen Cen et al., 2023) designed a distributed two-layer P2P cooperation and sharing model, integrating energy storage resources in neighboring communities for capacity sharing. Whereas references (Li et al., 2021; Dai et al., 2022; Hu et al., 2022) introduced blockchain technology into distributed electricity trading, which enabled online trading, optimized matching, and subsequent control of distributed energy storage. The aforementioned studies on shared energy storage can, to some extent, improve the utilization rate of energy storage devices, and mitigate the problem of limited development of energy storage due to the high costs involved. On this basis, Chinese and international scholars have proposed an electricity trading mechanism based on blockchain technology.
Blockchain technology offers several advantages, including decentralization, tamper-proofing, and distributed ledger. Given adequate computational power, it can integrate centralized and distributed trading modes. Reference (Cui et al., 2022) introduced a method for utilizing blockchain technology to facilitate the integration and interconnection of trading and scheduling businesses under the regulatory system. Meanwhile, reference (Yan and Chen, 2022) established a two-layer operator-community-user energy storage capacity sharing model based on centralized energy storage power stations. It also designed an energy storage service pricing mechanism based on the Nash negotiation model to allocate social welfare among all participants. And reference (Ma et al., 2022) proposed a method for users to access energy storage services by renting centralized energy storage managed by energy storage operators, and introduced a bidding mechanism into the energy storage model to improve users’ autonomy and trading efficiency. Previous research on energy storage business models have suggested that energy storage service providers must either invest in building centralized energy storage power stations or acquire the rights to use distributed energy storage devices on the user end to consolidate them into a centralized energy storage with a large capacity, which can then be used to provide energy storage leasing services. However, both modes of operations require high upfront investment costs. Most services are based on centralized energy storage power stations, with little participation in distributed energy storage. The process by which distributed energy storage resources on the user end can participate in cloud energy storage services is relatively straightforward, albeit lacking in autonomy.
Based on the analysis above, this study proposed a distributed energy storage trading mechanism that takes into consideration DAF-IDO energy storage action deviations under multiple distribution network operations to further improve the utilization of distributed energy storage devices and foster the autonomy of multiple types of market participants, such as energy storage users, in market trading. First, taking into account DAF-IDO deviations comprehensively (Wang et al., 2022), a method for determining energy storage trading volume is proposed, which provides crucial methodological support for the participation of distributed energy storage in market trading. Second, a distributed energy storage trading mechanism based on the combinatorial auction mechanism is designed with the support of blockchain technology. This mechanism enables distributed energy storage users to achieve optimal operation costs within a single distribution network and encourages resource sharing among multiple distribution networks, thereby improving the utilization of distributed energy storage resources. In terms of blockchain integration with various market participants, the blockchain serves as a carrier of information and the auction organization. When combined with effective trust mechanisms, this mechanism negates the necessity of centralized energy storage resources as a precondition for service development, thereby reducing the upfront investment required for system operation. It also enables decentralized control of energy storage resources, eliminating the need for centralized control and improving user participation and market competitiveness. Subsequently, the pricing mechanism for market trading is improved, and a compensation mechanism for valley time periods is proposed to augment users’ inclination to participate in trading under low tariffs. Finally, the proposed blockchain-based distributed energy storage trading mechanism is evaluated for its feasibility and rationality under multiple distribution network operations through numerical simulations, and the key innovations achieved are as follows.
(1) A method for determining DAF-IDO energy storage action deviations is proposed, which diversifies the forms of energy storage participation in the market trading and improves the participation of energy storage in the market;
(2) A distributed energy storage trading mechanism based on blockchain information transmission and taking into consideration DAF-IDO energy storage action deviations is designed under multiple distribution networks. This mechanism improves users’ trading autonomy and enthusiasm while achieving the distributed energy storage resource sharing among different distribution networks, which provides a new market strategy and conceptual framework for the application of blockchain technology in the power industry;
(3) An valley compensation mechanism is incorporated into the pricing mechanism by providing compensation to the blockchain nodes participating in trading, which increases users’ inclination to participate in market trading under low tariffs.
2 Blockchain-based distributed energy storage trading taking into consideration DAF-IDO energy storage action deviations
2.1 Design of blockchain trading process
Due to its decentralization nature, information traceability, autonomy, openness, and tamper-proofing features, blockchain technology can be applied to electricity market trading. This proves advantageous in solving problems, such as multi-party trust, data security, and business certification in the context of business interactions involving a large number of external participants in the power market. Blockchain technology has been used in power market data management, resulting in the establishment of an open, collaborative, and secure technical support system for power markets that supports the participation of multiple types of market participants in the future.
The trading process in blockchain can be primarily summarized into four stages, that is, trading signature, trading dissemination, trading confirmation, and trading writing. To begin with, blockchain is transmitted to nearby nodes in the P2P network through signed transactions. Subsequently, upon receipt, adjacent nodes begin to confirm the validity of the trading. Each node creates a trading verification pool based on its own verified trading in chronological order. At this point, the trading in this pool has not been acknowledged by all nodes present in the entire network. Then, upon receiving confirmation from all nodes, the trade is written into the blockchain. After successful mining, the miner transmits the packaged block through the network, and when the entire network has verified the new block, the said black is appended to the main blockchain, thereby confirming the trading process. Figure 1 illustrates the complete process.
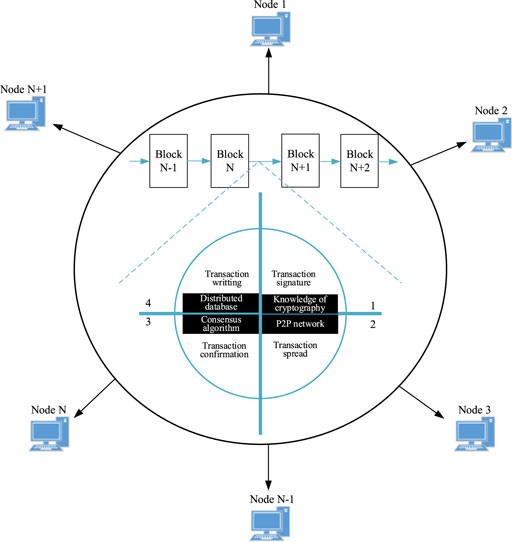
FIGURE 1. The chart of blockchain transaction flow.
Distributed participants can be set as blockchain nodes, and centralized dispatch data can be stored and transmitted on the blockchain, the application of blockchain technology can be used in distributed participants and centralized dispatch participants.
According to the different node permissions, the application modes of blockchain can be categorized into the public chain, alliance chain, and private chain. Alliance chain has less resource occupation and lower cost. Based on the characteristics of different types of blockchain, this study has opted to focus on the alliance chain for further investigation.
2.2 Distributed energy storage trading framework taking into consideration DAF-IDO energy storage action deviations in multiple distribution networks
Existing energy storage business models are predominantly based on centralized energy storage power stations established by energy storage service providers for energy storage capacity leasing services. The participation of distributed energy storage in energy storage services mainly entails the integration of distributed energy storage devices onto the blockchain for unified information transmission and delegation of control over energy storage capacity leasing services. However, there is a lack of investigation into the integration of distributed energy storage with blockchain to participate in energy storage services. Furthermore, under the existing mechanism, the control of energy storage is predominantly held in the hands of energy storage service providers, which constrains users’ flexibility to participate in energy storage services. In addition, energy storage service providers typically offer energy storage services within a single time scale, without taking into consideration DAF-IDO deviations. In light of this, this study proposed a distributed energy storage trading framework taking into account DAF-IDO energy storage action deviations in multiple distribution networks, as shown in Figure 2.
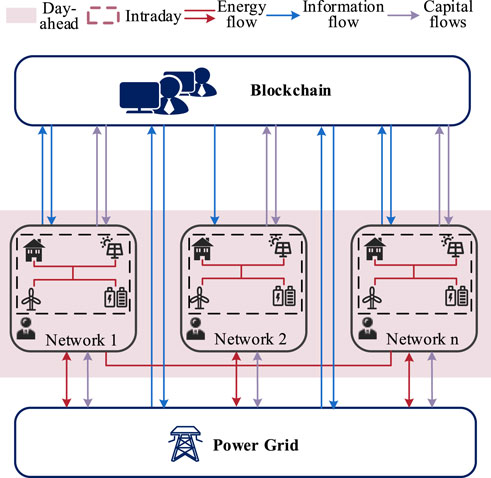
FIGURE 2. Distributed energy storage transaction framework considering DAF-IDO energy storage action deviation in multi-distribution network.
Figure 2 demonstrates that the distributed energy storage trading framework taking into consideration DAF-IDO energy storage action deviations in multiple distribution networks proposed in this study comprises blockchain, various distribution network operators, and the main grid operator, of which the blockchain facilitates the interconnection of different distribution networks and various market participants. Through blockchain information transmission, information exchange and fund flow can be achieved between users and between energy storage devices and users. Distribution network operators, as distribution network managers, engage in optimized scheduling and bidding within their respective distribution networks. The distribution network includes wind power, photovoltaic power, and multiple distributed energy storage devices. In this study, various types of market participants in the distribution network conducted transactions and transmitted information through blockchain, and optimized scheduling is achieved through the trust mechanism of the blockchain.
The distributed energy storage trading framework proposed in this study comprised two phases: the trading volume determination phase and the trading phase. In the first phase, each distribution network operator equipped with distributed energy storage devices develops charging and discharging strategies for such devices based on the predicted values of wind power, photovoltaic power, and load, aiming to minimize the daily energy cost of the distribution network during the day-ahead phase. In the second phase, charging and discharging strategies for distributed energy storage devices are formulated based on the actual intraday operating conditions. Then, according to the DAF-IDO energy storage action deviation determination method proposed in this study, the supply and demand quantities of each distribution network are determined for distributed energy storage trading between distribution networks.
Finally, the information interactions among market participants in different distribution networks via the alliance chain, as shown in Figure 2, is used to control the electricity of distributed energy storage devices, so that energy storage resources in surplus distribution networks can be transferred to insufficient ones during different time periods, thereby enabling the sharing of energy storage resources among different distribution networks. This paper is a theoretical study on the premise that the power grid reserve capacity is sufficient and the power grid and the distribution network follow the unified dispatching rules.
2.3 Distributed energy storage trading mechanism based on combinatorial auctions
In the intraday trading phase, trading actions are participated by a range of distribution network operators, as well as centralized and distributed market participants. We consider the TOU tariff mechanism where the corresponding electricity price is different for different time periods of a day. The transaction price between the distribution network and the power grid will also refer to the TOU price. Due to the differences in energy consumption among different distribution networks and the corresponding demand for energy storage resources, distribution network operators can combinatorially auction energy storage resources to meet energy consumption demand of different distribution networks across different time periods. To ensure the smooth operation of distributed energy storage trading in distribution networks, this study proposed a blockchain-based trading mechanism to achieve centralized scheduling and collaborative trading among distributed market participants, which enables energy storage operators to participate in trading without incurring the significant costs associated with the construction of centralized energy storage stations or the organization of distributed energy storage devices. Instead, they can conduct trading and information transmission through the blockchain, which eliminates the need for complicated centralized control of various energy storage devices, which is conducive to the power system flexibility. The trading process can be divided into six stages as follows.
(1) Integration of distributed energy storage into the alliance chain: The alliance chain facilitates information sharing among market participants, who collaborate in smart contract execution. The chain contains information regarding distributed energy storage service prices, compensation mechanisms, and basic device information. After reaching a trading intention, each distributed energy storage device collaborates with other distributed market participants to balance the electricity within this distribution network.
(2) Trading information determination: Before trading, each distribution network is required to optimize scheduling within this network, determine the charging and discharging strategies for energy storage based on the output of distributed power sources, and determine the quantity of energy storage supply and demand for each intraday time period based on the DAF-IDO energy storage action deviation determination method proposed in this study.
(3) Trading information reporting: Following the determination of the quantity of energy storage supply and demand during each intraday time period, each distribution network submits a bid price for the corresponding electricity quantity to the blockchain to participate in the bidding with the main grid and other distribution networks.
(4) Trading matching: The trading information of each distribution network is matched with the objective of maximizing social welfare. During the matching stage, in the event of a failed round of matching, the trading parties will adjust their trading strategies and continue to match the price until the trading is successfully concluded between the purchaser and the seller. In the event that the supply and demand quantity of the trading parties does not meet the expected trading volume during the auction stage, they will participate in compulsory electricity transfer trading within the main grid.
(5) Trading completion: Each distribution network issues power control instructions to energy storage devices based on the matching information generated during the matching stage, and sells or purchases corresponding energy storage, ultimately leading to the completion of electricity settlement.
(6) Trading settlement: The successfully matched distribution networks settle according to the matching results. Each distributed energy storage operator charges a service fee in accordance with the terms of contract and pays compensation for the corresponding valley time period.
3 Distributed energy optimization operation model for distribution networks
The mechanism proposed in this study is designed to minimize the energy costs of the distribution network when formulating energy storage charging and discharging strategies. Based on the energy optimization sharing model, the charging and discharging strategies for the energy storage day-ahead plan are formulated during the day-ahead phase, and the expected energy storage charging and discharging strategies are formulated during the intraday phase.
3.1 Objective function
The renewable energy output in each distribution network includes centralized wind power and photovoltaic power, with some distribution networks equipped with distributed energy storage devices. In the operation and scheduling of the distribution network, the distribution network operator establishes an objective function aimed at minimizing the energy costs, expressed as follows:
where
3.2 Electric power balance constraints
where
3.3 Device model and constraints
3.3.1 Distributed wind and photovoltaic unit model and constraints
The output model and constraints of the distributed photovoltaic unit are as follows:
where
The processing model and constraints of the distributed wind turbine generator unit are as follows:
where
3.3.2 Constraints of distributed storage devices
The charging and discharging constraints of distributed storage devices are as follows:
where
To ensure the continuous operation of energy storage devices in subsequent operating days, the net charge capacity for energy storage should be maintained for each operating day. The daily net charge capacity is subject to a constraint, which is defined as follows:
where
The state of charging constraint of the energy storage device is as follows:
The charging and discharging constraints of the energy storage device for each operating day are expressed as follows:
where
3.3.3 Power constraints of the purchased and sold electricity
Electricity can only be purchased or sold at the same time for the distribution network. The constraints are expressed as follows:
where
4 Distributed energy storage trading among intra-day distribution networks based on DAF-IDO energy storage action deviations
4.1 Method for determining DAF-IDO energy storage action deviations
During the day-ahead operational phase, the distribution network operator optimizes the scheduling with the goal of minimizing the energy consumption costs and obtains the charging and discharging strategies for the energy storage plan. The uncertainty of wind and photovoltaic power output can result in deviations between the expected and actual operational performance during the intraday phase. Accordingly, the energy storage charging and discharging strategies obtained through optimized scheduling based on the actual output and load curves during the intraday phase may also deviate from those obtained from the day-ahead phase. The aforementioned factors can lead to scenarios where the energy storage device has insufficient discharge capacity or an excess of electricity stored in the devices during the intra-day phase. At this point, if each distribution network operator continues to charge and discharge according to the day-ahead plan, it may result in additional electricity purchases or idle devices, thereby adversely affecting the economic benefits of the distribution network. Therefore, this study calculated the deviation in the energy storage charging and discharging strategies between the day-ahead plan and the expected intraday plan, and proposed a method for determining the DAF-IDO energy storage action deviation that can reduce the losses caused by the deviation between the predicted conditions in the day-ahead phase and the actual operational performance during the intraday phase in subsequent trading of stored energy.
This method involves determining the energy storage device’s action amount and expected trading volume during the intraday phase according to the expected energy storage charging and discharging strategies during the intraday phase and based on the energy storage charging and discharging strategies of each distribution network operator in the day-ahead energy storage plan. This provides a new way for distributed energy storage to participate in the market trading, thereby adding to its market power.
where
In this case, the specific supply/demand amount of the distribution network is expressed as follows:
Figure 3 illustrates the method for determining the DAF-IDO energy storage action deviation. To more intuitively display the charging and discharging states of energy storage, the depicted charge capacity and discharge capacity are both represented as positive values, where
(1)
(2)
(3)
(4)
(5)
(6)
(7)
(8)
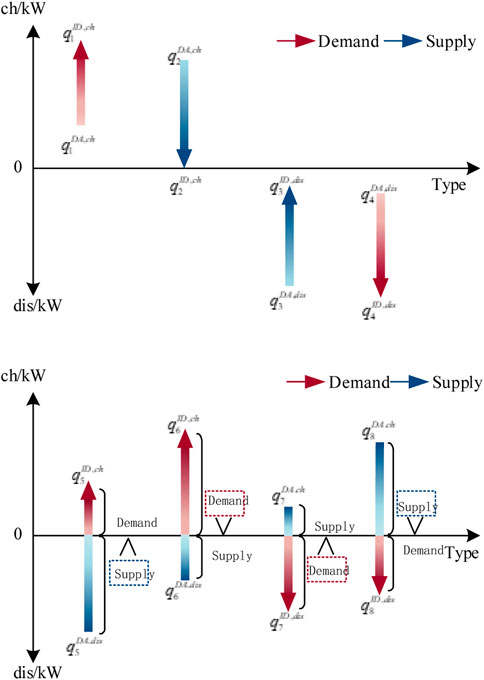
FIGURE 3. DAF-IDO method diagram for determining deviation of energy storage action.
4.2 Combinatorial auction model among distribution networks
Distributed energy storage trading among distribution networks is a competitive non-cooperative behavior, so combinatorial auction is adopted in this study to improve the autonomy of each distribution network participating in the market. The auction process consists three stages, that is, initial bidding, matching, and settlement, as shown in Figure 3. In the initial bidding stage, each distribution network operator, acting as a bidder, uploads the initial bidding price for the bid electricity quantity and conducts supply-demand matching based on the blockchain smart contract and the bidding trading strategy. If the initial bidding price does not meet the conditions for the trading, both the purchaser and seller will re-bid until the trading is concluded. Distribution networks that have successfully traded their expected volume will withdraw from the auction process, whereas those that have not will be added to the queue of unsuccessful networks and participate in the subsequent bidding round. In the event that distribution networks have bids that were not successfully matched or have not fully satisfied their expected volume during the trading process, they will participate in the final compulsory electricity transfer trading with the main grid.
4.2.1 Bidding
During the intraday phase, bidding information from each distribution network operator comprises the energy storage amount and corresponding price for each time period. The supply quantity and initial bidding price of each distribution network are as follows:
where
Similarly, the demand quantity and initial bidding price of the distribution network are as follows:
where
The bidding data are uploaded by each distribution network operator onto the blockchain, which subsequently records and transmits the data.
4.2.2 Winner determination problem model in auctions
The objective of the auctioneer in a two-way combinatorial auction is to maximize social welfare by determining the winners. Social welfare
where
4.2.3 Pricing and settlement model
4.2.3.1 First round of auction
In the auction process, distribution network operators with different supply and demand situations in each time period participate in the bidding. Given the fact that both the distributed participants in each distribution network and the centralized distribution network control center act as nodes in the blockchain, they can be coordinated through intelligent cooperation to achieve the objective of maximizing economic efficiency. The bidding strategy on the initial auction price is as follows:
The supplier’s bidding price for the distribution network:
The purchaser’s bidding price for the distribution network:
where
During the initial bidding stage, the distribution network operators on the supply end for each time period are arranged in ascending order based on their bidding price, while the distribution network operators on the demand end are arranged in descending order. The trading proves to be successful if
The business volume in the first round of trading is:
where
It should be noted that in cases where there are multiple purchasers and sellers within a given time frame, the auctioneer always matches them according to the maximum social welfare. If there is no winner in the first round of trading, the next round of the auction queue will follow. If there are multiple distribution networks with the same bidding price for a given time period, they will be matched according to the upload time of the bidding data, with the distribution network that uploaded their data earlier being given priority.
4.2.3.2 Concessional auction
The winning bidders in the first round of trading are removed from the queue while those failed adjust their bidding prices:
where
Similarly, the trading price in the concessional trading stage is as follows:
The total trading amount in the concession trading stage is as follows:
where
4.2.3.3 Compulsory electricity trading with the main grid
If there is excess capacity in the distribution network after each round of trading, compulsory electricity trading with the main grid will occur. The surplus capacity of the distribution network operators for both the supplier and purchaser during each time period is expressed as follows:
Therefore, the total revenue generated from the trading between the distribution network and the main grid can be expressed as follows:
4.2.3.4 Valley compensation mechanism
The pricing mechanism proposed in this study established that the bidding prices offered by each distribution network operator always fall within the range between the wind/photovoltaic feed-in tariff and the time-of-use tariff of the grid. For the purchaser, it is cheaper to purchase electricity from other distribution networks rather than the main grid at the time-of-use tariff. For the seller, selling surplus electricity from its distribution network or exporting it to the main grid can generate additional revenue. However, the economic efficiency may be reduced if grid operators continue to trade according to their bidding prices, given that the selling price of the main grid is lower than their bidding prices during valley periods. This may also lower the distribution network operators’ enthusiasm to participate in trading during valley periods. To incentivize operators in the park to participate in trading during valley time periods, this study proposed an valley compensation mechanism, in which each distribution network compensates the purchaser and seller who have concluded trading at a certain rate based on the trading volume during valley time periods.
where
4.2.3.5 Benefit settlement model
The total revenue of the distribution network encompasses the revenue generated by the distribution network operator. The scope of this study is limited to the analysis of the overall economic benefits of the distribution network. After all trading has been concluded, the total revenue of the distribution network can be obtained as follows:
The total revenue of each participant in the blockchain is determined as follows:
where
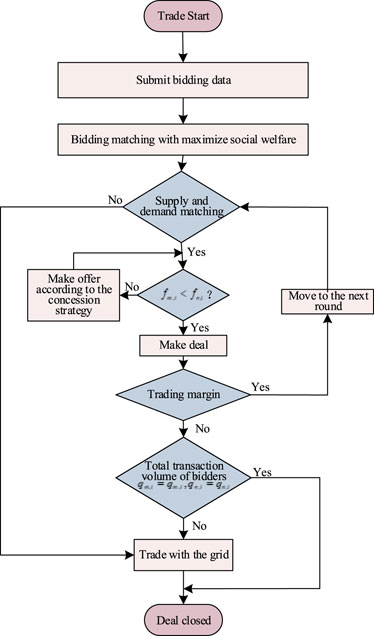
FIGURE 4. The chart of trade flow.
5 Analysis of example
5.1 Setting of example
To verify the effectiveness of the proposed trading mechanism, this study established four distribution networks for the purpose of conducting simulation analysis, each equipped with wind turbines, photovoltaic systems, and distributed energy storage devices. The wind and photovoltaic power output forecasts and original load curves for each distribution network in the day-ahead phase, as well as the actual power output and load curves in the intraday phase are provided. The operating parameters of the distributed energy storage devices (Zhao et al., 2022) and tariffs are shown in Supplementary Appendix SA.
This study employs the Yalmip toolbox within the MATLAB R2021b environment to simulate and resolve the given example.
5.2 Analysis of method for determining DAF-IDO energy storage action deviations
In the day-ahead operation phase, each distribution network operator optimizes the scheduling with the goal of minimizing energy consumption costs with their respective distribution network, and then obtains charging and discharging strategies for the energy storage plan during the day-ahead phase. In the intraday phase, due to the uncertainty of wind and photovoltaic power output and the deviations in load forecasting, the actual power output and load in the distribution network may differ from the day-ahead forecast. Based on this, the expected energy storage charging and discharging strategies after distribution network optimization during the intraday phase can be obtained. The energy storage charging and discharging strategies for the day-ahead and intraday phases are shown in Figure 5.
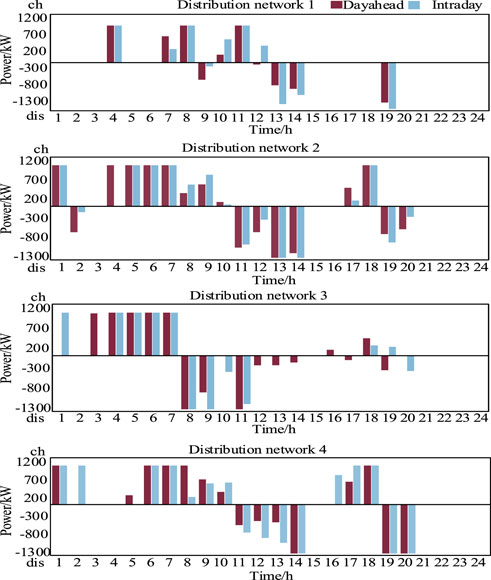
FIGURE 5. The chart of comparison of energy storage, charging and discharging in dayahead and intradays.
As can be seen from the chart depicting energy storage charging and discharging, there are notable deviations in the charging and discharging strategies of distribution network 1 at hours 7, 9, 10, 12, 13, 14, and 19; distribution network 2 at hours 2, 8, 9, and other time periods; distribution network 3 at hours 1, 9, 10, 11, and other time periods; distribution network 4 at hours 2, 5, 8, and other time periods. The energy storage charging and discharging strategies of each distribution network device exhibit notable deviations during the day-ahead and intraday phases, which satisfy the conditions for intraday incremental calculation. In addition, there are significant differences in the energy storage charging and discharging scenarios across the four distribution networks, making it possible to conduct a more in-depth analysis of the supply and demand of energy storage devices in each distribution network.
The deviation between the actual situation in the intraday phase and the day-ahead phase may result in adverse effects on the distribution network interests if the activities are based on the day-ahead plan. This study proposed to adjust the energy allocation among distribution networks taking into account the expected intraday value on the basis of the day-ahead plan. The energy storage supply and demand quantity proposed in this study is the difference between the day-ahead planned and intraday expected action. The specific supply and demand scenarios for each distribution network are shown in Figure 5.
It can be seen from Figure 6 that there is a significant demand in distribution network 3 at hour 1. At hour 2, distribution network 2, acting as the supplier, has surplus electricity, while distribution network 4, acting as the purchaser, has electricity demand. At hour 11, distribution network 2 and park 3 are both acting as suppliers of electricity, albeit in a relatively small amount, and distribution network 4 is the purchaser, which requires a relatively small amount of electricity. At hour 12, distribution networks 1 and 4 are purchasers, while distribution networks 2 and 3 are suppliers. Therefore, the quantity of supply and demand for each distribution network during a given time period are interdependent, which can be manifested in various scenarios, such as “one supply, multiple demands,” “one demand, multiple supplies,” and “multiple demands, multiple supplies”. This means that there could exist multiple purchasers and sellers in the same time period during the subsequent trading process.
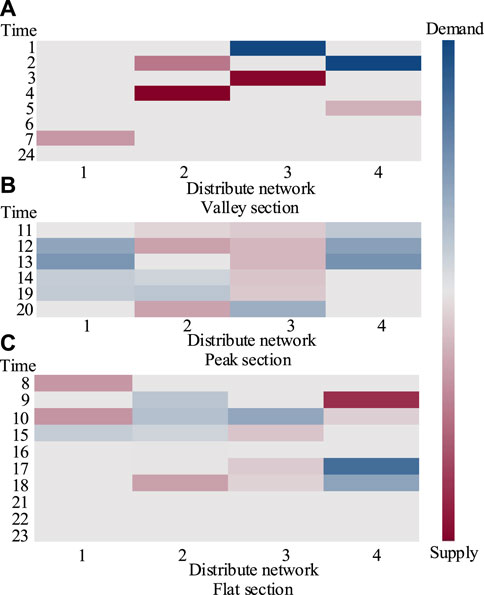
FIGURE 6. Supply and demand diagram of each distribution network. (A) Valley section. (B) Peak section. (C) Flat section.
In addition, the matching of supply and demand in each distribution network occurs more frequently during peak and valley periods, with supply and demand matching at hour 2 in the valley time period. In the subsequent trading process, the majority of trades will occur during peak and valley time periods. The analysis of the specific trading scenario will be conducted later.
5.3 Analysis of distributed energy storage trading mechanism
5.3.1 Analysis of bidding situation
After obtaining the supply and demand quantity, each distribution network operator offers an initial bidding price based on it. The bidding information of the purchaser’s and seller’s distribution network operators includes the supplied/demanded electricity quantity and the corresponding prices for different time periods.
The schematic diagram of the bidding scenario for the supply and demand quantity of each distribution network is shown in Figure 7. Considering the power deviation day-ahead and intraday, as well as the supply and demand of different distribution networks during the same period, Figure 7 is plotted. It can intuitively show the supply and demand relationship of each distribution network in different time periods, and whether the capacity support of power grid is required. The figure indicates that at hours 1, 3, 4, 5, 7, 15, and 18, there is only one distribution network that has supply or demand, and the supply and demand quantity between distribution networks cannot be matched during these time periods. After submitting the bidding information, the optimized matching results cannot be calculated by the smart contract of the blockchain. Therefore, the supply or demand quantity reported by each distribution network will be directly traded and cleared with the power grid, so no additional analysis will be conducted in this regard. Furthermore, the bidding electricity quantity of each distribution network is more frequently matched during peak and valley periods, with most trading occurring during these two time periods.
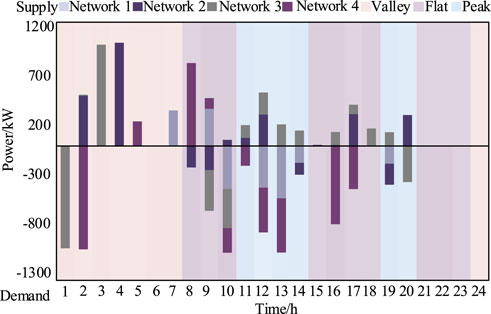
FIGURE 7. Supply and demand bidding diagram of each distribution network.
The schematic diagram of the bidding price scenario is shown in Figure 8. It can be seen from this figure that the balance of supply and demand within the distribution network takes precedence over the balance of supply and demand between the distribution networks, and the balance of supply and demand between the distribution networks takes precedence over the balance of supply and demand between the distribution networks and the power grid. The supplier’s initial bidding price is always lower than the main grid’s selling price, and the purchaser’s initial bidding price is always lower than the local grid’s selling price. Therefore, the trading mechanism proposed in this study is mutually beneficial for the purchaser and the seller, and can ensure the smooth advancement of the trading.
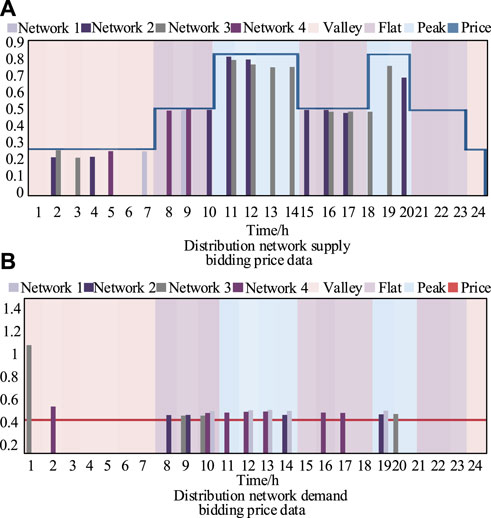
FIGURE 8. Schematic diagram of bidding price data of each distribution network operator. (A) Distribution network supply bidding price data. (B) Distribution network demand bidding price data.
5.3.2 Auction transactions
After obtaining the bidding information of each distribution network, the winning bidder for the trading of each time period is determined by solving the winner determination problem through smart contracts. In the example set in this study, there are 19 time periods that exhibit both supply and demand quantities within the 24 intraday time periods, and 12 time periods that participated in the trading of distributed energy storage trading between distribution networks. The trading scenarios are shown in Figure 9.
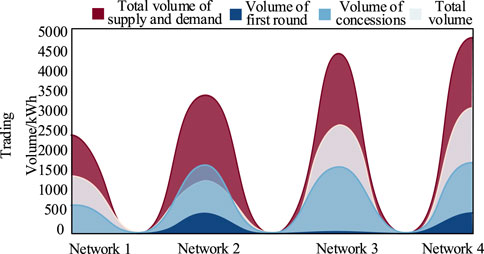
FIGURE 9. The chart of transaction in the auction stage.
It can be seen from Figure 9 that energy flows between distribution networks upon the introduction of the blockchain-based distributed energy storage trading mechanism proposed in this study. The total volume of the three rounds of trading accounts for 28%, 64%, 37%, and 46% of the total supply and demand of each distribution network, which effectively reduces the frequency and quantity of directly purchased and sold electricity between distribution networks, resulting in local consumption of wind and photovoltaic power and effectively reduces their impact on the main grid. At the same time, there is a reduction in the trading volume between the main grid and each distribution network, indirectly indicating that the trading volume between distribution networks increases under the proposed trading mechanism. In other words, the competitiveness of distributed energy storage resources participating in the electricity market trading improves. It improves the dispatching flexibility between the distribution network and the power grid, and among the market participants in the distribution network.
5.4 Analysis of pricing mechanism
The blockchain-based distributed energy storage trading mechanism proposed in this study established that the bidding price of the distribution network operator is always lower than the time-of-use (TOU) tariff of the main grid and the selling price of other distribution networks. However, due to the low tariff during the valley time period, the direct use of the original bidding price for trading will not be conducive to stimulating the sales of electricity from power sources within the distribution network during the valley time period, which will affect the overall electricity balance and scheduling results of the distribution network. To incentivize each distribution network to participate in market-oriented trading during the valley time period, this study introduced an valley compensation mechanism that compensates both trading parties based on the trading volume during the valley time period according to the blockchain smart contract. To verify the rationality of this mechanism, this study has established three scenarios for comparative analysis.
Scenario 1: Each distribution network participates in the distributed energy storage trading mechanism (incorporating the valley compensation mechanism); Scenario 2: Each distribution network participates in the distributed energy storage trading mechanism (without incorporating the valley period compensation mechanism); Scenario 3: Each distribution network does not participate in distributed energy storage trading during the valley time period and directly trades with the main grid.
Based on the data presented in Table 1, it can be observed that at time period 2, distribution networks 2 and 3, acting as sellers, have submitted bidding prices that are lower than the selling price of the main grid, which is RMB 270 per MWh. On the other hand, distribution network 4, acting as the purchaser, has submitted a bidding price that is higher than the selling price of the local power source; as a result, the transaction can proceed. In the first round of trading, distribution networks 2 and 4 traded first, and the trading price they concluded was the average of their bidding prices, that is, RMB 334.80 per MWh. In the second round of trading, distribution network 3 traded with distribution grid 4 at the price of RMB 369 per MWh. The prices of the two rounds of trading are higher than the selling price of the main grid but lower than the selling price of the local power source. Electricity purchasers are more likely to obtain their supply from the distribution network, while electricity sellers are more likely to sell their supply to the distribution network. This will lower the enthusiasm of each park to participate in the distributed energy storage cloud service trading during the valley time period.

TABLE 1. The bid situation of the second session.
Upon the incorporation of the compensation mechanism in Scenario 1, a compensation of RMB 100 per MWh is provided to both the purchaser and the seller during the valley time period according to the smart contract algorithm. The profit of each distribution network in time period 2 across the three scenarios is shown in Table 2.
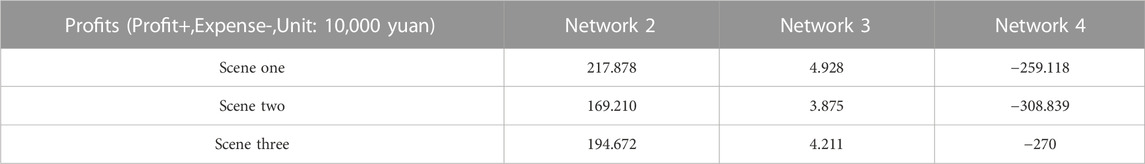
TABLE 2. Distribution network profit under different scenarios.
By comparing Scenarios 2 and 3, it is evident that distribution network 2 participated in trading without incorporating the compensation mechanism, and the profit in time period 2 was RMB 1.6921 million, which is lower than the profit of RMB 1.94672 million obtained through direct trading with the main grid. In time period 2, distribution network 3 offered a small electricity quantity for bidding, which resulted in unobvious profits, but the quantity offered was still lower than that directly traded with the main grid. When distribution grid 4 participated in trading without incorporating the compensation mechanism, it needed to pay RMB 3.08839 million in time period 2, which is higher than the cost of directly purchasing electricity from the main grid, which amounted to RMB 2.7 million. It can be concluded that in the absence of an valley compensation mechanism, the cost of purchasing electricity from the main grid will be lower for each distribution grid during the valley time period, but it may not be the lowest total cost.
By comparing Scenarios 1 and 3, it is evident that after participating in the trading with the incorporation of the valley compensation mechanism, distribution network 2 earned RMB 2.17878 million in time period 2, which is higher than the profit of RMB 1.94672 million obtained by directly trading with the main grid. The same is true for distribution network 3. Whereas distribution network 4 needs to pay RMB 2.59118 million in time period 2 in trading with the valley compensation mechanism incorporated, which is more favorable compared to the direct purchase of electricity from the main grid, which costs RMB 2.7 million. Therefore, the pricing mechanism proposed in this study suggests that the incorporation of an valley compensation mechanism is more financially advantageous for users who participate in the service compared to direct trading with the main grid, thereby effectively increasing users’ inclination to participate in the service during the valley time period.
Data in Table 3 indicate that the incorporation of the distributed energy storage trading mechanism resulted in a reduction of electricity purchases from the main grid by several distribution networks during time period 2. Specifically, distribution network 2 reduced its purchase of electricity by 4,866.80 MWh; distribution grid 3 reduced its purchase of electricity by 105.26 MWh, and distribution grid 4 reduced its purchase of electricity by 4,972.06 MWh. This effectively reduces the quantity of electricity traded between the distribution network and the main grid, thereby reducing the impact of the uncertainty of wind and photovoltaic power on the main grid and improving power system flexibility. It should be noted that the system scheduling under consideration prioritizes the maximization of power output stability and economic efficiency of trading, without taking into account the potential impact on system safety in the event of power supply shortages. In addition, the different division of electricity price periods will affect the electricity consumption habits of market participants in the distribution network, so the transaction price characteristics will also change.
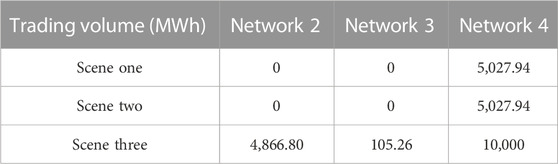
TABLE 3. Transaction volume of each distribution network and power network under different scenarios.
5.5 Analysis of social welfare
The blockchain service fee established in this study is RMB 100 per MWh, and the resulting social welfare outcomes under the proposed trading mechanism are presented in Table 4. It can be seen that after incorporating the distributed energy storage cloud service trading mechanism, distribution network 3 has the highest revenue increase, amounting to RMB 2.68757 million, while distribution network 1 has the lowest revenue increase, amounting to RMB 0.77484 million. However, it should be noted that the revenue of each distribution network has increased compared to before incorporating the mechanism.
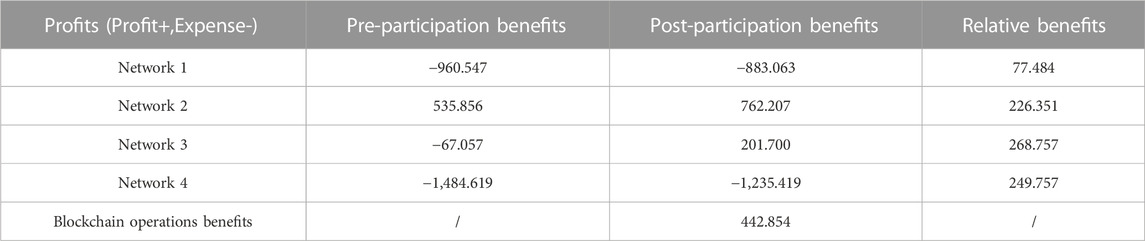
TABLE 4. Before and after participating in the trading mechanism profit comparison.
According to Table 4, the incorporation of a distributed energy storage cloud service trading mechanism, which takes into account the DAF-IDO energy storage action deviation in the proposed multiple distribution networks, has resulted in an improvement in the economic benefits of each distribution network, which has subsequently increased their inclination to participate in the distributed energy storage market trading. At the same time, this mechanism can ensure that all other parties generate considerable profits. Profits will positively encourage all market members to participate in market transactions. The degree of positive motivation needs to be further studied.
6 Conclusion and prospects
This study proposed a method for determining DAF-IDO energy storage action deviations, and on this basis, introduced a trading mechanism for blockchain-based distributed energy storage of multiple distribution networks and improved the trading pricing mechanism. Through theoretical and simulation analysis, it can be inferred that.
(1) The trading mechanism for distributed energy storage of multiple distribution networks proposed in this study taking into account the DAF-IDO energy storage action deviations under multiple distribution networks ensures that the energy demand of market participants is met. In addition, this mechanism facilitates the circulation of dispersed distributed energy storage among users, thereby effectively improving the utilization rate of distributed energy storage devices, enhancing economic efficiency, and promoting local consumption of energy.
(2) The method for determining DAF-IDO energy storage action deviations proposed in this study can effectively quantify the supply and demand quantity of energy storage devices participating in the market trading, providing a new perspective for energy storage to participate in market trading and improving its market power.
(3) The incorporation of an valley compensation mechanism within the energy storage price mechanism has resulted in an improved economic efficiency of distribution networks, thereby effectively ensuring distribution networks’ inclination to participate in trading during valley time periods.
This study introduced a new market strategy and outlook for distributed energy storage devices to participate in market trading, thereby enhancing the overall flexibility of the power system. The method for determining DAF-IDO energy storage action deviations proposed in this study is not limited to distributed energy storage and can be extended to centralized energy storage. In the future, research should delve deeper into the impact of grid power flow constraints on the proposed trading mechanism in this study, and explore the allocation of benefits between distribution network operators and internal users.
Data availability statement
The original contributions presented in the study are included in the article/Supplementary Material, further inquiries can be directed to the corresponding author.
Author contributions
DC contributions: conceive, simulation and write manuscripts, JH, XC, and ZL, contributions: guide thesis ideas. All authors contributed to the article and approved the submitted version.
Acknowledgments
Thanks for the technical support provided by the State Grid Beijing Electric Power Company.
Conflict of interest
Authors DC and XC were employed by Capital Power Exchange Center Co., Ltd.
The remaining authors declare that the research was conducted in the absence of any commercial or financial relationships that could be construed as a potential conflict of interest.
Publisher’s note
All claims expressed in this article are solely those of the authors and do not necessarily represent those of their affiliated organizations, or those of the publisher, the editors and the reviewers. Any product that may be evaluated in this article, or claim that may be made by its manufacturer, is not guaranteed or endorsed by the publisher.
Supplementary material
The Supplementary Material for this article can be found online at: https://www.frontiersin.org/articles/10.3389/fenrg.2023.1240611/full#supplementary-material
References
Chen, Cen, Wu, Chuantao, Kang, Kai, Lin, Xiangning, Ma, Yuncong, Quan, Sui, et al. (2023b). Optimal strategy of distributed energy storage two-layer cooperative game based on improved owen-value method. Proc. CSEE, 1–14. doi:10.13334/j.0258-8013.pcsee.211275
Chen, Xi, Fu, Wenlong, and Zhang, Hairong (2023a). Optimal dispatching strategy of shared energy storage and multi-microgrid considering the uncertainty of new energy generation. Power Syst. Technol., 1–17. doi:10.13335/j.1000-3673.pst.2022.2541
Cui, Dongjun, He, Jinghan, Zhang, Guofang, and Hou, Zihan (2022). Blockchain-based distributed power market trading mechanism. Comput. Mater. Continua 72 (2), 2845–2858. doi:10.32604/cmc.2022.026568
Dai, R., Esmaeilbeigi, R., and Charkhgard, H. (2021). The utilization of shared energy storage in energy systems: A comprehensive review. IEEE Trans. Smart Grid 12 (4), 3163–3174. doi:10.1109/tsg.2021.3061619
Dai, Sai, Li, Yuxuan, and Sun, Zhixiang (2022). Online sharing optimization matching transaction mode for distributed energy storage. High. Volt. Eng. 48 (07), 2515–2522. doi:10.13336/j.1003-6520.hve.20220097
Hu, Yu, Li, Huaqiang, and Li, Shanshan (2022). Peer-to-peer power trading method for proconsumers based on blockchain. Electr. Power Autom. Equip. 42 (01), 101–108. doi:10.16081/j.epae.202112005
Huang, Weidong, Yang, Li, and Li, Jingyan (2023). Multi-time scale joint optimal scheduling for wind-photovoltaic-electrochemical energy storage-pumped storage considering renewable energy uncertainty. Electr. Power Autom. Equip., 1–19. doi:10.16081/j.epae.202210002
Kang, Chongqing, Liu, Jingkun, and Zhang, Ning (2017). A new form of energy storage in future power system: cloud energy storage. Automation Electr. Power Syst. 41 (21), 2–8. doi:10.7500/AEPS20170601011
Li, Jianlin, Cui, Yilin, and Ma, Suliang (2022a). Operation mode optimization and economic benefit analysis of demand-side shared energy storage. Power Syst. Technol. 46 (12), 4954–4969. doi:10.13335/j.1000-3673.pst.2022.1218
Li, Shanshan, Li, Huaqiang, and Jin, Zhibo (2022b). Distributed energy sharing service mechanism for park based on the concept of sharing economy. Proc. CSEE 42 (01), 56–71. doi:10.13334/j.0258-8013.pcsee.202046
Li, Xuan, Li, Huaqiang, and Li, Xuxiang (2021). Peer-to-peer trade and control for distributed energy storage based on blockchain technology. Power Syst. Technol. 45 (09), 3424–3432. doi:10.13335/j.1000-3673.pst.2020.1726
Liu, Jingkun, Zhang, Ning, and Kang, Chongqing (2017). Research framework and basic models for cloud energy storage in power system. Proc. CSEE 37 (12), 3361–3371+3663. doi:10.13334/j.0258-8013.pcsee.170208
Liu, J., Zhang, N., Kang, C., Kirschen, D. S., and Xia, Q. (2018). Decision-making models for the participants in cloud energy storage. IEEE Trans. Smart Grid 9 (6), 5512–5521. doi:10.1109/tsg.2017.2689239
Ma, Yuncong, Wu, Chuantao, Lin, Xiangning, Chen, Cen, Li, Zhengtian, Fanrong, Wei, et al. (2022). Research on peer-to-peer transaction strategy of cloud energy storage based on semi-distributed structured topology. Proc. CSEE 42 (21), 7731–7746. doi:10.13334/j.0258-8013.pcsee.211263
Meng, Song, Lin, Gujing, and Meng, Jing (2023). Key technologies and applications of shared energy storage. J. Shanghai Jiaot. Univ., 1–28. doi:10.16183/j.cnki.jsjtu.2022.360
Nan, Bin, Jiang, Chundi, and Dong, Shufeng (2023). Day-ahead and intra-day coordinated optimal scheduling of integrated energy system considering uncertainties in source and load. Power Syst. Technol., 1–15. doi:10.13335/j.1000-3673.pst.2022.2080
Saini, V. K., Seervi, A., Kumar, R., Mahmud, M. A., and Al-Sumaiti, A. S. (2022). Cloud energy storage based embedded battery technology architecture for residential users cost minimization. IEEE Access 10, 43685–43702. doi:10.1109/access.2022.3168599
Tushar, W., Chai, B., Yuen, C., Huang, S., Smith, D. B., Poor, H. V., et al. (2016). Energy storage sharing in smart grid: A modified auction-based approach. IEEE Trans. Smart Grid 7 (3), 1462–1475. doi:10.1109/tsg.2015.2512267
Wang, Miaomiao, Li, Huaqiang, and He, Yongxiang (2022). Cloud energy storage service mechanism considering multi-agent power transaction. Electr. Power Costr. 43 (11), 73–84. doi:10.12204/j.issn.1000-7229.2022.11.008
Wu, S., Li, H., Liu, Y., Lu, Y., and Wang, Z. (2023). A two-stage rolling optimization strategy for park-level integrated energy system considering multi-energy flexibility. Int. J. Electr. Power & Energy Syst. 145, 108600. doi:10.1016/j.ijepes.2022.108600
Xiang, You, Li, Huaqiang, and Lu, Yang (2022). Pricing strategy for multi-microgrid centralized trading considering distribution network power flow. Power Syst. Technol. 46 (04), 1297–1309. doi:10.13335/j.1000-3673.pst.2021.0492
Xue, Hui (2015). The reserch on the pricing of cloud computing resources based on combinatorial double auction. Beijing, China: Beijing University of Posts and Telecommunications.
Yan, Dongxiang, and Chen, Yue (2022). Review on business model and pricing mechanism for shared energy storage. Automation Electr. Power Syst. 46 (23), 178–191. doi:10.7500/AEPS20220219003
Zhang, Mingxia, Yan, Tao, Lai, Xiaokang, Chen, Jizhong, Niu, Meng, and Xu, Shaohua (2018). Technology vision and route of energy storage under new power grid function configuration. Power Syst. Technol. 42 (05), 1370–1377. doi:10.13335/j.1000-3673.pst.2017.2475
Zhang, Wei, and Hui, Miao (2021). Bidding strategies of wind power and energy storage participating in energy and frequency regulation market based on cloud energy storage leasing services. Power Syst. Technol. 45 (10), 3840–3852. doi:10.13335/j.1000-3673.pst.2020.1955
Zhao, Pengjie, Wu, Junyong, and Zhang, Wenhao (2022). Cooperative peer to peer scheduling of multi-microgrids considering distribution network power flow and source-load uncertainty. Power Syst. Technol. 46 (12), 4885–4896. doi:10.13335/j.1000-3673.pst.2022.0789
Keywords: multiple types of market participants, blockchain, alliance chain, power system flexibility, energy storage action deviation, market trading mechanism
Citation: Cui D, He J, Cheng X and Liu Z (2023) Distributed energy storage participating in power trading mechanism for power system flexibility. Front. Energy Res. 11:1240611. doi: 10.3389/fenrg.2023.1240611
Received: 15 June 2023; Accepted: 01 September 2023;
Published: 12 September 2023.
Edited by:
Mingfei Ban, Northeast Forestry University, ChinaReviewed by:
Zhenhuan Ding, Anhui University, ChinaZicheng Liu, Huazhong University of Science and Technology, China
Jian Wei, Northeast Forestry University, China
Copyright © 2023 Cui, He, Cheng and Liu. This is an open-access article distributed under the terms of the Creative Commons Attribution License (CC BY). The use, distribution or reproduction in other forums is permitted, provided the original author(s) and the copyright owner(s) are credited and that the original publication in this journal is cited, in accordance with accepted academic practice. No use, distribution or reproduction is permitted which does not comply with these terms.
*Correspondence: Dongjun Cui, Y2RqMTEyMkAxMjYuY29t