 Liao Zhigao
 Ruan Mengying
- 1College of Management and Economics, Guangxi University of Science and Technology, Liuzhou, China
- 2Guangxi Industrial High-quality Development Research Center (Guangxi University of Science and Technology), Liuzhou, China
A Commentary on
Research on the spatial correlation network structure and influencing factors of carbon emissions in Chengdu-Chongqing urban agglomeration
by Wang Y-l (2021). Front. Energy Res. 9:701551. doi: 10.3389/fenrg.2021.701551
1 Introduction
Faced with the severe issue of global climate change, which concerns all humanity around the world, the Chinese government has proposed the “3060” dual carbon target and carried out emission reduction and carbon reduction actions based on it. According to existing studies, many scholars consider the environmental pressures in different regions and conduct targeted research and analysis on the influencing factors of carbon emissions, but most of them are national or prominent provincial and municipal analysis. However, China has a vast territory and various regions rely on different environmental conditions to develop their own advantageous industries. Therefore, there are significant differences in development characteristics and environmental pressures. When formulating low-carbon development goals, it is not possible to generalize, and it is necessary to fully consider the coordinated development of society and ecological environment, in order to achieve China’s carbon emission reduction goals.
Cities are currently the main source of carbon emissions in China, accounting for over 80% of total emissions (Shan et al., 2017). Therefore, the key to achieving carbon reduction goals and addressing climate change lies in starting from cities. Most of the scholars’ research on the influencing factors of urban carbon emissions is limited to certain attribute factors of the city itself, and ignores the impact of inter-city relations on carbon emissions. There are socio-economic links between cities, such as population flow, technology diffusion, industrial transfer, and trade exchanges, and in the process of inter-city exchanges, urban carbon emissions will change with the changes of economic and trade relations between cities, thus forming a relationship between cities in carbon emissions. The national 5-year planning outline has proposed a sustainable urbanization spatial pattern centered on the development of urban agglomerations for four consecutive years. Currently, there are 19 key urban agglomerations, with GDP accounting for over 75% of the country and showing a sustained growth trend. Urban agglomerations are not only the main driving force for China’s socio-economic development, but also gradually become an important hub for achieving high-quality development in the new stage of development. For the government, only by understanding the spatial distribution of carbon emissions within urban agglomerations and clarifying the spatial correlation between urban individuals and their spatial structure can practical carbon emission reduction measures be formulated to achieve coordinated emission reduction in the region. Studying the spatial correlation structure of carbon emissions from the perspective of urban agglomerations has enormous value.
At present, studies on the spatial association of carbon emissions between regions can be divided into two categories, one is to use spatial measurement (Tan et al., 2016; Marbuah and Amuakwa-Mensah, 2017; Han et al., 2018) method, such as using SDM model (Min and Tao, 2022), SBM model (Liu et al., 2021; Niu et al., 2022) The spatial dependence of carbon emissions (Xianzhao et al., 2019) and spatial spillover (Shengdong et al., 2022; Xiaoyu et al., 2022) or through spatial autocorrelation models (Zhang and Lei, 2023) spatial autocorrelation model, etc., To characterize the spatial and temporal evolution of carbon emissions (Ahui et al., 2022; Chen et al., 2023). Another approach is to use social network analysis (Tengfei et al., 2022) The other is to use social network analysis to study the structure of carbon emission linkage network, mostly based on national (Ma et al., 2021) and provincial (YANG et al., 2016) energy, industry (Shao and Wang, 2021). The spatial linkages between energy, industry and industry have been analyzed. The studies all agree that carbon emissions are not independent between regions, but are spatially related to each other, and there are multiple and complex spatial relationships, so the spatial linkages of carbon emissions can be investigated for specific city networks. With the help of SNA method and QAP regression method to analyze the spatial association of carbon emissions, the network characteristics can be reflected more comprehensively and intuitively. Caiquan et al. (2019) combined the SNA and QAP methods to investigate the network structure evolution process of Chengdu-Chongqing and Pearl River Delta urban agglomerations, respectively, while Ai et al. (2021) compared the three major urban agglomerations of Beijing-Tianjin-Hebei, Yangtze River Delta and Pearl River Delta to analyze their structural characteristics and the reasons for their different influencing factors. The development of urban agglomerations is not only the development of central cities, but also the development of small and medium-sized cities and towns. The development of cities is faced with the serious challenge of economic growth demand and pollution reduction and carbon reduction pressure.
This study complements the city-level carbon emission accounting method, conducts research on city-level carbon emission accounting, raises the attention of cities, and reasonably plans emission reduction. In the past, most of the research on carbon emission issues started from the macro level of the whole country and divided them into three major regions according to the geographical location of provinces and cities, namely, eastern, central and western regions, and the current research on the application of social network analysis to the spatial correlation of carbon emissions in urban agglomerations is still very limited. From the perspective of urban agglomeration, this study selects the Chengdu-Chongqing urban agglomeration as the research object, pays attention to the emission reduction of cities as the main body of carbon emissions, and analyzes the spatial correlation relationship of carbon emissions and the influencing factors of carbon emission spatial correlation of carbon emissions in Chengdu-Chongqing urban agglomeration with SNA and QAP. Help China formulate emission reduction policies in line with regional characteristics in the implementation of regional coordinated development strategies, avoid low-level carbon reduction, and provide theoretical support for the development of low-carbon cities in the future.
2 Research methods and data sources
2.1 Overview of the study area
Compared with the Beijing-Tianjin-Hebei and Pearl River Delta city clusters which have already matured, the Chengdu-Chongqing city cluster, as a rapidly developing city cluster, continues to improve its comprehensive strength and is highly valued by the state. The Chengdu-Chongqing urban agglomeration has absolute advantages in population, industry, technology and market in the western region of China, and its innovation ability, openness and economic development are superior to those of other regions in the west, and the Chengdu-Chongqing urban agglomeration has become a new economic growth pole in China with its strong strength and abundant vitality. The Chengdu-Chongqing urban agglomeration is in the development period, and taking it as a research area has important theoretical and practical significance for the high-quality development and coordinated development of the western region. The Chengdu-Chongqing urban agglomeration, centered on Chengdu and Chongqing, plays a leading role in the western region and contains 16 cities, including Zigong, Luzhou, Deyang and Mianyang, with a total area of 185,000 square kilometers, a resident population of 102.77 million in 2020, and a regional GDP of nearly 6.8 trillion yuan, accounting for 7.3% and 6.7% of the country’s population and GDP, respectively.
According to the carbon emission estimation results of Chengdu-Chongqing urban agglomeration in 2020, the skewness of total carbon emission and carbon emission intensity reach 2.419 and 1.420 respectively, both of which are greater than 1, showing a highly right-skewed skewed distribution; the kurtosis reaches 4.629 and 3.235 respectively, both of which are greater than 3, which is considered to be a spike and thick-tailed distribution, with an extremely large number of low-carbon emission cities and a great gap of carbon emission between cities.
As can be seen from Figure 1, in terms of total carbon emissions, Chengdu and Chongqing in particular stand out, and carbon emissions in the urban agglomeration generally show a cluster-like distribution pattern toward large and medium-sized cities; in terms of carbon emission intensity, the carbon emission intensity of Chongqing and its surrounding cities is lower than that of other western cities, and the urban agglomeration as a whole shows a low trend in the east and a high trend in the west. Thus, it can be concluded that there are obvious spatial correlations and clustering of carbon emissions in the Chengdu-Chongqing urban agglomeration, and there is great room for optimization and adjustment.
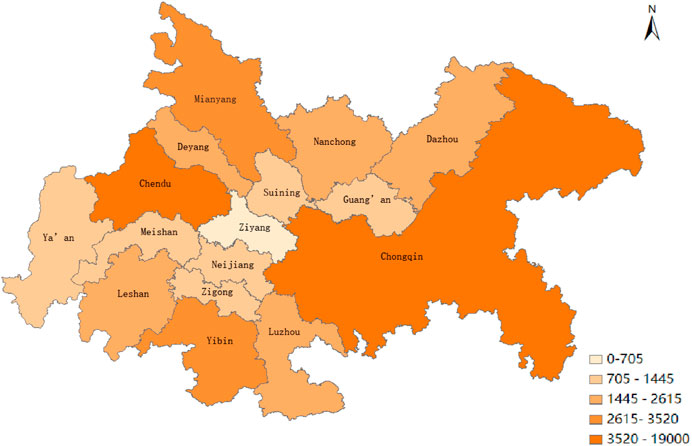
FIGURE 1. Distribution of carbon emission characteristics of Chengdu-Chongqing urban agglomeration in 2020 (Tons of tons).
2.2 Research methodology
2.2.1 Determination of spatial association network of carbon emissions in urban agglomerations
In the analysis of social networks, it is important to confirm the relationships. Currently, two methods, vector autoregressive model and gravity model, are mostly used to describe the spatial correlation. However, it is difficult to accurately grasp the lag order when using vector autoregression, which will lead to the network structure characteristics cannot be expressed exactly and cannot reflect the spatial correlation network evolution form, so this paper adopts the gravitational model to describe the correlation relationship between cities, and the specific formula is as follows:
In Formula (1),
Ehrlich believes that the factors affecting environmental carrying capacity are mainly population, economy and technology, and proposes the IPAT model: I=P×A ×T, where: I represents environmental load; P represents population size; A represents affluence; and T represents technology level. By incorporating these indicators into the comprehensive consideration of urban carbon emission quality, the traditional gravitational force model is improved as follows (Song et al., 2018):
In Formula (2),
The above equation is calculated to obtain the carbon emission correlation matrix, which is converted into a binary matrix I. The average value of the gravitational force between cities is calculated as the critical value, and the gravitational force above the critical value is recorded as 1, when the carbon emissions of two cities are linked; the gravitational force below the critical value is recorded as 0, when the carbon emissions of two cities are not linked.
2.2.2 Network characteristics index measurements
(1) Overall network characteristic index measurement
The network density reflects the number of members who have interrelationship, and the larger the value indicates the closer the relationship of carbon emission between cities, the more it can influence the association. The expression of network density is:
In Formula (3), D is the network density; M is the number of association relationships that actually exist; N is the number of nodes, and N (M − 1) denotes the maximum number of association relationships that can be reached.
Network relatedness reflects the degree to which the nodes contact each other. The more associations exist between cities, the greater the degree of correlation, the higher the correlation between cities in carbon emissions, indicating that the carbon emission correlation network is more stable The expression of network relatedness is:
In Formula (3), C is the network relevance; V is the number of unreachable point pairs. The network rank degree describes the degree of asymmetric accessibility between cities, the more one-way connections the higher the rank degree, and the greater the gap between the central city and the edge city. The expression of network rank degree is:
In Formula (5), H is the network rank degree; K is the number of pairs of symmetric reachable points; max(K) is the logarithm of the maximum number of possible reachable points.
Network efficiency portrays the efficiency of inter-city connections. The more inter-city connections, the stronger the link between cities in terms of carbon emissions, the lower the network efficiency and the more stable the network. The expression of network efficiency is:
In Formula (6), E is the network efficiency; L is the number of redundant lines; max(L) is the maximum possible number of redundant lines.
(2) Individual Network Characteristics Index Measure
The point degree centrality measures the extent to which a city is at the center, and a larger value indicates that the city is more connected to other cities, more central and has more power. The degree of carbon emission association distinguishes the direction, and the degree centrality is divided into point-out degree and point-in degree. The point-out degree reflects the degree of carbon emission spillover of a city, specifically the number of associations sent out by the city actively; the point-in degree reflects the degree of carbon emission benefit of a city, specifically the number of associations received by the city. The expression of point degree centrality is as follows:
In Formula (7), DC is the point degree of centrality; Ind is the point-in degree; and Out is the point-out degree.
The higher the value, the stronger the “intermediary” role played by the city in the network and the greater the ability to control the relationship. The expression of intermediation centrality is
In Formula (8), BC is the intermediary centrality;
Proximity to the center reflects the extent to which a city is uncontrolled. A higher value indicates that the faster the city establishes connections with other cities in the network, the less vulnerable it is to the influence of other cities. The expression of proximity centrality is
In Formula (9), CC is the degree of proximity to the center;
2.2.3 QAP analysis
QAP is a non-parametric test to determine the relationship between relationship matrices. Many scholars have searched for the driving factors of the formation of spatial correlations of carbon emissions from the national, provincial and municipal perspectives (Song et al., 2018; Wang et al., 2018) The study found that the influence of geographic space, economic development, energy intensity, industrial structure, technology level, environmental protection level and urbanization rate is stronger. According to previous studies, these factors are assumed to influence the spatial association of carbon emissions in urban agglomerations, and the following model is established:
Net in the model denotes the carbon emission network relationship of urban agglomerations, and the explanation of each variable is shown in Table 1.
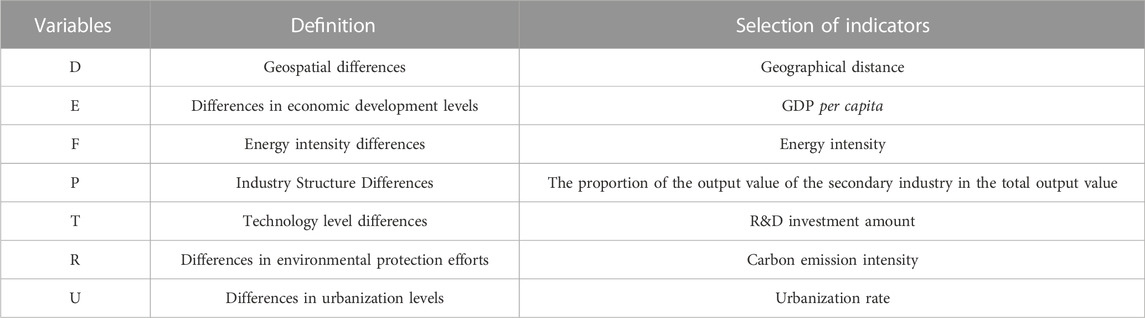
TABLE 1. Definition of each variable and selection of indicators.
In which all indicator data are matrices, the data from 2016 to 2020 are selected as samples, and the average values of different indicators for each city in the sample period are calculated, which are used as benchmark values and the absolute differences between cities are used to construct a difference matrix for QAP correlation and regression analysis.
2.3 Data sources
The decade of 2011–2020 was chosen as the sample period, and the data of each indicator were obtained from the China Statistical Yearbook, Chongqing Statistical Yearbook, Sichuan Statistical Yearbook, and China City Statistical Yearbook, and the spatial distance between cities was obtained from the distance between the geographic centers of gravity of each city measured in ArcGIS. There is no strict and uniform accounting method for urban carbon emissions due to the existence of different boundary divisions and accounting methods. Meanwhile, many cities do not have city-level energy balance sheets, and basic data are difficult to obtain, making it difficult to directly calculate carbon emissions in cities other than Chongqing. This paper combines Zhang and Lei (2023) and Qiaonan et al. (2018); Li et al. (2019) and according to the provincial energy balance sheet, the carbon emissions are estimated by using the carbon dioxide emission coefficient of standard coal provided by BP China Carbon Emission Calculator according to the percentage of each type of urban energy consumption in the provincial level, and the specific formula is as follows.
In Formula (9),
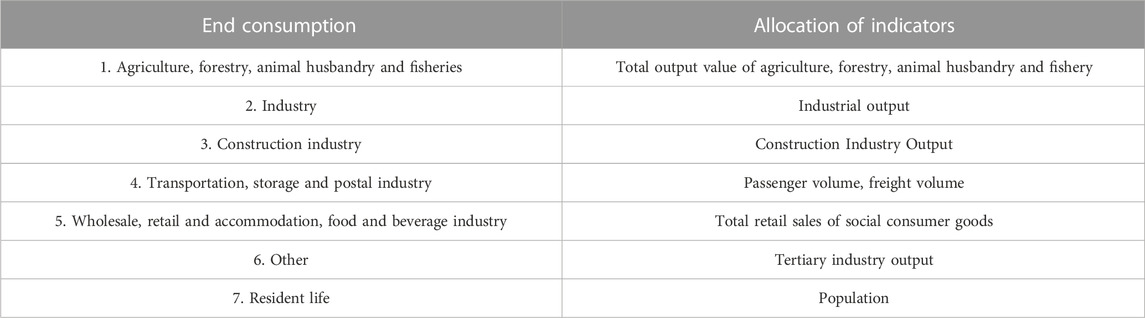
TABLE 2. Energy consumption categories and allocation indicators.
3 Structural characteristics of the spatially linked network of carbon emissions in the Chengdu-Chongqing urban agglomeration
3.1 Overall network structure characteristics and evolutionary trends
Firstly, the carbon emission gravitational matrix of Chengdu-Chongqing urban agglomeration is calculated according to the improved gravitational model, from which the spatial correlation matrix of carbon emission of cities in Chengdu-Chongqing urban agglomeration is constructed. In order to show the spatial relationship of carbon emission of Chengdu-Chongqing urban agglomeration more intuitively, the spatial correlation network in 2020 is drawn using Netdraw in UCINET 6.0 as shown in Figure 2.
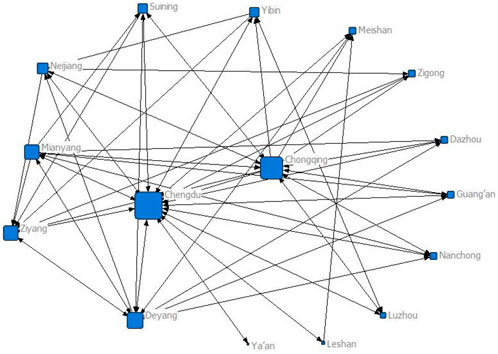
FIGURE 2. Spatial correlation network of carbon emissions in Chengdu-Chongqing city cluster in 2020.
The larger the point representing a city in the figure, the more it is connected with other cities, and the more it is at the center of the network. It can be found that Chengdu and Chongqing have the closest connections with other cities; Deyang and Mianyang, which are close to Chengdu, and Ziyang, which borders both Chengdu and Chongqing, also have more connections with other cities in the network and have a higher position in the network; while Ya’an has fewer connections with other cities because it is located in the far west. Overall, it seems that each city has at least one linkage with other cities, and the city cluster is full of carbon emission linkages within the city cluster, showing a complex network structure pattern. In order to further explore the evolution of the carbon emission correlation network of Chengdu-Chongqing city cluster from 2011 to 2020, the network density, network correlation degree, network rank degree and network efficiency are calculated for each year, and the specific results are shown in Figures 3, 4.
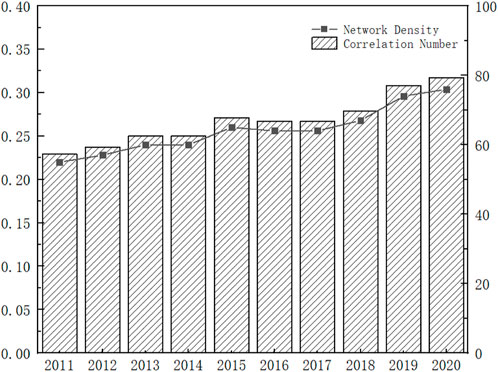
FIGURE 3. Carbon emission network density and correlation number of Chengdu-Chongqing urban agglomeration, 2011–2020.
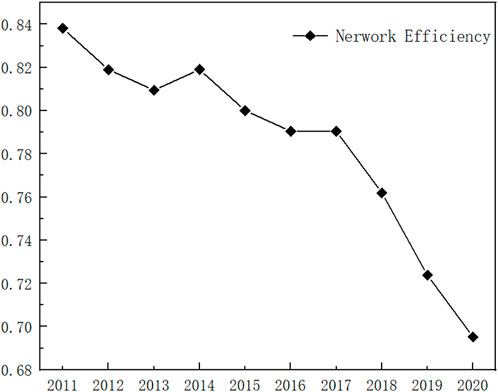
FIGURE 4. Carbon emission network efficiency of Chengdu-Chongqing urban agglomeration, 2011–2020.
As can be seen from Figure 3, the network density and the number of correlations change in the same direction, with a “rise - fall - rise” fluctuation. The average value of carbon emission association number is only 64.2, which is much smaller than the maximum possible association number of 240 (16 × 15), indicating that the overall carbon emission spatial association of Chengdu-Chongqing urban agglomeration is still at a low level. The spatial association of carbon emissions in the Chengdu-Chongqing urban agglomeration is still at a low level. However, during the sample period, except for the period from 2015 to 2017, when the spatial association decreased, the degree of carbon emission spatial association gradually increased in the rest of the period, especially after 2017, and the carbon emission relationship between cities became closer and closer, and the carbon emission spatial association network has more room for improvement.
On the other hand, the correlation of the network remains constant at 1 during the sample period, the spatial correlation and spillover of carbon emissions from urban agglomerations are prevalent, the network cohesion is large, and the carbon emission network structure is stable. Moreover, the network rank is always 0 during this decade, which indicates that the hierarchical structure within the urban agglomerations is very strict, and Chengdu and Chongqing are always at the center of the network without changing their status.
As can be seen from Figure 4, the network efficiency shows a trend of “decline - rise - decline”, with a maximum value of 0.838 in 2011, then declining to 0.809 in 2013, rising to 0.819 in 2014 and then declining again, and reaching a minimum value of 0.695 in 2020. The average value of network efficiency during the sample period is 0.785, which seems to be high overall, with more redundant connections in the network, but also shows that the existing connections can ensure the stability of the network.
The trend of the evolution of the overall characteristics of the spatially linked network of carbon emissions in the Chengdu-Chongqing urban agglomeration indicates that since 2017, the degree of spatial linkage of carbon emissions has become higher and higher, the closeness of the network has become stronger, the efficiency of the network has become lower, and the network relationship has become more stable. The reason may be that the 19th Party Congress in 2017 put forward the implementation of a coordinated regional development strategy, attaching importance to the conservation of resources and protection of the environment, as well as providing guidance on industrial adjustment as well as production and living. Direct energy integration has been carried out among a large number of cities, the energy internet system has been vigorously promoted, horizontal linkages have been enhanced, and relevant policies have been implemented, carbon reduction performance has entered the full implementation stage, and emission reduction actions in the Chengdu-Chongqing urban agglomeration have become more closely collaborative, and the spatial association of carbon emissions as well as the closeness of the network has been enhanced accordingly.
Comparing with the existing studies, it is found that the tightness and efficiency of carbon emission networks in Beijing-Tianjin-Hebei urban agglomeration have not changed much in recent years [25] The network density of the Pearl River Delta urban agglomeration is on the rise, and the network efficiency is on the decline. There are still many carbon emission spatial links that can be established, especially between small and medium-sized cities, to promote the optimization of carbon emission spatial linkage networks. As for the network ranking (Ai et al., 2021) The rank degree of Beijing-Tianjin-Hebei urban agglomeration fluctuates a lot, but generally decreases, gradually breaking the strict status relationship and gradually increasing the interconnection of carbon emissions among cities; the rank degree of Pearl River Delta urban agglomeration has a higher value and remains stable for a long time, indicating that some cities are in a dominant position among Pearl River Delta cities in terms of carbon emissions. The Beijing-Tianjin-Hebei city cluster and the Pearl River Delta city cluster have developed more maturely, and the cities within the city cluster are more closely connected, compared with the Chengdu-Chongqing city cluster, which has a strict hierarchy. The strict network hierarchy is conducive to the current management of the Chengdu-Chongqing urban agglomeration, helping to build high-quality development and carbon emission reduction in Chengdu and Chongqing through the coordination and communication of each city, and then gradually radiating the cities around Chengdu and Chongqing to realize the solid promotion of economic development and carbon emission reduction activities in the peripheral cities driven by the central cities. However, a consideration of the whole reveals that small and medium-sized cities have a lower status and unbalanced development. Over time, this strict hierarchical structure needs to be improved, requiring more emphasis on the linkages between small and medium-sized cities, accelerating the establishment of carbon emission linkages between individual cities, and pursuing the development and progress of the city cluster as a whole.
3.2 Individual network structure characteristics and evolutionary trends
The point centrality, intermediary centrality and proximity centrality of each city in the Chengdu-Chongqing urban agglomeration were calculated to analyze the position and evolution of each city in the spatial correlation network of carbon emissions, and the individual network characteristics of each city in 2020 were measured as shown in Table 3.
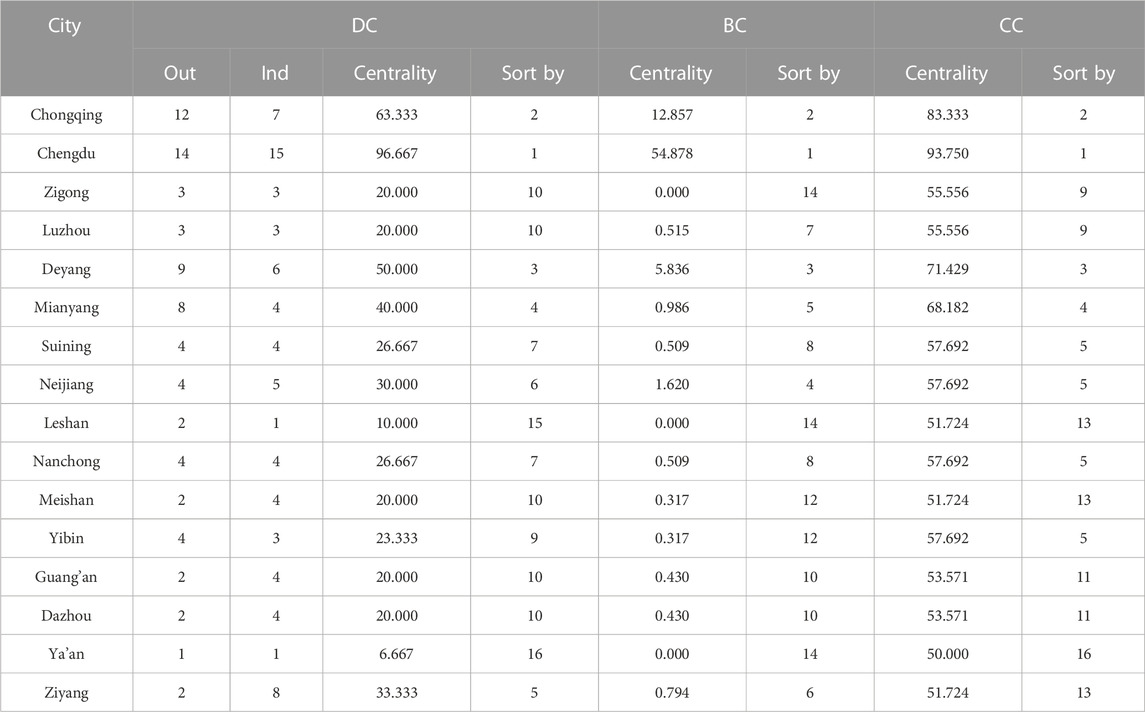
TABLE 3. Centrality analysis of carbon emission spatial correlation network of Chengdu-Chongqing city cluster in 2020.
As seen from Table 3, only Chongqing, Deyang, Mianyang, Leshan and Yibin among the 16 cities have a point-out degree greater than the point-in degree, showing a spillover effect; Chengdu, Neijiang, Meishan, Guang’an, Dazhou and Ziyang have a point-in degree greater than the point-out degree, showing a receptive body; the rest have 5 other cities with equal point-in and point-out degrees. It can be found that the mean value of point degree centrality is 31.667, and there are five cities above the mean value. The point degree centrality of Chengdu, which ranks first, is 96.667, much higher than that of Chongqing, which is 63.333, and the point degree centrality of Chongqing, which ranks second, is much higher than that of Deyang, which ranks third, indicating that Chengdu and Chongqing are at the center of the carbon emission correlation network of Chengdu-Chongqing city cluster. Among the cities below the average value, Leshan and Ya’an, the last cities, have significantly lower point-out and point-in degrees than other cities, with point-centeredness of 10.000 and 6.667, respectively, and are less connected with other cities and are located at the edge of the network.
The average value of intermediary center degree is 5.000, and only Chengdu, Chongqing and Deyang are above the average value, and the sum of intermediary center degree of these three cities accounts for 91.96% of the total intermediary center degree of all cities, reflecting the “intermediary” and “bridge” characteristics of cities within the Chengdu-Chongqing urban agglomeration. This reflects a serious imbalance in the “intermediary” and “bridge” characteristics of cities in the Chengdu-Chongqing urban agglomeration. The intermediary centrality of Chengdu is 54.878, which is much higher than other cities, and has an important role in taking over and controlling the carbon emission correlation of other cities. Chengdu and Chongqing are in a dominant position. Except for Chengdu, Chongqing, Deyang and Neijiang, the intermediation centrality of all other cities is less than 1.600, and three of them are in an extremely weak position with 0 intermediation centrality.
The mean value of proximity to the center is 60.681, among which Chengdu, Chongqing, Deyang and Mianyang are higher than the mean value, Chengdu and Chongqing are still significantly ahead of other cities, and are in the position of “central actors” in the carbon emission linkage network of Chengdu-Chongqing urban agglomeration, which can establish carbon emission links with other cities faster and have an impact on the carbon emission linkage network. The four cities are at the center of the network. In addition, these four cities are at the center of the network and play the role of “intermediary”, with strong control ability and easy to link with other cities. The cities below the average value have relatively weak ability to obtain resources and are not driven by other cities, playing the role of “marginal actor”.
Chengdu, Chongqing, Deyang, and Mianyang are ranked in the top four in terms of point degree centrality and near-centrality in 2020, and in the top five in terms of intermediary centrality, and in the top five in terms of GDP, urbanization rate, R&D expenditure, and energy consumption in the Chengdu-Chongqing urban agglomeration, indicating that the development of economy and technology is crucial and plays a leading role in the spatial network of carbon emissions. Meanwhile, Chengdu and Chongqing belong to the core cities in Chengdu-Chongqing urban agglomeration, which have obvious advantages in economy, industry and energy compared with other cities within the urban agglomeration, and pull other cities to develop through industrial agglomeration and technology diffusion. Ziyang, Neijiang and Suining, which are located between Chengdu and Chongqing, have advantages in geographic location and are more connected with other cities in the carbon emission network, with a more advanced position and better development level than other cities. Therefore, promoting the optimization of the spatial pattern of carbon emissions among cities has become a key task in the synergistic development of Chengdu-Chongqing city cluster at present.
At the same time, in order to more intuitively analyze the trend of the evolution of the spatially correlated network structure of carbon emissions of each city within the Chengdu-Chongqing urban agglomeration during the sample period, three cut-off points in 2011, 2015 and 2020 were selected to compare the individual characteristics of each city, and the results display that the centrality of Chengdu and Chongqing in these three cut-off points remains unshaken, and the point degree centrality of Chengdu is always significantly higher than that of other cities, but the intermediary centrality decreases, while Chongqing experiences a rise followed by a decline. The centrality of most of the remaining cities has increased, and the number of carbon emission correlations within the city cluster is increasing, and the corresponding network density is also increasing, especially the centrality of Ziyang has increased tremendously from the ninth place in 2011 to the fifth place. At the same time, it can be seen that except Chengdu and Chongqing, the changes of the remaining cities from 2011 to 2015 are smaller than those from 2015 to 2020, and it can be seen in connection with the overall characteristics of the network that the rapid development and improved status of small and medium-sized cities after 2017 also make the carbon emission spatial association network more stable.
4 Analysis of the influencing factors of the spatial association of carbon emissions in Chengdu-Chongqing urban agglomeration
Firstly, the influencing factors of the spatial correlation network of carbon emissions in Chengdu-Chongqing urban agglomeration are examined by QAP correlation analysis, and the results are shown in Table 4. It can be seen that D (spatial distance relationship) is significant at the 1% level, F (difference in energy intensity), P (difference in industrial structure) and R (difference in environmental protection efforts) are significant at the 10% level; E (difference in economic development level), T (difference in technology level) and U (difference in urbanization level) are not significant and have less correlation with the spatial correlation network of carbon emissions. Meanwhile, the correlation coefficient of D is negative, which is negatively correlated with the spatial correlation network of carbon emissions; the correlation coefficients of F, P and R are positive, which are negatively correlated with the spatial correlation network of carbon emissions.
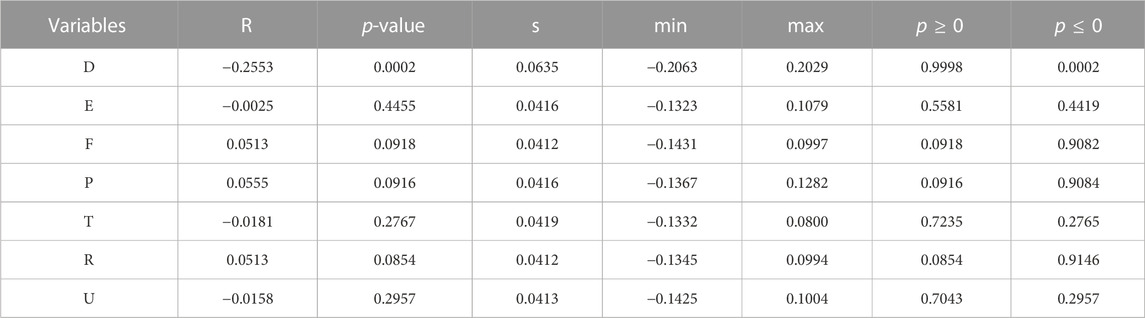
TABLE 4. Results of QAP correlation analysis of spatial correlation matrix and influencing factors.
The regression results with the variables E, T, and U removed are shown in Table 5. The fit of the regression equation is 0.534, and all of them pass the test of significance level of 10%. It is concluded that the four influencing factors of D, F, P and R can explain 53.4% of the spatial association relationship, and the regression coefficients of D and R are significant at the level of 1%, indicating that the distance between cities and the strength of environmental protection have a greater influence on the carbon emission association network of Chengdu-Chongqing urban agglomeration. The coefficient of distance is less than 0, which is negatively correlated with the spatial association relationship. Since many resource transportation and industrial transfer are more convenient when the geographical distance is close, the reduction of distance is beneficial to the formation of the spatial network of carbon emissions. The regression coefficient of the difference in environmental protection intensity is as high as 0.6482, indicating that the greater the difference in environmental protection intensity, the closer the association between carbon emissions in cities, and the cities with strict control will be under more pressure and will relieve their own pressure by transferring carbon emissions to other cities as a last resort. At the same time, the greater the difference in energy intensity and industrial structure, the greater the positive effect on the spatial association of carbon emissions. Energy intensity reflects energy use efficiency, and the level of science and technology can play a decisive role in energy use efficiency, and the energy use efficiency of cities with advanced technology is obviously higher than that of cities with backward technology. In addition, the society attaches great importance to the research of reducing carbon emission through technological innovation, and the investment in science and technology and the improvement of technology level will affect the spatial association of carbon emission. In the future, the greater the gap between the technological level of each city, the more the cities will learn and exchange with each other, which will help to strengthen the spatial association of carbon emissions in the urban agglomeration.
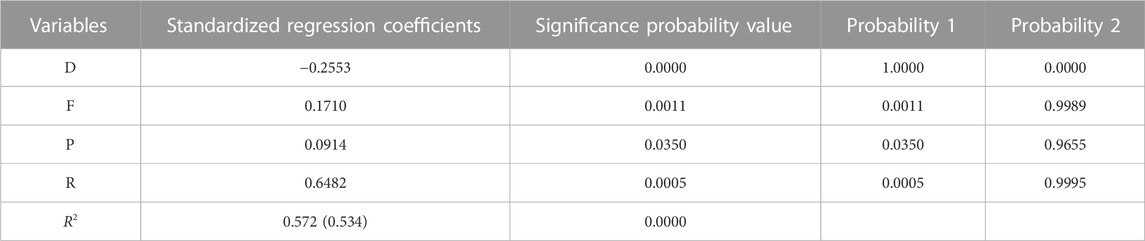
TABLE 5. Results of QAP regression analysis.
5 Conclusion and recommendations
5.1 Research findings
Taking the Chengdu-Chongqing urban agglomeration as the research object and constructing the carbon emission spatial correlation network, the main conclusions can be obtained through the analysis as follows.
(1) An examination of the overall characteristics of the spatially linked network of carbon emissions in the Chengdu-Chongqing urban agglomeration reveals that the network density and the number of linked relationships fluctuate from 2011 to 2020, and the degree of spatial linkage of carbon emissions gradually increases after 2017, with the carbon emissions between cities becoming more and more closely linked. The carbon emission network structure is stable during the sample period, and the hierarchical structure within the urban agglomerations is very strict, with Chengdu and Chongqing always at the center of the network unchanged, and the network efficiency also decreases significantly after 2017, but the overall value still seems to be high.
(2) Examining the individual characteristics of the spatially linked network of carbon emissions in the Chengdu-Chongqing urban agglomeration, we find that four cities, Chengdu, Chongqing, Deyang and Mianyang, are located at the center of the network and play the role of “bridges” to other cities, as well as “central actors”. Chengdu and Chongqing, in particular, have a more favorable external environment. Chengdu and Chongqing, in particular, have a better external environment, a high population density and a strong economic dynamism, and a driving role to provide resources to support other cities. In recent years, the intermediary centrality and proximity to the center of Chengdu has decreased, giving other cities enough space to develop. After 2017, many small and medium-sized cities have developed rapidly, especially Deyang and Mianyang, which have increased their connections with other cities, improving their status and making the carbon emission spatial correlation network more stable.
(3) QAP analysis of the factors influencing the association network shows that the differences in four types of factors, namely, spatial distance, environmental protection intensity, energy intensity, and industrial structure, are the main reasons affecting the spatial association of carbon emissions in the Chengdu-Chongqing urban agglomeration, while the technology level is closely related to these factors and will also have an impact on the association of carbon emissions in the future. Moreover, the greater the differences in environmental protection, energy intensity and industrial structure, the more likely they are to promote the formation of carbon emission correlations.
5.2 Policy recommendations
Faced with the increasingly severe pressure of climate change, and along with the further promotion of urban agglomeration construction, the Chengdu-Chongqing urban agglomeration should carry out collaborative emission reduction, and a comprehensive analysis of the spatial characteristics of carbon emissions in the Chengdu-Chongqing urban agglomeration can provide ideas to realize regional collaborative carbon emission reduction. From the results of QAP analysis, it can be seen that the differences in distance, environmental protection, energy intensity and industrial structure have a great influence on the spatial network of carbon emissions, so it is proposed to improve the spatial network structure of carbon emissions through “transportation-technology-industry”, improve infrastructure and This suggests that we should improve the spatial structure of carbon emission network through “transportation-technology-industry”, improve the infrastructure and use market regulation to carry out emission reduction activities.
(1) The closer the spatial distance, the easier it is to produce carbon emission spillover, so to promote the development of backward cities, it is necessary to focus on improving transportation planning and strengthening spatial design to build a regional carbon emission linkage network. By building links between central cities, it will promote coordination and cooperation among cities in the region, implement spatial layout planning for transportation, energy and waste treatment, and improve the allocation efficiency of resources. And we should strengthen the information interconnection of carbon emission spatial correlation within city clusters, establish dynamic carbon emission accounting system, promote cross-city collaboration, and provide technical support for the construction of regional carbon emission spatial correlation network.
(2) Improve the technical level and promote the optimization and upgrading of the energy structure. In terms of carbon emission governance, we should focus on the entire urban agglomeration, and encourage different cities to play synergies in low-carbon development and technological innovation and form a linkage development model. In the process of carbon emission reduction in the Chengdu-Chongqing urban agglomeration, we should focus on areas with high carbon emission intensity, and at the same time strengthen technical exchanges between small and medium-sized cities and Chengdu and Chongqing to improve energy intensity and energy structure. Through innovative economic development models, investment participation, research and development of new technologies, etc., inject vitality into the development of small and medium-sized cities, and optimize the regional carbon emission related network system.
(3) Promote the orderly transfer and structural adjustment of industries, enhance regional industrial linkages, and promote inter-regional complementary advantages and coordinated development. According to the characteristics of the carbon emission correlation network of the Chengdu-Chongqing urban agglomeration, give full play to the low-carbon radiation role of core cities. The two cities of Chengdu and Chongqing can encourage several neighboring cities to do a good job in industrial restructuring, eliminate high-energy-consuming enterprises, and develop low-carbon industries through industrial transfer and technological exchanges. Accelerate the cultivation of new industrial clusters in line with national development strategies, vigorously introduce emerging industries to promote industrial upgrading, upgrade and transform traditional industries to meet market demand and environmental control requirements, and adjust the proportion and relationship between different industries in each city. Gradually promote the transfer of industries from developed cities to backward areas, and guide the flow of capital, technology, labor and other factors into small and medium-sized cities in the process of industrial transfer to strengthen inter-city ties and improve regional industrial structure.
Author contributions
LZ: Writing–original draft, Writing–review and editing. RM: Writing–original draft, Writing–review and editing.
Funding
The author(s) declare financial support was received for the research, authorship, and/or publication of this article. 2022 Guangxi Humanities and Social Sciences Development Research Center “Scientific Research Project” Special Project “Guangxi Urban Agglomeration Carbon Peak Prediction and Differentiated Emission Reduction Path Research under the ‘Dual Carbon’ Goal” (WKZX2022001); Key Project of System Science and Enterprise Development Research Center of Sichuan Key Research Base of Social Sciences, “Research on Carbon Peak Prediction and Differentiated Emission Reduction Path of China’s Urban Agglomeration under the ‘Dual Carbon’ Goal” (XQ22B09).
Conflict of interest
The authors declare that the research was conducted in the absence of any commercial or financial relationships that could be construed as a potential conflict of interest.
Publisher’s note
All claims expressed in this article are solely those of the authors and do not necessarily represent those of their affiliated organizations, or those of the publisher, the editors and the reviewers. Any product that may be evaluated in this article, or claim that may be made by its manufacturer, is not guaranteed or endorsed by the publisher.
References
Ahui, Y., Long, Z., ShanZhong, Z., Zhan, Z., and Shi, J. (2022). Research on the temporal and spatial characteristics, spatial clustering and governance strategies of carbon emissions in cities of Shandong. Front. Environ. Sci. 10. doi:10.3389/fenvs.2022.1024122
Ai, Li, Wang, Y., Meng, Li, Bowen, W., and Wei, C. (2021). Study on the structural characteristics and influencing factors of spatial correlation network of carbon emissions:a case study of three major urban agglomerations in China. Environ. Sci. Technol. 44 (06), 186–193. doi:10.19672/j.cnki.1003-6504.2021.06.023
Caiquan, B., Lei, Z., Minle, X., and Chen, F. (2019). Analysis of the spatial association network structure of China's transportation carbon emissions and its driving factors. J. Environ. Manag. Sustain. 253, 109765. doi:10.1016/j.jenvman.2019.109765
Chen, L., Hang, Y., and Li, Q. (2023). Spatial-temporal characteristics and influencing factors of carbon emissions from land use and land cover in black soil region of Northeast China based on LMDI simulation. Sustainability 15 (12), 9334. doi:10.3390/su15129334
Han, F., Xie, R., Fang, J., and Liu, Y. (2018). The effects of urban agglomeration economies on carbon emissions: evidence from Chinese cities. J. Clean. Prod. 172 (08), 1096–1110. doi:10.1016/j.jclepro.2017.09.273
Li, X. T., Feng, D., Li, J., and Zhang, Z. (2019). Research on the spatial network characteristics and synergetic abatement effect of the carbon emissions in Beijing–Tianjin–Hebei urban agglomeration. Sustainability 11 (5), 1444–1458. doi:10.3390/su11051444
Liu, F., Tang, L., Liao, K., Ruan, L., and Liu, P. (2021). Spatial distribution and regional difference of carbon emissions efficiency of industrial energy in China. Sci. Rep. 11 (1), 19419. doi:10.1038/s41598-021-98225-z
Ma, X., Guo, F., and Wang, W. (2021). Research on spatial network correlation and influencing factors of information entropy of carbon emission structure in China. Environ. Econ. Manag. 35 (07), 25–30+37. doi:10.3389/fenvs.2022.871332
Marbuah, G., and Amuakwa-Mensah, F. (2017). Spatial analysis of emissions in Sweden. Energy Econ. 68 (17), 383–394. doi:10.1016/j.eneco.2017.10.003
Min, Z., and Tao, S. (2022). Dynamic spatial spillover effect of new energy vehicle industry policies on carbon emission of transportation sector in China. Energy Policy, 165. doi:10.1016/j.enpol.2022.112991
Niu, H., Zhang, Z., Xiao, Y., Luo, M., and Chen, Y. (2022). A study of carbon emission efficiency in Chinese provinces based on a three-stage SBM-undesirable model and an LSTM model. Int. J. Environ. Res. Public Health 19 (9), 5395. doi:10.3390/ijerph19095395
Qiaonan, J., Hongtao, B., Wen, L., Cai, B., and Xu, H. (2018). A top-bottom method for city-scale energy-related CO2 emissions estimation: a case study of 41 Chinese cities. Sustainability 202, 444–455. doi:10.1016/j.jclepro.2018.08.179
Shan, Y., Guan, D., Liu, J., Mi, Z., Liu, Z., Liu, J., et al. (2017). Methodology and applications of city level CO2 emission accounts in China. J. Clean. Prod. 161 (12), 1215–1225. doi:10.1016/j.jclepro.2017.06.075
Shao, H., and Wang, Z. (2021). Spatial network structure of transportation carbon emission efficiency in China and its influencing factors. Chin. J. Popul. Resour. Environ. 19 (19), 295–303. doi:10.1016/j.cjpre.2022.01.002
Shengdong, Y., Xu, Y., Xin, G., and Jingxiao, Z. (2022). Spatial and temporal distribution characteristics of carbon emissions and their drivers in shrinking cities in China: empirical evidence based on the NPP/VIIRS nighttime lighting index. J. Environ. Manag., 322. doi:10.1016/j.jenvman.2022.116082
Song, J., Feng, Q., Wang, X., Fu, H., Jiang, W., and Chen, B. (2018). Spatial association and effect evaluation of CO 2 emission in the chengdu-chongqing urban agglomeration: quantitative evidence from social network analysis. Sustainability 11 (1), 1–19. doi:10.3390/su11010001
Tan, X., Dong, L., Chen, D., Gu, B., and Zeng, Y. (2016). China’s regional CO2 emissions reduction potential: a study of Chongqing city. Appl. Energy 162, 1345–1354. doi:10.1016/j.apenergy.2015.06.071
Tengfei, H., Ruijiao, C., Nini, X., Xuan, H., Weiguang, C., Bingsheng, L., et al. (2022). Spatial correlation network structure of China's building carbon emissions and its driving factors: a social network analysis method. J. Environ. Manag., 320. doi:10.1016/j.jenvman.2022.115808
Wang, F., Gao, M., Liu, J., and Fan, W. (2018). The spatial network structure of China’s regional carbon emissions and its network effect. Energies 11 (10), 2706. doi:10.3390/en11102706
Xianzhao, L., Ruoxin, G., Yong, Z., Zhiqiang, W., Zhangchun, G., Jinning, X., et al. (2019). Nonparametric estimation and empirical analysis of spatial dependence structure of provincial carbon emissions in China.China Population. Resources and Environment. 29 (05), 40–51.
Xiaoyu, W., Ying, C., Gang, L., Mengyi, Z., Yuping, B., Fan, Z., et al. (2022). Carbon emission accounting and spatial distribution of industrial entities in Beijing—combining nighttime light data and urban functional areas. Ecol. Inf., 70. doi:10.1016/j.ecoinf.2022.101759
Yang, G.-Y., Wu, Qi, and Chu, X. (2016). Researchs of China’s regional carbon emission spatial correlation and its determinants: based on the method of social network analysis. J. Bus. Econ. (4), 56–68+78. doi:10.14134/j.cnki.cn33-1336/f.2016.04.006
Keywords: Chengdu-Chongqing urban agglomeration, carbon emission, spatial association, social network analysis, QAP analysis
Citation: Zhigao L and Mengying R (2023) Commentary: Research on the spatial correlation network structure and influencing factors of carbon emissions in Chengdu-Chongqing urban agglomeration. Front. Energy Res. 11:1280715. doi: 10.3389/fenrg.2023.1280715
Received: 21 August 2023; Accepted: 14 November 2023;
Published: 01 December 2023.
Edited by:
Anil Pahwa, Kansas State University, United StatesReviewed by:
Yang Wang, Yunnan Normal University, ChinaLiwei Ju, Northeast Electric Power University, China
Copyright © 2023 Zhigao and Mengying. This is an open-access article distributed under the terms of the Creative Commons Attribution License (CC BY). The use, distribution or reproduction in other forums is permitted, provided the original author(s) and the copyright owner(s) are credited and that the original publication in this journal is cited, in accordance with accepted academic practice. No use, distribution or reproduction is permitted which does not comply with these terms.
*Correspondence: Ruan Mengying, cm15aW5nMDA0M0AxNjMuY29t