 Zhang Linjuan
 Fu Han2
- 1Economics and Technology Research Institute of State Grid Henan Electric Power Company, Zhengzhou, Henan, China
- 2Henan Society of Electrical Engineering, Zhengzhou, Henan, China
- 3Department of Automation, North China Electric Power University, Baoding, Hebei, China
- 4Baoding Key Laboratory of State Detection and Optimization Regulation for Integrated Energy System, Baoding, China
- 5Beijing Qunling Energy Technology Co., Ltd., Beijing, China
Aiming at the problems of high investment and low efficiency in the planning and construction of electric vehicle (EV) charging stations in cities, an optimization model for site selection and capacity determination of charging stations considering the uncertainty of users’ dynamic charging demands is proposed. Firstly, based on the travel chain theory and the Origin-Destination (OD) matrix, the travel characteristics of EVs are studied, and the spatial and temporal distribution prediction model of EV charging load is established through the dynamic Dijkstra algorithm combined with the Monte Carlo method. Secondly, a site selection model for the charging station is established which takes the minimum annualized cost of the charging station operator and the annualized economic loss of the EV users as the goal. At the same time, the weighted Voronoi diagram and Adaptive Simulated Annealing Particle Swarm Optimization algorithm (ASPSO) are adopted to determine the optimal number/site selection and service scope of charging stations. Finally, an uncertain scenario set is introduced into the capacity determination model to describe the uncertainty of the users’ dynamic charging demands, and the robust optimization theory is utilized to solve the capacity of the charging station. A case study is carried out for the EV charging station planning problem in some urban areas of a northern city, and the validity of the model is verified.
1 Introduction
To achieve the goals set by China in the Paris Agreement, which include peaking carbon emissions by 2030 and achieving carbon neutrality by 2060, the vigorous development of electric vehicles in the transportation sector, characterized by low pollution and noise, has become an inevitable trend (Zhang et al., 2019a). As a public infrastructure providing charging services for EV users, the optimal planning of charging stations in terms of site selection and capacity directly affects their service efficiency and cost. Rational planning of charging station locations and capacities, to meet the capacity constraints of the distribution network while considering the interests of station operators and EV users, is an urgent problem to be solved for the large-scale development of electric vehicles. It is of great significance in achieving the dual carbon goals.
In recent years, a large amount of research has been conducted by international scholars on charging station planning problems. However, a mature and comprehensive theoretical basis has not yet been established. Li et al. (2018) considers the feeder layout of charging stations connected to the power distribution network and establishes an annual total travel time cost model for EV users based on road network traffic flow and users’ travel characteristics, using a discrete binary particle swarm optimization algorithm to solve the problem. Zhao et al. (2016) introduces the EV charging convenience factor, combines urban road information and EV driving range, and uses queuing theory to determine the station capacity. Xin et al. (2018) considers the comprehensive interests of charging station operators, EV users, and power grid companies, and uses a chaotic simulated annealing particle swarm optimization algorithm and Voronoi diagram to solve the site selection and capacity determination model. Gan et al. (2020) proposed a partition planning model based on candidate points. Ge et al. (2016) establishes a probability selection function for taxi drivers to choose charging stations based on utility functions and uses an improved quantum genetic algorithm to solve the site selection and capacity determination for electric taxi charging stations. Xiao and Gao (2022) establishes an upper-level model to minimize the sum of the users’ annual loss cost and the charging station’s annual total cost, and a lower-level model to minimize the users’ travel distance to the station, using a simulated annealing algorithm and Dijkstra algorithm to solve the problem. Yan et al. (2021a) proposes an improved particle swarm optimization algorithm based on single-dimensional search volume probability mutation for charging station planning optimization. Dong et al. (2016) clusters charging demands, and determines station locations and capacities using the shared neighbor algorithm and queuing theory. Cao et al. (2022) proposes a fast charging station capacity allocation model based on EV path simulation results under a dynamic traffic network model and solves it using a particle swarm optimization algorithm. Zhao et al. (2021) proposes a two-stage site selection and capacity determination method for solar-battery-charging stations based on data-driven distributed robust optimization. Luo et al. (2018) establishes an optimization model for electric vehicle charging stations with multiple types of charging piles, performs equivalent treatment and second-order cone relaxation, and solves it as a mixed-integer second-order cone programming problem. Khardenavis et al. (2021) proposes a robust model for urban charging infrastructure planning based on dynamic charging demands. Ge et al. (2021) considers the deep interaction between the power system and the transportation system, as well as the transfer of users between charging stations, and proposes a city fast charging station planning method that considers network transfer performance. Fakhrmoosavi et al. (2021) considers the dynamic charging demands under traffic and weather influences, to minimize the total investment cost of charging stations, EV users’ charging, and waiting costs and solves it using a simulated annealing algorithm. In recent years, scholars have commonly utilized charging station planning models, and the characteristics of different references are summarized in Table 1 as follows.
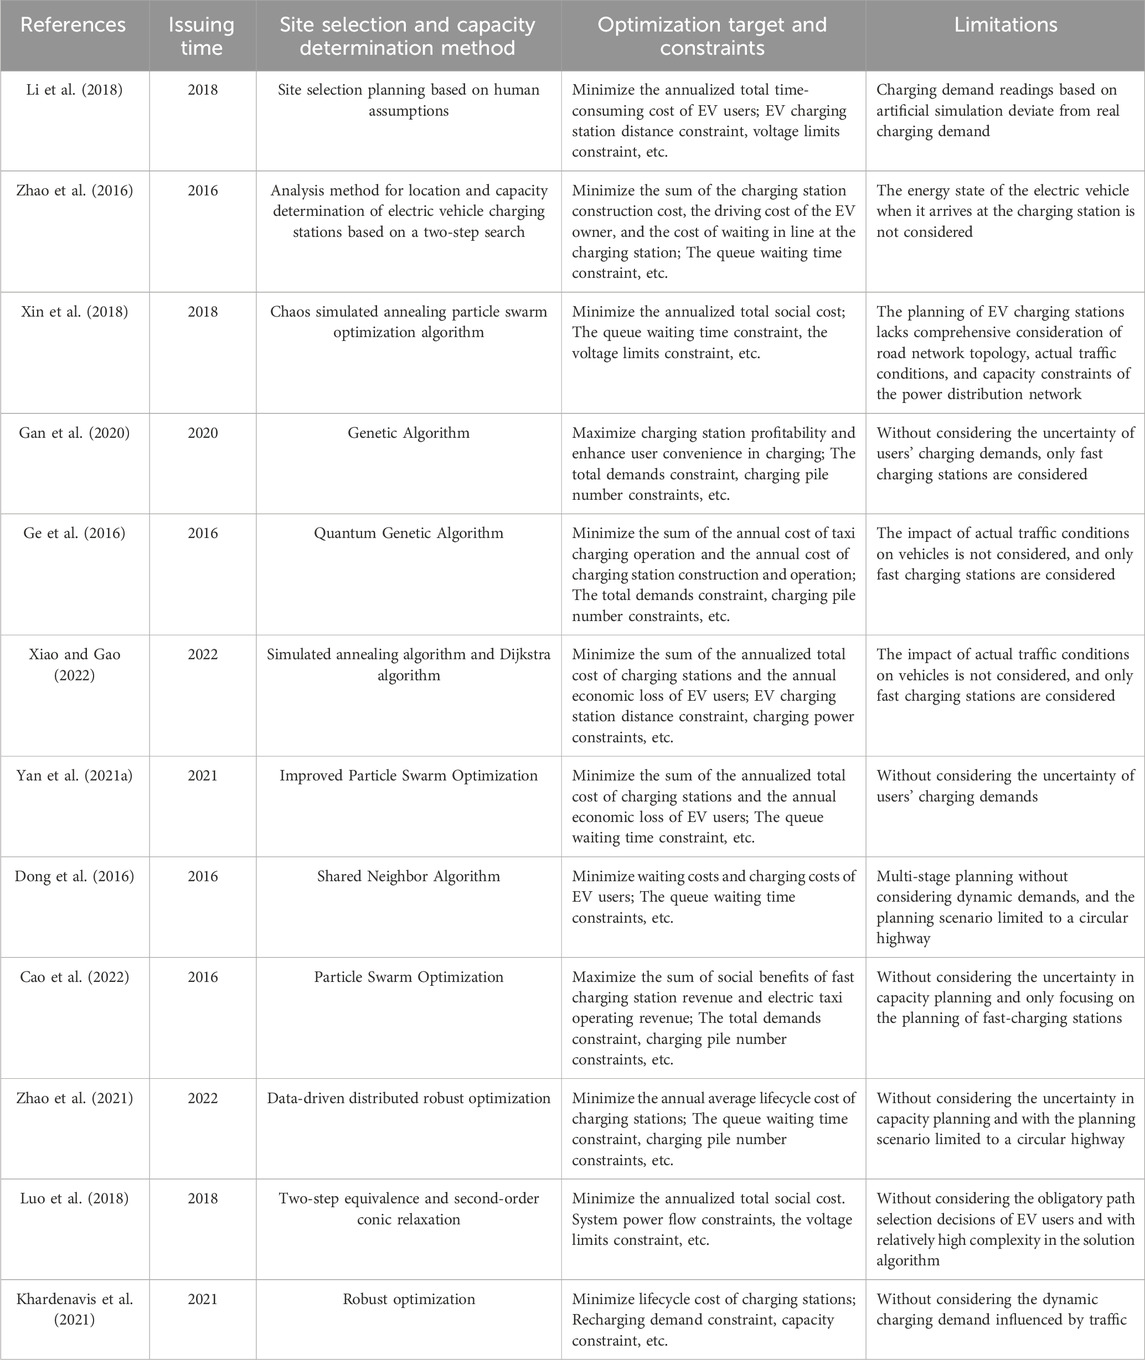
TABLE 1. Summary of charging station planning methods.
Based on the reviewed literature, it is evident that existing research on charging station planning predominantly focuses on static charging demands. These studies consider factors such as construction costs, maintenance costs, and other relevant aspects of EV charging stations. They establish corresponding models for site selection and capacity determination. However, there are still limitations that need to be addressed.
1) Lack of comprehensive consideration of road network topology, actual traffic conditions, and capacity constraints of the distribution network in the planning of EV charging stations.
2) The site selection planning for charging stations in urban areas is partly based on artificial assumptions or random generation, without analyzing the dynamic charging demands of different EV users. As a result, the obtained predictions of charging load information are biased.
3) Some existing research is based on the typical daily charging demands of users, without considering the uncertainty of charging demands. This omission has resulted in weak robustness of the planned charging station capacity and ambiguity in defining the service areas for charging stations.
To address the above issues, this paper proposes a charging station site selection and capacity determination model that considers the uncertainty of dynamic charging demands. Based on users’ travel characteristics, the users’ travel process is simulated using trip chain theory, OD matrix, and an improved Dijkstra algorithm to obtain the spatiotemporal distribution of EV charging load through dynamic Monte Carlo simulation. Considering constraints such as charging station distance and queue waiting time, an objective function is established to minimize the annual operational cost for station operators and the annual economic loss for EV users. The model is solved using an adaptive simulated annealing particle swarm optimization algorithm. The proposed model aims to achieve an optimal allocation of charging stations in terms of site selection and capacity, taking into account the dynamic nature of charging demands and the constraints of the transportation and power distribution networks.
2 Optimized model of the proposed system
Based on the electric vehicle charging load spatiotemporal distribution prediction model, the electric vehicle site selection and capacity optimization model, and the model solution algorithm, a research framework for charging station location and capacity considering the uncertainty of users’ dynamic charging demands is proposed. The technology roadmap is shown in Figure 1.
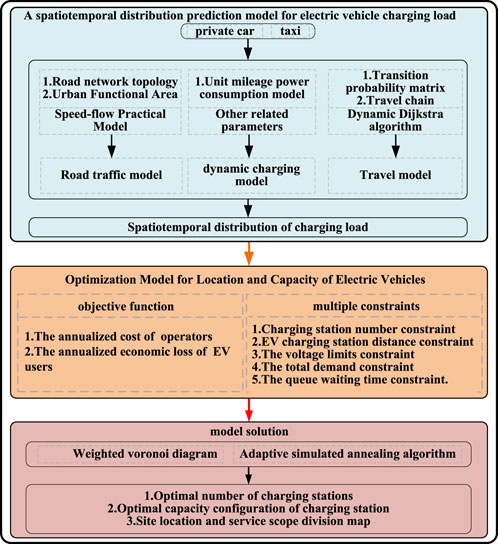
FIGURE 1. Technology roadmap of the paper.
2.1 EV travel characteristics and urban functional area division
Based on the travel chain theory and OD matrix, we study the travel characteristics of EVs, consider the attributes of urban functional areas, road topology, and other factors, set different charging trigger requirements in the dynamic charging demand model according to EV types, and use the dynamic Dijkstra algorithm combined with the Monte Carlo method. Establish a prediction model for the temporal and spatial distribution of EV charging load.
Studying the travel characteristics and charging demands of EVs is the basis for selecting the site and capacity of charging stations. Currently, to better describe EV travel destinations, the planning area is divided into three types of urban functional areas: residential areas, commercial areas, and work areas based on urban functional area attributes and load types. EVs are usually divided into four functional types: urban function vehicles, buses, electric private cars, and electric taxis (Zuo et al., 2022). Since the charging locations of the first two types of vehicles are relatively fixed, only the spatial and temporal distribution of charging loads of electric private cars and electric taxis are analyzed.
The EV travel chain is a special Markov chain. The Markov chain is used to describe a random process with no aftereffects: if each state transition is only related to the state of the previous moment and has nothing to do with the past state (Chen, 2018). It can be described as: at a certain moment, the EV sets off from the current parking location, and the destination of this trip is only related to the destination of the previous trip, forming a travel chain based on the location at different times. The four travel chains composed of electric private cars are shown in Figure 2. It is assumed that the probabilities of the four travel chains are 50%, 15%, 10%, and 10%, respectively.
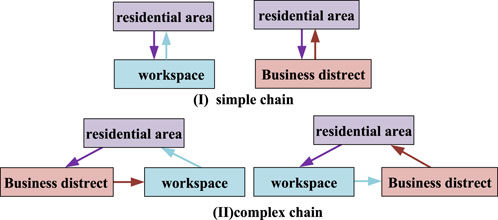
FIGURE 2. Schematic diagram of typical simple chain and complex chain.
Statistically analyze the travel chain data of electric private cars, and fit the statistical data of the first trip time and length of stay in residential areas, work areas, and commercial areas. Logarithmic distribution is used to fit the first trip time. The Weibull distribution is used to fit the length of stay in residential areas, work areas, and commercial areas. The former is fitted with Weibull distribution, and the latter two are fitted with generalized extreme value distribution. The corresponding values are found in the literature (Zhao et al., 2017). The state of charge at the time of the first trip follows the normal distribution N (0.6, 0.1). The initial locations of electric private cars and electric taxis are evenly distributed at various points in residential areas and on roads respectively.
Since the taxi travel pattern has strong uncertainty and randomness, the (Origin-Destination, OD) analysis method is used to describe the taxi travel characteristics. Through traffic survey statistics, the distribution pattern of taxi travel starting and ending points can be determined, thus obtaining The OD probability matrix of urban road network nodes in each period (Zhu et al., 2023), the corresponding values are shown in Tables 2–4.
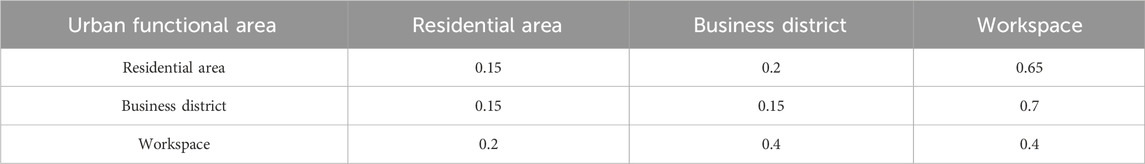
TABLE 2. Taxi OD probability matrix 06:00–18:00.

TABLE 3. Taxi OD probability matrix 18:00–21:00.

TABLE 4. Taxi OD probability matrix 21:00–06:00.
2.2 Speed-flow practical model
EV driving speed directly affects the power consumption per unit mileage, which in turn affects its charging demands (Zhang et al., 2022). Since the EV driving process is simulated in the urban transportation system, it is necessary to accurately analyze the impact of vehicle speed at different times on road capacity and traffic flow (Shao et al., 2017). Therefore, this paper introduces the speed-flow practical model. The speed Vij(t) of the vehicle traveling on the road segment R (i,j) at time t can be expressed as
In Eqs 1, 2, a, b, and n are the adaptive coefficients under different road grades. Vij-f represents the zero flow speed of road segment R(i,j); the ratio of traffic volume qij(t) of road segment R(i,j) at time t to the traffic capacity Cij of road R(i,j) is called t Moment road saturation. This paper mainly considers main roads (I) and secondary roads (II), and the corresponding values of a, b, and n refer to (Shao et al., 2017).
Equation 3 defines NR as the total number of road nodes in the traffic network and lij as the length of the road section R(i,j) in the traffic network. If there is no road connecting two nodes, the value of lij is infinity.
2.3 Simulating EV travel routes based on dynamic Dijkstra algorithm
They are considering urban road network information, which mainly includes attributes of urban functional zones and road topology, graph theory methods can be used to describe the topological structure of the road network. After using the Monte Carlo method to randomly select the origin and destination points for EV users, users typically choose the travel path with the shortest travel time from a set of candidate shortest paths. Based on the travel characteristics of EVs, the traditional Dijkstra algorithm can be improved to find the EV travel path with the minimum travel time.
This article is based on the dynamic Dijkstra algorithm. The first step is to establish a road adjacency matrix, where the starting and ending points of roads within the planning area, as well as intersections, are considered as nodes. The algorithm aims to find the M shortest candidate paths with the shortest distance from a given starting point to the destination node for an EV. Additionally, the speed-flow utility model described in Section 2.2 is utilized to minimize the travel time. The solution process is outlined as follows:
(1) Determine the road adjacency matrix D, the starting and destination nodes, and the number of paths M;
(2) Apply Dijkstra algorithm to find the i-th shortest path and its corresponding set of road segments;
(3) Remove the last road segment from the first i shortest paths and obtain m subgraphs by sequentially removing other road segments;
(4) Use the Dijkstra algorithm to find the shortest path set Rs from the starting node to the destination node for each subgraph;
(5) Remove duplicate paths from the candidate set, sort them based on path length, and select the shortest path as the (i+1)-the shortest path;
(6) Repeat steps 3, 4, and 5 until i = m, obtaining the top M shortest paths. Then, use the speed-flow utility model to determine the travel path L with the minimum travel time.
2.4 EV charging load spatiotemporal distribution prediction model
The vehicles requiring charging on the road can be integrated into the road nodes, considering the traffic nodes as charging demand points (Xin et al., 2018). Using the dynamic Dijkstra algorithm, the travel path with the minimum travel time is determined. The unit mileage consumption model is used to dynamically update parameters such as the remaining battery level for EVs, establishing an individual EV dynamic charging demand model. When an EV triggers a charging demand, the dynamic Dijkstra algorithm is employed to calculate the route with the minimum travel time from the charging demand point to the charging station. In actual road travel, users do not always choose the shortest travel time path due to their reasons. Considering the diversity of users’ path choices, the shortest travel time path is defined as the path that users are most likely to choose, and the probability of choosing other paths is the same and uniformly distributed. If there are s (s > 1) sets of paths for users from the origin to the destination, the probability of choosing the shortest travel time path is Ps, and the probability of choosing other paths is (1-Ps)/(s-1). This paper takes Ps = 0.9.
According to reference (Song, 2014), based on actual road travel data and considering the actual traffic congestion and vehicle conditions, a unit mileage consumption model for EVs is established for different road levels. Therefore, the expression for the unit mileage consumption model Eij for two-level roads is:
In Eq. 4, Eij is the EV power consumption per unit mileage of the main road (I) and the secondary road (II).
Based on the travel characteristics of EVs, when analyzing dynamic charging demand information, it is necessary to set different charging trigger requirements in the dynamic charging demand model according to the type of EV.
Electric private cars: The travel chain structure of electric private cars is relatively fixed (Zhu et al., 2023), and it is necessary to determine whether the remaining power of the EV meets the power requirements for the next trip before the next trip. When the remaining power Capt(i) cannot be satisfied, the charging requirement is triggered.
In Eq. 5, Eij is the electric energy consumption per unit kilometer of the road segment R(i,j) at time t of EV.
Taxi: Considering the mileage anxiety constraint of taxi users, set the capacity of the electric taxi battery to be lower than 0.3Capi. In Eq. 6, Capi is the capacity of the i-th electric taxi battery. When Capt(i) is lower than the set threshold power, charging demand is triggered.
This paper considers the dynamic charging demands of electric private cars and electric taxi users and uses the dynamic Dijkstra algorithm combined with the Monte Carlo method to establish a spatiotemporal distribution prediction model of EV charging load. The specific process is shown in Supplementary Appendix Figure SA1.
3 EV charging station site selection and capacity optimization model
When establishing EV charging stations, it is crucial to consider not only the annualized cost of operators but also the satisfaction of the users during the charging process. The satisfaction of EV users primarily depends on the time loss incurred while driving to the charging station, the cost of energy loss during the travel from the charging demand point to the charging station, and the users’ queuing time cost. A compromise between the interests of the charging station and the users is inevitable. On the one hand, to enhance user satisfaction, it is necessary to construct more charging stations, which inevitably leads to increased costs for the charging station operators. On the other hand, to save costs, the operators would prefer to minimize the number of charging stations, but this may adversely affect the interests of the users. In this study, we assume that the interests of both the charging stations and the users are equally important, and the objective function of our model is to minimize the annualized total economic cost. Therefore, the establishment of EV charging stations involves striking a balance between the interests of the charging station operators and the users. The goal is to minimize the annualized total economic cost while ensuring satisfactory charging experiences for EV users.
3.1 EV charging station site selection model
The objective function of the EV charging station site selection model is shown in Eqs 7–10.
Equation 7 breaks down the annualized total economic cost: F, into two parts: F1, the annualized cost of operators, and F2, the annualized economic loss of EV users. The cost of F1 for operators is made up of three main components: the annual cost of constructing EV charging station infrastructure, the cost of purchasing charging piles, and the average annual cost of operation and maintenance.
In Eq. 8, Ca is the average annual construction investment cost of EV charging stations; Cb is the average annual operation and maintenance cost of EV charging stations; k∈K = {1,2, … kmax}, K is the set of EV charging stations, and kmax is the total number of charging stations. In Eq. 9, m is the design operating life of the charging station; r0 is the discount rate; Nhigh kandNlow k are respectively the number of high-power/low-power charging piles configured at charging station k, Chigh chand Clow chares the high-power/low-power charging piles respectively. The unit price of low-power charging pile; Gk is the infrastructure cost of charging station k; in Eq. 10, α is the conversion rate of annual operation and maintenance cost according to the annual operating capacity of charging station k; Tch is the average effective charging time of charging station per day; Tyear is the number of days in a year.
The annualized economic loss F2 of EV users mainly takes into account the travel time cost, power loss cost, and queuing time cost of the EV users’ journey to the charging station. The expression of F2 calculated using Eq. 11 is as follows:
The travel time cost Cwk for EV users to travel from charging demand point j to the k-th charging station can be expressed as
The expression (Eq. 12) states that Cevu represents the unit time equivalent economic loss for EV users during their travel. Nj represents the number of EVs charging at charging demand point j and heading to the k-th charging station. jmax is the total number of charging demand points, and ΔTjk represents the travel time for an EV from charging demand point j to the k-th charging station.
The cost of energy loss during the travel from charging demand point j to the k-th charging station for EV users denoted as Cgk can be expressed as:
In Eq. 13, Cch represents the unit price of charging for EVs, f is the conversion coefficient between EV travel distance and energy consumption, and Ljk represents the total length of the road segments for EVs traveling from charging demand point j to charging station k.
3.2 Fixed capacity model of EV charging station
For users, the number of charging piles configured determines the queuing time. How to rationally allocate the number of high-power/low-power charging piles, which not only takes into account the interests of both charging station operators and users but also improves charging pile service efficiency and reduces charging station costs, is an issue that needs to be considered in charging station capacity determination. Therefore, the M/M/c queuing theory method is used to calculate the queuing waiting time of EV users. It is assumed that the number of EVs arriving at the charging station per hour obeys the Poisson distribution with parameter λ (Liu et al., 2016). Then the service intensity ρ and the average waiting time Wk of EV users are
In Eq. 14, Ncs k is the number of charging piles configured in the k-th charging station, and μ is the number of vehicles that each charging pile completes service per hour.
Equation 15 uses λ to represent the number of electric vehicles that receive services at charging stations within an hour. For Eq. 15 to be accurate, the condition ρ < 1 must be met. Equation 16 defines P0 as the probability of all charging piles being idle.
In Eq. 17, the average captain Lk per unit time is
In Eq. 18, to simplify the calculations and consider different charging durations for q EVs, the average number of vehicles served per hour, denoted as
Assuming that the number of vehicles receiving charging services at time i in charging station k is λi, then the EV users’ queuing time cost Cmk is
In Eq. 19, Wki represents the average queueing time at charging station k during the period i.
Due to the holiday and random nature of EV charging loads, the robustness of charging station capacity results obtained based on typical days of charging demand is weak (Zhu et al., 2019). To address the uncertainty in users’ dynamic charging demands, robust optimization theory is utilized. It involves incorporating an uncertain scenario set to capture the uncertainty in users’ demands and adjusting the size of the set through an uncertain budget. This approach enables the optimization of the number of high-power/low-power charging stations within the charging station to meet the diverse needs of decision-makers while considering the uncertainties in users’ demands.
Let the number of EVs that need to be charged at the charging demand point j be
Furthermore, to constrain the sum of relative deviation degrees of uncertain parameters, let the sum of relative deviation degrees of uncertain parameters not exceed the uncertain budget
3.3 Multiple constraints
The inequality constraints for the integration of EV charging stations into the distribution network primarily consider the capacity constraints of the distribution network (Ge et al., 2013).
3.3.1 Charging station number constraints
In Eq. 22, Nmin and Nmax are respectively the minimum and maximum number of charging stations to be built in the planned area.
3.3.2 EV charging station distance constraint
Equation 23 represents the distance constraint from neighboring charging station e to charging station f. Rk represents the service radius of the charging station.
3.3.3 The voltage limits constraint for distribution network node j
In Eq. 24: Vmax j and Vmin j are the upper and lower voltage limits of node j respectively; Nd is the number of nodes in the distribution network in the planning area.
3.3.4 The total demands constraint
In Eq. 25, Phigh represents the power of high-power charging equipment, Plow represents the power of low-power charging equipment, and PD represents the total daily demands of EV users in the planning area.
3.3.5 The queue waiting time constraint
In Eq. 26, Wh_max represents the maximum value for the queue waiting time of users.
4 Optimized model construction algorithm
Because the Voronoi diagram has the nearest neighbor property, it was early applied to the substation planning and site selection problem (Ge et al., 2007). In the planning and site selection of similar charging stations, site selection layout, and service scope division need to be carried out according to load demands. Therefore, a weighted Voronoi diagram is introduced to divide the service range of charging stations. In recent years, heuristic algorithms have been widely used in EV charging station site selection and capacity determination problems (Kong et al., 2019). Such as genetic algorithm (Genetic Algorithm, GA) (Li et al., 2018) simulated annealing algorithm (Fakhrmoosavi et al., 2021), whale optimization algorithm (Zhang et al., 2019b), etc. Among these heuristic algorithms, Particle Swarm Optimization (PSO) has been widely used due to its simple structure and fast convergence speed. However, as the number of iterations increases in the later stage of the algorithm, the population diversity is lost. As a result, It is often easy to fall into the local optimal solution (Kennedy and Eberhart, 1995). Therefore, to apply the algorithm to charging station site selection planning, it is necessary to improve the algorithm to avoid the group falling into local optimality prematurely.
4.1 Weighted voronoi diagram
The weighted Voronoi diagram, introduced in the text, is defined as follows:
Let P = {P1, P2, ..., Pn} (3 ≤ n ≤ ∞) be a set of control points in the plane, and τi (i = 1, 2, ..., n) is the given n positive real numbers, The weighted Voronoi diagram for any point is defined as:
In Eq. 27, d (x, Pi) is the Euclidean distance between any point x and Pi on the plane; τi is the weight of the vertex Pi. As shown in Figure 3, there are a total of eleven vertices A...K, and the value in parentheses in the figure represents the weight of the vertex.
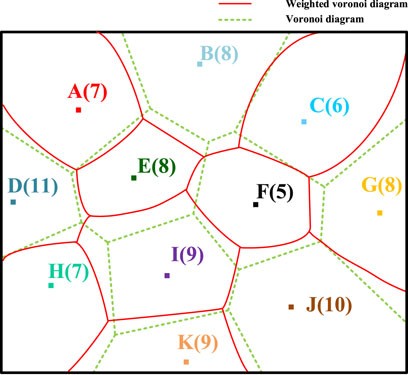
FIGURE 3. Comparison between weighted voronoi diagram and voronoi diagram.
It can be seen that the weighted Voronoi diagram also has the function of dividing the space. The weighted distance from any point in a V-curved shape of the weighted Voronoi diagram to the growing element of the curved shape is smaller than the distance from the point to other curved-shaped growing elements weighted distance. For situations where the weights of each vertex are significantly different, the weighted Voronoi diagram has a more accurate reflection ability in spatial segmentation than the ordinary Voronoi diagram. This feature can be exploited to adjust the respective service range with the weight of charging stations.
In the iterative process of automatic division and alternation of EV charging station site selection and service scope, EV charging stations with a large number of charging piles and a large reference capacity in the planned partition are given a greater initial weight. When the EV charging demands in some planned partitions are too large or too small, unreasonable partition weights need to be fine-tuned during the iterative process. If the reference capacity of the charging station in the planned area is close to the capacity margin of the distribution network node to which it is connected, the weight of the charging station needs to be adjusted to narrow the service scope. The weight of each planning partition can be calculated by Eq. 29.
In Eq. 28, i is the number of planned partitions, Qi is the EV charging demands of planned partition i, and Qr is the charging station reference capacity of the planned partition.
4.2 Adaptive simulated annealing particle swarm algorithm
This paper proposes an adaptive simulated annealing particle swarm optimization algorithm (ASAPSO). The PSO algorithm introduces a simulated annealing operation and uses the Metropolis criterion to guide the population to accept differential solutions with a certain probability, which improves the algorithm’s ability to jump out of the local optimal solution (Yan et al., 2021b). And adaptively adjust the inertial weight, self-cognition, and social cognition parts.
The optimization process of the particle swarm algorithm is completed by the flight of particles in the search space. The expressions for each iterative update of particle speed and position are:
In Eq. 29, The PSO algorithm involves several parameters, including the inertia weight coefficient (ω), cognitive acceleration coefficient (c1), and social acceleration coefficient (c2). These parameters play a crucial role in shaping the behavior of the algorithm and can significantly impact its performance.
The inertia weight coefficient controls the trade-off between global exploration and local exploitation. A high ω value allows particles to maintain their momentum and explore the search space more extensively, enhancing global search capabilities. On the other hand, a low ω value reduces the particle’s inertia, leading to more local exploitation and fine-tuning of solutions. Selecting an appropriate ω value is crucial to balancing exploration and exploitation.
Pbest,i and Gbest are the individual optimal position of the i-th particle and the global optimal position of the population respectively. c1, and c2 determine Pbest, i and Gbest on each movement, c1 controls the particle’s tendency to move towards its personal best, while c2 determines the attraction towards the global best position. These coefficients regulate the balance between exploiting the particle’s own experiences and leveraging information from other particles in the swarm.
r1 and r2 are random numbers between 0 and 1, in Eq. 30, xi(h) and vi(h) are the position and velocity of the i-th particle at the h-th iteration, respectively, and h is the current number of iterations. ω gives particles sufficient time to conduct a large-scale global search in the early stage of the search, and its decline rate is slow; in the middle stage, it strengthens local search and decreases approximately linearly; in the later stage, it focuses on detailed local search, and the rate of change decreases again. Non-linear changes are used to control c1 and c2, and the learning factors c1 and c2 adopt non-linear inverse cosine acceleration. Multiple expressions are:
In Eq. 31, ωmax and ωmin are the maximum and minimum values of ω, and hmax is the maximum number of iterations.
In Eq. 32, c1_s and c1_e are the iterative initial value and terminal value of the self-learning factor respectively; in Eq. 33, c2_s and c2_e are the iterated initial value and terminal value of the social learning factor, respectively.
By setting a higher initial temperature, the ASAPSO algorithm can significantly increase the possibility of searching for the global optimal solution. The formula is as follows:
T(h) is the current temperature, Qbest is the optimal value in the initial particle population, and μ is the cooling coefficient.
When each particle moves to a new position, its fitness is calculated. If the fitness value is better than the previous fitness value, the particle is updated and moved to the new position; otherwise, according to the Metropolis criterion, the fitness difference ΔE is calculated (ΔE is The difference between the current fitness value and the previous fitness value), if p(h) = exp[-ΔE/T(h)]>rand (rand is any random number between 0 and 1), then accept it with a certain probability The current solution is the new solution and the particles move to the new position.
4.3 Solution process
The solution process is as follows.
Step 1. Initial data processing. In Eqs 35, 36, process the EV charging demands for each hour at the demand points in the planning area to obtain the total EV charging demands (Qeva). Estimate the maximum number of charging stations (Nmax) and the minimum number of charging stations (Nmin) based on the capacity constraints of a single charging station. Within the range of Nmin to Nmax, set the number of charging station constructions as a loop variable N. Initialize N=Nmin and start the iteration. Increase N by 1 after each iteration.
Step 2. Algorithm parameter initialization. Set the coordinates of N charging stations as a solving dimension. Randomly generate initial velocities (v0) and positions (X0) for all particles in this dimension. Set the parameters of the ASAPSO algorithm: swarm size (Nsize), maximum number of iterations (Itermax), maximum inertia weight (ωmax), minimum inertia weight (ωmin), cognitive coefficients (c1_s and c1_e), social coefficients (c2_s and c2_e), and mutation probability (μ).
Step 3. Use a weighted Voronoi diagram to divide the service range of charging stations.
Step 4. Calculate the queue waiting time for each charging station and determine the corresponding quantities of high-power and low-power charging equipment.
Step 5. Update the velocities and positions of the particles.
Step 6. Update the individuals based on the fitness function and calculate the global best value (Gbest).
Step 7. Calculate the acceptance probability [p(h)] for accepting new solutions.
Step 8. Use the Metropolis criterion to compare p(h) with a random number (rand) and determine whether the new solution replaces the global best solution. Update the temperature according to Eq. 34.
Step 9. Check if the maximum number of iterations (Itermax) has been reached. If the condition is satisfied, stop the search and output the optimization result. Otherwise, return to Step 5.
Step 10. Check if the maximum number of charging stations (Nmax) has been reached. If the condition is satisfied, stop the loop. This will yield Nmax-Nmin+1 site selection and capacity determination solutions. Sort them based on the annual total economic cost and select the optimal solution. Otherwise, return to Step 2.
5 Results and discussions
5.1 Parameter scene setting
This study focuses on the site selection and capacity optimization of EV charging stations in a specific region of a northern city. The planning area of this region is approximately 58 km2, with an east-west span of about 7.56 km and a north-south span of about 8.62 km. The total population in this area reaches 250,000. The first step is to divide the transportation road network within this region. There are 48 road nodes and 82 road segments. Within the planning area, there are 3,000 electric private vehicles and 1,100 electric taxis. For simplicity, it is assumed that each electric vehicle has an average capacity of 50 kWh.The coverage of nodes for each functional zone within this area can be found in Supplementary Appendix Table SA1, and the schematic diagram of the road network structure is provided in Supplementary Appendix Figure SA2.
In the given example, the parameters for the particle swarm optimization algorithm are set as follows:
• Swarm size (Nsize = 100)
• Maximum number of iterations (Itermax = 100)
• Maximum inertia weight (ωmax = 0.95)
• Minimum inertia weight (ωmin = 0.45)
• Cognitive coefficient (c1_s = 2.50)
• Cognitive coefficient (c1_e = 1.25)
• Social coefficient (c2_s = 1.25)
• Social coefficient (c2_e = 2.50)
• Mutation probability (μ = 0.95)
•
The parameters related to the charging stations are as follows:
• High-power charging station power (Phigh = 80 kW)
• Cost of purchasing a high-power charging station: 20,000 yuan per unit
• Low-power charging station power: (Plow = 30 kW)
• Cost of purchasing a low-power charging station: 8,000 yuan per unit
• Minimum number of charging stations to be built (Nmin = 5)
• Maximum number of charging stations to be built: (Nmax = 12)
• Service radius (Rk = 1.5 km)
• Maximum waiting time for charging (Wh_max = 20 min)
Other charging station planning parameter values can be found in Supplementary Appendix Table SA2.
5.2 Spatiotemporal distribution prediction results
Using the load forecasting method proposed in Section 2, which takes into account the dynamic charging demands of users, the spatial and temporal distribution of charging load for electric private vehicles and electric taxis is obtained. The specific results are shown in Figure and Figure 5.
Analysis of Figures 4, 5 reveals that the spatial and temporal distribution of charging load at each node is closely related to the functional zones of the respective cities. The nighttime peak charging demand areas are predominantly concentrated in residential areas, while the daytime peak charging demand areas are primarily concentrated in working and commercial zones. For electric private vehicles, the peak charging demands during the nighttime are mainly concentrated between 19:00 and 03:00. This is because most electric private vehicle owners prefer to charge their vehicles slowly during the night. The peak charging load in residential areas occurs around 19:00 when most electric private vehicle users return home.
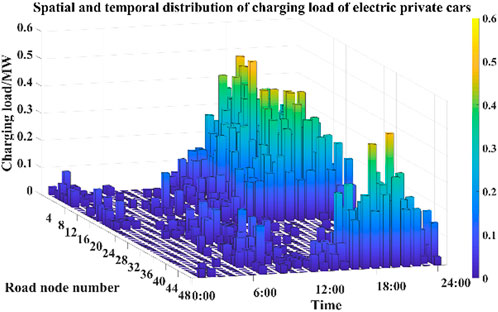
FIGURE 4. Spatial and temporal distribution of charging load of electric private cars.
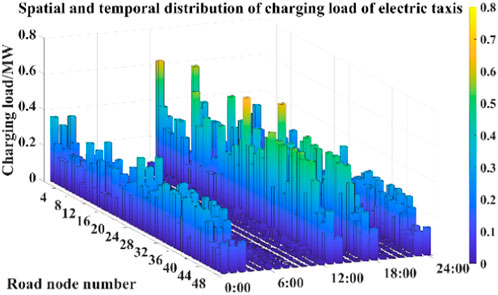
FIGURE 5. Spatial and temporal distribution of charging load of electric taxis.
For taxis, the charging load reaches its peak between 12:00 and 14:00, with another peak occurring between 17:00 and 18:00. During the first period, taxi drivers take a break and have lunch, so they prefer fast charging to quickly replenish their vehicle’s battery. The second period is 1 h before the evening rush hour when they need to quickly recharge to cope with the upcoming peak demand. In different functional zones, significant charging demands for electric private vehicles are observed at nodes 1–9, 16–21, 46–48, etc. After work or commercial activities, most electric private vehicle users return to residential areas. If their remaining battery level is insufficient for the next trip, charging demands arise. For taxis, nodes 8–10, 22–24, and 38–42 represent the road nodes with the highest number of charging stations in each functional zone. These nodes primarily serve as transportation hubs connecting residential and commercial areas and are linked to main roads. From a spatial perspective, the charging load for taxis is significantly influenced by the attributes of the functional zones. On one hand, users concentrate along the main roads connecting residential areas to commercial areas, which are the main destinations and passenger pick-up areas for taxis, resulting in higher charging demands. On the other hand, main roads in the urban transportation system provide advantages such as wider roads and easier travel, making drivers more likely to choose them, thereby increasing the charging demands.
5.3 Algorithm verification
To verify the superiority of the proposed algorithm, we chose to run it on the same computer and used the ASAPSO algorithm, Particle Swarm Optimization (PSO), and Genetic Algorithm (GA) mentioned in the article to solve the example, respectively, the optimal fitness curves of the three algorithms are obtained, as shown in Figure 6. Comparing the three curves in the figure, we can see that the PSO algorithm has the fastest convergence speed in the early iterations and converges quickly with a smaller number of iterations. The GA algorithm has the slowest convergence speed. Compared with other algorithms, ASAPSO has better convergence speed and accuracy in the early iterations, and after 60 iterations, when the other two algorithms have fallen into local optimal solutions, the ASAPSO algorithm can still continuously update the global optimal value, still maintaining good population diversity in the middle and late stages of iteration. It can be seen that ASAPSO has certain advantages in both convergence speed and accuracy, and the comprehensive optimization results are better than the other two algorithms.
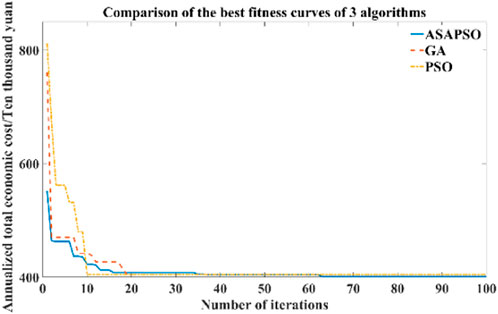
FIGURE 6. Comparison of optimal fitness curves of three algorithms.
5.4 Result of charging station site selection and capacity determination
Based on the prediction of the spatial and temporal distribution of charging demands, the planning process is solved according to Section 4.3, and the annualized total economic cost of each planning scheme is obtained, as shown in Table 5 and Figure 7.
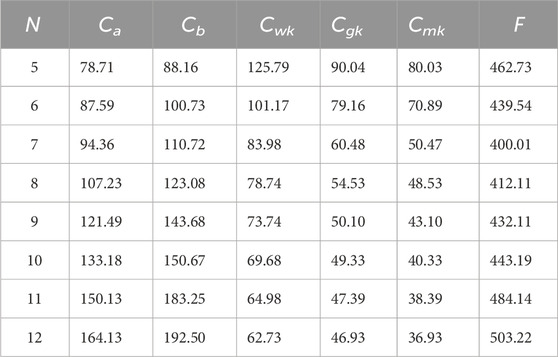
TABLE 5. Annualized total economic cost of each planning scheme.
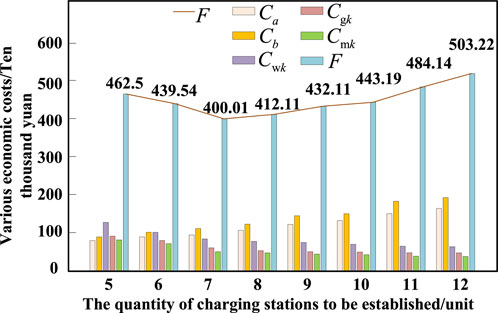
FIGURE 7. Annualized total economic cost comparison chart.
Table 5 shows that for EV charging station operators, the number of charging stations has a linear relationship with the annual average fixed construction costs and annual average operational and maintenance costs. For EV users, an increase in the number of charging stations reduces costs associated with travel distance, time, and waiting queues. When constructing 5 to 7 charging stations, the total annual economic cost decreases as the number of EV charging stations increases. However, when constructing 7 to 12 stations, the total annual economic cost increases with the number of stations. The optimal planning solution is achieved when there are 7 charging stations, resulting in the minimum total annual economic cost of 4,000,100 yuan.
For the planning solution with seven charging stations, the objective is to minimize the sum of EV users’ annual economic losses and charging station operators’ annual costs. The optimal number and locations of charging stations are determined using the risk-value theory to solve the robust capacity model. The weighted Voronoi diagram is employed to divide the service range of the charging stations. The coordinates of the charging station sites and the number of charging piles for each station are shown in Table 6. The configuration of high-power and low-power charging piles is illustrated in Figure 8, and the layout and service range division of the charging stations are presented in Figure 8. The layout and service coverage of the charging stations are depicted in Figure 9, with the numbering of the 7 charging stations as A, B, C, D, E, F, and G.
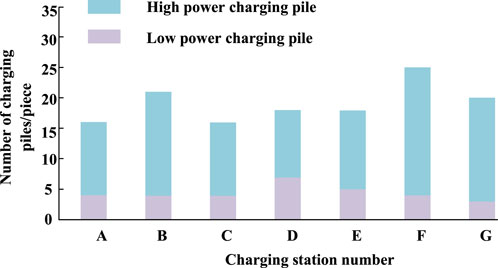
FIGURE 8. The number of high-power/low-power electric piles configured in each charging station.
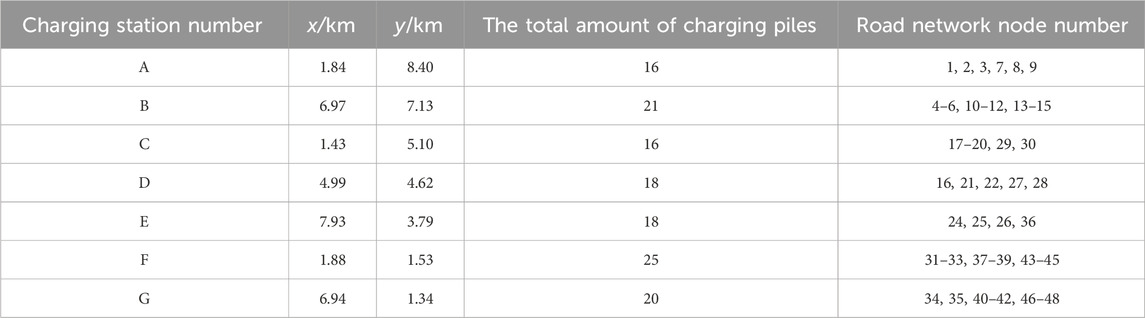
TABLE 6. The site selection of the EV charging station and the number of charging piles.
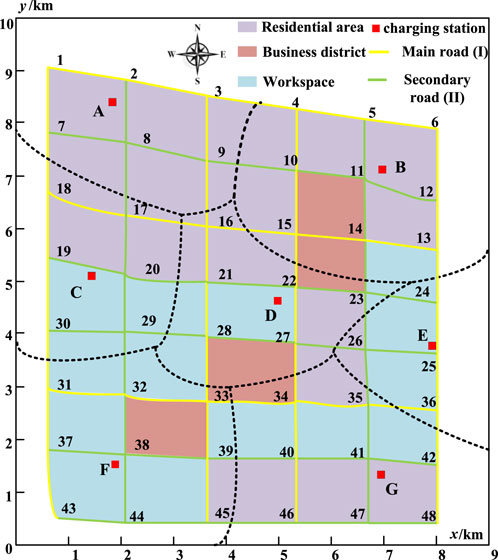
FIGURE 9. Site selection and service scope division map.
From the results in Table 6 combined with Figure 8, it can be seen that the number of charging piles in different charging stations is related to the charging load of the coverage area. According to the analysis of the EV charging load demand prediction results in Section 5.2, it can be seen that EVs generally replenish electric energy quickly in a short time in commercial areas. Charging times are relatively long in work areas and residential areas. Road node numbers with large charging load requirements are 5, 11, 33, 38, 41, 44, etc.; charging stations covering these nodes, such as charging stations B, F, and G are equipped with a larger number of charging piles. Charging stations A, C, and D exhibit comparatively lower charging demand within their respective coverage areas, leading to a noticeably reduced number of charging points allocated correspondingly. It can be seen from Figure 8 that for charging stations with a larger total number of charging piles, the proportion of high-power charging piles is greater than that of low-power charging piles, and most of these charging stations are distributed in areas with high charging demands, such as charging stations B and F. It is not only close to the business district but also located in the heart of the residential area or work area. Charging stations with a high proportion of low-power charging piles mean that there are less demands for fast charging in the coverage area. As long as it can meet normal charging, the corresponding total charging demands are relatively low, such as charging stations A, C, and D.
Based on the aforementioned results, it can be concluded that the proposed optimization strategy for configuring high-power and low-power charging stations effectively addresses the charging demand in different planning areas. This approach expands the range of options available to EV users. Compared to methods that only consider the deployment of high-power charging stations, this strategy demonstrates superiority in practical capacity-based applications of charging stations.
In addition, due to the increasing demand from EV users in recent years, to further highlight the advantages of the robust optimization model, deterministic Scenario 1 and uncertain Scenario 2 were designed in this section for analysis and comparison.
Scenario 1. Under the deterministic condition of EV user charging demand, the number, location, and capacity of charging stations are determined using the charging station optimization model established in Section 3.
Scenario 2. Under the uncertain condition of EV user charging demand, without adding new charging station locations, the capacity of existing charging stations is adjusted using the capacity-based robust model.
To compare the resilience of the two scenarios against risks, the existing demand at each charging point was increased by 20% to represent the expected demand. Figure 10 illustrates the quantities of charging points configured when the demand is increased by 20%.
Based on Figure 11, it can be observed that the charging station capacity in Scenario 1 almost perfectly meets the current existing users’ charging demands. However, when the users’ anticipated charging demand increases by 20%, the daily service capacity of the previously optimized seven charging stations is unable to meet the users’ requirements. This would significantly diminish the charging experience for EV users. Without considering the addition of new charging station locations, and only taking into account the uncertainty of demand, a robust capacity planning model adjusts the capacity of the existing charging stations. Comparing the capacity planning results, it is evident that Scenario 2, in contrast to Scenario 1, not only effectively satisfies the current users’ charging demands but also leaves room for expansion. Even with a 20% increase in the anticipated charging demand, the capacity planning results in Scenario 2 still meet the users’ expected requirements. This indicates that the capacity adjustment in Scenario 2, implemented through a robust capacity planning model that considers demand uncertainty without the need for additional charging station locations, proves capable of meeting the users’ anticipated demands. Moreover, it demonstrates that Scenario 2 charging station capacity is more than sufficient to accommodate the increased demand, ensuring a satisfactory charging experience for EV users.
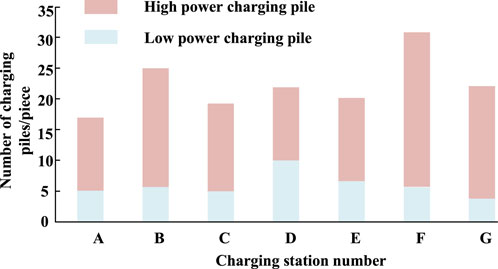
FIGURE 10. The number of electric piles in each charging station in Scenario 2 when the demands increase by 20%.
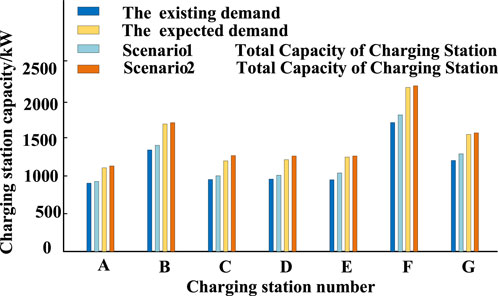
FIGURE 11. Comparison of the total capacity of charging stations in Scenario 1 and Scenario 2.
6 Conclusion
The paper proposes a capacity determination method for siting charging stations considering the uncertainty of users’ dynamic charging demands. Through a case study analyzing a specific city’s urban area in the northern region, the main conclusions obtained are as follows:
1) The proposed charging station planning model, which aims to minimize the annual total economic cost, provides reasonable charging station locations and the configuration of high-power/low-power charging piles. It aligns well with the actual situation. The annual costs of EV charging station operators and the annual economic losses of users are relatively low, balancing the interests of both parties.
2) The ASAPSO algorithm, introduced in the study, incorporates a simulated annealing mechanism and adaptively adjusts the self-cognition and social cognition components, improving algorithm performance. This leads to more accurate siting planning results for charging stations. The introduced weighted Voronoi diagram effectively delineates the service range of charging stations.
3) The proposed capacity-constrained robust model, which considers the configuration of high-power/low-power charging piles, enables effective optimization of these piles’ quantities. It provides a reference for addressing the uncertainty of charging demands in charging station planning.
Data availability statement
The original contributions presented in the study are included in the article/Supplementary Material, further inquiries can be directed to the corresponding author.
Author contributions
ZL: Conceptualization, Data curation, Formal Analysis, Writing–original draft, Writing–review and editing. FH: Conceptualization, Software, Writing–original draft. ZZ: Conceptualization, Writing–review and editing. WS: Writing–original draft, Writing–review and editing.
Funding
The authors declare financial support was received for the research, authorship, and/or publication of this article. This paper is supported by the Science and Technology Project of State Grid Henan Electric Power Company (5217L0220001).
Acknowledgments
The authors are grateful to the editor and reviewers for their work.
Conflict of interest
Authors ZL and ZZ were employed by Economics and Technology Research Institute of State Grid Henan Electric Power Company. Author ZJ was employed by Beijing Qunling Energy Technology Co., Ltd.
The remaining authors declare that the research was conducted in the absence of any commercial or financial relationships that could be construed as a potential conflict of interest.
Publisher’s note
All claims expressed in this article are solely those of the authors and do not necessarily represent those of their affiliated organizations, or those of the publisher, the editors and the reviewers. Any product that may be evaluated in this article, or claim that may be made by its manufacturer, is not guaranteed or endorsed by the publisher.
Supplementary material
The Supplementary Material for this article can be found online at: https://www.frontiersin.org/articles/10.3389/fenrg.2023.1295043/full#supplementary-material
References
Cao, F., Hu, J., Luo, J., and Zheng, J. (2022). Capacity con-figuration of EV path simulation based on road network dynamic model. Electr. Power Autom. Equip. 42 (10), 107–115. doi:10.16081/j.epae.202205003
Chen, L. (2018). Research on the impact of extensive access to electric vehicles on the power grid and its regulation strategy. China: South China University of Technology.
Dong, X., Mu, Y., Jia, H., Wu, J., and Yu, X. (2016). Planning of fast EV charging stations on a round freeway. IEEE Trans. Sustain. Energy 7 (4), 1452–1461. doi:10.1109/tste.2016.2547891
Fakhrmoosavi, F., Kavianipour, M. R., Shojaei, M. H. S., Zockaie, A., Ghamami, M., Wang, J., et al. (2021). Electric vehicle charger placement optimization in Michigan considering monthly traffic demand and battery performance variations[J]. Transp. Res. Rec. 2675 (5), 13–29. doi:10.1177/0361198120981958
Gan, X., Zhang, H., Hang, G., Qin, Z., and Jin, H. (2020). Fast-charging station deployment considering elastic demand. IEEE Trans. Transp. Electrification 6 (1), 158–169. doi:10.1109/tte.2020.2964141
Ge, S., Hui, L. I., and Liu, H. (2007). Optimal planning of substation based on weighted Voronoi diagram. Automation Electr. Power Syst. 3 1 (3), 29–34. doi:10.3321/j.issn:1000-1026.)2007.03.007
Ge, S., Liang, FENG, Liu, H., et al. (2013). Charging station planning considering traffic flow information and distribution network capacity constraints. Power Syst. Technol. 37 (03), 582–589. doi:10.13335/j.1000-36.73.pst.2013.03.018
Ge, S., Rong, L. I., Han, J., et al. (2016). Charging station planning considering stochastic probabilistic behavior characteristics of electric taxi. Automation Electr. Power Syst. (4), 50–58. doi:10.7500/AEPS20150513014
Ge, S., Shen, K., Liu, H., et al. (2021). Urban fast charging network planning considering network transfer performance. Power Syst. Technol. 45 (09), 3553–3564. doi:10.13335/j.1000-3673
Kennedy, J., and Eberhart, R. (1995). Particle swarm optimization [C]//proceeding of the IEEE international conference on neural networks. Piscataway: IEEE, Press, 1942–1948.
Khardenavis, A., Hewage, K., Perera, P., Shotorbani, A. M., and Sadiq, R. (2021). Mobile energy hub planning for complex urban networks: a robust optimization approach[J]. Energy. doi:10.1016/j.energy.2021.121424
Kong, W., Luo, Y., Feng, G., et al. (2019). Optimal location planning method of a fast charging station for electric vehicles considering operators, drivers, vehicles, traffic flow, and power grid. Energy 186 (Nov. 1), 11–115826.
Li, H., Qiang, W., and Gao, Y., etc. Charging station planning considering users’ travel characteristics and available margin of distribution network lines. Electr. Power Syst. Autom., 2018, 42(23): 48–56.
Liu, H., Rong, L. I., Ge, S., et al. Multi-objective planning of charging stations considering random behavior characteristics of taxis and reliability of road network travel time. Power Syst. Technol., 2016,40(02):433–441. doi:10.13335/j.1000-3673.pst.2016.02.015
Luo, L. Z., Gu, W., Zhou, S. Y., Huang, H., Gao, S., Han, J., et al. (2018). Optimal planning of electric vehicle charging stations comprising multi-types of charging facilities. Appl. Energy 226, 1087–1099. doi:10.1016/j.apenergy.2018.06.014
Shao, Y., Mu, Y., and Yu, X. (2017). Spatial and temporal prediction of electric vehicle charging load under vehicle-road-network mode and its influence on power flow in distribution network. Proc. CSEE 37 (18), 52–5219. doi:10.13334/j.0258-8013.pcsee.161470
Song, Y. (2014). Research on energy consumption modeling and driving range estimation of pure electric vehicles based on driving conditions. Beijing: Beijing Jiaotong University.
Xiao, B., and Gao, F. (2022). Location and capacity optimization method for electric vehicle charging station with different capacity charging piles. Electr. Power Autom. Equip. 42 (10), 157–166. doi:10.16081/j.epae.202207001
Xin, A. I., Li, Y., Wang, K., et al. (2018). Site selection and capacity determination of electric vehicle charging station based on chaotic simulated annealing particle swarm optimization algorithm. Electr. Power Autom. Equip. 38 (9), 9–14. doi:10.16081/j.issn.1006-6047.2018.09.002
Yan, G., Liu, H., and Han, N. (2021a). Calculation and optimization method of charging station site selection and fixed capacity for electric vehicle space-time distribution status. Chin. J. Electr. Eng. 41 (18), 6271–6284. doi:10.13334/j.0258-8013.pcsee.202001
Yan, Q., Ma, R., Ma, Y., et al. (2021b). An adaptive simulated annealing particle swarm optimization algorithm. J. Xidian Univ. 48 (04), 120–127. doi:10.19665/j.issn1001-2400.2021.04.016
Zhang, H., Tang, L., Yang, C., and Lan, S. (2019b). Locating electric vehicle charging stations with service capacity using the improved whale optimization algorithm. Adv. Eng. Inf. 41 (AUG), 100901–101100. doi:10.1016/j.aei.2019.02.006
Zhang, Y., Zhang, Q., Farnoosh, A., Chen, S., and Li, Y. (2019a). GIS-Based Multi-Objective Particle Swarm Optimization of charging stations for electric vehicles. Energy 169, 844–853. doi:10.1016/j.energy.2018.12.062
Zhang, M., Sun, Q., and Yang, X. (2022). Electric vehicle charging load prediction considering real-time interaction of multi-source information and users’ regret. Power Syst. Technol. 46 (02), 632–645. doi:10.13335/j.1000-3673.pst.2021.0273
Zhao, F., Li, J., and Gao, F. (2021). Considering uncertainty, the location and capacity setting of highway photovoltaic storage charging station. Electr. Power Autom. Equip. 41 (08), 111–117. doi:10.16081/j.epae.202105007
Zhao, S., Li, Z., and Dang, L. (2016). Optimal site selection and capacity setting of electric vehicle charging station based on urban trans-portation network information. Electr. Power Autom. Equip. 36 (10), 8–15. doi:10.16081/j.issn.1006-6047.2016.10.002
Zhao, S., Zhou, J., Li, Z., et al. (2017). Electr. Power Autom. Equip. 37 (08), 105–112. doi:10.16081/j.issn.1006-6047.2017.08.014
Zhu, S., Yu, S., Wang, Ge, et al. (2019). Planning of electric vehicle charging station based on conditional value at risk[J/OL]. Electr. Meas. Instrum. 10, 1. [2023-05-19].
Zhu, Y., Yang, Z., Ding, T., et al. (2023). Planning of electric vehicle charging station considering users' dynamic charging demand. J. Zhengzhou Univ. Sci. 44 (02), 82–90. doi:10.13705/j.issn.1671-6833.2023.02.001
Keywords: charging stations, site selection, capacity determination, robust optimization, weighted voronoi diagram, adaptive simulated annealing particle swarm algorithm
Citation: Linjuan Z, Han F, Zhiheng Z, Shangbing W and Jinbin Z (2024) Site selection and capacity determination of charging stations considering the uncertainty of users’ dynamic charging demands. Front. Energy Res. 11:1295043. doi: 10.3389/fenrg.2023.1295043
Received: 15 September 2023; Accepted: 29 December 2023;
Published: 15 January 2024.
Edited by:
ZhaoYang Dong, Nanyang Technological University, SingaporeReviewed by:
John Fredy Franco, São Paulo State University, BrazilHassan Migdadi, Higher Colleges of Technology, United Arab Emirates
Copyright © 2024 Linjuan, Han, Zhiheng, Shangbing and Jinbin. This is an open-access article distributed under the terms of the Creative Commons Attribution License (CC BY). The use, distribution or reproduction in other forums is permitted, provided the original author(s) and the copyright owner(s) are credited and that the original publication in this journal is cited, in accordance with accepted academic practice. No use, distribution or reproduction is permitted which does not comply with these terms.
*Correspondence: Wang Shangbing, c3RlY0BuY2VwdS5lZHU=