 Hongyan Qi1Danyang Li1Jun Zhao1Hailong Ma1Xueliang Wang2Xianhu Wang2
 Bolong Zhu3,4*
 Jiaying Lin3,4Xiangyun Zhao3,4
- 1Research Institute of Exploration and Development, PetroChina Xinjiang Oilfield Company, Karamay, China
- 2Xinjiang Branch, China National Logging Corporation, Karamay, China
- 3College of Petroleum Engineering, China University of Petroleum—Beijing at Karamay, Karamay, China
- 4College of Petroleum Engineering, China University of Petroleum (Beijing), Beijing, China
Tight conglomerate rocks consist of gravels and rock matrices. The existence of these stiff gravels leads to heterogeneity in conglomerates and makes it difficult to characterize rock mechanical properties, which then affects drilling and hydraulic fracturing operations in tight conglomerate hydrocarbon-bearing reservoirs. This case study introduces a series of experimental and numerical analyses for the better understanding of rock deformation and elastic wave propagation patterns in a tight conglomerate reservoir in Junggar Basin, China. Tri-axial compression tests, acoustic test, and finite element modeling of rock deformation and elastic wave propagation in conglomerate rocks are presented. Experimentally tested samples exhibit good brittleness and shearing failure patterns, while well correlated static-dynamic elastic moduli and P-S wave velocities are captured. Numerical results show that the existence of stiff gravels leads to strong direction-dependent stress and strain anisotropies. Stress concentrations are also induced by gravels radially and axially. In the elastic wave domain, stiff gravels facilitate the propagation of elastic waves. The gravel close to the wave source also induces stronger compressive/tensile states in the wave domain, indicating that the existence of gravels in conglomerates can alter waveforms. This integrated approach improves the quantitative understanding of stress, strain, and elastic wave responses in heterogeneous tight conglomerates. This case study also serves as a reference for the brittleness evaluation and geomechanical evaluation in the study area. The contribution of this work is primarily about the integrated experimental study, solid deformation modeling, and elastic wave modeling of tight conglomerate rocks.
1 Introduction
Tight conglomerate rocks are often characterized with heterogeneity and low permeability and porosity. They have attracted increasing attention as a significant source of hydrocarbon production in unconventional reservoirs (Zou et al., 2012; Ji et al., 2015). The exploitation of these complex reservoirs requires advanced experimental and simulation techniques to optimize engineering strategies and relevant parameters (Li, 2022). In this process, improving the understanding of the rock mechanical properties of reservoir rocks is critical as they directly affect the quality of drilling and fracturing operations. Typically, experimental and numerical techniques are often used for the characterization of rock mechanical properties.
Experimental strategies have evolved significantly over the past years to enhance the understanding of the rock physical and mechanical properties and behaviors of tight rocks under certain conditions. Core analysis is a widely used technique for determining the petrophysical properties of tight rocks (Ross and Bustin, 2009; Yin et al., 2020). Wang et al. (2016) investigated the impact of confining pressure on the permeability alteration of tight sandstone cores using a triaxial method. Their findings revealed the stress-dependent behavior of permeability, which provides valuable insights into the fluid flow characteristics of tight rocks under reservoir conditions. To analyze the structural and mechanical properties at multilevel, some advanced techniques such as micro-CT scanning and nanoindentation have been employed in several tests (Javadpour et al., 2007; He et al., 2021; Liang et al., 2007; Yao et al., 2023). In a sophisticated study, Qiao et al. (2021) employed micro-CT imaging and image analysis techniques to investigate the effect of rock fabric on the pore structure and permeability of tight sandstone. Their study highlighted the relationship between pore connectivity and permeability, contributing to a better understanding of fluid flow mechanisms in tight rocks. Moreover, experimental studies have focused on fluid flow behavior in tight rocks. Pulse-decay permeability measurements have been instrumental in understanding the complex fluid flow mechanisms in these low-permeability formations (Cui et al., 2009; Ju et al., 2023). Jia et al. (2017) employed pulse-decay permeability tests to investigate the impact of mineral composition and confining pressure on the permeability of tight carbonate reservoir rocks. Their study revealed the important role of mineralogy in determining the rock physical behaviors of tight rocks, providing valuable insights for reservoir characterization and production optimization. Tracer studies have also provided insights into the diffusion and adsorption behavior of hydrocarbons in tight rocks (Zhai et al., 2014; Yuan et al., 2014). Specifically, Zhang et al. (2014) utilized radioactive tracers to investigate the diffusion and sorption characteristics of natural gas in tight shale formations. Their study revealed the impact of organic matter content and clay mineralogy on the sorption behavior of methane, contributing to a better understanding of gas storage and transport in tight shale reservoirs. Furthermore, the use of advanced experimental techniques such as acoustic emission monitoring and rock deformation tests has enabled the characterization of the mechanical properties and deformation behaviors of tight rocks under stress conditions (Zhou et al., 2013; Lei et al., 2017; Zhang et al., 2019). These studies have provided insights into the mechanical response and formation stability of tight reservoirs. They help to optimize the design of hydraulic fracturing and wellbore stability analysis. In a combined study using both experimental and numerical methods, Chen et al. (2021a) proposed a methodology to quantify the complex and heterogeneous tight conglomerate reservoir rock behaviors under tri-axial compression. A numerical model was calibrated by parameters obtained in the rock mechanical tests. Then, the model was used to characterize the stress and strain within the cores, which could not be quantified solely by tri-axial tests.
Numerical simulation techniques have been proved to be useful in the understanding of physical and mechanical properties of tight rocks. Due to the low permeability and complex pore structure nature of tight reservoir rocks, simplified numerical models often struggle to accurately represent the complex flow mechanisms in tight rocks (Clarkson and Pedersen, 2010; Guo et al., 2016). Consequently, some specialized techniques have been developed to address these challenges. Dual-porosity and dual-permeability models have been widely employed to account for matrix-fracture interactions in tight rocks (Warren and Root, 1963; Li et al., 2020; Zhong et al., 2020; Song et al., 2023). Nasrollahzadeh et al. (2021) used a dual-porosity model to simulate gas production from fractured tight sandstone reservoirs. To better the understanding of rock mechanical behaviors, the study incorporated geomechanical effects such as stress-dependent permeability and porosity to improve the accuracy of production forecasting. Discrete fracture network (DFN) models are also used for the simulation of the complex fracture networks in tight rocks (Karimi-Fard et al., 2003; Li et al., 2019; Zhang et al., 2019). Li et al. (2019) employed a DFN model to study the effects of fracture network characteristics on the depletion behaviors of tight carbonate reservoirs. They quantified the influence of fracture density, orientation, and connectivity on reservoir responses, providing important insights for optimal well placement and production strategies. The quantitative relationship between non-planar fracture geometries and stress shadow is also a relevant factor (Huang et al., 2023). 3D lattice modeling has also been employed to understand the initiation of fracture and wellbore tortuosity effects (Huang et al., 2020). Bedding planes can be reliably quantified by the discrete element method considering fracture height growth (Luo et al., 2022; Zheng et al., 2022). Pore-scale models based on digital rock analysis are also regarded as valuable tools for understanding multiphase flow and transport processes and deformation processes in tight rocks (Andrade et al., 2013; Prodanović et al., 2015; Zhou et al., 2023). In addition to these techniques, recent advancements in computational methods have allowed for the development of coupled reservoir-geomechanical models to better understand the interaction between fluid flow, heat transfer, and solid rock deformation in tight reservoirs (Guo et al., 2018; Wang et al., 2018; Zhang et al., 2019). These models couple geomechanical effects such as stress-induced changes in rock properties with fluid flow processes. They enable a comprehensive assessment of reservoir behavior. As an example, in a series of studies, Sangnimnuan et al. (2018), Guo et al. (2021) and Guo et al. (2023) proposed a coupling strategy for the quantification of temporal and spatial evolution of pressure, stress, and temperature in hydrocarbon-bearing formation, where stress-dependent reservoir rock behaviors are comprehensively analyzed. The characterization of rock deformation and failure requires the use of accurate modeling techniques. For example, displacement discontinuity methods in 2D and 3D and their combination with joint elements can help to improve the understanding of stress evolutions caused by fracturing (Li et al., 2022; Li and Wu, 2022).
Experimental and numerical methods have been widely used to measure and quantify rock mechanical properties in tight rocks. In this study, a case study is introduced where an integrated experimental and numerical workflow is proposed for the improved understanding of highly heterogeneous and tight conglomerate reservoir rocks in Mahu Sag, Junggar Basin, China. Tri-axial compression tests, P and S wave velocity measurements, and finite element modeling of the solid deformation process are involved in the methodology. This case study provides a reference for the quantification of rock mechanical properties in highly heterogeneous conglomerate rocks in tight hydrocarbon-bearing reservoirs. The observations in the study can be used in the determination of optimum well drilling and completion strategies.
2 Methodology
This study involves rock mechanical tests and numerical modeling. In the rock mechanical tests, tri-axial compression tests and acoustic testing are employed. In the numerical modeling, a finite element modeling technique is used to solve for the stress distributions in the heterogeneous rock samples.
2.1 Rock mechanical tests
In the experimental method, the tests are conducted using the GCTS high-temperature and high-pressure rock mechanics experimental platform, which enables triaxial compression tests and acoustic testing under high-temperature and high-pressure conditions. During the test, the rock sample is placed inside the triaxial compression testing machine and immersed in a container filled with silicone oil. By applying pressure to the silicone oil, confining pressure is applied to the rock sample. This method considers the principal stress conditions in hydrocarbon-bearing reservoirs. The static rock mechanical parameters, such as elastic modulus and Poisson’s ratio, are determined based on the stress and strain results. In addition, by increasing the temperature of the silicone oil containing the sample, a more realistic subsurface temperature condition can be obtained. Thus, the test can be conducted at specific confining pressures and temperatures to improve the reliability.
The acoustic testing is also conducted. The purpose of this experiment is to measure the compressional and shear wave velocities (Vp and Vs) of the reservoir rock samples using the ultrasonic pulse transmission method in order to obtain dynamic elastic parameters. In the experiment, compressional and shear waves are emitted from the transducer placed at the top of the rock sample and received by the receiver placed at the bottom. The time required for the compressional and shear waves to propagate along the axial direction of the rock sample is calculated from the acoustic waveforms. The transit times of the compressional and shear waves through the reservoir rock sample can be calculated using the following formula, which provides the required compressional and shear wave velocity data:
In Eq. 1 and Eq. 2, where
2.2 Numerical modeling
The previous section introduces the rock mechanical testing method where tri-axial compression tests and acoustic tests are employed. They can provide the stress, strain, and wave velocities of the entire rock sample. A limitation is that the rock deformation patterns within the rock cannot be directly characterized by the experimental results. To improve the methodology, numerical modeling is used so that the rock deformation patterns within the entire domain can be understood.
In this method, the assumptions of the quasi-static state and infinitesimal deformation are used (Chen B. et al., 2021). Based on these, the momentum balance can be described using the Cauchy stress tensor as:
In Eq. 3, where
The constitutive relationship between the stress and strain for the description of rock deformation is given as:
In Eq. 4, where
Based on the infinitesimal deformation theories and elastic derivations, the relationship between strain and displacement can be related as Eq. 6:
When the state of isotropy is considered, the elasticity can be expressed as Eq. 7:
For this problem, several relevant boundary conditions can be used. The traction boundary conditions can be expressed by:
In Eq. 8, where
The equations above describe the rock deformation caused by the exertion of boundary loads on the studied domain. Then, the governing equations for the elastic wave propagation in the domain representing the rock sample are also provided. They can be used to quantify the wave propagation in the domain, which is especially meaningful for heterogeneous rock samples such as conglomerates.
In an elastic domain, the relationship between velocity and strain can be expressed as Eq. 11, Eq. 12 and Eq. 13:
where
3 Case study
This case study is based on tight conglomerated rock samples cored in Mahu Sag, Junggar Basin, China. Tight oil reservoirs in this region have been commercially developed (Wang et al., 2022a; Wang et al., 2022b). The implementation of horizontal well drilling and hydraulic fracturing has largely improved the productivity here (Chen et al., 2021b; Zhi et al., 2021). Unlike tight sand reservoirs or shale reservoirs, tight conglomerate reservoirs have strong heterogeneities caused by the existence of gravels. Conventional compression tests and acoustic tests only obtain the entire stress-strain behaviors and waveforms, and they do not always suit the case in tight conglomerate rock.
In the study area, tight conglomerate rocks are composed of matrix, cement, and gravels, exhibiting strong mechanical heterogeneity and anisotropy. The gravels are embedded in the rock matrix and conglomerates usually exhibit heterogeneous patterns. Thus, their response to loadings can be rather complex. As a result, the accuracy of interpreting elastic parameters such as elastic modulus and Poisson’s ratio through acoustic logging is affected, thus increasing the uncertainty in brittleness evaluation and fracability assessment, consequently influencing the effectiveness of drilling and fracturing operations. In order to improve the accuracy of elastic parameter interpretation for tight conglomerate rocks, this study focuses on the lab measurements of tight conglomerate rock cores. By utilizing a high-temperature and high-pressure triaxial rock mechanics test and simultaneous testing of compressional and shear wave velocities, static elastic parameters, and waveforms, the study establishes the conversion relationship between the dynamic and static elastic properties of rock samples. The established conversion relationship between dynamic elastic properties (based on P and S wave velocity measurement) and static elastic properties (based on compression tests) can be a reference for acoustic logging interpretation as some acoustic logs provide P and S wave velocity data within continuous ranges of depth intervals.
In this study, a tight rock sample is first examined by the tri-axial compression test and the acoustic test. Then, a 2D finite element model is established to analyze the rock deformation and elastic waves in the domain. Finally, a sensitivity analysis is established to study the effect of gravel properties on static deformation and wave propagation behaviors.
3.1 Rock mechanical testing results
3.1.1 Compression test for static rock mechanical parameters
The compression test is achieved in the GCTS RTR-1500 rock mechanical testing platform. Figure 1 shows the typical rock sample with a failure plane caused by the tri-axial compression test in this study. The shear failure plane can be clearly observed. Some gravels can be observed in the sample and they are embedded in the matrix, leading to a relatively complex structure. It can be also observed that the shear failure plane is not strictly even as the existence of gravels results in curvatures. This is primarily caused by the existence of gravels in the tight rock sample, and the curved failure plane is associated with the boundaries and shapes of the embedded gravels.
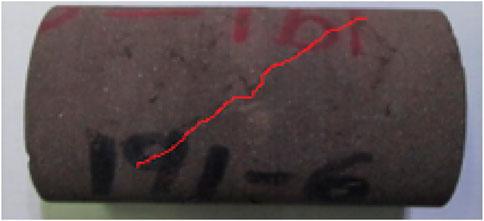
FIGURE 1. Failure plane caused by the tri-axial compression of the tight conglomerate rock sample.
Figure 2 shows the stress and strain curve obtained during the compression test. During the test, a constant confining pressure of 40 MPa is used. At the starting point, the axial stress is equal to the constant confining pressure. Then, the axial stress is gradually increased and the deviatoric stress becomes greater than 0. The deviatoric stress and axial strain result shows that the rock sample exhibits elastoplastic behaviors before the peak strength. When the axial strain is relatively small, nearly linear and inelastic behaviors are observed. After reaching the peak strength, the shear failure leads to a relative fast failure of the rock sample. Since the failure of the rock sample is achieved with a relatively low strain, the rock sample exhibits brittle deformation patterns in the compression test.
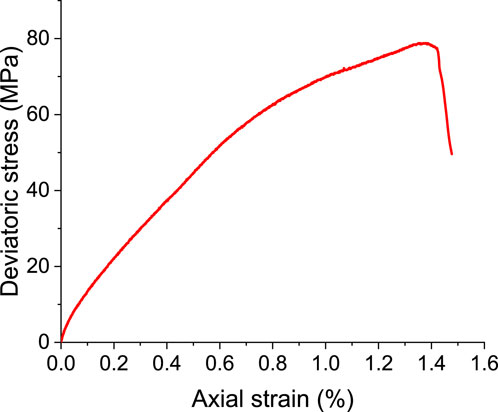
FIGURE 2. Stress and strain curve of the tight rock sample.
3.1.2 Acoustic test for dynamic rock mechanical parameters
In addition, acoustic testing is conducted for this rock sample. This test is based on the ULT-200 ultrasonic velocity measurement system.
In the testing, both raw data and processes data can be obtained. The raw data exhibits significant fluctuations, but through waveform analysis using the rock mechanics experimental platform, the processed and corrected waveform results are obtained. By employing the ultrasonic wave module for processing, the P-wave and S-wave waveforms are extracted, which improves the accuracy of compressional and shear wave velocity measurements. The fluctuations in the raw data can be attributed to various factors, including measurement noise, sample heterogeneity, and experimental conditions. To enhance the accuracy and reliability of the results, waveform analysis is performed, which involves filtering, time correction, and other processing techniques to extract the desired compressional and shear wave signals. As shown in Figure 3, the results present the processed and corrected waveform results obtained from the acoustic testing. The waveform analysis helps to remove noise and improve the clarity of the waveforms, enabling a more accurate determination of the compressional and shear wave velocities. The corrected waveforms provide valuable information about the wave propagation characteristics and elastic properties of the rock samples. The use of the ultrasonic wave module for waveform processing enhances the precision of compressional and shear wave velocity measurements. By accurately extracting the P-wave and S-wave waveforms, the acoustic testing results become more reliable and can be used to calculate dynamic elastic modulus, Poisson’s ratio, and other elastic parameters important for reservoir characterization and rock mechanics analysis.
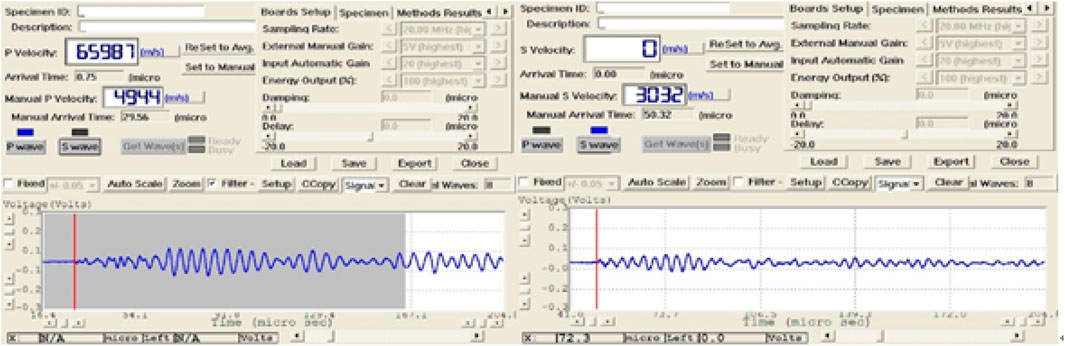
FIGURE 3. Recorded testing readings from the lab.
The obtaining and processing of signals are important in the determination of wave velocity values. The analog-to-digital converter helps to obtain the digital forms. Certain enhancement techniques are then employed. Here, filtering and amplification processes are carried out to remove unwanted noises and frequencies and to improve the signal strength. After theses processes, the time-of-flight data can be obtained by determining how long it takes to travel through the rock specimens. After the calculation, calibration and visualization are realized in the experimental platform.
3.1.3 Static and dynamic parameter correlations and observations
Based on the static elastic parameters obtained from the mechanical experiments and the dynamic elastic parameters calculated from the compressional and shear wave velocities, regression relationships for the compressional and shear wave velocities and the dynamic-static elastic parameter correlations can be established for the tight samples from the study area. The results show significant variations in the correlations of the compressional and shear wave velocity results across different well locations, while the correlations between the dynamic-static elastic parameters are stronger than those between the dynamic-static Poisson’s ratios. The compressional wave velocities in the area range from 3,300 m/s to 6,500 m/s, while the shear wave velocities range from 1,200 m/s to 3,500 m/s. The dynamic elastic modulus ranges from 11 GPa to 70 GPa, and the dynamic Poisson’s ratio ranges from 0.15 to 0.45 (Figures 4, 5). These regression relationships and parameter ranges provide valuable information for characterizing the elastic properties and wave velocities of the low-permeability conglomerate rocks in the study area in the Mahu Sag, Junggar Basin. Note that the outlier point with a Poisson’s ratio of 0.45 indicates that this data point has significant radial deformation, which can be attributed to the nonuniform radial elongation caused by the axial compression.
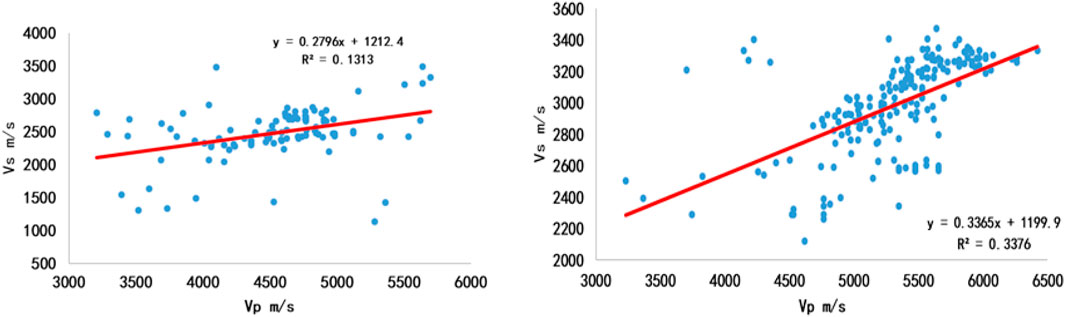
FIGURE 4. Correlations between primary and shear wave velocities.
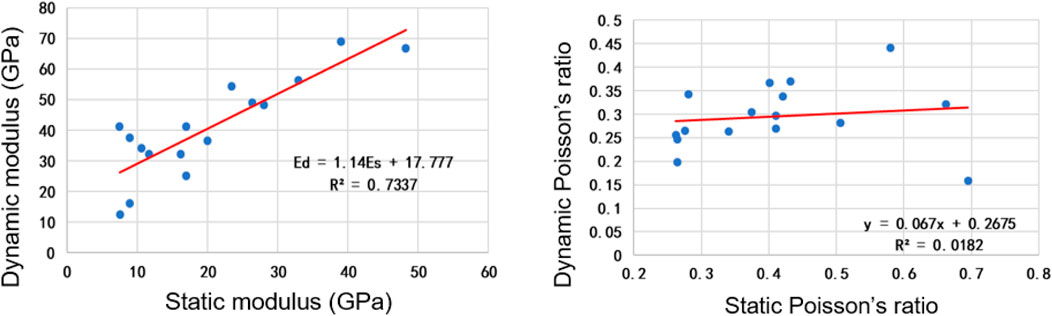
FIGURE 5. Correlations between static and dynamic properties for samples obtained from different wells.
The wide range of compressional and shear wave velocities indicates the heterogeneity of the rock formations in the area. The dynamic elastic modulus and Poisson’s ratio ranges reflect the varying degrees of stiffness and deformability of the rocks, which are important factors for reservoir characterization and hydraulic fracturing design. Understanding the elastic properties and wave velocities of the conglomerate rocks is crucial for optimizing reservoir development strategies, assessing wellbore stability, and designing effective stimulation techniques in low-permeability reservoirs. The established regression relationships and parameter ranges contribute to a better understanding of the rock mechanics and provide a basis for accurate reservoir characterization and engineering applications in the Mahu Sag.
Based on the rock mechanical test results, it can be observed that the analyzed tight rock sample exhibits good brittleness as it totally fails with a strain less than 1.5%. Also, correlations between static and dynamic rock mechanical parameters are established. The correlation for Young’s modulus is much better than the correlation for Poisson’s ratio. This section provides an experimental understanding of the mechanical properties of the tight conglomerate rock sample. The experimental results can be used as a reference for the rock mechanics and geomechanics-related analysis in this field. From the correlations in Figures 4, 5, the variations in P and S wave velocities correspond to the tight nature of the reservoir rocks. How stiff the rock specimens are and how they react to applied stress can be quantified by the results as well. The data obtained here can help to improve the reservoir modeling accuracy and the efficacy of hydraulic fracturing design.
3.2 Numerical modeling results
After obtaining the lab observations and measurements of the reservoir rocks, some numerical analyses are then carried out for the understanding of the distribution and evolution of deformation-related parameters. In the previous section, the lab tests can provide overall measurements of the rock samples, while the deformation-related characteristic within the domain of the rock cannot be directly obtained or visualized. To address this limitation, the use of numerical modeling tools is employed as they can help to provide such observations. The numerical analysis in this section can provide quantified results that cannot be directly obtained in rock mechanical labs.
3.2.1 Base case
In the numerical analysis, a 2D model is established to simulate the rock deformation and the response to elastic waves in the heterogeneous rock. The domain size of the 2D model is 25 mm by 50 mm. In this domain, the stress, strain, and acoustic response are then simulated. As in Figure 6, the 2D domain has two constant confining stress boundaries on the left and on the right, ensuring the compression in the x-direction. There is also a stress boundary on the top where an increasing boundary load is exerted, which is used to obtain continuous changes in the stress and the strain fields. The red square on the top represents the source for the elastic wave in the domain. Four elliptical gravels are placed uniformly in the 2D domain, representing the heterogeneity in conglomerate rocks. The elliptical shape of gravels is used in the 2D model. This is a simplification based on the observation of the tight conglomerate samples where many gravels are nearly ellipsoids.
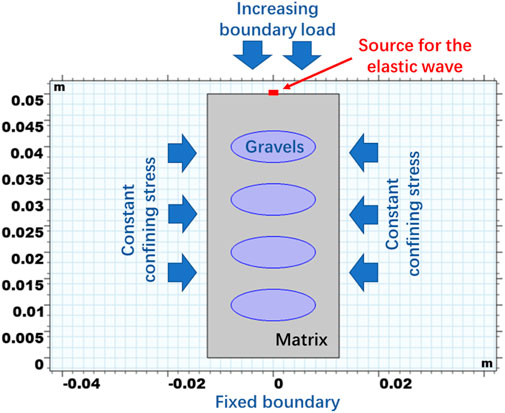
FIGURE 6. Correlations between static and dynamic properties for samples obtained from different wells.
In the base case, the simulation papameters are shown in Table 1, where rock matrix has a Young’s modulus of 30 GPa and a Poisson’s ratio of 0.25. The gravels have a Young’s modulus of 40 GPa and a Poisson’s ratio of 0.20. This difference is related to the field observation that gravels contain more stiffer minerals such as quartz and calcite than the rock matrix. The ellipses have semi-axis lengths of 8 mm and 3 mm. In this model setup, relatively uniformly distributed gravels are used so that the deformation patterns can be quantified. A constant confining stress of 40 MPa is exerted on the left and the right boundaries. The increasing boundary load on the top is exerted as 80 MPa. This combination of stress boundaries is employed following the convention in the compression tests. They also follow the traction boundary conditions in Eqs 8, 9. A static equilibrium state for the momentum balance is achieved in the solution.
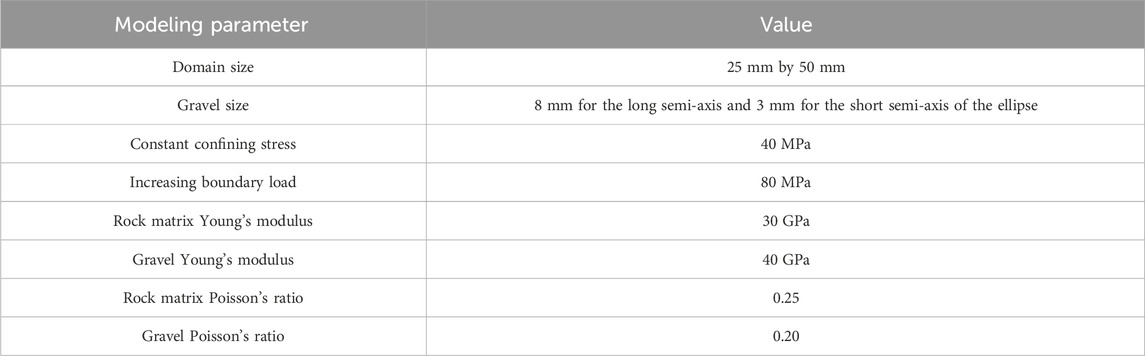
TABLE 1. Simulation parameters in the base case.
In Figures 7, 8, the rock deformation-related distribution of stress and strain results are plotted. Using the sign convention in geotechnical and rock mechanical communities, the compressive state is positive.
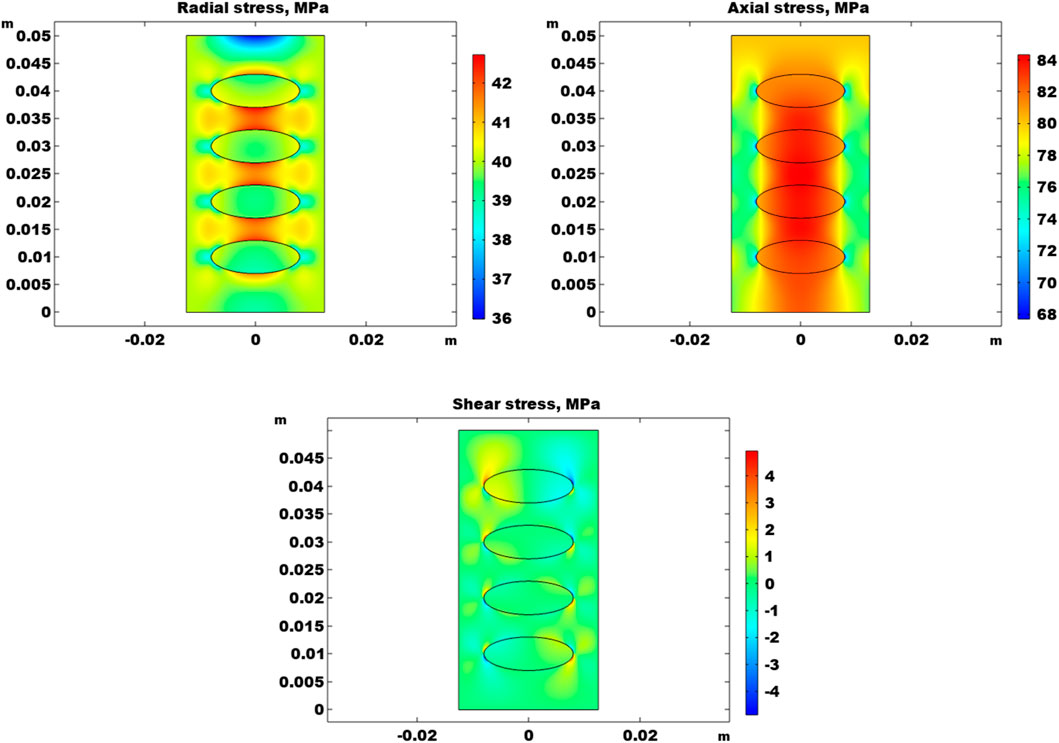
FIGURE 7. Stress distribution in gravels and in the rock matrix.
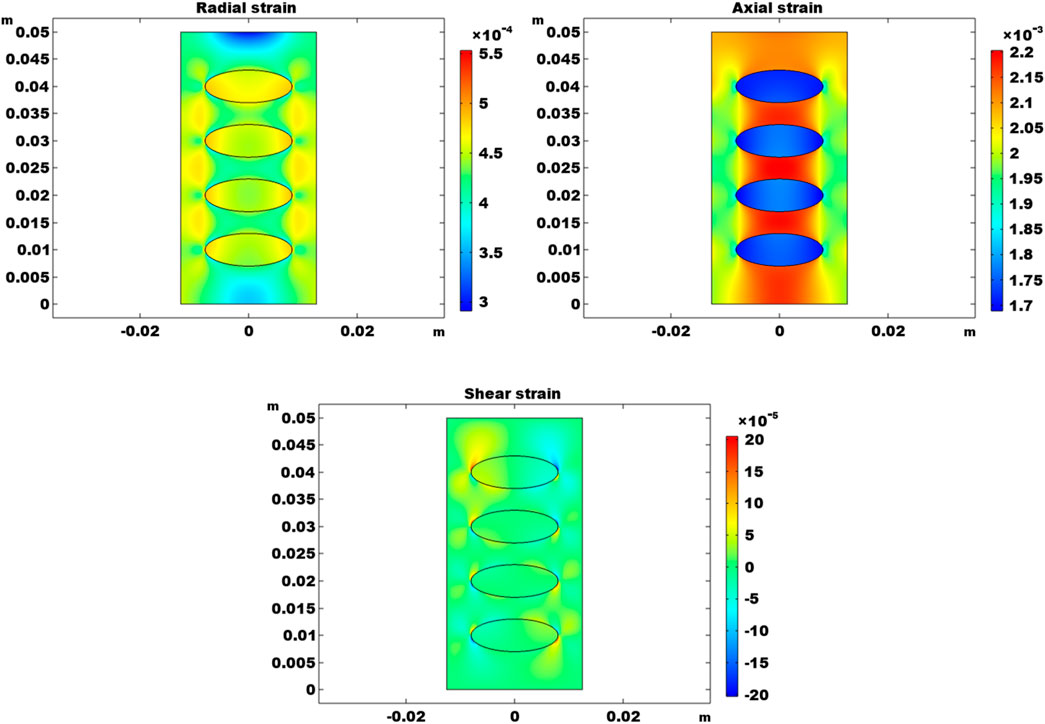
FIGURE 8. Strain distribution in gravels and in the rock matrix.
In Figure 7, the radial stress, the axial stress, and the shear stress are plotted. The radial and axial dimensions are corresponding to the convention used in tri-axial analysis of core samples. The radial dimension is identical to the x-direction and the axial dimension is identical to the y-direction. If the compression is in a homogeneous rock sample with no gravels, the radial stress is generally equal to the confining stress of 40 MPa and the axial stress is generally equal to the axial boundary load of 80 MPa. However, the existence of gravels introduces heterogeneities and the radial and axial stress results are largely altered and complicated. In the radial stress result, stress concentrations can be observed between neighboring gravels, where the radial stress magnitude is elevated by around 2 MPa. In gravels, radial stresses are not significantly altered. Decreases in radial stress can be observed at the top of the domain, at the bottom of the domain, and outside the longer semi-axes of gravels, leading to heterogeneous stress distributions. In contrast, radial stress increases are observed outside the shorter semi-axes of gravels. In the axial stress results, stress concentrations are observed along the vertical axis, where the axial stress magnitudes are greater than the axial load boundary of 80 MPa exerted at the top. Axial stresses outside the longer axes of gravels have lower stress magnitudes, while the lowest stress magnitudes are obtained at the tops of the gravels. The comparison between the radial and axial stress results indicate that the existence of stress concentrations is anisotropic: the stress concentration of radial stress is primarily in between gravels, while the stress concentration of axial stress is in both gravels and in between gravels. In addition to axial and radial stress results, Figure 7 also shows the distribution of shear stress. Shear stress magnitudes are generally below 5 MPa, which is caused by the existence of gravels. This is directly related to the heterogeneity introduced by gravels, indicating that gravels lead to shearing with in the conglomerate rock.
After the discussion of stress results, Figure 8 presents the radial strain, axial strain, and shear strain, and the strain results are indicative of compressive deformation. In the radial direction, the smallest deformations are observed at the centers of the top and the bottom regions. Tips of gravels and certain areas between tips of gravels have large radial deformations. In the axial direction, gravels exhibit strong stiffness and axial strains are low. Largest axial strains are obtained between gravels, which corresponds to the stress concentrations in stress results in Figure 7. Large shear strains are obtained near tips of gravels, indicating strong shearing effects near gravel tips.
Results in Figures 7, 8 shows that stiffer gravels lead to nonuniform deformation in the conglomerate, and this effect is highly direction-dependent. Due to the difference in stiffnesses of gravels and the rock matrix, relative deformation between gravels and the rock matrix is relatively significant. This leads to strong shearing effects, leading to shear strains and shear stresses especially at and near the contact areas between gravels and the matrix. This effect can only be captured by the consideration in this study, while traditional modeling using uniform and homogeneous assumptions cannot quantify this effect.
Previous studies demonstrate the stress and strain effects and their dependence on orientation. Then, elastic waves are also modeled in the conglomerate. The elastic wave generation source is located at the top center of the 2D domain, the length of the source is 0.2 mm. The wave generate follows the expression of:
Figure 9 documents the velocity magnitudes generated at certain time steps of 5
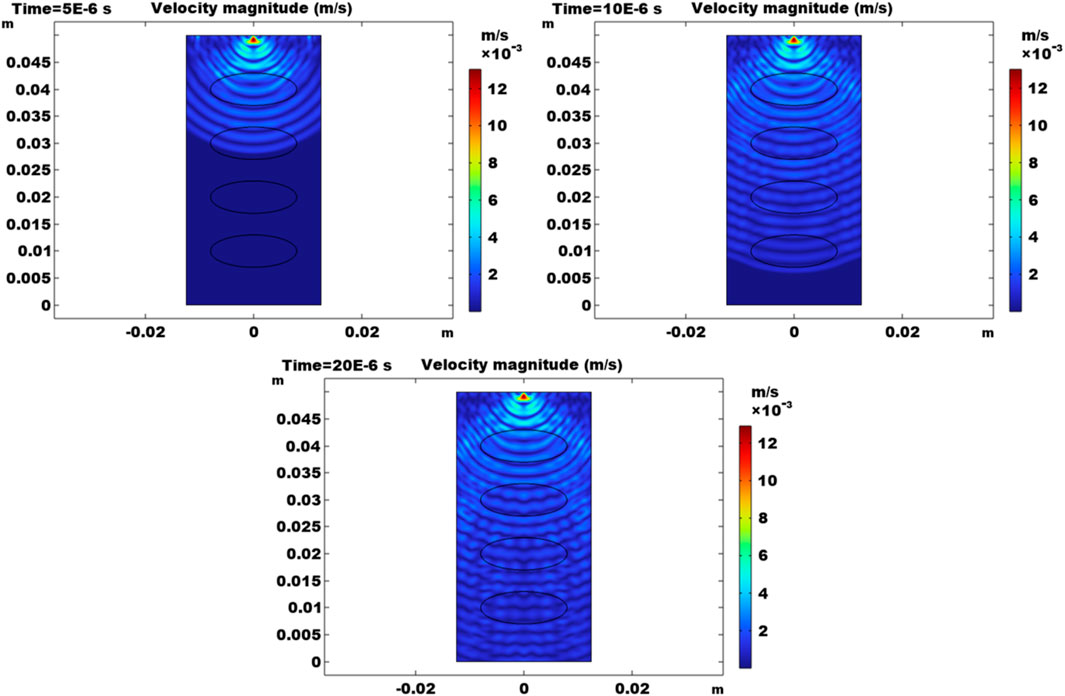
FIGURE 9. Velocity magnitudes at 5
Figure 10 shows the induced stress propagations in the elastic wave domain, and the stress is described using the term pressure. The sign of this parameter indicates whether it is in a compression state. Strong compressive/tensile stress states are observed between the source and the first gravel near the top boundary. This is because the gravel is stiffer than the matrix, and the induced deformation is the most significant here. These results at three time steps show that the stiffer gravels help to advance the source-induced waveforms and the periodic elastic waves travel faster when they move through gravels than through the matrix.
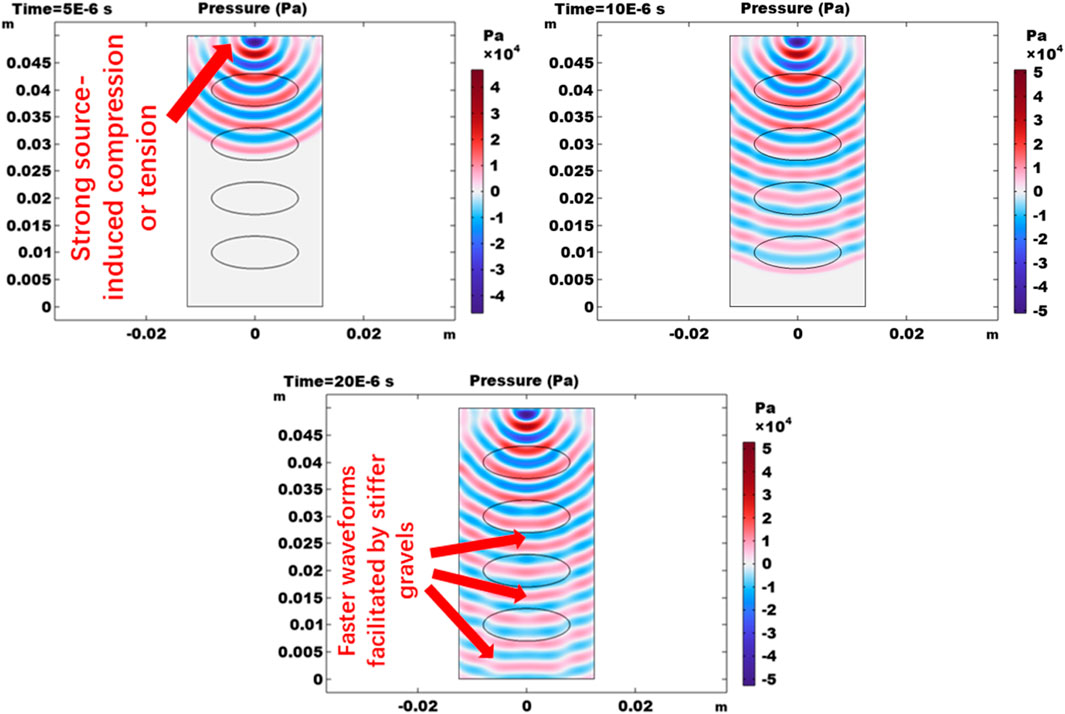
FIGURE 10. Pressure in the elastic wave domain at 5
Figure 11 shows the elastic wave-induced deformation in terms of displacement. At the first time step of 5

FIGURE 11. Displacement magnitudes at 5
Based on the result in Figures 9–11, the heterogeneity caused by gravels alters the elastic wave propagation in the conglomerate. Stiffer gravels make the compressive or tensile states stronger between the source and the first gravel near the top boundary. They also make the elastic wave travels faster in gravels than in the rock matrix.
Figure 12 shows the velocity magnitude distributed along the axis in the rock specimen domain. Results at 4 steps of 0.5 µs, 5 µs, 10 µs, and 20 µs are plotted. In the result, the x-axis stands for the distance to the top of the rock sample where the waves are induced at the source. In the elastic wave domain, the velocity magnitude gradually decreases away from the source, indicating the change in energy. Similar to results in Figure 11, only the result at 20 µs indicates that the wave reaches the bottom (receiver).
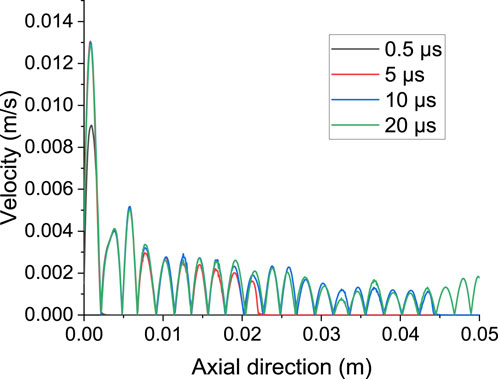
FIGURE 12. Velocity magnitude distribution in the axial direction at x = 0 m in the elastic wave domain at various time steps.
4 Conclusion
This case study introduces a series of experimental and numerical analyses of the deformation patterns in tight conglomerate samples. Correlations between static and dynamic elastic properties and P and S waves are established in the lab. The deformation patterns of the rock sample is also obtained in the experimental study. Additionally, finite element modeling is carried out to understand the effects of stiff gravels on solid deformation and elastic wave propagations in the conglomerate. The quantitative understanding in this case study serves as a reference for the brittleness and fracability evaluation in this field in Junggar Basin, China. The work also provides an integrated approach to the understanding of the elastic behaviors in tight conglomerate rock.
In conclusion:
(1) In the study area, the tested conglomerate rock is relatively brittle. Shearing failure is easily achieved when tri-axial compression is exerted in the lab. P and S wave velocities have relatively good correlations in this area, while the correlation between static and dynamic elastic moduli is much better than the correlation between static and dynamic Poisson’s ratios.
(2) In the numerical modeling of solid rock deformation caused by tri-axial compression, the existence of gravels leads to strong direction-dependent and anisotropic stress and strain distributions. Stress concentrations are observed in and between stiff gravels. Compression-induced shearing is especially strong at and near tips of gravels, which can contribute to complex shearing failure types in conglomerate deformation.
(3) In the elastic wave domain, the existence of stiffer gravels alters the elastic wave propagation patterns and the compressive/tensile state magnitudes in and around gravels. Wave-induced compression/tension is greater between the source and the first gravel near the top boundary. Stiffer gravels also facilitate the traveling of elastic waves through them, and this effect is propagated further beyond gravels as time evolves.
(4) Lab and simulation results in the study demonstrate the tight and stiff nature of the rock specimens and the highly heterogeneous rock mechanical properties. In the design of fracture stage and cluster placement, the size and location of gravels should be considered as they affect the failure of tight conglomerate rocks.
Data availability statement
The original contributions presented in the study are included in the article/Supplementary material, further inquiries can be directed to the corresponding author.
Author contributions
HQ: Writing–original draft. DL: Investigation, Methodology, Writing–original draft. JZ: Methodology, Visualization, Writing–review and editing. HM: Investigation, Software, Writing–original draft. XuW: Methodology, Visualization, Writing–original draft. XiW: Methodology, Writing–review and editing. BZ: Investigation, Methodology, Writing–review and editing. JL: Visualization, Writing–review and editing. XZ: Visualization, Writing–review and editing.
Funding
The author(s) declare that no financial support was received for the research, authorship, and/or publication of this article.
Acknowledgments
The authors acknowledge the financial support from the CNPC Innovation Fund (2021DQ02-0502) and the National Natural Science Foundation of China (51991362; 51974338).
Conflict of interest
Authors HQ, DL, JZ, and HM were employed by PetroChina Xinjiang Oilfield Company. Authors XuW and XiW were employed by China National Logging Corporation.
The remaining authors declare that the research was conducted in the absence of any commercial or financial relationships that could be construed as a potential conflict of interest.
Publisher’s note
All claims expressed in this article are solely those of the authors and do not necessarily represent those of their affiliated organizations, or those of the publisher, the editors and the reviewers. Any product that may be evaluated in this article, or claim that may be made by its manufacturer, is not guaranteed or endorsed by the publisher.
References
Andrade, J. E., and Tu, X. (2009). Multiscale framework for behavior prediction in granular media. Mechanics of Materials 41 (6), 652–669. doi:10.1016/j.mechmat.2008.12.005
Chen, A., Guo, X., Yu, H., Huang, L., Shi, S., and Cheng, N. (2021a). A parametric study of hydraulic fracturing interference between fracture clusters and stages based on numerical modeling. Energy Explor. Exploitation 39 (1), 65–85. doi:10.1177/0144598720953257
Chen, B., Ji, J., Lin, J., Chen, H., Wang, X., Guo, X., et al. (2021b). Experimental and numerical investigation of characteristics of highly heterogeneous rock mechanical responses in tight sandy conglomerate reservoir rock under tri-axial compression. Front. Earth Sci. 9, 735208. doi:10.3389/feart.2021.735208
Clarkson, C. R., and Pedersen, P. K. (2010). Tight Oil Production Analysis: Adaptation of Existing Rate-Transient Analysis Techniques,” in Paper presented at the Canadian Unconventional Resources and International Petroleum Conference, Calgary, Alberta, Canada, October 2010. doi:10.2118/137352-MS
Cui, X., Bustin, A. M., and Bustin, R. (2009). Measurements of gas permeability and diffusivity of tight reservoir rocks: different approaches and their applications. Geofluids 9 (3), 208–223. doi:10.1111/j.1468-8123.2009.00244.x
Guo, X., Jin, Y., Zi, J., and Lin, B. (2021). Numerical investigation of the gas production efficiency and induced geomechanical responses in marine methane hydrate-bearing sediments exploited by depressurization through hydraulic fractures. Energy and Fuels 35 (22), 18441–18458. doi:10.1021/acs.energyfuels.1c02569
Guo, X., Jin, Y., Zi, J., Lin, J., and Zhu, B. (2023). A 3D modeling study of effects of heterogeneity on system responses in methane hydrate reservoirs with horizontal well depressurization. Gas Sci. Eng. 115, 205001. doi:10.1016/j.jgsce.2023.205001
Guo, X., Song, H., Killough, J., Du, L., and Sun, P. (2018). Numerical investigation of the efficiency of emission reduction and heat extraction in a sedimentary geothermal reservoir: a case study of the Daming geothermal field in China. Environ. Sci. Pollut. Res. 25, 4690–4706. doi:10.1007/s11356-017-0845-x
Guo, X., Wang, Y., and Killough, J. (2016). The application of static load balancers in parallel compositional reservoir simulation on distributed memory system. J. Nat. Gas Sci. Eng. 28, 447–460. doi:10.1016/j.jngse.2015.12.030
He, X., Liu, P., Xu, L., Hao, S., Qiu, X., and Shan, C. (2021). Pore structure representations based on nitrogen adsorption experiments and an FHH fractal model: Case study of the block Z shales in the Ordos Basin, China. Journal of Petroleum Science and Engineering 203, 108661. doi:10.1016/j.petrol.2021.108661
Huang, L., Liu, J., Zhang, F., Fu, H., Zhu, H., and Damjanac, B. (2020). 3D lattice modeling of hydraulic fracture initiation and near-wellbore propagation for different perforation models. J. Petroleum Sci. Eng. 191, 107169. doi:10.1016/j.petrol.2020.107169
Huang, L., Tan, J., Fu, H., Liu, J., Chen, X., Liao, X., et al. (2023). The non-plane initiation and propagation mechanism of multiple hydraulic fractures in tight reservoirs considering stress shadow effects. Eng. Fract. Mech. 292, 109570. doi:10.1016/j.engfracmech.2023.109570
Javadpour, F., Fisher, D., and Unsworth, M. (2007). Nanoscale gas flow in shale gas sediments. J. Can. Petroleum Technol. 46 (10), 55–61. doi:10.2118/07-10-06
Ji, Y., Wang, J., and Huang, L. (2015). Analysis on inflowing of the injecting Water in faulted formation. Advances in Mechanical Engineering 7 (6). doi:10.1177/1687814015590294
Ju, W., Huang, P., Zhong, Y., Hu, H., Liang, Y., and Liu, B. (2023). Experimental study of sandstone stress sensitivity under different fluids: Characteristics and mechanisms. Geoenergy Science and Engineering 223, 211537. doi:10.1016/j.geoen.2023.211537
Karimi-Fard, M., Durlofsky, L. J., and Aziz, K. (2003). An efficient discrete-fracture model applicable for general-purpose reservoir simulators. SPE J. 8 (2), 227–236. doi:10.2118/88812-pa
Li, H. (2022). Research progress on evaluation methods and factors influencing shale brittleness: a review. Energy Rep. 8, 4344–4358. doi:10.1016/j.egyr.2022.03.120
Li, J., Liu, Y., and Wu, K. (2022). A new higher order displacement discontinuity method based on the joint element for analysis of close-spacing planar fractures. SPE J. 27 (02), 1123–1139. doi:10.2118/208614-pa
Li, B., Zhou, F., Fan, W., Ren, D., Li, H., and Li, M. (2020). Experimental investigation and theoretical modeling of stress-dependent permeability in naturally fractured tight gas reservoir. Journal of Petroleum Science and Engineering 188, 106949. doi:10.1016/j.petrol.2020.106949
Li, J., and Wu, K. (2022). An efficient model for hydraulic fracture height growth considering the effect of bedding layers in unconventional shale formations. SPE J. 27 (06), 3740–3756. doi:10.2118/210572-pa
Lei, Q., Latham, J., and Tsang, C. (2017). The use of discrete fracture networks for modelling coupled geomechanical and hydrological behaviour of fractured rocks. Computers and Geotechnics 85, 151–176. doi:10.1016/j.compgeo.2016.12.024
Luo, H., Xie, J., Huang, L., Wu, J., Shi, X., Bai, Y., et al. (2022). Multiscale sensitivity analysis of hydraulic fracturing parameters based on dimensionless analysis method. Lithosphere 2022 (Special 12), 9708300. doi:10.2113/2022/9708300
Nasrollahzadeh, B., Amiri, H. A. A., and Ghabezloo, S. (2021). Field-scale fully coupled simulation of fluid flow and geomechanics: Gas storage/recovery process in a depleted sandstone reservoir. Journal of Petroleum Science and Engineering 200, 108423. doi:10.1016/j.petrol.2021.108423
Prodanović, M., Lindquist, W. B., and Seright, R. S. (2006). Porous structure and fluid partitioning in polyethylene cores from 3D X-ray microtomographic imaging. Journal of Colloid and Interface Science 298 (1), 282–297. doi:10.1016/j.jcis.2005.11.053
Qiao, J., Zeng, J., Chen, D., Cai, J., Jiang, S., and Xiao, E. (2021). Permeability estimation of tight sandstone from pore structure characterization. Marine and Petroleum Geology 135, 105382. doi:10.1016/j.marpetgeo.2021.105382
Ross, D. J., and Bustin, R. M. (2009). The importance of shale composition and pore structure upon gas storage potential of shale gas reservoirs. Mar. Petroleum Geol. 26 (6), 916–927. doi:10.1016/j.marpetgeo.2008.06.004
Sangnimnuan, A., Li, J., and Wu, K. (2018). Development of efficiently coupled fluid-flow/geomechanics model to predict stress evolution in unconventional reservoirs with complex-fracture geometry. SPE J. 23 (03), 640–660. doi:10.2118/189452-pa
Song, Y., Wang, Z., Wang, W., Yu, P., Chen, G., Lin, J., et al. (2023). Coupled thermal-hydraulic-mechanical modeling of near-well stress evolution in naturally fractured formations during drilling. Processes 11 (6), 1744. doi:10.3390/pr11061744
Wang, Y., Agostini, F., Skoczylas, F., Jeannin, L., and Portier, É. (2016). Experimental study of the gas permeability and bulk modulus of tight sandstone and changes in its pore structure. International Journal of Rock Mechanics and Mining Sciences 91, 203–209. doi:10.1016/j.ijrmms.2016.11.022
Wang, L., Li, Y., Xu, D., Gao, Y., Zhang, J., He, J., et al. (2022a). Evolution of near-well damage caused by fluid injection through perforations in wellbores in low-permeability reservoirs: a case study in a shale oil reservoir. Lithosphere 2022 (Special 12), 3824011. doi:10.2113/2022/3824011
Wang, Z., Guo, X., Zheng, G., Yu, P., Wang, W., Jin, Y., et al. (2022b). Effects of parent well spacing on the poroelastic behaviors in the infill zone in shale oil reservoirs: a case study in Jimsar Shale Oil, China. Energy Sci. Eng. 10 (4), 1043–1054. doi:10.1002/ese3.1059
Warren, J. E., and Root, P. J. (1963). The behavior of naturally fractured reservoirs. Soc. Petroleum Eng. J. 3 (03), 245–255. doi:10.2118/426-pa
Yao, C., Park, J., Chen, H., Datta-Gupta, A., Hennings, P., and Dommisse, R. (2023). “High Resolution Modeling of Pore Pressure Change, Fault Slip Potential and Induced Seismicity in the Fort Worth Basin. In SPE Western Regional Meeting (p. D021S002R002). SPE. doi:10.2118/212951-MS
Yin, S., Dong, L., Yang, X., and Wang, R. (2020). Experimental investigation of the petrophysical properties, minerals, elements and pore structures in tight sandstones. Journal of Natural Gas Science and Engineering 76, 103189. doi:10.1016/j.jngse.2020.103189
Yuan, W., Pan, Z., Li, X., Yang, Y., Zhao, C., Connell, L. D., and He, J. (2014). Experimental study and modelling of methane adsorption and diffusion in shale. Fuel 117, 509–519. doi:10.1016/j.fuel.2013.09.046
Zhai, Z., Wang, X., Jin, X., Sun, L., Li, J., and Cao, D. (2014). Adsorption and diffusion of shale gas reservoirs in modeled clay minerals at different geological depths. Energy & Fuels 28 (12), 7467–7473. doi:10.1021/ef5023434
Zhang, T., Xu, H., Zhang, Y., Jiang, Y., and Li, Y. (2019). Propagation behavior of hydraulic fracture across the coal-rock interface under different interfacial friction coefficients and a new prediction model. J. Nat. Gas Sci. Eng. 68, 102894. doi:10.1016/j.jngse.2019.05.007
Zheng, Y., He, R., Huang, L., Bai, Y., Wang, C., Chen, W., et al. (2022). Exploring the effect of engineering parameters on the penetration of hydraulic fractures through bedding planes in different propagation regimes. Comput. Geotechnics 146, 104736. doi:10.1016/j.compgeo.2022.104736
Zhi, D., Guo, X., Wang, W., Jin, Y., Liu, C., Chen, G., et al. (2021). Fracturing and production analysis of the efficacy of hydraulic fracture stage reduction in the improvement of cost-effectiveness in shale oil development: a case study of Jimsar shale oil, China. Energy Sci. Eng. 9 (9), 1337–1348. doi:10.1002/ese3.940
Zhou, T., Xiong, W., Zong, Z., and Chen, Z. (2013). Experimental study of mechanical properties of bedded salt rock under uniaxial compression. Rock Mech. Rock Eng. 46 (4), 777–787.
Zhou, X., Wei, J., Zhao, J., Li, X., Zhang, X., Fu, X., and Shamil, S. (2024). Study on pore structure and permeability sensitivity of tight oil reservoirs. Energy 288, 129632. doi:10.1016/j.energy.2023.129632
Zhong, X., Zhu, Y., Liu, L., Yang, H., Li, Y., Xie, Y., and Liu, L. (2020). The characteristics and influencing factors of permeability stress sensitivity of tight sandstone reservoirs. Journal of Petroleum Science and Engineering 191, 107221. doi:10.1016/j.petrol.2020.107221
Keywords: tight rock, experimental study, numerical study, field study, deformation
Citation: Qi H, Li D, Zhao J, Ma H, Wang X, Wang X, Zhu B, Lin J and Zhao X (2024) The experimental and numerical analysis of elastic rock mechanical properties in tight conglomerate rock samples: a case study in Junggar Basin. Front. Energy Res. 11:1330550. doi: 10.3389/fenrg.2023.1330550
Received: 31 October 2023; Accepted: 20 December 2023;
Published: 23 January 2024.
Edited by:
Liuke Huang, Southwest Petroleum University, ChinaReviewed by:
You Zhang, PetroChina Hangzhou Research Institute of Geology, ChinaJiawei Li, Schlumberger, United States
Song Hong-Wei, Yangtze University, China
Copyright © 2024 Qi, Li, Zhao, Ma, Wang, Wang, Zhu, Lin and Zhao. This is an open-access article distributed under the terms of the Creative Commons Attribution License (CC BY). The use, distribution or reproduction in other forums is permitted, provided the original author(s) and the copyright owner(s) are credited and that the original publication in this journal is cited, in accordance with accepted academic practice. No use, distribution or reproduction is permitted which does not comply with these terms.
*Correspondence: Bolong Zhu, emJsb25nMTEwOUAxNjMuY29t