 Wang Lei1*
 Zhou Junping
 Xu Yuling
- 1College of Electrical Engineering, Shanghai University of Electric Power, Shanghai, China
- 2Jiaxing Power Supply Company of State Grid Zhejiang Electric Power Co., Ltd., Zhejiang, China
Under the background of the shortage of traditional energy and the increasingly serious environmental problems, this paper proposes a bi-level optimization configuration method for microgrids based on stepped carbon trading and price-based demand response. The stepped carbon trading mechanism is introduced into the planning model to clarify the impact of construction processes on land carbon emissions. Simultaneously, price-based demand response during system operation is introduced, guiding users to change the electricity consumption strategies to promote the consumption of renewable energy. Then, a bi-level optimal configuration framework is constructed. The upper level is optimized to allocate the capacity of the microgrid, with the lowest annual equivalent comprehensive cost as the objective function. The lower level is optimized for microgrid operation, with the minimum sum of the microgrid operation cost and carbon emission cost as the objective function. In view of the advantages of enhanced whale optimization algorithm (E-WOA) in solving multi-dimensional feature selection problems, E-WOA and CPLEX solver are combined to solve the bi-level optimization model for the first time. Simulation results show that after introducing a stepped carbon trading mechanism, the system carbon emissions decreased by 23.09%. Considering price-based demand response under the premise of introducing a stepped carbon trading mechanism, the total cost decreased by 3.57% and the carbon emissions decreased by 19.83%.
1 Introduction
Under the backdrop of traditional energy shortages and increasingly serious environmental problems, the development of renewable energy is one of the main objectives to achieve sustainable energy development (Zhang and Kang, 2022; Dorahaki et al., 2023). The microgrid (MG) has become a key research object for energy cleanliness due to its characteristics of improving the utilization rate of renewable energy and the reliability of power supply. Optimizing MG configuration is the core issue in the planning and design of an MG. Considering investment costs while reducing carbon emissions in the optimization of MG configuration is in line with the current development trend.
Due to the power interaction between the MG and main net, the MG produces a large amount of carbon emissions (Kang et al., 2015). To effectively reduce MG carbon emissions and minimize the operation cost of the system, the carbon emission quota trading mode is introduced into the MG optimal dispatching process to guide MG low-carbon operation, and it has been an effective means to reduce carbon emissions (Fan et al., 2021). The application of the carbon trading mechanism has been widely discussed in the literature. Wang et al. (2020) proposed a low-carbon optimization scheduling strategy for integrated energy systems (IES) based on the carbon trading mechanism, achieving low-carbon operation of the integrated energy system. Tan et al. (2019) constructed an optimization model for a wind power joint scheduling system under a carbon trading mechanism. Zhang et al. (2019) introduced a carbon trading mechanism into traditional power systems, which improves the installed capacity of renewable energy and the overall benefits of the system. In the aspect of the carbon trading price model, most existing studies adopt the fixed carbon trading price or the stepped carbon trading price to limit the carbon emissions of the system (Chen et al., 2022). The fixed carbon trading price means the same carbon price in the entire carbon emission interval. Cheng et al. (2020) and He et al. (2020) found that the use of a fixed carbon trading mechanism can reduce the output of high-intensity carbon-emitting units to a certain extent, but when the carbon emissions reach a certain level, it cannot further incentivize the system to further reduce carbon emissions. In order to further reduce carbon emissions, a stepped carbon trading price mechanism is proposed. The carbon trading price in the stepped carbon trading system increases gradually with the level of carbon emissions. When the carbon emissions exceed the limit, the carbon price will increase punishingly. Li et al. (2022) proposed a reward and punishment stepped carbon trading model and analyzed its limitations on carbon emissions, verifying the effectiveness of the proposed model in balancing the system low-carbon and economic efficiency. Jin et al. (2023) established a low-carbon economic dispatch model based on stepped carbon trading to achieve economic and low-carbon development in industrial parks. Xiaohui et al. (2019) considered an improved hierarchical reward and punishment carbon trading model and proposed a multi-agent scheduling optimization method. Chen et al. (2021) constructed an IES optimal scheduling model considering the ladder-type carbon trading mechanism and the flexible dual response of supply and demand. Liu et al. (2022) proposed a configuration method for low-carbon equipment in IES considering life-cycle carbon emissions and ladder-type carbon trading costs. Compared to the traditional carbon trading mechanism, tiered carbon trading has better emission reduction capabilities. It can incentivize users participating in carbon trading to reduce carbon emissions by increasing carbon trading prices. The above literature works mainly focused on the application of the carbon trading mechanism in the optimization of IES and the operation of MG. Its application in MG optimization configuration is relatively limited, and there are shortcomings such as incomplete consideration of carbon emission sources. In the process of MG planning, the carbon absorption rate of the original land will be reduced, and industrial activities will generate certain carbon emissions. Therefore, considering changes in land types during the construction of MG provides a new way to reduce carbon emissions.
The high penetration rate of distributed generation (DG) will have a significant impact on the stability of the distribution network, and relying solely on DG generation to maintain system power balance will lead to poor economics. Therefore, rational planning for important distributed energy resources such as energy storage equipment and demand-side response loads will greatly improve the stability and economics of the distribution network (Le et al., 2022). At present, demand response is mainly divided into the following two types: one is to sign an interruptible agreement with users to reduce or interrupt power consumption during peak load periods to obtain relevant compensation. However, this scheme is mainly aimed at large industrial users with high power consumption flexibility and is not applicable to residential users (Li et al., 2023). The other is based on the elasticity matrix of electricity price, which affects users’ electricity consumption behavior through the dynamic change of electricity price and realizes “peak shaving and valley filling” through transfer, while the total load remains unchanged. Price-based DR programs can eventually determine the actual energy prices such that energy users can be encouraged to change their consumption patterns and shift demand from peak hours to off-peak hours (Dou et al., 2020). Sobhan et al. (2020) proposed a power outage management system that considers the emergency demand response program and provides the cost of load shedding in a time of emergency. Experiments show that emergency demand response can effectively reduce the cost of power failure and increase the service load. To reduce the gap between supply and demand, Boqtob et al. (2023a) proposed an incentive-based load-transfer demand response. Zheng et al. (2022) and Boqtob et al. (2023b) used incentive demand response to encourage consumers to change their energy consumption behavior so as to reduce their power consumption and maintain system reliability during peak periods. Pal et al. (2017) proposed a demand response framework to build an economic and appropriate approach to meet the residential user demand in the smart grid structure. The simulation results demonstrate that the economic benefits reaped by the customers are highly motivational to execute such an approach in practical scenarios. To reduce the operating costs of MG, Ali et al. (2023) proposed a new method that considers demand response to minimize the operating cost in MGs integrated with renewable sources and energy storage systems. For residential loads, cutting off the interruptible load during peak hours can improve the stability of the system, but it can reduce the comfort of users. In addition, the transfer of load in a certain period will affect the load demand in other periods. Thus, the goal of reducing the cost of electricity can be achieved through dynamic changes in electricity prices affecting the user’s electricity consumption behavior, taking into account the comfort of urban residents in the load transfer process.
Through the analysis of Table 1, it is found that the carbon trading mechanism and demand response are rarely considered at the same time in the configuration of MG, and carbon emission sources are not fully considered in the construction of MG. When considering the coupling between the carbon trading mechanism and demand response, it is also necessary to consider the impact of both on users’ electricity consumption and carbon emissions. Therefore, it is a new research idea to introduce price-based demand response under the premise of stepped carbon trading in the optimal configuration of MGs and study the impact of flexible load transfer on user-side demand changes, carbon emissions, and DG capacity.
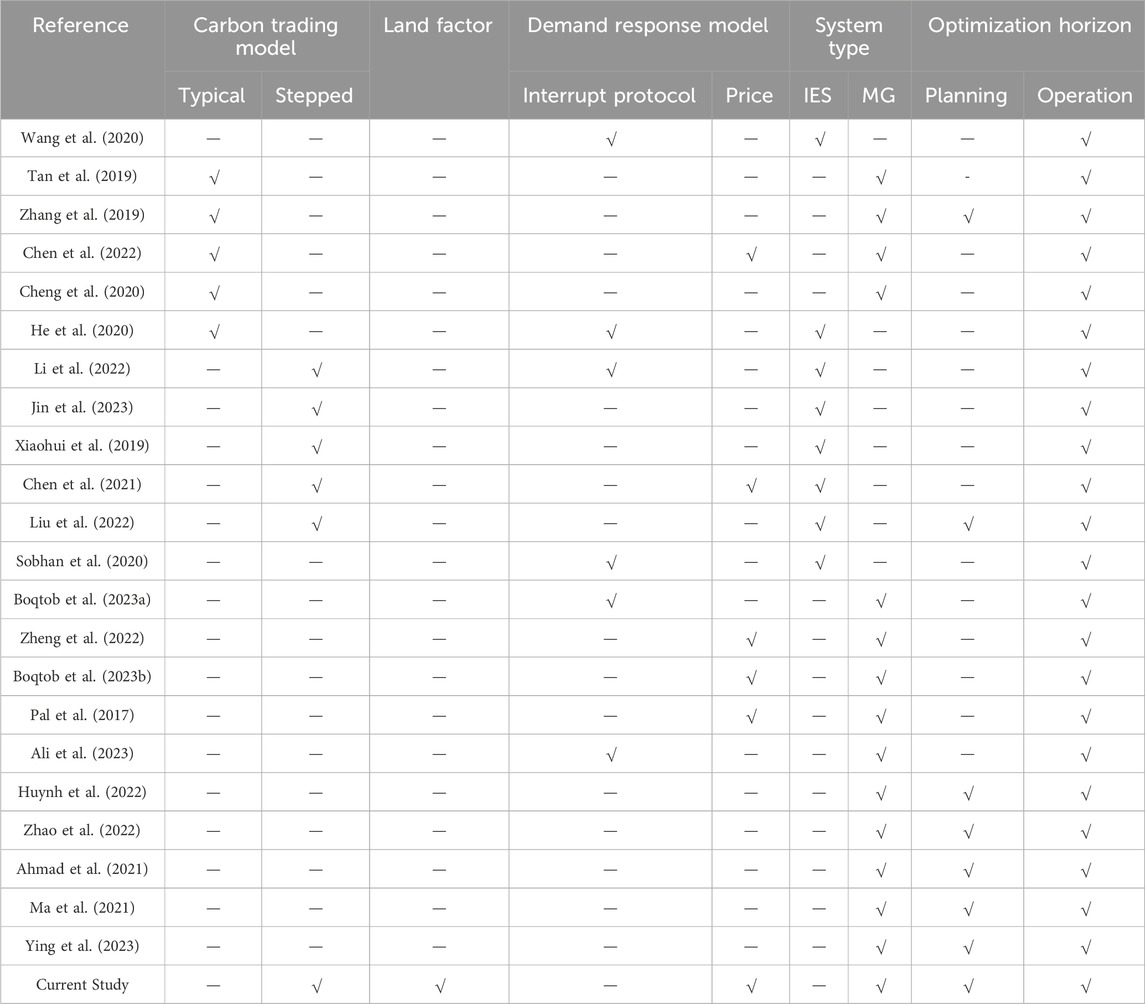
TABLE 1. Comparison of research content in different literature works.
The optimal configuration of MG needs to comprehensively consider energy sources, energy storage, load demand, and other factors and select the optimal configuration scheme under different conditions, so it belongs to a multi-dimensional feature selection problem. For the optimal configuration of MG, it is necessary to select the appropriate type and capacity of DG according to the load demand and consider the minimum operation cost of the MG. As for the solution of optimal configuration of MG, Huynh et al. (2022) used the improved artificial bee colony (IABC) algorithm to solve the problem with the lowest energy cost as the objective function and proved that the IABC algorithm is superior to the ABC algorithm in convergence value and speed. Zhao et al. (2022) proposed an improved gray wolf optimization (IGWO) algorithm to determine the optimal combination of WT-PV-BS-DE island MG. Ahmad et al. (2021) proposed a hybrid algorithm (BAPSO) based on the advantages of particle swarm optimization (PSO) and bat algorithm (BA) and applied it to the capacity configuration optimization of MG. However, when there are multiple types of new energy in the MG, the single-level solution in the optimization configuration is not practical and can easily fall into local optimization. Hence, a bi-level optimization model can be constructed to divide the planning and operation of MG into the upper and lower levels to reduce the difficulty of the solution. Ma et al. (2021) proposed a bi-level optimization configuration method for island MG that considers the impact of energy storage life and used the genetic algorithm (GA) to solve the model. However, the bi-level model is solved by a single algorithm, which will reduce the solving efficiency. Ying et al. (2023) constructed a bi-level optimization model and integrated the artificial fish school algorithm (AFSA) and CPLEX solver to solve the bi-level optimization model. The optimization objective of the upper level is mainly to obtain the optimal configuration capacity. Due to the fact that the upper-level optimization is a nonlinear optimization problem, the AFSA is used to solve it. The lower-level optimization is a mixed integer linear programming problem, so the CPLEX solver is used to solve it. Sobhan et al. (2023) constructed a bi-level optimization model to coordinate the interaction between downstream multi-energy systems and upstream multi-carrier network operator (MCNO) and converted the bi-level optimization into a single-level through strong duality. However, when the bi-level optimization is converted into a single level, there is a risk of increasing computational complexity and difficulty in solving. Therefore, the solution of the bi-level model becomes the key to the optimization configuration problem of MG. The solution for the bi-level model can be solved by combining two algorithms according to the different types of problems in the upper and lower layers to reduce the difficulty of solving. Mohammad et al. (2023) proposed the enhanced whale optimization algorithm (E-WOA) for multi-dimensional feature selection and proved that E-WOA has better convergence speed and accuracy than other well-known optimization algorithms and WOA variants through experiments. Given the advantages of the E-WOA in the selection of multi-dimensional feature selection, this is the first study to combine E-WOA and CPLEX solver to solve the bi-level optimization model.
Based on the above analysis, this paper proposes a bi-level capacity allocation method that considers stepped carbon trading and price-based demand response and combines E-WOA and CPLEX solver to solve the model. Finally, the feasibility of this method is verified through the use of measured data scenarios. The main contributions of this paper are as follows:
1. In order to reduce the carbon emissions of the MG system, this paper introduces the stepped carbon trading mechanism. Considering that the construction process of MG will reduce the original carbon absorption rate of land and the carbon emissions generated by construction activities, the influence of the land factor on the configuration capacity of MG is analyzed.
2. Under the premise of introducing the carbon trading mechanism, the price-based demand response is introduced to further analyze the impact of the coupling between the two on the total cost and total carbon emissions.
3. E-WOA and CPLEX solver are combined to solve the bi-level optimal configuration model for the first time. Through the comparison of different algorithms, the superiority of the proposed algorithm is verified.
2 Microgrid structures and carbon trading models
2.1 Microgrid structures
The structure of hydrogen-containing energy storage MG is shown in Figure 1, which is mainly composed of the wind turbine (WT), photovoltaic (PV) array, diesel generator (DE), hydrogen energy storage system, and user load and related power electronic conversion equipment. The hydrogen energy storage system mainly consists of electrolytic cells, hydrogen storage tanks, and fuel cells. WT, PV, and DE can serve as distributed power sources to provide power to users. When the output power of wind and solar power exceeds the load demand, the surplus electricity is consumed by the electrolysis tank, and hydrogen is produced by the electrolysis of water, which is stored in the hydrogen storage tank, improving the consumption level of renewable energy. When the output power of wind and solar power is less than the load demand, the fuel cell uses hydrogen and oxygen as raw materials to undergo a chemical reaction to produce electricity to meet the load demand, improving the reliability of the system. MG can also switch between main net parallel and off-grid modes through circuit breakers. In the grid-connected mode, the MG sells or purchases electricity from the main net, thereby reducing the rate of wind and solar curtailment. In addition, when the main net malfunctions or experiences a power outage, the MG can disconnect from the main net and provide power on its own, improving the reliability and stability of electrical equipment.
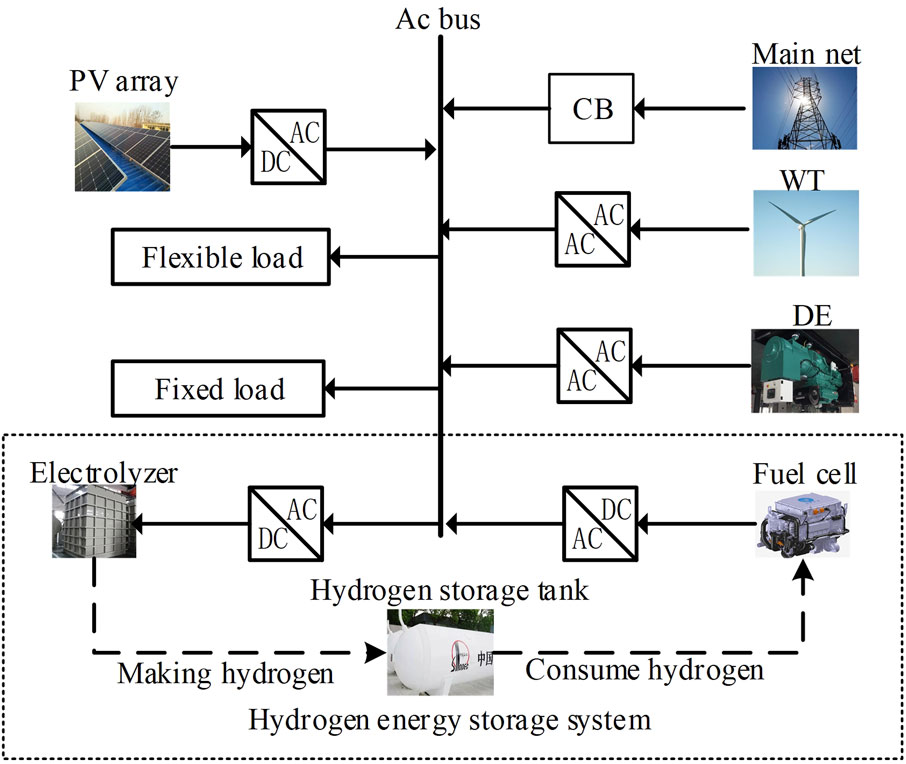
FIGURE 1. MG structure diagram.
Regarding the modeling of the main equipment in the MG studied in this paper, the mathematical models of WT, PV, and DE were derived from Zhao et al. (2022). The mathematical models of hydrogen energy storage devices were derived from Wang Jinshi et al. (2022).
2.2 Carbon trading mechanism
Carbon trading is an effective means for the market mechanism to deal with climate change. The government controls the total amount of carbon emission quotas, so that enterprises participating in the market are constrained by carbon emission quotas, and achieves the goal of emission reduction through trading carbon emission quotas (Qi et al., 2021; Wang P. et al., 2022).
2.2.1 Carbon trading model
In the construction of MG, wind and solar energy can promote the development of a local low-carbon economy, but the construction of PV and WT has changed the original form of land and affected the ability of the land itself to absorb CO2. Hence, in addition to the carbon emissions resulting from the acquisition of electricity from the upper main network and DE power generation, it is imperative to take into account the impact of landform change when assessing the sources of carbon emissions within the system. In this paper, when considering the power purchase of the upper main network, the default power generation is coal-fired units. Land changes can cause carbon emissions in two ways. One type is called direct land-use carbon emissions, which are caused by changes in how land is used. The other type is called indirect land-use carbon emissions. The other is carbon emissions from construction land generated by industrial activities (Huang et al., 2023). The actual total carbon emissions of the system can be obtained through Eq. 1.
where
where

TABLE 2. Carbon absorption rate of all types of land use.
Carbon quota allocation includes free allocation, auction allocation, and free allocation and auction mixed allocation, and at this stage, China mainly allocates carbon quotas for free. The carbon emissions of participating in carbon trading in this paper are the difference between actual carbon emissions and free carbon emission quotas, which are shown in the following equation for calculating the actual carbon emissions and free carbon emission quotas of the system.
(1) Free carbon emission model:
where
(2) Actual carbon emission model:
where
2.2.2 Stepped carbon trading
Compared with traditional carbon trading, stepped carbon trading is divided into different grades according to carbon emissions, and the price of carbon trading increases with the rise in the grade; the higher the carbon emission amount, the higher the carbon trading cost. The stepped carbon trading costing model is shown in the following equation:
where
3 Demand response model
Demand response improves energy utilization and reduces energy waste by adjusting the timing and amount of energy demand. In this paper, the price-based demand response is adopted to guide the transfer of user load through changes in electricity prices and promote the consumption of renewable energy.
3.1 Dynamic time-of-use tariffs
First, the load demand is divided into peak, valley, and flat periods, and different electricity prices are implemented for different periods. Then, the interactive price of the main network is adjusted on the basis of the basic electricity price. After the electricity price adjustment, the electricity price of each period will fluctuate on the original basis. The adjusted electricity price can be obtained from Eqs 7–9.
where
The correlation between changes in consumer demand and changes in electricity prices can be reflected by the electricity price elasticity indicator (Zhang et al., 2018), which is expressed as follows:
where
Changing electricity prices will have an impact on electricity demand in this and other periods, so the price elasticity index is divided into self-elasticity and cross-elasticity. In the time-of-use price model, the user load is divided into peak, valley, and flat hours; then, the demand price elasticity matrix K of the electricity price is expressed as follows:
where
From Eqs 10, 11, after the implementation of dynamic time-of-use electricity prices, the change in peak, flat, and valley load demand during peak and valley hours is expressed as:
According to the transformation of Eq. 10, the column vector after the change in load demand is obtained as Eq. 13.
3.2 Objective function
After the introduction of demand response, the dynamic electricity price is used to guide users to change the electricity consumption strategy. The demand response optimization goal used in this paper is to minimize the net load fluctuation during the scheduling cycle, as shown in Eq. 14.
where
3.3 Constraints
After the introduction of demand response, in order to ensure that the total load remains unchanged during the scheduling week, the load transfer should be carried out in the same scheduling cycle, as shown in Eq. 15.
After the implementation of demand response, in order to ensure the reduction of net load fluctuation and ensure the comfort of users, the constraints of electricity comfort are established in Eqs 16 and 17. User comfort is reflected in the ratio of the load transferred by the user to the initial load; the higher the ratio, the higher the comfort, and conversely, the lower the comfort.
where
The amount of load transfer when implementing demand response should not exceed the maximum flexible load.
where
4 Bi-level optimization configuration model and solution algorithm
In order to integrate the planning and operation of the MG, a bi-level optimal configuration model is constructed in this paper. The upper level is the MG capacity optimization, and the optimization goal is to take the lowest annual equivalent comprehensive cost as the optimization goal. The lower level is the optimization of the microgrid operation, and the goal is to minimize the sum of the MG operation cost and carbon emission cost. The upper level obtains the initialized configuration and load information through demand response to obtain the corresponding load and transmits the configuration and load information to the lower level. The lower level optimizes the operation based on the existing configuration capacity of the upper level and transmits the result of the minimum operating cost to the upper level. The upper level solves the objective function based on the optimal operating strategy transmitted by the lower level, and the upper and lower levels iterate sequentially to obtain the optimal configuration result by combining planning and operation.
4.1 Upper optimization model
The upper-level decision variables are the WT, PV, DE, electrolyzer, fuel cell, and hydrogen storage tank capacity.
4.1.1 Objective function
The upper-level optimization model takes the lowest annual equivalent cost as the objective function, and its calculation formula is shown in Eq. 19.
where
The annual average initial investment cost of the system is shown in Eq. 20.
where
The annual average operating and maintenance cost of the system is shown in Eq. 21.
where
4.1.2 Upper-level model constraints
The number of distributed power sources in the upper-level model is influenced by energy demand, economic factors, and geographical factors, and the constraints are given in Eq. 22.
where
4.2 Lower optimization model
The lower-level optimization formulates reasonable operating strategies based on the number of power sources transmitted from the upper level to calculate operating costs. The lower-level decision variables are the output of each power source and the interaction power of the main network.
4.2.1 Lower objective function
The lower-level optimization objective function is the sum of the annual operating and carbon transaction costs. The calculation method is shown in Eqs 23, 24.
where
4.2.2 Lower-level model constraints
During the operation of the MG, it is necessary to consider compliance with the system’s electricity supply demand balance and the limitations of the power output of the various power sources.
(1) Power balance constraints
During the operation of the system, the output of each power source of the MG should satisfy the following constraints in Eq. 25.
(2) PV, WT, DE output constraints, and DE climbing satisfy the following constraints in Eq. 26.
where
(3) Main network interactive power constraints
The MG will trade with the main network when the power is unbalanced, but the excessive power of the main network interaction will affect the stable operation of the main network. Therefore, the interaction power of the main network should meet the constraint of Eq. 27.
(4) Hydrogen energy storage constraints
where
4.3 Model solving
In this paper, the lower-level model is the operation optimization problem, and the decision variable is the output of each power supply. Since the lower level solves a multi-constrained linear problem, the CPLEX solver is used to solve it. The upper-level model is capacity optimization, and the decision variable is the capacity of DG and hydrogen energy storage-related equipment. The upper layer selects the optimal capacity configuration based on the operating cost transmitted by the lower layer, while considering factors such as energy type, equipment capacity, and load demand, and selects these characteristics to find the best MG configuration scheme. In view of the superiority of the augmented whale algorithm in the multi-dimensional feature selection problem, the upper level uses E-WOA to solve the problem.
4.3.1 Enhanced whale optimization algorithm
Mohammad et al. (2023) proposed an enhanced whale optimization algorithm based on the low population diversity and poor search strategy of the standard whale algorithm, which uses a pooling mechanism and three effective search strategies, namely, migration, prioritization, and dense circumference of prey.
Pooling mechanism: Given the matrix
where
Migrating search strategy: This search strategy randomly separates a portion of the humpback whale population to cover unvisited regions and improve the exploration.
where Rand is a random position in the range of search space, where rand is a uniformly distributed random number between 0 and 1;
Preferential selecting search strategy: The preferential selecting strategy boosts the exploration ability of the search for prey method in the canonical WOA. Since the preferential selecting search strategy is proposed to improve the WOA exploration ability, it needs a large step size to discover a diverse assortment of solutions by spreading the whales within different regions of the search space. Therefore, this strategy uses the heavy-tailed Cauchy distribution through which the probability of producing larger values is very high.
where
Enriched encircling prey search strategy:
where
4.3.2 Model solution based on E-WOA
The optimal configuration problem of MG belongs to the multi-dimensional feature selection problem. Considering the advantages of E-WOA in the multi-dimensional feature selection problem, E-WOA and CPLEX solver are combined to solve it for the first time in this paper. The solution flowchart is shown in Figure 2.
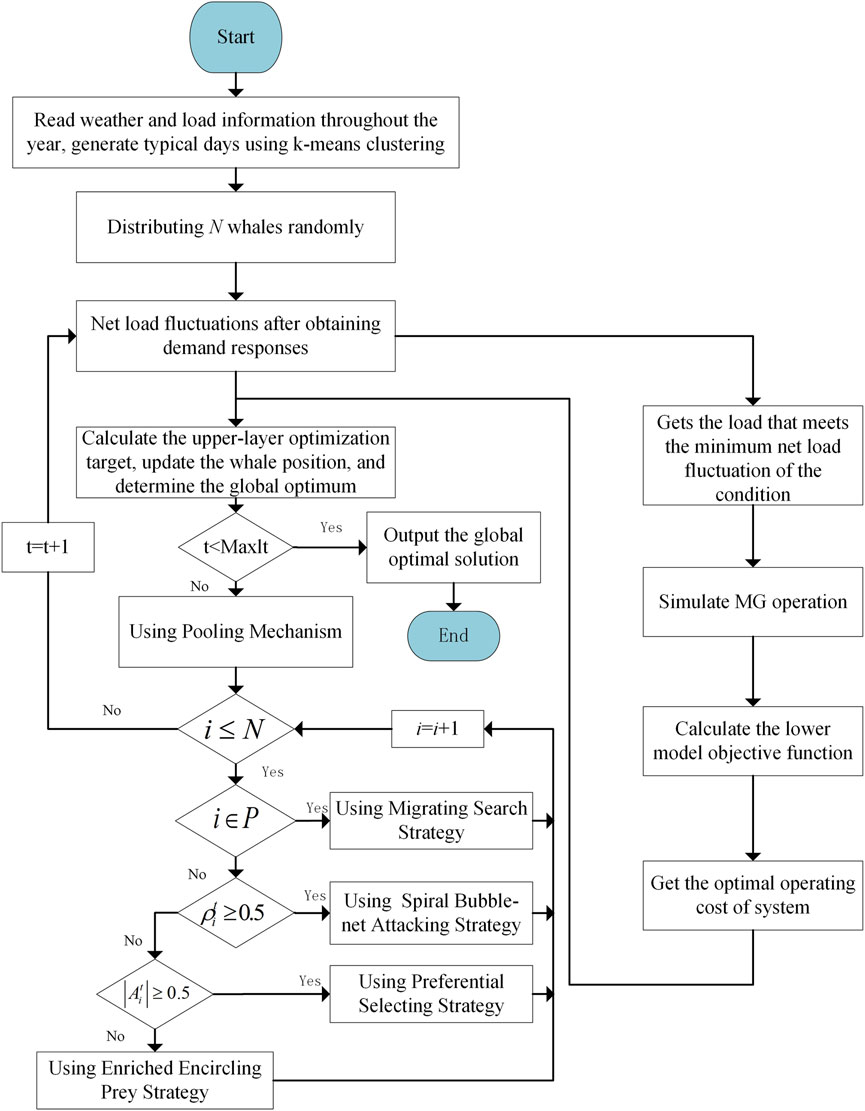
FIGURE 2. Flowchart of solving the bi-level optimization configuration model.
The steps involved in solving the bi-level optimization model are as follows:
(1) The annual meteorological data and load information are input, and the K-means clustering algorithm is used to generate typical daily operation scenarios in spring, summer, autumn, and winter.
(2) E-WOA is used to solve the upper model, and the initial population size N, the maximum number of iterations, and the upper and lower limits of decision variables are set.
(3) According to the upper-level transmits’ DG capacity, weather, and load information, the load after demand response is calculated and transmitted to the lower layer.
(4) The lower level simulates the operation of MG according to the load and capacity configuration information transmitted by the upper level and obtains the operation strategy with a minimum operation cost. Finally, the result is passed to the upper level.
(5) According to the data transmitted by the lower-level model, the upper-level model solves the annual equivalent cost, takes it as the fitness value of individual whales, and then updates the whale position. The updated individual whale is transferred to the lower-level optimization model again and solved. When the number of iterations reaches the maximum, the global optimal result is output.
5 Example analysis
5.1 Basic data
In recent years, with the improvement of living standards, the user load is increasing each year, and the power supply pressure of the main network is also increasing. At the same time, there is a risk of power failure in suburban and remote areas. In order to solve the above problems, this paper takes the MG in a suburb of China as an example to optimize its configuration, so as to achieve the purpose of energy self-sufficiency and clean energy in remote areas. The typical daylight intensity, wind speed, and load curve obtained by clustering are shown in Figure 3, and the system parameters of different equipment and electricity price information data are shown in Tables 3, 4, respectively. In terms of carbon trading price, the basic price of carbon trading is 8.19 $/t. The carbon emission of the MG generated by purchasing unit electricity from the main network is 0.92 kg/kWh, and the free carbon emission quota obtained is 0.781 kg/kWh. The carbon emission generated by DE per unit power generation is 0.649 kg/kWh, and the free carbon emission quota obtained is 0.5 kg/kWh. The user participation in demand response load transfer compensation is 0.06 $/kWh. Regarding the electrical elasticity matrix K, data from Chen et al. (2014) are used to reflect the response of load to electricity prices.
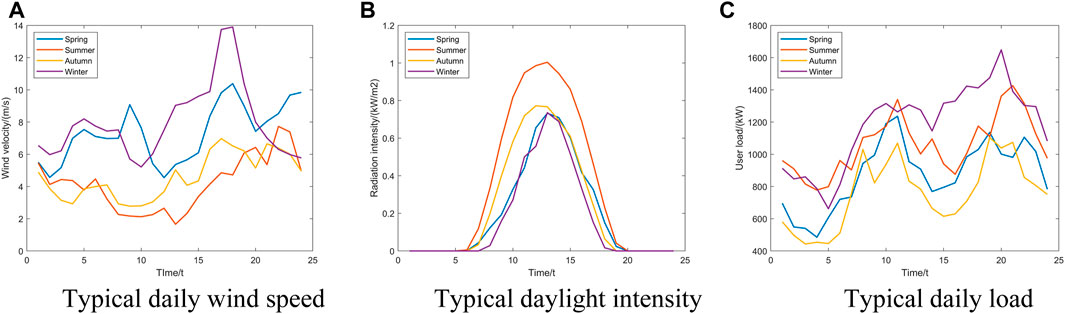
FIGURE 3. (A) Typical daily wind speed curve; (B) typical daylight intensity curve; and (C) typical daily load curve.
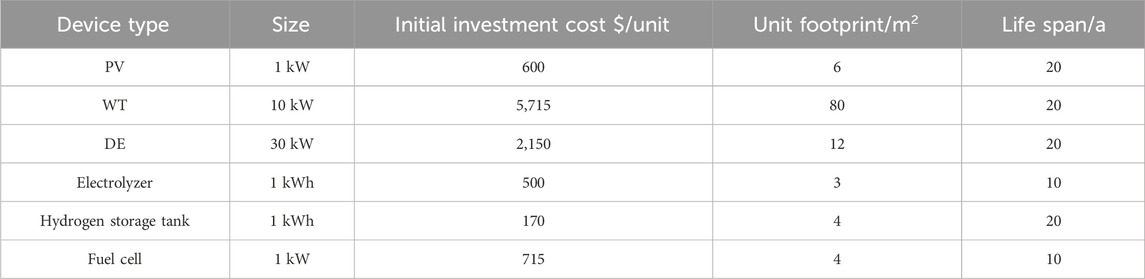
TABLE 3. System parameters of different devices.

TABLE 4. Main net interactive electricity prices.
5.2 Scheme comparison analysis
In this paper, the following six different options are compared to verify the effectiveness of the proposed bi-level optimization method considering carbon trading mechanism and price-based demand response:
Option 1 considers the traditional carbon trading without considering land factors and demand response.
Option 2 considers the stepped carbon trading without considering land factors and demand response.
Option 3 considers the stepped carbon trading and land factors without considering demand response.
Option 4 considers the traditional carbon trading and demand response without considering land factors.
Option 5 considers the stepped carbon trading and demand response without considering land factors.
Option 6 considers the stepped carbon trading, land factors, and demand response;
Table 5 shows the capacity configuration results of MG under the six options.

TABLE 5. Capacity configuration results of the six options.
5.2.1 The impact of carbon trading methods on configurations
By comparing Schemes 1 and 2 in Tables 5, 6, it can be observed that Option 2 increases the WT and PV capacities by 110 kW and 235 kW, respectively, while reducing the capacity of DE by 360 kW. In the hydrogen energy system, the capacities of the electrolytic cell and hydrogen storage tank increase by 48 kW and 1,015 kW, respectively. From Figure 4, it can be seen that Option 2 significantly reduces fuel costs and main net interaction costs compared to Option 1. In terms of total cost, Option 2 incurs an additional expenditure of 20,100 USD (4.60%) compared to Option 1. Regarding carbon emissions, Option 2 achieves a reduction of 272.3 tons (23.09%) compared to Option 1. Therefore, it can be concluded that the stepped carbon trading approach exhibits superior emission reduction capabilities compared to traditional carbon trading. The introduction of stepped carbon trading allows for an increase in the capacity of low-carbon emission units and a decrease in the capacity of high-carbon emission units, thereby reducing the overall carbon emissions of the system.
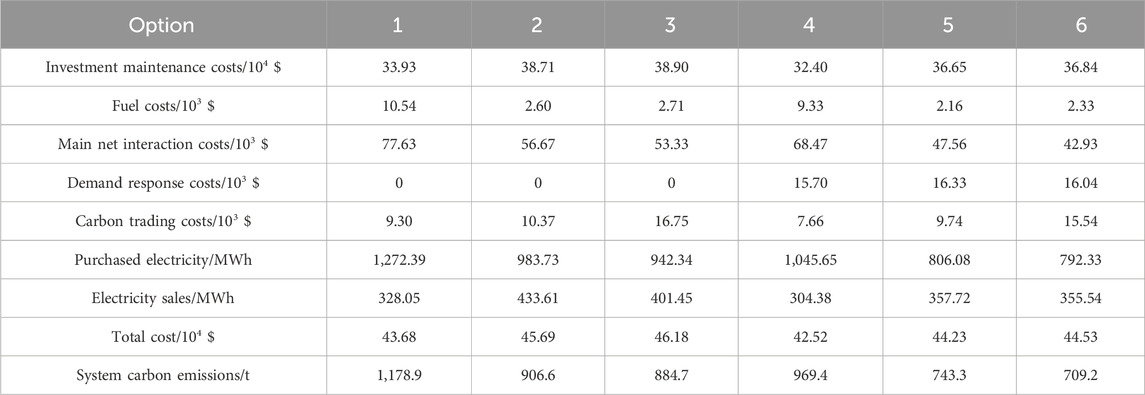
TABLE 6. Cost calculation results of six options.

FIGURE 4. Cost comparison of six options.
Under the premise of stepped carbon trading, the comparison of Options 2 and 3, as shown in Tables 5, 6 and Figure 5, reveals that the wind turbine capacity increases by 70 kW (5.56%), while the PV capacity decreases by 66 kW (4.52%) when incorporating the effects of land factors. The capacity of the hydrogen energy system remains relatively stable. After accounting for land factors, the proportion of wind power generation in the system increases by 6.05%, while the proportion of PV power generation decreases by 2.54%. Option 3 incurs an additional cost of 4,900 USD (1.07%) compared to Option 2, resulting in a reduction of 21.9 tons (2.41%) in the system’s total carbon emissions. Moreover, compared to Option 5, Option 6 increases the wind turbine capacity by 5.56% and the proportion of wind power generation by 6.87%. The PV capacity decreases by 4.51%, while the proportion of PV power generation decreases by 2.64%. Option 6 incurs an additional cost of 3,000 USD and reduces carbon emissions by 34.28 tons. The analysis indicates that considering the influence of land factors leads to a slight increase in total cost. However, it allows for the expansion of WT capacity with higher investment returns and the reduction in PV capacity with lower investment returns, resulting in further reductions in system carbon emissions while achieving carbon emission benefits that outweigh the economic losses.

FIGURE 5. Power generation under different options.
Hence, it can be concluded that stepped carbon trading has higher decarbonization capabilities compared to traditional carbon trading. It enables the increase in renewable energy unit capacities while reducing the capacities of high-carbon emission units, thus facilitating a shift toward a more renewable energy-oriented energy utilization system and reducing overall carbon emissions. The increase in wind and solar unit capacities may exacerbate curtailment issues. To enhance the utilization of renewable energy, the capacity of hydrogen energy storage will consequently increase. Considering changes in land characteristics allows for the optimal utilization of land resources by reducing the capacities of less efficient power generation units such as PV and increasing the capacities of more efficient units such as wind turbines. This approach effectively lowers the system’s carbon emissions while maximizing the utilization of land resources. Therefore, the rational utilization of the carbon trading mechanism can effectively increase the capacity of low-carbon emission and high-investment renewable energy units and reduce the usage of high-carbon emission and low-investment units, and considering land factors can further promote the utilization of land resources by increasing the usage of high-efficiency power generation units while reducing the usage of low-efficiency units.
5.2.2 The impact of demand response on configuration
With the introduction of demand response, the capacity of fuel cells, electrolytic cells, and hydrogen storage tanks in Option 4 decreased by 122 kW, 169 kWh, and 1,140 kWh, respectively, resulting in a reduction of 226.74 MWh in purchased electricity from the main net. Additionally, the interaction cost with the main net decreased by 9,160 USD, fuel cost decreased by 1,210 USD, and carbon emissions decreased by 209.5 tons. Although the cost of demand response increased by 15,700 USD, the total cost decreased by 11,600 USD. Thus, it can be concluded that demand response can improve the utilization of renewable energy, fully utilize energy storage devices, and reduce excess capacity, thereby lowering the investment and maintenance costs of microgrid systems. The increased utilization of renewable energy can effectively reduce the amount of electricity purchased from the main net and decrease the usage of diesel generators, further reducing the carbon emissions of the microgrid system.
Considering the case of stepped carbon trading, Options 5 and 2 both show an increase in the capacity of renewable energy units and energy storage devices. In Option 5, when demand response is introduced, the wind and solar capacities remain the same, while the capacity of hydrogen storage systems decreases, resulting in a reduction of 20,600 USD in investment and maintenance costs compared to Option 2. Option 5 also exhibits a decrease of 17.03% and 16.08% in fuel costs and interaction costs with the main net, respectively. Moreover, the purchased electricity from the main net decreases by 177.65 MWh, and the sold electricity decreases by 75.89 MWh. The total cost decreases by 14,600 USD, and carbon emissions decrease by 163.3 tons (18.01%). Option 6, when considering land factors, exhibits a reduced capacity of hydrogen storage devices and a decrease of 175.5 tons (19.83%) in carbon emissions compared to Option 3. Therefore, considering the impact of land factors can, to some extent, enhance emission reduction efforts and contribute to the decarbonization of the system. In addition, the reduction in energy storage capacity can mitigate the carbon emissions resulting from land use, thereby simultaneously improving economic viability and reducing carbon emissions.
Based on the above analysis, the introduction of demand response reduces the capacity of hydrogen storage devices, decreases electricity purchased from the main net and diesel-generated power, and consequently lowers the overall carbon emissions of the system. This not only improves the economic viability of the microgrid but also enhances its low-carbon benefits. Furthermore, reducing net negative fluctuations optimizes the storage of renewable energy in the microgrid and optimizes energy usage, resulting in decreased energy storage capacity, fuel costs, and total carbon emissions.
Considering the six configuration options in Figure 6, Option 4 exhibits the lowest total cost, amounting to 425,200 USD, from an economic perspective. Option 6 has the lowest carbon emissions, totaling 709.2 tons. Although Option 6 incurs an additional cost of 20,100 USD (4.73%) compared to Option 4, it reduces carbon emissions by 226.1 tons (26.84%). Taking into account both the economic and low-carbon aspects of the microgrid, Option 6 outperforms Option 4 with a 4.73% cost increase but a 26.84% reduction in carbon emissions. The carbon emission benefits outweigh the economic losses, making Option 6 the optimal configuration under the context of low-carbon development.
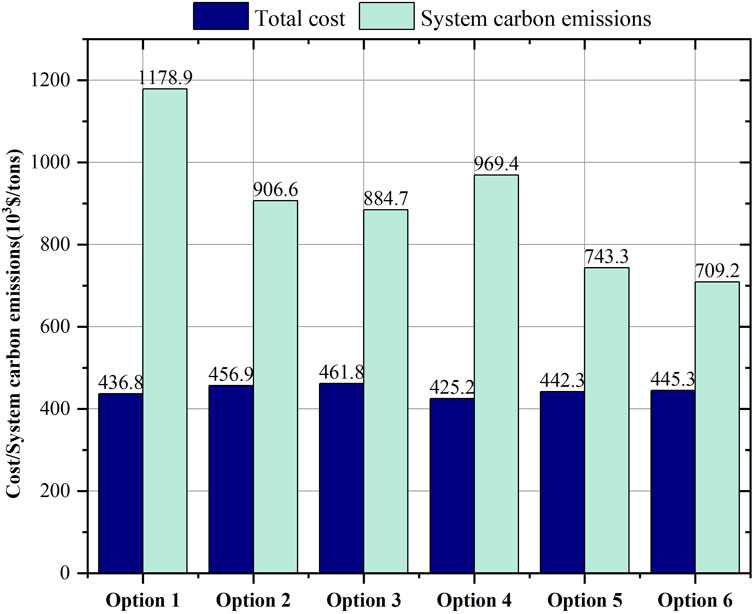
FIGURE 6. Total cost and carbon emissions under six options.
5.3 Demand response load analysis
Figure 7 shows the load and renewable energy generation curves before and after implementing Option 6 for demand response. Table 7 lists the typical daily electricity price fluctuations. Based on Figure 7, it can be observed that the introduction of demand response reduces net load fluctuations by transferring flexible loads.
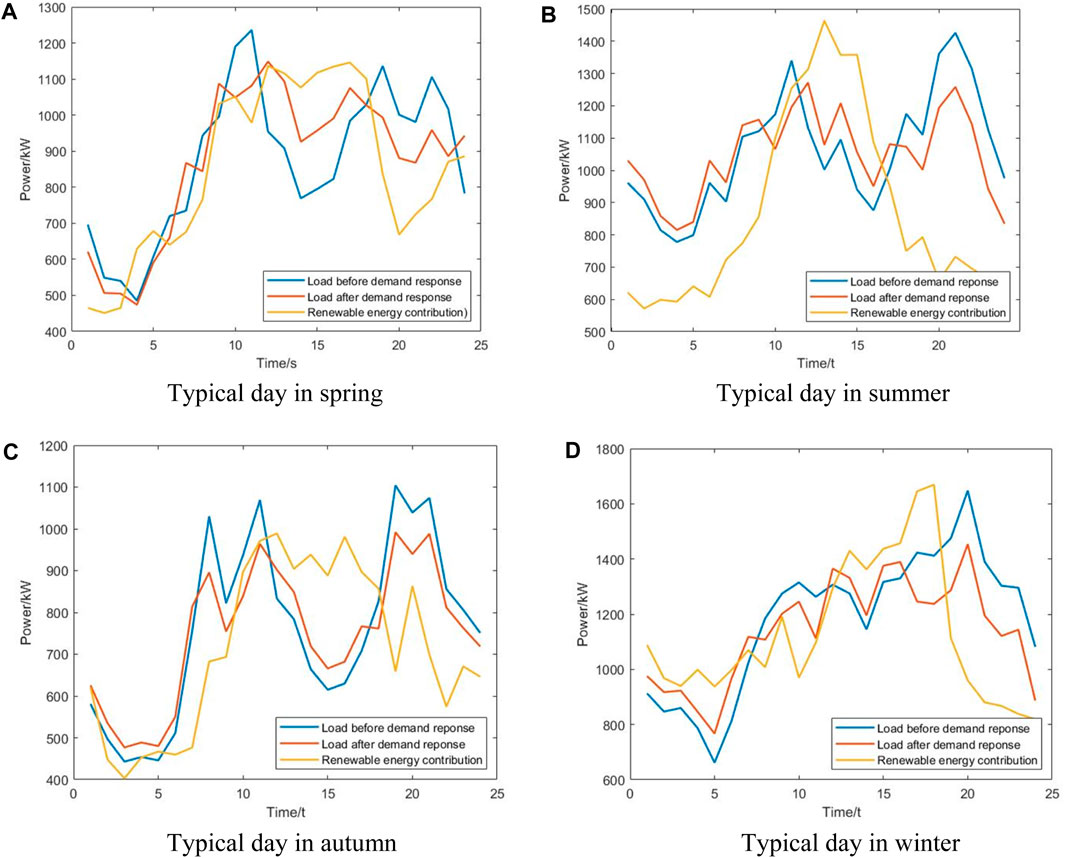
FIGURE 7. Demand response before and after load and renewable energy output. (A) Typical day in spring; (B) typical day in summer; (C) typical day in autumn; and (D) typical day in winter.
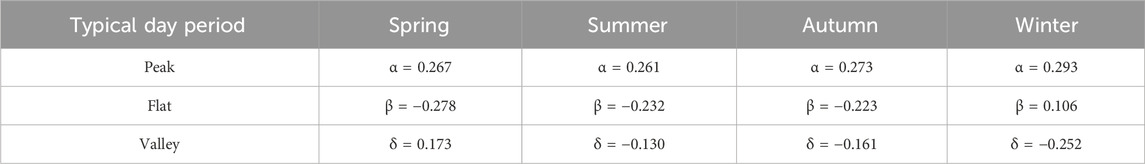
TABLE 7. Typical daily electricity price fluctuations.
In Figure 7, the post-response load curve tends to align with the renewable energy generation curve, resulting in reduced net load fluctuations. Taking a typical spring day as an example, due to the significant difference between peak and off-peak loads and the renewable energy generation from 11:00 to 22:00, the electricity demand during 11:00–17:00 is increased while the demand during 18:00–22:00 is decreased to mitigate net load fluctuations and achieve load shifting. In summer and autumn nights, an increase in net load fluctuations is observed. While ensuring user comfort, the peak period loads are shifted to the flat and off-peak periods. The lower electricity prices during these periods reduce the purchasing cost and alleviate the power supply pressure during peak hours, thereby improving the economic and operational stability of the microgrid system.
Regarding electricity price fluctuations, taking a typical summer day as an example and considering Table 6 and Figure 7, it can be observed that the peak period electricity price increases by 26.1%, resulting in a load reduction of 1,143.29 kWh. Meanwhile, the off-peak period electricity price decreases by 13.0%, leading to a load increase of 425.35 kWh. Before implementing demand response, the peak-to-off-peak load difference was 648.2 kW, with a net load fluctuation of 5.58 MW. After implementing demand response, the peak-to-off-peak load difference decreased to 442.7 kW, representing a reduction of 31.7%, and the net load fluctuation decreased to 3.32 MW, indicating a reduction of 40.5%. Therefore, it can be concluded that the introduction of price-based demand response effectively reduces the peak-to-off-peak load difference and net load fluctuations, optimizes the power supply mode, reduces operational costs, and improves the economic feasibility of the microgrid system.
5.4 Comparative analysis of algorithms
To validate the superiority of the E-WOA employed in this study for the dual-level optimization configuration problem in microgrids, a comparison was made with the improved whale optimization algorithm (IWOA) (Sun et al., 2022) and genetic algorithm (GA) (Zhao et al., 2022). The population size for all three algorithms was set to 60, and the iteration count was set to 100. Figure 8 depicts the convergence curves of the three algorithms based on Option 6.
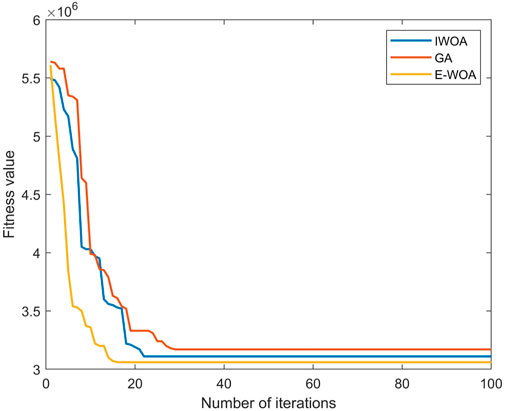
FIGURE 8. Convergence curves for different algorithms.
From the convergence curves in Figure 8, it can be observed that GA and IWOA only found local optima, while E-WOA demonstrated a superior performance in finding the global optimum. In terms of convergence speed, E-WOA attained the optimal solution after 18 iterations, which is faster compared to 23 iterations for IWOA and 29 iterations for GA. The E-WOA exhibited a faster convergence speed in the early iterations compared to other algorithms. Although IWOA enhanced population diversity through randomly selected individuals for crossover and mutation, its fixed mutation strategy may lead to local optima in multidimensional feature selection problems. Additionally, the single-prey searching strategy in IWOA has lower efficiency for prey searching after enhancing population diversity. In contrast, E-WOA increased population diversity through a pool mechanism and migration search strategy to expand the search space. It also employed a preferential selecting search strategy to enhance prey searching capability and introduced an enriched encircling prey strategy to enrich the algorithm’s local search capability, thereby reducing the probability of falling into local optima in the later iterations and improving the convergence speed and solution accuracy of the algorithm.
MG optimization configuration problems, as a form of multidimensional feature selection, require comprehensive consideration of factors such as energy sources, energy storage, and load demands. Compared to common intelligent algorithms, which often suffer from issues like local optima and poor convergence, E-WOA demonstrates superiority in solving microgrid optimization configuration problems and provides valuable insights for further research in this field.
6 Conclusion
Under the context of low-carbon development, this study proposes a bi-level optimization approach for the optimal configuration of MG, considering carbon trading and demand response. For the first time, E-WOA and CPLEX solver are combined to solve the optimization problem. Through a comparative analysis of different configuration scenarios, the following conclusions can be drawn:
(1) The MG optimization configuration model introduced in this study incorporates a stepped carbon trading mechanism and considers the influence of land factors. It effectively improves the capacity of low-carbon, high-efficiency units while reducing the capacity of high-carbon, low-efficiency units. Additionally, it optimally utilizes land resources, leading to a tendency for low-carbon and cost-effective energy utilization. Moreover, the carbon emission benefits obtained outweigh the economic losses.
(2) By considering stepped carbon trading and introducing price-based demand response in the microgrid optimization configuration, the capacity of hydrogen storage units can be effectively reduced. This approach also mitigates system net load fluctuations, increases the utilization of renewable energy, and reduces electricity purchases from the main net. As a result, it contributes to a significant reduction in carbon emissions while achieving a trade-off between system economics and low-carbon characteristics.
(3) This study uniquely combines E-WOA and CPLEX solver to solve the bi-level optimization model. A comparative analysis confirms the advantages of the improvement strategies adopted by E-WOA in terms of convergence speed and solution accuracy.
The carbon emission quota allocation method used in the carbon emission trading cost proposed in this paper is free allocation. In future research, it is possible to consider adding carbon emission rights that need to be purchased through auctions to explore the impact of different carbon emission rights allocation methods on the optimization configuration of MG.
Data availability statement
The raw data supporting the conclusion of this article will be made available by the authors without undue reservation.
Author contributions
WL: writing–original draft and writing–review and editing. ZJ: writing–review and editing. JW: investigation and writing–review and editing. XY: formal analysis and writing–review and editing.
Funding
The author(s) declare that financial support was received for the research, authorship, and/or publication of this article. This study was funded by the National Natural Science Foundation of China (61873159) and the Shanghai Green Energy Grid-Connected Engineering Technology Research Center (No. 13DZ2251900).
Conflict of interest
Author JW was employed by Jiaxing Power Supply Company of State Grid Zhejiang Electric Power Co., Ltd.
The remaining authors declare that the research was conducted in the absence of any commercial or financial relationships that could be construed as a potential conflict of interest.
Publisher’s note
All claims expressed in this article are solely those of the authors and do not necessarily represent those of their affiliated organizations, or those of the publisher, the editors, and the reviewers. Any product that may be evaluated in this article, or claim that may be made by its manufacturer, is not guaranteed or endorsed by the publisher.
Abbreviations
MG, microgrid; IES, integrated energy systems; IABC, improved artificial bee colony; IGWO, improved gray wolf optimization; PSO, particle swarm optimization; BA, bat algorithm; GA, genetic algorithm; AFSA, artificial fish school algorithm; E-WOA, enhanced whale optimization algorithm; WT, wind turbine; PV array, photovoltaic array; DE, diesel generator.
References
Ahmad, A., Rauf, H. T., Khan, M. A., Kadry, S., and Nam, Y. (2021). A hybrid algorithm (BAPSO) for capacity configuration optimization in a distributed solar PV based microgrid. Energy Rep. 7 (7), 7906–7912. doi:10.1016/j.egyr.2021.01.034
Ali, M., Abdulgalil, M. A., Habiballah, I., and Khalid, M. (2023). Optimal scheduling of isolated microgrids with hybrid renewables and energy storage systems considering demand response. IEEE Access 11 (11), 80266–80273. doi:10.1109/access.2023.3296540
Boqtob, O., El Moussaoui, H., El Markhi, H., and Lamhamdi, T. (2023a). Optimal energy management of microgrid based wind/PV/diesel with integration of incentive-based demand response program. Wind Eng. 47 (2), 266–282. doi:10.1177/0309524x221124335
Boqtob, O., El Moussaoui, H., El Markhi, H., and Lamhamdi, T. (2023b). Optimal energy management of microgrid based wind/PV/diesel with integration of incentive-based demand response program. Wind Eng. 47 (2), 266–282. doi:10.1177/0309524x221124335
Chen, C., Hu, Bo, Xie, K., Wan, L., and Xiang, B. (2014). Peak-valley time-of-use price model including power system reliability and power purchase risk. Power Syst. Technol. 38 (8), 2141–2148. doi:10.13335/j.1000-3673.pst.2014.08.019
Chen, C., Wu, X., Ma, J., Chen, Y., Liu, S., Wu, X., et al. (2022). Optimal low-carbon scheduling of integrated local energy system considering oxygen-enriched combustion plant and generalized energy storages. IET Renew. Power Gener. 16 (4), 671–687. doi:10.1049/rpg2.12342
Chen, J., Hu, Z., Chen, J., Chen, Y., Gao, M., and Lin, M. (2021). Optimal dispatch of integrated energy system considering ladder-type carbon trading and flexible double response of. Supply Demand High Volt. Eng. 47 (09), 3094–3106. doi:10.13336/j.1003-6520.hve.20211094
Cheng, Y., Zhang, N., Zhang, B., Kang, C., Xi, W., and Feng, M. (2020). Low-carbon operation of multiple energy systems based on energy-carbon integrated prices. IEEE Trans. Smart Grid 11 (2), 1307–1318. doi:10.1109/tsg.2019.2935736
Dorahaki, S., Rashidinejad, M., Farshad, S., Ardestani, F., Abdollahi, A., and Reza Salehizadeh, M. (2023). An integrated model for citizen energy communities and renewable energy communities based on clean energy package: a two-stage risk-based approach. Energy 2023 (277), 1–24. doi:10.1016/j.energy.2023.127727
Dou, C., Zhou, X., Zhang, T., and Xu, S. (2020). Economic optimization dispatching strategy of microgrid for promoting photoelectric consumption considering cogeneration and demand response. Mod. Power Syst. Clean Energy 8 (03), 557–563. doi:10.35833/mpce.2019.000214
Fan, W., Liu, Q., and Wang, M. (2021). Bi-level multi-objective optimization scheduling for regional integrated energy systems based on quantum evolutionary algorithm. Energies 14 (16), 4740. doi:10.3390/en14164740
He, L., Lu, Z., Geng, L., Zhang, J., Li, X., and Guo, X. (2020). Environmental economic dispatch of integrated regional energy system considering integrated demand response. Int. J. Electr. Power & Energy Syst. (116), 0142–0615. doi:10.1016/j.ijepes.2019.105525
Huang, H., Jia, J., and Zhang, Z. (2023). Spatial-temporal evolution and influencing factors of carbon emissions from land use change in Jiangxi County. Acta Ecol. Sin. 9 (20), 1–14. doi:10.20103/j.stxb.202211293454
Huynh, D. C., Pham, H. M., Ho, L. D., Dunnigan, M. W., and Barbalata, C. (2022). “An improved artificial bee colony algorithm-based configuration optimization of a remote microgrid considering renewable energy systems,” in Proceedings of 2022 6th International Conference on Green Technology and Sustainable Development, Nha Trang City, Vietnam, July, 2022, 976–981. doi:10.1109/GTSD54989.2022.9989062
Jin, X., Sun, L., Ding, M., Wen, F., and Sun, W. (2023). Distributionally robust low-carbon dispatch of park-level integrated energy system considering uncertainty of customer response. Automation Electr. Power Syst. 47 (16), 10–21. doi:10.7500/AEPS20221024010
Kang, C., Zhou, T., Chen, Q., Wang, J., Sun, Y., Xia, Q., et al. (2015). Carbon emission flow from generation to demand: a network-based model. IEEE Trans. Smart Grid 6 (5), 2386–2394. doi:10.1109/tsg.2015.2388695
Le, J., Qi, G., Zhao, L., and Liao, X. (2022). Time-delay stability analysis of an active distribution network adoptinga distributed economic dispatch strategy. Power Syst. Prot. Control 50 (21), 75–87. doi:10.19783/j.cnki.pspc.220010
Li, J., Yang, Bo, and Hu, Y. (2023). Site selection and capacity setting of electro-hydrogen hybrid energy storage system considering demand side response. Power Syst. Technol. 47 (09), 3698–3714. doi:10.13335/j.1000-3673.pst.2022.2285
Li, T., Xiao, Q., Jia, H., Mu, Y., Wang, X., Lu, W., et al. (2022). Multi-agent schedule optimization method for regional energy internet considering the improved tiered reward and punishment carbon trading model. Front. Energy Res. 10 (10), 1–12. doi:10.3389/fenrg.2022.916996
Liu, X. (2022). Research on optimal placement of low-carbon equipment capacity in integrated energy system considering carbon emission and carbon trading. Int. J. Energy Res. 46 (14), 20535–20555. doi:10.1002/er.7826
Ma, L., Sui, K., Liang, Y., Qiu, J., Cheng, X., Shang, L., et al. (2021). “A bi-level optimal configuration model of isolated microgrid considering energy storage lifetime,” in 2021 International Conference on Power System Technology (POWERCON), Haikou, China, December, 2021, 1084–1088. doi:10.1109/POWERCON53785.2021.9697602
Mohammad, H., Shahraki, N., Zamani, H., and Mirjalili, S. (2023). Enhanced whale optimization algorithm for medical feature selection: a COVID-19 case study. Comput. Biol. Med. 2022 (148), 0010–4825. doi:10.1016/j.compbiomed.2022.105858
Pal, S., Kumar, M., and Kumar, R. (2017). “Price aware residential demand response with renewable sources and electric vehicle,” in IEEE International WIE Conference on Electrical and Computer Engineering (WIECON-ECE), Dehradun, India, December, 2017, 211–214. doi:10.1109/WIECON-ECE.2017.8468915
Qi, Yu, Ding, T., Sun, Y., He, Y., Wang, C., Wang, Y., et al. (2021). Review and thinking on the development of electricity spot market to promote renewable energy consumption at home and abroad. Proc. CSEE 41 (5), 1729–1751. doi:10.13334/j.0258-8013.pcsee.201408
Sobhan, D., Dashti, R., and Shaker, H. R. (2020). Optimal outage management model considering emergency demand response programs for a smart distribution system. Appl. Sci. 10 (21), 7406. doi:10.3390/app10217406
Sobhan, D., Rashidinejad, M., Ardestani, S. F. F., Abdollahi, A., and Salehizadeh, M. R. (2023). Probabilistic/information gap decision theory-based bilevel optimal management for multi-carrier network by aggregating energy communities. IET Renew. Power Gener. 17 (6), 1436–1465. doi:10.1049/rpg2.12685
Sun, G., Shang, Y., and Zhang, R. (2022). An efficient and robust improved whale optimization algorithm for large scale global optimization problems. Electronics 11 (9), 1475. doi:10.3390/electronics11091475
Tan, Q., Mei, S., Qi, Ye, Ding, Y., and Zhang, Y. (2019). Optimization model of a combined Wind–PV–thermal dispatching system under carbon emissions trading in China. J. Clean. Prod. 225 (225), 391–404. doi:10.1016/j.jclepro.2019.03.349
Wang, J., Xue, K., Guo, Y., Ma, J., Zhou, X., Liu, M., et al. (2022a). Multi-objective capacity programming and operation optimization of an integrated energy system considering hydrogen energy storage for collective energy communities. Energy Convers. Manag. 7 (268), 0196–8904. doi:10.1016/j.enconman.2022.116057
Wang, P., Tang, J. J., Zhang, Z., Li, Y., Wu, H., Ji, C., et al. (2022b). Bidding strategy optimization for power generation company in carbon emission rights and electricity market. Energy Rep. 8 (5), 325–331. doi:10.1016/j.egyr.2022.02.174
Wang, Y., Qiu, J., Tao, Y., and Zhao, J. (2020). Carbon-oriented operational planning in coupled electricity and emission trading markets. IEEE Trans. 35 (4), 3145–3157. doi:10.1109/tpwrs.2020.2966663
Xiaohui, Z., Xiaoyan, L., Jiaqing, Z., and Wenbo, G. (2019). Electricity–gas-integrated energy planning based on reward and penalty ladder-type carbon trading cost. IET Gener. Transm. Distrib. 13 (23), 5263–5270. doi:10.1049/iet-gtd.2019.0666
Yang, J., Zhang, M., Dou, L., Xiao, S., and Zhao, Y. (2022). Spatial pattern and carbon balance zoning of land use carbon emissions in Jiangxi Province. Environ. Sci. Res. 35 (10), 2312–2321. doi:10.13198/j.issn.1001-6929.2022.05.04
Ying, Y., Tian, Z., Wu, M., Liu, Q., and Tricoli, P. (2023). Capacity configuration method of flexible smart traction power supply system based on double-layer optimization. IEEE Trans. Transp. Electrification 9 (3), 4571–4582. doi:10.1109/tte.2023.3244551
Zhang, X., Jin, X., Zhang, Z., Zheng, M., Han, Y., Xue, J., et al. (2019). Research on power planning under the green card and carbon trading process. AIP Conf. 2185 (1), 020–052. doi:10.1063/1.5137896
Zhang, X., Liu, X., Yang, W., Wen, F., Meng, K., Liu, H., et al. (2018). Hierarchical scheduling strategy of electric vehicles under dynamic time-of-use electricity price mechanism. Electr. Power Constr. 39 (12), 73–80.
Zhang, Z., and Kang, C. (2022). Challenges and prospects of building a new power system under the goal of carbon neutrality. Proc. CSEE 42 (08), 2806–2819. doi:10.13334/j.0258-8013.pcsee.220467
Zhao, C., Wang, B., Sun, Z., and Wang, X. (2022). Optimal configuration optimization of islanded microgrid using improved grey wolf optimizer algorithm. Acta Energiae Solaris Sin. 43 (1), 256–262. doi:10.19912/j.0254-0096.tynxb.2020-0042
Keywords: grid-connected microgrid, hydrogen energy storage, optimal configuration, stepped carbon trading, demand-side response, enhanced whale optimization algorithm
Citation: Lei W, Junping Z, Weijian J and Yuling X (2024) Bi-level optimization configuration method for microgrids considering carbon trading and demand response. Front. Energy Res. 11:1334889. doi: 10.3389/fenrg.2023.1334889
Received: 08 November 2023; Accepted: 15 December 2023;
Published: 12 January 2024.
Edited by:
Qianzhi Zhang, University of Alabama, United StatesReviewed by:
Sobhan Dorahaki, Shahid Bahonar University of Kerman, IranZeeshan Ahmad Arfeen, Islamia University of Bahawalpur, Pakistan
Xiang Huo, The University of Utah, United States
Aneesh A. Chand, University of the South Pacific, Fiji
Copyright © 2024 Lei, Junping, Weijian and Yuling. This is an open-access article distributed under the terms of the Creative Commons Attribution License (CC BY). The use, distribution or reproduction in other forums is permitted, provided the original author(s) and the copyright owner(s) are credited and that the original publication in this journal is cited, in accordance with accepted academic practice. No use, distribution or reproduction is permitted which does not comply with these terms.
*Correspondence: Wang Lei, MjAwNTAwMDA5OEBzaGllcC5lZHUuY24=