 Mousumi Basu1
 Chitralekha Jena
 Baseem Khan
 Tahir Khurshaid
- 1Department of Power Engineering, Jadavpur University, Kolkata, India
- 2School of Electrical Engineering, KIIT University, Bhubaneswar, India
- 3Department of Electrical and Computer Engineering, Hawassa University, Hawassa, Ethiopia
- 4Department of Electrical and Electronic Engineering Technology, Faculty of Engineering and the Built Environment, University of Johannesburg, Johannesburg, South Africa
- 5Department of Electrical Engineering, Yeungnam University, Gyeongsan, Republic of Korea
Reactive power compensation (RPC) is a big problem during power system operation. Parenthetically, capacitor allocation and sizing may be the only convenient solution for RPC of power systems. The loss sensitivity factor (LSF) is applied here for finding the optimum capacitor position. This paper presents quasi-oppositional fast convergence evolutionary programming (QOFCEP), fast convergence evolutionary programming (FCEP), and evolutionary programming (EP) for the optimum location and sizing of shunt capacitors in the isolated microgrid (MG) for minimizing total real power loss throughout the day with and without the demand response program (DRP). The 33-node, 69-node, and 118-node isolated MGs have been studied to authenticate the efficacy of the suggested approach. Each MG includes small hydro power plants (SHPPs), solar PV plants (SPVPs), wind turbine generators (WTGs), diesel generators (DGs), and plug-in electric vehicles (PEVs).
1 Introduction
Reactive power flow creates several problems, e.g., power loss, voltage drip, and low power factor in the distribution system (DS). Therefore, reactive power compensation (RPC) plays the chief role in the power system for minimizing the operational cost (Abdelaziz et al., 2016). There are few solutions for RPC in the DS, among which the placement of the capacitor is one of the most apposite and efficient. Hence, to find the optimum position and sizing of the capacitor for attaining financial benefits is the paramount purpose of this study. Several methods have been proposed for finding the optimum position and sizing of the capacitor. The multi-objective capacitor placement in the DS, taking into account both the nonlinear load and the power quality constraint, has been presented in Azevedo et al. (2016). The fuzzy multi-objective immune algorithm was applied for finding the optimum position and sizing of the capacitor in Huang et al. (2008). Sultana and Roy (2014) applied the teaching–learning-based optimization technique for the capacitor placement in the DS so as to decrease power loss and operational cost. The cuckoo search algorithm was applied for allocating fixed plus switched capacitor in the DS so as to minimize the operational cost and voltage profile improvement at the different loads in El-Fergany (2013). Mohamed Shuaib et al. (2015) introduced the loss sensitivity factor (LSF) for reducing search space. The hybrid honey bee colony algorithm was applied for the optimum capacitor placement in Taher and Bagherpour (2013). Mekhamer et al. (2003); Das (2008) applied the fuzzy logic for the optimum capacitor placement in the DS. The optimum planning of the capacitor plus distributed generation allocation has been concurrently implemented in Rahmani-andebili (2016). The optimum placement of the capacitor in the microgrid (MG) has been presented in Al-Askari et al. (2005). Probabilistic optimum reactive power scheduling in the DS incorporating renewable energy sources in the grid-connected mode and the islanded mode using the tabu search method has been discussed in Arefifar and Mohamed (2014). Farag and El-Saadany (2015) applied the genetic algorithm for optimum capacitor allocation in islanded multi MGs. Tolabia et al. (2020) applied the thief and police method for minimizing power loss, operating cost, and improving network voltage stability simultaneously reconfiguring optimum capacitor allocation and distributed generation units. Parvaneh et al. (2023) presented the merit of capacitor bank placement and DRP implementation on optimum operation of islanded MGs.
Yasin Ghadi et al. (2023) presented a hybrid GA–SFLA algorithm for reconfiguring and placement of energy storage systems, electric vehicles, and distributed generation (DG) in a distribution network. Dashtdar et al. (2022a) formulated and solved the problem of the optimal operation of MGs with demand-side management using the combination of the genetic algorithm and artificial bee colony optimization techniques. Dashtdar et al. (2020) applied the genetic algorithm to calculate the locational marginal price (LMP) and optimal power flow problem based on congestion management. Dashtdar et al. (2021) applied the genetic algorithm for reducing LMP and resolving the congestion of the lines based on the placement and optimal size of DG in the power network. Dashtdar et al. (2022b) used a hybrid FA-GA multi-objective algorithm to solve the environmental/economic dispatch problem. Dashtdar et al. (2022c) used the improved artificial bee colony algorithm for solving the optimal size and place of DG in the distribution network based on nodal pricing. Shaheen et al. (2023) used the enhanced transient search optimization technique for the optimal solution of the ORPD problem by integrating electric vehicles.
Evolutionary programming (EP; Fogel, 1994; Yao et al., 1999) is a very dependable evolutionary algorithm founded on humanoid inherited chromosome operation. In fast convergence evolutionary programming (FCEP; Basu, 2017), creating offspring is done by Gaussian and Cauchy mutations, and one-to-one competition is instigated in EP for improving the speed of convergence and the quality of solution.
Quasi-opposition-based learning (QOBL) was initiated by Rahnamayan et al. (Rahnamayan et al.). The chief notion behind QOBL is seeking a better contender solution which is nearer to the global optimal solution. The concept of QOBL is incorporated in FCEP for improving the efficiency and solution quality. Quasi-oppositional fast convergence evolutionary programming (QOFCEP) applies QOBL for populace initialization and generation jumping.
The present study aims to minimize the total real power loss all over the day by optimizing the size and placement of shunt capacitors in an isolated MG with and without DRP. The optimum locations of the shunt capacitors are attained using the LSF. This problem has been solved by utilizing QOFCEP, FCEP, and EP. Three isolated MGs, e.g., IEEE 33-bus, IEEE 69-bus, and IEE 118-bus systems, are used for authentication. Each isolated MG includes small hydro power plants (SHPPs), solar PV plants (SPVPs), wind turbine generators (WTGs), diesel generators (DGs), and plug-in electric vehicles (PEVs). The configuration of 33-bus, 69-bus, and 118-bus isolated MG is shown in Figure 1, Figure 2, and Supplementary Figure S1, respectively.
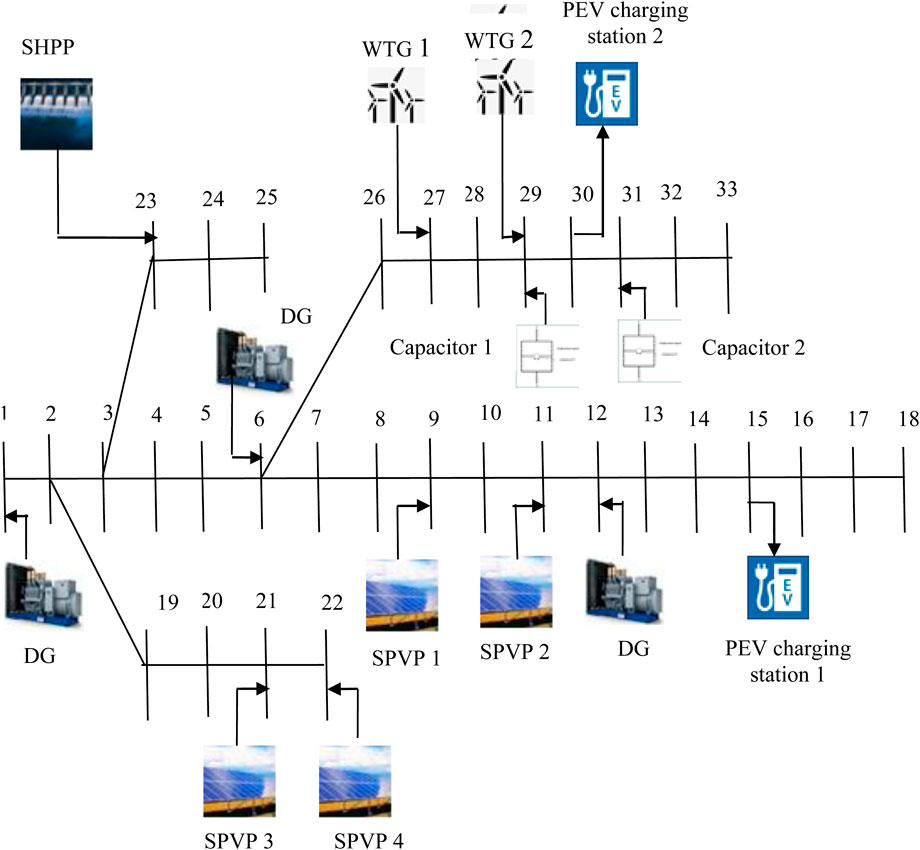
Figure 1. Schematic diagram of the 33-bus isolated MG.
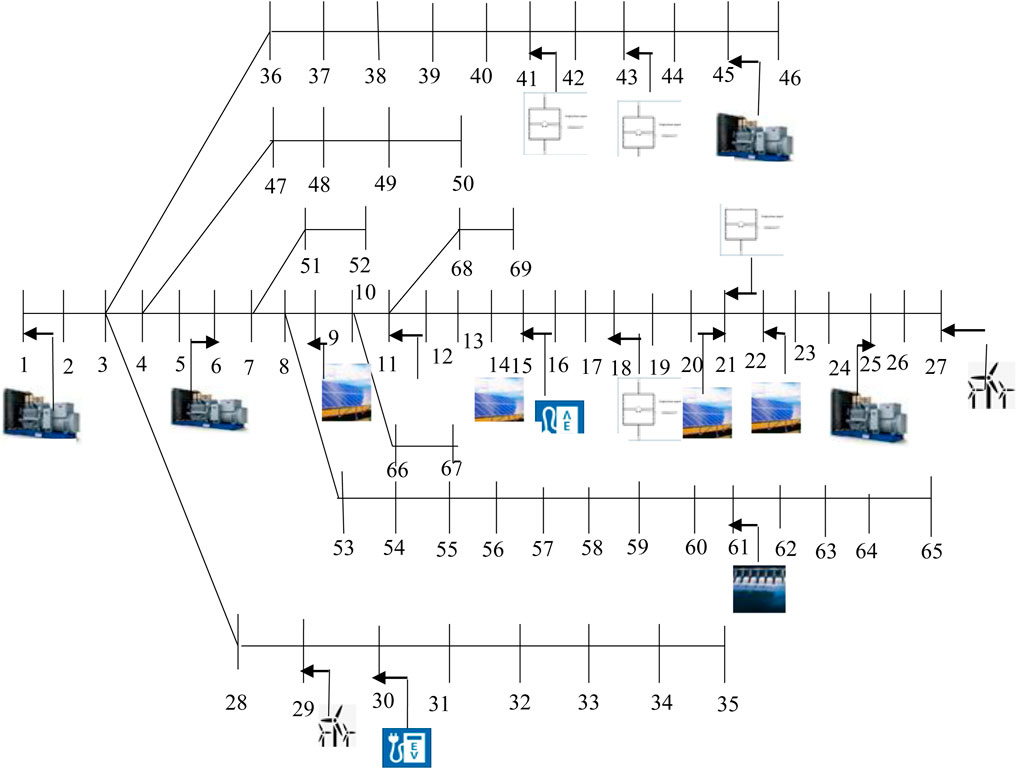
Figure 2. Schematic diagram of the 69-bus isolated MG.
The key contributions to this paper can be stated as follows:
• Optimum sizing and capacitor placement in isolated MG throughout the day are studied.
• DRP has been taken into consideration.
• Each isolated MG includes SHPPs, SPVPs, WTGs, DGs, and PEVs.
• The proposed notion has been applied on three isolated MGs, e.g., 33-node, 69-node, and 118-node isolated MGs.
2 Formulation of the problem
2.1 Objective function
This study minimizes total real power loss (El-Fergany, 2013) throughout the day and can be stated as (El-Fergany, 2013)
2.2 Constraints
The equality and inequality constraints are specified below:
2.2.1 Equality constraints
Equality constraints are load flow equations (El-Fergany, 2013):
2.2.2 Inequality constraints
The magnitude of bus voltage and phase angle is constrained amongst minimum and maximum limits (El-Fergany, 2013).
The power factor of the distributed generation is allowable to vary amongst its minimum and maximum limits (El-Fergany, 2013).
The line flow in all distribution lines must lie inside its capability limits and specified as follows (El-Fergany, 2013):
Reactive power compensation is defined as (El-Fergany, 2013)
2.2.2.1 Optimal location of the capacitor
By using the LSF, the candidate buses for the capacitor placement are determined.
The LSF was used for identifying the optimum capacitor location. The position of the capacitor was selected from the buses with the highest value of LSF. Loss sensitivity analysis was used to find the optimum location for the capacitor placement. The node with the highest LSF value has more chance for capacitor installation. The detail derivation of LSF was found in Das and Banerjee (2014).
2.2.2.2 Distributed generation modeling
Four kinds of distributed generation have been used. Two of them have been characterized by delivering active power and lagging reactive power into a distribution bus like to DGs and SHPPs. The WTG is represented by delivering active power into the distribution bus and taking lagging reactive power from the distribution bus. SPVP is represented by delivering only active power to the distribution bus.
2.2.2.3 Diesel generator
The generated active and reactive power of DGs should be within its capacity limits (Das and Banerjee, 2014).
The operational range of each DG is limited by their ramp rate limits (Das and Banerjee, 2014).
2.2.2.4 Solar power model
The power produced by SPVP (Liang and Liao, 2007) is typically dependent on solar irradiation and deviance amongst the reference temperature and ambient temperature. The power output achieved from SPVP
2.2.2.5 Wind power model
The output power of WTG (Hariria et al., 2020) is typically dependent on the speed of wind. The power output of WTG
2.2.2.6 Small hydro power plant
The production of power of SHPP (Wood and Wollenberg, 1996) as a function of the water discharge rate plus reservoir stowing capacity is computed as (Wood and Wollenberg, 1996)
Hydraulic operative constraints which comprise the water equilibrium equation for each SHPP and restriction on the reservoir water stowing capacity, as well as the water ejection rate, are as follows:
a) Physical restrictions on reservoir water stowing the volume plus water discharge rate (Wood and Wollenberg, 1996):
b) Continuity equation for every hydro reservoir system (Wood and Wollenberg, 1996):
2.2.2.7 Plug-in electric vehicle
Energy consumed by every PEV is dependent on traveling. Stowed levels of energy of every PEV are specified by Equation 23. Eq. 24 specifies the minimum and maximum limits of SOC for every PEV. The power consumed by every PEV throughout the traveling mode is specified by (25). The acceptable charging and discharging rates of every PEV are specified by Equations 26, 27, respectively. The performance of every PEV is specified by Eq. 28 (Wood and Wollenberg, 1996).
where
2.2.2.8 Demand response program
The demand response program (DRP) founded on the TOU program (Yousefi et al., 2013; Mizadeh and Taghizadegan, 2017) has been applied here. The TOU program has been defined by (29) and restricted by equations (30–33) (Yousefi et al., 2013; Mizadeh and Taghizadegan, 2017).
3 Description of quasi-oppositional fast convergence evolutionary programming
In FCEP, Gaussian and Cauchy mutations are used for creating offspring (Basu, 2017), and one-to-one contest is instigated in EP to augment the speed of convergence and quality solution.
3.1 Opposition-based learning
Tizhoosh (2005a); Tizhoosh(2005b) instigated OBL for enhancing the candidate solution by checking the existing populace and its opposite concurrently. EP begins after initializing the populace and attempts for enhancing them in the direction of the optimal solution.
3.2 Quasi-opposition-based learning
Rahnamayan et al. has instigated QOBL (Rahnamayan et al.) for enhancing the candidate solution by checking the current populace and its quasi-opposite populace concurrently. The process can be boosted by starting with a fitter solution by simultaneously testing the quasi-opposite solution. Thus, the fitter one among the estimate and quasi-opposite estimate may be chosen as the initial solution. The same approach may be used for the initial solution and continuously to each solution in the current populace.
3.2.1 Definition of the opposite number and quasi-opposite number
If
and
3.2.2 Definition of the opposite and quasi-opposite points
Let
The quasi-opposite point
3.2.3 Quasi-opposition-based optimization
Let
3.3 Quasi-oppositional fast convergence evolutionary programming
The concept of QOBL (Rahnamayan et al.) is incorporated in FCEP. Original FCEP has been taken as a parent algorithm, and quasi-opposition-based notions have been introduced in FCEP. Supplementary Figure S2 portrays the flowchart of the QOFCEP algorithm.
4 Numerical results and discussion
4.1 Application study and numerical results
Total real power loss throughout the day is minimized by optimizing the size and placement of shunt capacitors in isolated MG with and without DRP. This problem is solved by utilizing QOFCEP, FCEPA, and EP in MATLAB (Version: (R2018a)) simulated on an Intel (R), Core (TM) i7-4790 CPU 3.66 GHz and 16 GB RAM, 64-bit operating system.
Here, three test systems, i.e., the IEEE 33-bus system, IEEE 69-bus system, and IEEE 118-bus system, have been used for testing. All the data except the capacitor size and energy consumption of PEV are taken from Basu (2023). Energy consumption of each PEV is presumed to be 20 KWh/day. In all the test systems, it is taken that 13, 14, 15, and 16 are peak demand hours and 15% of 13th, 14th, 15th, and 16th hour power demand is shifted to 1st, 2nd, 3rd, and 4th hour for each bus during DRP.
LSF (Das and Banerjee, 2014) is applied for each test system to identify the candidate buses where the shunt capacitor has to be installed.
4.1.1 IEEE 33-bus system
IEEE 33-bus DS (Basu, 2023) includes three DGs connected to buses 1, 6, and 12, respectively: one SHPP is connected to bus 23; four SPVPs are connected to buses 9, 11, 21, and 22, respectively; and two WTGs connected to 27 and 29, respectively. Two PEV charging stations are connected to buses 15 and 30, respectively. Charging stations 1 and 2 have 25 and 35 PEVs, respectively.
From LSF (Das and Banerjee, 2014) calculation, the order of candidate buses is 31 and 29, where RPC is required. The size of the capacitor varies between 0 and 500 KVAr in this system.
This problem has been solved using QOFCEP, FCEP, and EP. Here, the parameter is selected as
The best real power loss and corresponding reactive power loss and CPU time amongst 100 runs of solutions attained from three methods with and without both RPC and DRP are summarized in Supplementary Table S1. Real power and reactive power with RPC and DRP corresponding to the best real power loss attained from QOFCEP are depicted in Figure 3 and Figure 4, respectively. Real power losses of each line with RPC and DRP throughout the day corresponding to the best real power loss attained from QOFCEP are depicted in Supplementary Figure S3 and Supplementary Figure S4, respectively. Reactive power losses of each line with RPC and DRP throughout the day corresponding to the best real power loss attained from QOFCEP are depicted in Supplementary Figure S5 and Supplementary Figure S6, respectively. Real and reactive power losses with RPC and DRP corresponding to the best real power loss attained from QOFCEP are depicted in Figure 5. Voltage with RPC and both with and without DRP corresponding to the best real power loss attained from QOFCEP is portrayed in Figure 6. Real power loss convergence characteristics with both RPC and DRP attained using QOFCEP, FCEP, and EP are depicted in Supplementary Figure S7.
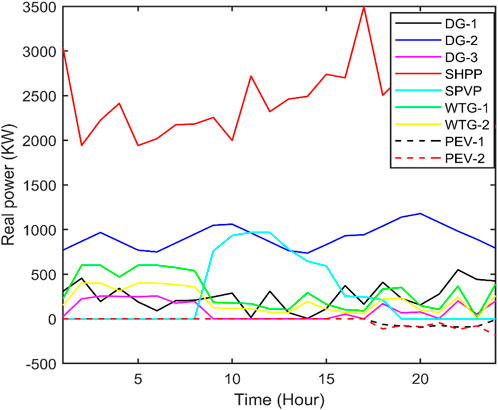
Figure 3. Real power acquired from QOFCEP for the IEEE 33-bus system with RPC and DRP.
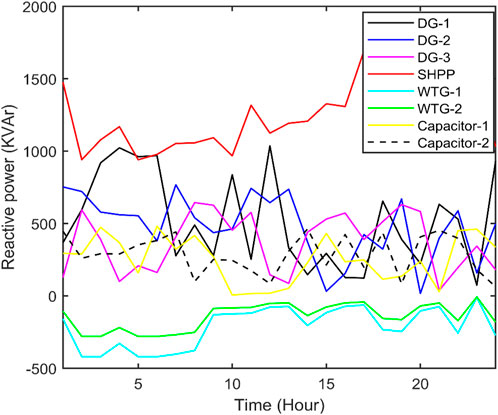
Figure 4. Reactive power acquired from QOFCEP for the IEEE 33-bus system with RPC and DRP.
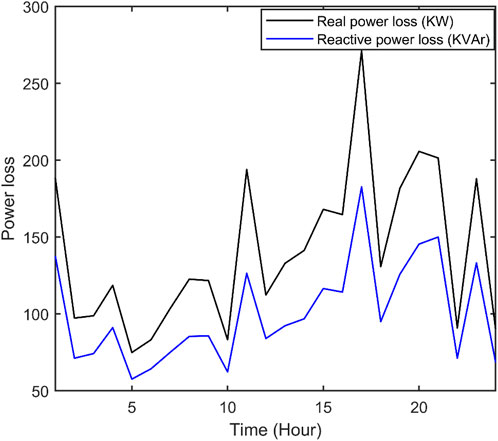
Figure 5. Power loss acquired from QOFCEP for the IEEE 33-bus system with RPC and DRP.
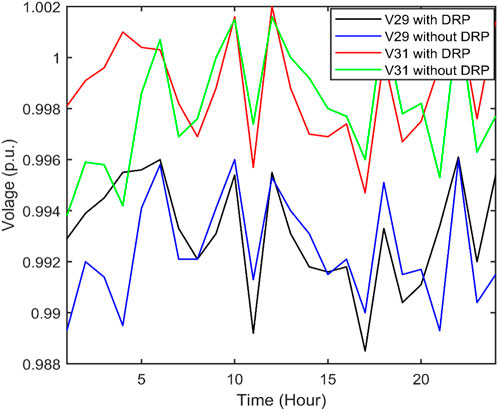
Figure 6. Acquired voltage from QOFCEP for the IEEE 33-bus system with RPC but with and without DRP.
Real power and reactive power with RPC but without DRP corresponding to the best real power loss attained from QOFCEP are depicted in Supplementary Figure S8 and Supplementary Figure S9, respectively. The real power loss of each line with RPC but without DRP throughout the day corresponding to the best real power loss attained from QOFCEP is depicted in Supplementary Figure S10, S11, respectively. The reactive power loss of each line with RPC but without DRP throughout the day corresponding to the best real power loss attained from QOFCEP is depicted in Supplementary Figure S12, S13, respectively. Real and reactive power losses with RPC but without DRP corresponding to the best real power loss attained from QOFCEP are depicted in Supplementary Figure S14. Real power loss convergence characteristics with RPC but without DRP attained using QOFCEP, FCEP, and EP are depicted in Supplementary Figure S15.
Real power and reactive power without RPC but with DRP corresponding to the best real power loss attained from QOFCEP are depicted in Supplementary Figure S16, S17, respectively. The real power loss of each line without RPC but with DRP throughout the day corresponding to the best real power loss attained from QOFCEP is depicted in Supplementary Figure S18, S19, respectively. The reactive power loss of each line without RPC but with DRP throughout the day corresponding to the best real power loss attained from QOFCEP is depicted in Supplementary Figure S20 and Supplementary Figure S21, respectively. Real and reactive power losses without RPC but with DRP corresponding to the best real power loss attained from QOFCEP are depicted in Supplementary Figure S22. Voltage without RPC and both with and without DRP corresponding to the best real power loss attained from QOFCEP is portrayed in Supplementary Figure S23. Real power loss convergence characteristics without RPC but with DRP attained using QOFCEP, FCEP, and EP are depicted in Supplementary Figure S24.
Real power and reactive power without RPC and DRP corresponding to the best real power loss attained from QOFCEP are depicted in Supplementary Figure S25 and Supplementary Figure S26, respectively. Real power losses of each line without RPC and without DRP throughout the day corresponding to the best real power loss attained from QOFCEP are depicted in Supplementary Figure S27 and Supplementary Figure S28, respectively. The reactive power loss of each line without RPC and without DRP throughout the day corresponding to the best real power loss attained from QOFCEP is depicted in Supplementary Figure S29 and Supplementary Figure S30, respectively. Real and reactive power losses without RPC and DRP corresponding to the best real power loss attained from QOFCEP are depicted in Supplementary Figure S31. Real power loss convergence characteristics without RPC and DRP attained using QOFCEP, FCEP, and EP are depicted in Supplementary Figure S32.
4.1.2 IEEE 69-bus system
The 69-bus DS system (Basu, 2023) includes four DGs connected to buses 1, 6, 25, and 45, respectively; one SHPP connected to bus 61; four SPVPs connected to buses 9, 11, 21, and 22, respectively; and two WTGs connected to 27 and 29, respectively. Two PEV charging stations are connected to buses 15 and 30, respectively. Charging stations 1 and 2 have 25 and 35 PEVs, respectively.
From LSF (Das and Banerjee, 2014) calculation, the order of candidate buses is 18, 41, 43, and 21 where RPC is required. The size of the capacitor varies between 0 and 500 KVAr in this system.
This problem has been solved using QOFCEP, FCEP, and EP. Here, the parameter is selected as
The best real power loss and corresponding reactive power loss and CPU time amongst 100 runs of solutions attained from three methods with and without both RPC and DRP are summarized in Supplementary Table S2. Real power and reactive power with both RPC and DRP corresponding to the best real power loss attained from QOFCEP are depicted in Figure 7 and Figure 8, respectively. Real and reactive power losses with both RPC and DRP corresponding to the best real power loss attained from QOFCEP are depicted in Figure 9. Voltage with and without RPC integrating DRP corresponding to the best real power loss attained from QOFCEP is portrayed in Figure 10. Real power loss convergence characteristics with both RPC and DRP attained using QOFCEP, FCEP, and EP are depicted in Supplementary Figure S33. Real power loss convergence characteristics without RPC but with DRP attained using QOFCEP, FCEP, and EP are depicted in Supplementary Figure S34.
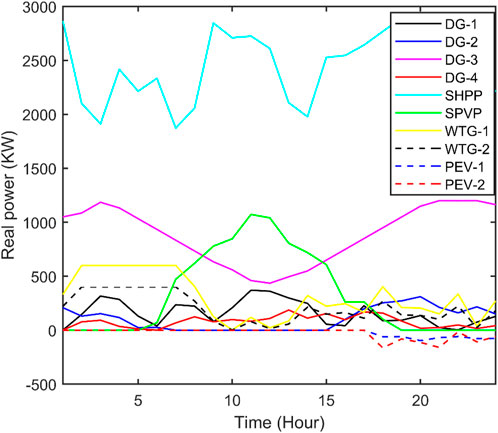
Figure 7. Real power acquired from QOFCEP for the IEEE 69-bus system with RPC and DRP.
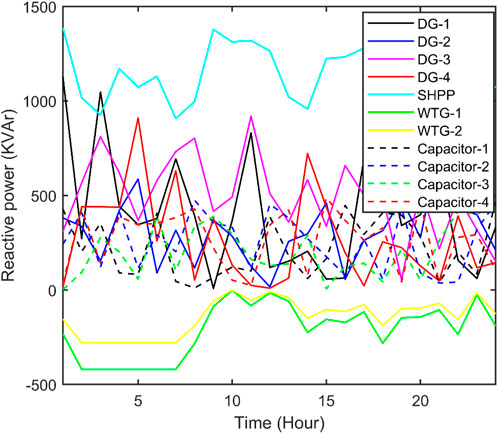
Figure 8. Reactive power acquired from QOFCEP for the IEEE 69-bus system with RPC and DRP.
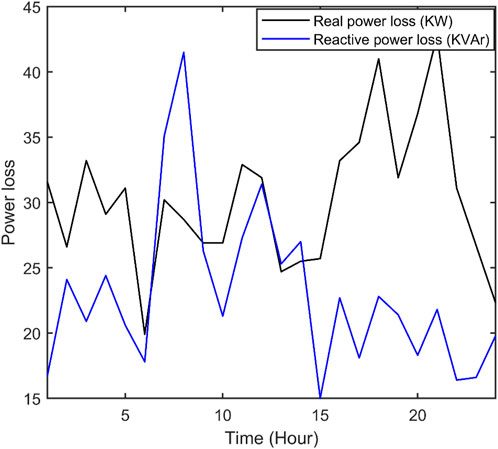
Figure 9. Power loss acquired from QOFCEP for the IEEE 69-bus system with RPC and DRP.
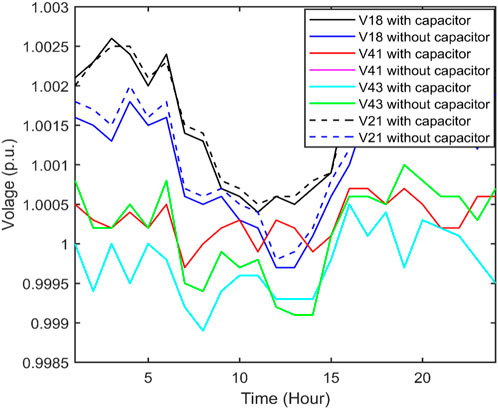
Figure 10. Voltage acquired from QOFCEP for the IEEE 69-bus system with RPC and DRP.
4.1.3 IEEE 118-bus system
The 118-bus DS (Basu, 2023) includes 20 DGs connected to buses 1, 2, 6, 14, 18, 25, 31, 33, 39, 45, 50, 53, 55, 73, 80, 90, 96, 100, 109, and 115, respectively; 2 SHPPs connected to buses 70 and 107, respectively; 15 SPVPs connected to buses 10,12, 22, 23, 27, 29, 36, 41, 60, 66, 84, 93, 103, 108, and 113, respectively; and 4 WTGs connected to 32, 34, 43, and 44, respectively. Four PEV charging stations are connected to buses 16, 56, 91, and 101, respectively. Charging stations 1 and 2 have 25 PEVs, respectively. Charging stations 3 and 4 have 35 PEVs, respectively.
From LSF (Das and Banerjee, 2014) calculation, the order of candidate buses is 11, 17, 41, 42, 54, 60, 87, 101, 3, 9, 59, 103, 104, 105, and 106, where RPC is required. The size of the capacitor varies between 0 and 300 KVAr in this system.
This problem has been solved using QOFCEP, FCEP, and EP. Here, the parameter is selected as
The best real power loss and the corresponding reactive power loss and CPU time amongst 100 runs of solutions attained from three methods with and without both RPC and DRP are shown in Supplementary Table S3. Real power with RPC corresponding to the best real power loss attained from QOFCEP with both RPC and DRP is portrayed in Figure 11, Figure 12 and Figure 13, respectively. Reactive power with RPC corresponding to the best real power loss attained from QOFCEP with both RPC and DRP is portrayed in Figure 14, Figure 15 and Figure 16, respectively. The reactive power of 15 capacitors corresponding to the best real power loss attained from QOFCEP with both RPC and DRP is depicted in Figure 17. Real power and reactive power losses with RPC corresponding to the best real power loss attained from QOFCEP with both RPC and DRP are depicted in Supplementary Figure S35. Voltage with RPC corresponding to the best real power loss attained from QOFCEP with both RPC and DRP is portrayed in Supplementary Figure S36. Real power loss convergence characteristics with both RPC and DRP attained using QOFCEP, FCEP, and EP are depicted in Supplementary Figure S37. Real power loss convergence characteristics without RPC but with DRP attained by using QOFCEP, FCEP, and EP are depicted in Supplementary Figure S38.
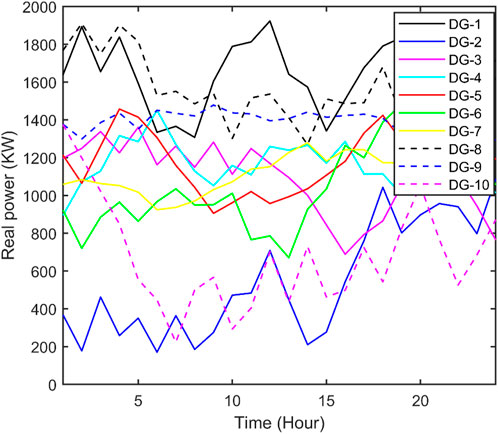
Figure 11. Real power of first 10 DGs acquired from QOFCEP for the IEEE 118-bus system with RPC.
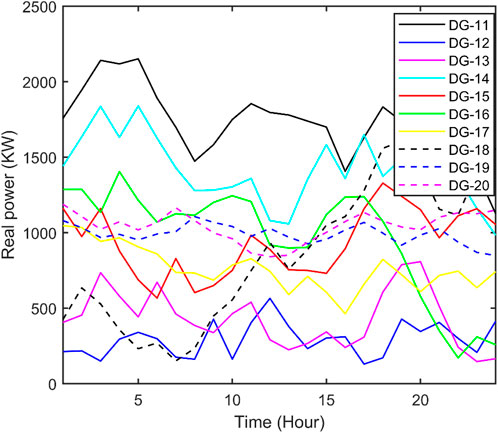
Figure 12. Real power of 11th to 20th DGs acquired from QOFCEP for the IEEE 118-bus system with RPC.
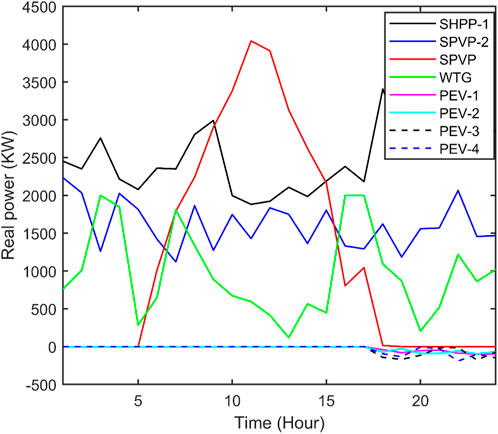
Figure 13. Real power of 2 SHPPs, total 15 SPVPs, total 4 WTGs, and 4 PEV charging stations acquired from QOFCEP for the IEEE 118-bus system with RPC.
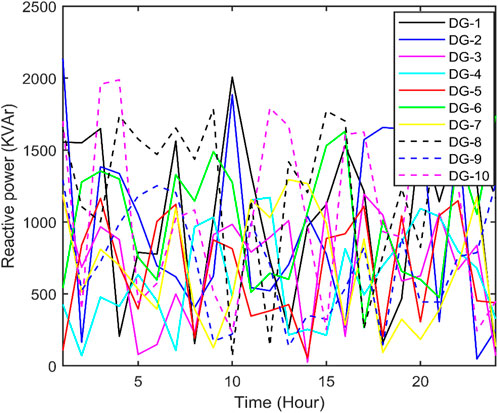
Figure 14. Reactive power of first 10 DGs acquired from QOFCEP for the IEEE 118-bus system with RPC.
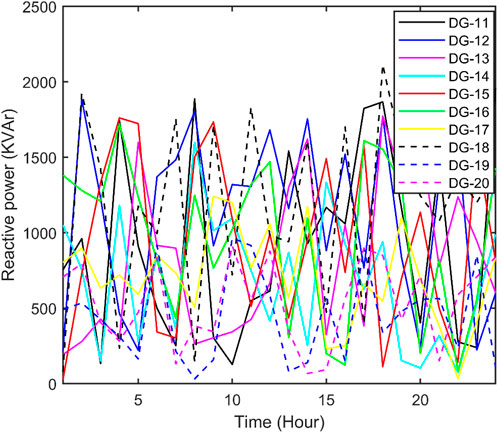
Figure 15. Reactive power of 11th to 20th DGs acquired from QOFCEP for the IEEE 118-bus system with RPC.
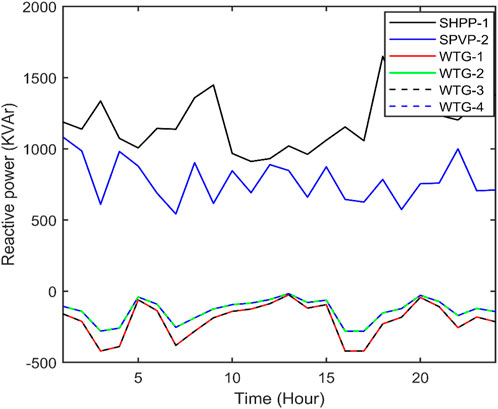
Figure 16. Reactive power of two SHPPs and total four WTGs acquired from QOFCEP for the IEEE 118-bus system with RPC.
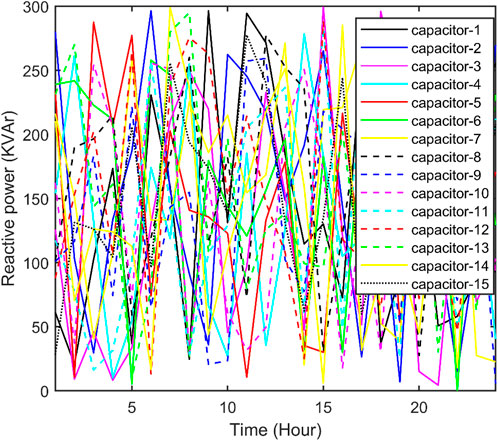
Figure 17. Reactive power of 15 capacitors acquired from QOFCEP for the IEEE 118-bus system.
4.2 Discussion
It is observed from Supplementary Table S1, Supplementary Table S2, and Supplementary Table S3 that total real power loss is least with both RPC and DRP. Total real power loss with RPC but without DRP is more than that obtained from with both RPC and DRP. Total real power loss without RPC but with DRP is more than that obtained from with RPC but without DRP. Total real power loss without RPC and without DRP is more than that obtained from without RPC but with DRP. The voltage profile is the best obtained from with both RPC and DRP. It is also observed that best real power loss attained for QOFCEP is the lowest amongst three algorithms.
5 Conclusion
Here, QOFCEP, FCEP, and EP are applied to find the optimum location and sizing of shunt capacitors in isolated MGs for minimizing total real power loss throughout the day with and without DRP. The 33-node, 69-node, and 118-node isolated MGs have been used for authentication. Each MG includes SHPPs, SPVPs, WTGs, DGs, and PEVs. It has been observed that real power loss with RPC has been reduced to 9.31%, 46.39%, and 13.77% for 33-node, 69-node, and 118-node isolated MGs, respectively, compared to without RPC. It has also been observed that QOFCEP performs better than FCEP and EP.
Data availability statement
The original contributions presented in the study are included in the article/Supplementary Material; further inquiries can be directed to the corresponding authors.
Author contributions
MB: conceptualization, data curation, formal analysis, investigation, methodology, project administration, resources, software, supervision, validation, visualization, writing–original draft, and writing–review and editing. CJ: conceptualization, data curation, formal analysis, investigation, methodology, project administration, resources, software, supervision, validation, visualization, writing–original draft, and writing–review and editing. BK: conceptualization, data curation, formal analysis, investigation, methodology, project administration, resources, software, supervision, validation, visualization, writing–original draft, and writing–review and editing. AA: conceptualization, data curation, formal analysis, investigation, methodology, project administration, resources, software, supervision, validation, visualization, writing–original draft, and writing–review and editing. TK: conceptualization, data curation, formal analysis, investigation, methodology, project administration, resources, software, supervision, validation, visualization, writing–original draft, and writing–review and editing.
Funding
The author(s) declare that no financial support was received for the research, authorship, and/or publication of this article.
Conflict of interest
The authors declare that the research was conducted in the absence of any commercial or financial relationships that could be construed as a potential conflict of interest.
Publisher’s note
All claims expressed in this article are solely those of the authors and do not necessarily represent those of their affiliated organizations, or those of the publisher, the editors, and the reviewers. Any product that may be evaluated in this article, or claim that may be made by its manufacturer, is not guaranteed or endorsed by the publisher.
Supplementary material
The Supplementary Material for this article can be found online at: https://www.frontiersin.org/articles/10.3389/fenrg.2024.1346330/full#supplementary-material
References
Abdelaziz, A. Y., Ali, E. S., and Abd Elazim, S. M. (2016). Flower Pollination Algorithm and Loss Sensitivity Factors for optimal sizing and placement of capacitors in radial distribution systems. Int. J. Electr. Power Energy Syst. 78, 207–214. doi:10.1016/j.ijepes.2015.11.059
Al-Askari, S. A., Ranade, S. J., and Mitra, J. (2005). “Optimal allocation of shunt capacitors placed in a microgrid operating in the islanded mode,” in Proc. 37th Annu. North Am. Power Symp. 2005 2005, 406–411.
Arefifar, S. A., and Mohamed, Y. A. R. I. (2014). Probabilistic optimal reactive power planning in distribution systems with renewable resources in grid-connected and islanded modes. IEEE Trans. Ind. Electron. 61 (11), 5830–5839. doi:10.1109/tie.2014.2308144
Azevedo, M. S. S., Abril, I. P., Leite, J. C., and de Medeiros, A. B. (2016). Capacitors placement by NSGA-II in distribution systems with non-linear loads. Int. J. Electr. Power Energy Syst. 82, 281–287. doi:10.1016/j.ijepes.2016.03.025
Basu, M. (2017). Fast convergence evolutionary programming for economic dispatch problems. IET Gener. Transm. Distrib. 11 (16), 4009–4017. doi:10.1049/iet-gtd.2017.0275
Basu, M. (2023). Dynamic optimal power flow for isolated microgrid incorporating renewable energy sources. Energy 264, 126065. doi:10.1016/j.energy.2022.126065
Das, D. (2008). Optimal placement of capacitors in radial distribution system using a Fuzzy-GA method. Int. J. Electr. Power Energy Syst. 30 (6–7), 361–367. doi:10.1016/j.ijepes.2007.08.004
Das, P., and Banerjee, S. (2014). Optimal sizing and placement of capacitor in a radial distribution system using loss sensitivity factor and firefly algorithm. Int. J. Eng. Comput. Sci. 3, 5346–5352.
Dashtdar, M., Flah, A., Hosseinimoghadam, S. M. S., Kotb, H., Jasinska, E., Gono, R., et al. (2022a). Optimal operation of microgrids with demand-side management based on a combination of genetic algorithm and artificial bee colony. Sustainability 14 (11), 6759. doi:10.3390/su14116759
Dashtdar, M., Flah, A., Hosseinimoghadam, S. M. S., Rami Reddy, Ch., Kotb, H., AboRas, K. M., et al. (2022b). Solving the environmental/economic dispatch problem using the hybrid FA-GA multi-objective algorithm. Energy Rep. 8, 13766–13779. doi:10.1016/j.egyr.2022.10.054
Dashtdar, M., Najafi, M., and Esmaeilbeig, M. (2020). Calculating the locational marginal price and solving optimal power flow problem based on congestion management using GA-GSF algorithm. Electr. Eng. 102 (3), 1549–1566. doi:10.1007/s00202-020-00974-z
Dashtdar, M., Najafi, M., and Esmaeilbeig, M. (2021). Reducing LMP and resolving the congestion of the lines based on placement and optimal size of DG in the power network using the GA-GSF algorithm. Electr. Eng. 103, 1279–1306. doi:10.1007/s00202-020-01142-z
Dashtdar, M., Najafi, M., Esmaeilbeig, M., and Bajaj, M. (2022c). Placement and optimal size of DG in the distribution network based on nodal pricing reduction with nonlinear load model using the IABC algorithm. Sādhanā 47 (2), 73. doi:10.1007/s12046-022-01850-1
El-Fergany, A. A. (2013). Optimal capacitor allocations using evolutionary algorithms. IET Gener. Transm. Distrib. 7 (6), 593–601. doi:10.1049/iet-gtd.2012.0661
Farag, H. E. Z., and El-Saadany, E. F. (2015). Optimum shunt capacitor placement in multimicrogrid systems with consideration of islanded mode of operation. IEEE Trans. Sustain. Energy 6 (4), 1435–1446. doi:10.1109/tste.2015.2442832
Fogel, D. B. (1994). An introduction to simulated evolutionary optimization. IEEE Trans. Neural Netw. 5, 3–14. doi:10.1109/72.265956
Hariria, A.-M., Hashemi-Dezakia, H., and Hejazia, M. A. (2020). A novel generalized analytical reliability assessment method of smart grids including renewable and non-renewable distributed generations and plug-in hybrid electric vehicles. Reliab. Eng. Syst. Saf. 196, 106746. doi:10.1016/j.ress.2019.106746
Huang, T. L., Hsiao, Y. T., Chang, C. H., and Jiang, J. A. (2008). Optimal placement of capacitors in distribution systems using an immune multi-objective algorithm. Int. J. Electr. Power Energy Syst. 30 (3), 184–192. doi:10.1016/j.ijepes.2007.06.012
Liang, R.-H., and Liao, J.-H. (2007). A fuzzy-optimization approach for generation scheduling with wind and solar energy systems. IEEE Trans. PWRS 22 (4), 1665–1674. doi:10.1109/tpwrs.2007.907527
Mekhamer, S. F., Soliman, S. A., Moustafa, M. A., and El-Hawary, M. E. (2003). Application of fuzzy logic for reactive-power compensation of radial distribution feeders. IEEE Trans. Power Syst. 18 (1), 206–213. doi:10.1109/tpwrs.2002.807037
Mizadeh, A., and Taghizadegan, N. (2017). Robust optimisation approach for bidding strategy of renewable generation-based microgrid under demand side management. IET Renew. Power Gener. 11 (11), 1446–1455. doi:10.1049/iet-rpg.2017.0076
Mohamed Shuaib, Y., Surya Kalavathi, M., and Christober Asir Rajan, C. (2015). Optimal capacitor placement in radial distribution system using Gravitational Search Algorithm. Int. J. Electr. Power Energy Syst. 64, 384–397. doi:10.1016/j.ijepes.2014.07.041
Parvaneh, M. H., Moradi, M. H., and Azimi, S. M. (2023). The advantages of capacitor bank placement and demand response program execution on the optimal operation of isolated microgrids. Electr. Power Syst. Res. 220, 109345. doi:10.1016/j.epsr.2023.109345
Rahmani-andebili, M. (2016). Simultaneous placement of DG and capacitor in distribution network. Electr. Power Syst. Res. 131 (Feb), 1–10. doi:10.1016/j.epsr.2015.09.014
Rahnamayan, S., Tizhoosh, H. R., and Salama, M. M. A. “Quasi Oppositional differential evolution,” in In proceeding of IEEE congress on evolu. Comput. CEC 2007, 25th-28th September, 2007, 2229–2236.
Shaheen, M. A. M., Ullah, Z., Hasanien, H. M., Tostado-V´eliz, M., Ji, H., Qais, M. H., et al. (2023). Enhanced transient search optimization algorithm-based optimal reactive power dispatch including electric vehicles. Energy 277, 127711. doi:10.1016/j.energy.2023.127711
Sultana, S., and Roy, P. K. (2014). Optimal capacitor placement in radial distribution systems using teaching learning based optimization. Int. J. Electr. Power Energy Syst. 54, 387–398. doi:10.1016/j.ijepes.2013.07.011
Taher, S. A., and Bagherpour, R. (2013). A new approach for optimal capacitor placement and sizing in unbalanced distorted distribution systems using hybrid honey bee colony algorithm. Int. J. Electr. Power Energy Syst. 49 (Jul), 430–448. doi:10.1016/j.ijepes.2013.02.003
Tizhoosh, H. R. (2005a). Opposition-based learning: a new scheme for machine intelligence. Proc int conf Comput. intell Model. control autom 1, 695–701. doi:10.1109/CIMCA.2005.1631345
Tizhoosh, H. R. (2005b). “Reinforcement learning based on actions and opposite actions,” in Proc. ICGST int conf artif intell mach learn, Cairo, Egypt.
Tolabia, H. B., Lashkar Ara, A., and Hosseini, R. (2020). A new thief and police algorithm and its application in simultaneous reconfiguration with optimal allocation of capacitor and distributed generation units. Energy 203, 117911. doi:10.1016/j.energy.2020.117911
Yao, X., Liu, Y., and Lin, G. (1999). Evolutionary programming made faster. IEEE Trans. Evol. Comput. 3, 82–102. doi:10.1109/4235.771163
Yasin Ghadi, Y., Kotb, H., Aboras, K. M., Alqarni, M., Yousef, A., Dashtdar, M., et al. (2023). Reconfiguration and displacement of DG and EVs in distribution networks using a hybrid GA–SFLA multi-objective optimization algorithm. Front. Energy Res. 11, 1304055. doi:10.3389/fenrg.2023.1304055
Yousefi, A., Iu, H., Fernando, T., and Trinh, H. (2013). An approach for wind power integration using demand side resources. IEEE Trans. Sustain. Energy 4 (4), 917–924. doi:10.1109/tste.2013.2256474
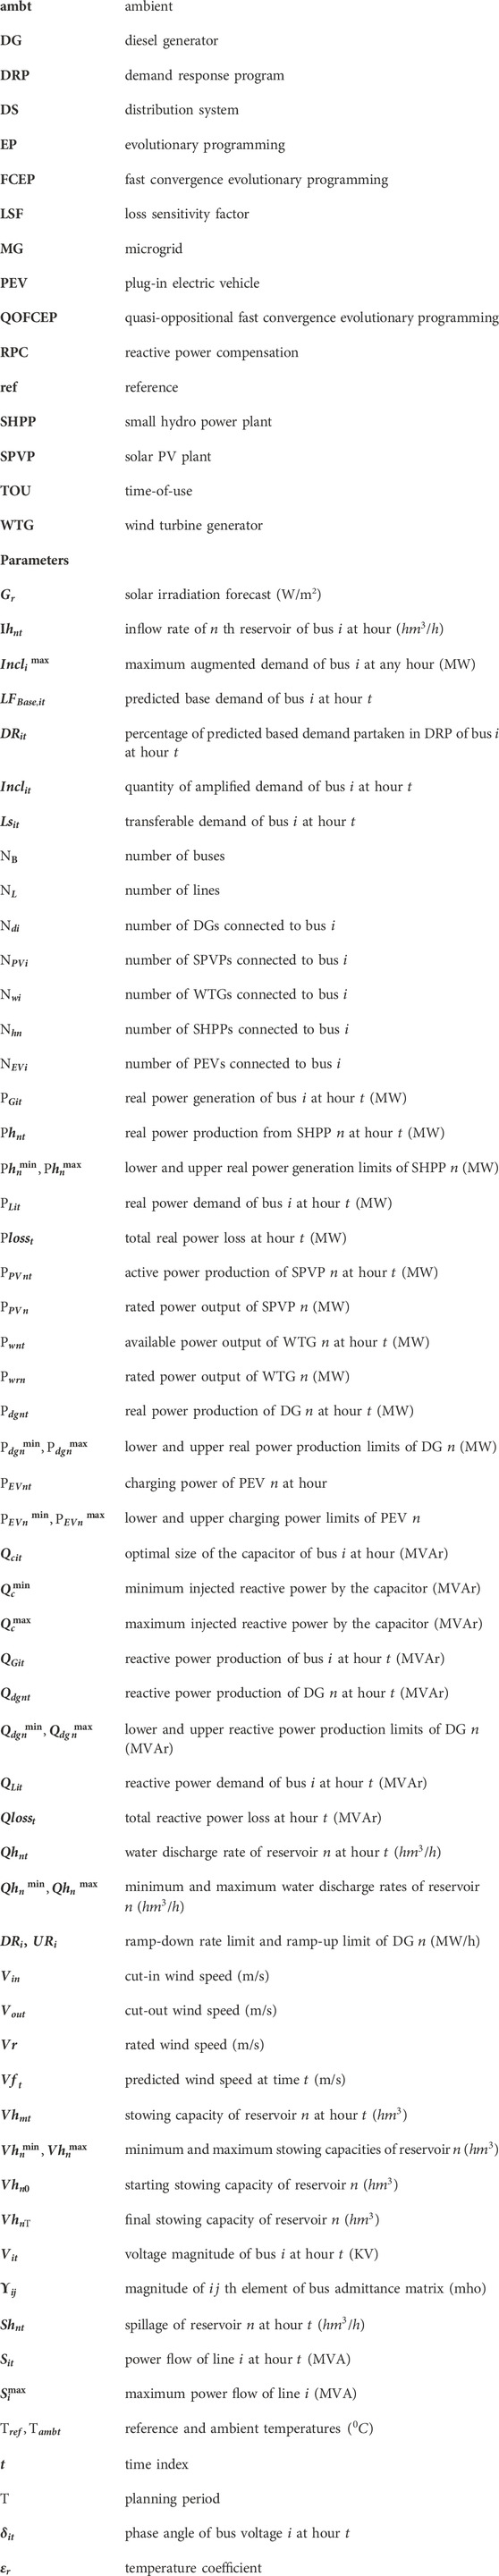
Nomenclature
Keywords: reactive power compensation, capacitor allocation, isolated microgrid, demand response program, optimization
Citation: Basu M, Jena C, Khan B, Ali A and Khurshaid T (2024) Optimal sizing and placement of capacitors in the isolated microgrid throughout the day considering the demand response program. Front. Energy Res. 12:1346330. doi: 10.3389/fenrg.2024.1346330
Received: 29 November 2023; Accepted: 27 February 2024;
Published: 11 April 2024.
Edited by:
Deepak Kumar, Birla Institute of Technology, Mesra, IndiaReviewed by:
Masoud Dashtdar, Islamic Azad University, Bushehr, IranMohamed Shaheen, Future University in Egypt, Egypt
Copyright © 2024 Basu, Jena, Khan, Ali and Khurshaid. This is an open-access article distributed under the terms of the Creative Commons Attribution License (CC BY). The use, distribution or reproduction in other forums is permitted, provided the original author(s) and the copyright owner(s) are credited and that the original publication in this journal is cited, in accordance with accepted academic practice. No use, distribution or reproduction is permitted which does not comply with these terms.
*Correspondence: Baseem Khan, YmFzZWVtLmtoYW4wNEBnbWFpbC5jb20=; Tahir Khurshaid, dGFoaXJAeW51LmFjLmty