Abstract
Climate change imposes tighter limits on carbon emissions, which require the development of more green electricity. Deep sea wind power has the advantages of high wind energy density, high power generation utilization hours, no land occupation, and near to power load centers for easy on-site consumption, which lead to a broad market prospect. In the foreseeable future, deep sea wind power will usher in large-scale construction and development. The initial investment and construction cost of deep sea wind power is high, subsidies are gradually decreasing, and there is a lack of full life cycle economic analysis combined with various market policies, resulting in a lack of guidance for its investment and construction. In order to promote the development of deep sea wind power, relevant cost recovery mechanisms must be found. This paper proposes a system cost allocation method based on the comparative difference method and load similarity with consideration of the transformation and operation costs of thermal power, demand-side response, and energy storage; a cost allocation method based on carbon trading and green certificate trading income is proposed; and a time sequence optimization operation simulation model is established to maximize the deep sea wind power income. A case study is proposed for a 300 MW deep sea wind farm, the results show that the cost allocation method and cost allocation model proposed in this paper have a significant effect on wind power cost recovery, and the effectiveness of the proposed method and model is verified.
1 Introduction
In recent years, the development of global offshore wind power has shown the characteristics of clustering, large scale, and deep sea (Huang et al., 2019). Deep sea wind power has high wind energy density, stable wind speed, large development potential, high power generation utilization hours, does not occupy land, and is close to the power load center. The development of offshore wind power is of great significance to achieving the goals of carbon peaking and carbon neutrality. However, the investment cost of far-reaching wind power has remained high due to reasons such as the long distance and the deep water level of construction. At the same time, due to the random fluctuation characteristics of wind power, more flexible resources need to be built, which further increases the cost of wind power and weakens its competitiveness in participating in the electricity market. In the current context of the decline of new energy subsidies, how to reduce the cost of deep sea wind power and improve its competitiveness in participating in the power market is an urgent problem that needs to be solved in the field of deep sea wind power development.
In order to more comprehensively assess the economics and market competitiveness of wind power, some scholars have introduced full life cycle costs to guide power costs and provide a basis for calculating annual cash flow (HOANG et al., 2018; Mytilinou and Kolios, 2019; Yu et al., 2020). Wanchun et al. (2021) considered the actual operating costs such as operation and maintenance of deep sea wind power on the basis of the whole life cycle cost, but the economic analysis was not combined with the benefits. Based on the current development status and future trends, development strategies and suggestions are proposed for offshore wind power resource evaluation, supporting policies and subsidy mechanisms in (Zhu et al., 2021). Yang et al. (2022) aimed at the fixed cost allocation problem of offshore wind farm grid-connected systems under multi-party investment, a fixed cost allocation method for offshore wind farm integrated systems that considers the correlation of wind power output proposed. Economic analysis of deep sea wind power is provided in Xue et al. (2023). Existing research mainly considers the life cycle costs and power generation benefits of wind power projects, but the latest carbon trading and green certificate trading markets have not yet been considered. It is urgent to introduce the latest market mechanisms to conduct a comprehensive quantitative analysis on the benefits and economics of offshore wind power throughout its life cycle.
Carbon trading and green certificate trading are important means and mechanisms to achieve low carbon and economy in the power system under the goals of carbon peaking and carbon neutrality. Currently, many researchers at home and abroad have conducted some basic research on carbon trading and green certificate trading mechanisms and published relevant research results. Zhao et al. (2023) established a two-layer planning model of the power system based on carbon emission trajectory constraints under the low-carbon economy. This model takes into account the economic benefits and demand-side response constraints brought about by the carbon trading mechanism on the basis of the basic carbon emission quota and optimizes investment, operation, and fuel consumption. The planning model was solved, and its economics was verified with the goal of minimizing comprehensive costs such as consumption, but the synergy between carbon trading and the green certificate trading market was not considered. Zhang Mingming et al. analyzed the impact of ETSs on the development of renewable energy, and a spatial Durbin model (SDM) is used to explore the spatial spillover effects of China’s ETS on the development of renewable energy in Zhang et al. (2022a). A real option model considering carbon price fluctuation is proposed as a tool for renewable energy investment in Li et al. (2018). Considering optimal investment timing and carbon price, the model introduces a carbon price fluctuation as part of the optimization and studies the flexibility of enterprises’ delayed investment under the fluctuation of carbon price. Aiming at the bidding problem of wind power, thermal power, and energy storage participating in the electric energy–frequency regulation composite market, considering the impact of different wind speeds and based on improved flexible evaluation strategies and random games, wind-fire-storage multilateral bidding model was established to improve the competition in the wind power market in XIaolin et al. (2023). Bai et al. (2019) and JI et al. (2020) introduced carbon trading into the renewable energy planning model to solve the problem of high investment and low returns of renewable energy in power source planning. A low-carbon economic power planning model with the largest comprehensive benefits from electricity sales, carbon trading, green certificate trading, system planning investment, and operating costs is established in Bai et al. (2019), and a power planning model that takes into account carbon trading and energy efficiency power plant costs with the goal of minimizing unit construction costs, virtual energy efficiency power plant costs, unit operating costs, and carbon trading costs is established in JI et al. (2020) considering demand-side response as a virtual energy efficiency power plant. Zhang et al. (2021) established an economic environment dispatch model including green certificate trading and carbon trading considering wind power curtailment penalties and gas pollutant emission costs, and the impact of different wind power quotas is also studied for wind power participating in the electricity market. Green certificate trading and carbon trading are introduced into the optimal dispatch of virtual power plants, while taking into account the response characteristics of high-energy-consuming industrial loads. A demand–response dispatch model with source–load coordination and complementation was established, which verified that green certificate trading and carbon trading can promote new energy consumption (Yuan et al., 2022). Chen et al. (2023) established an electricity–carbon coupling market model considering the dynamic changing characteristics of carbon trading supply and demand to study and analyze the differences in trading results under different carbon market development levels and different new energy output characteristics. An optimal day-ahead dispatch model for photovoltaic storage power stations participating in the power market, carbon trading market, and ancillary service market was established in Wang et al. (2022) to scheduling issues of photovoltaic and storage power stations in the electricity market. The research results show that the carbon market can promote consumption of photovoltaic. The abovementioned research is mainly carried out from the perspective of the contribution of green certificate trading and carbon trading to the consumption of renewable energy and does not take into account the impact of the introduction of these two market mechanisms on allocation of the system operating costs of new energy access. At the same time, in terms of the system operation costs that different wind farms need to hold, there are few studies to quantify the system costs that each wind farm needs to bear based on the mismatch degree between wind power output and load.
In order to promote more stakeholders to actively participate in deep sea wind power construction and operation, in view of the current problems of unclear conceptual indicators, imperfect cost calculation methods and imperfect cost-sharing mechanisms in the economic evaluation of deep sea wind power, a system cost calculation method based on the comparative difference method has been proposed in this paper, which allocates deep sea wind power costs through a cost fluctuation function based on load similarity. In terms of the role of market mechanisms such as carbon trading and green certificate trading in new energy consumption (HU, 2021; GUO et al., 2022; Nan et al., 2023), the mechanisms ease the cost of deep sea wind power. A time-series operation simulation model with the goal of maximizing the revenue of deep sea wind power with consideration of electricity price revenue, carbon trading, and green certificate trading income is established, and the full life cycle cost and investment payback period of typical deep sea wind power were calculated. The sensitivity of key influencing factors is analyzed. The research results help systematically and comprehensively evaluate the development and utilization costs of deep sea wind power, reveal the impact of new power markets such as carbon trading and green certificate trading on the economics of deep sea wind power, and provide an important reference for investment and planning of deep sea wind power.
2 System cost model and allocation method for deep sea wind power
Due to the strong volatility and randomness, deep sea wind power may have an impact on the power supply adequacy, safety, and stability of the power grid and places higher demands on system flexibility. Traditional thermal power units need to be transformed, and the flexible resources such as demand-side response and energy storage are used to ensure the power balance of the system. The corresponding thermal unit modification and upgrade costs, production and operation costs, and flexible resource operation costs all belong to the system costs of deep sea wind power access.
In order to quantitatively analyze the system transformation and operation costs caused by the integration of deep sea wind power into the grid, the comparative difference method (HU, 2021) is used to construct a thermal power scenario, in which thermal power replaces deep sea wind power to meet the load power demand, and the system cost of the deep sea wind power in this scenario is calculated. The system costs analyzed include the transformation and construction costs of thermal power and operation and regulation costs of flexible resources such as demand-side response and energy storage.
2.1 Thermal power flexibility transformation and operating costs
The flexibility transformation of thermal power units mainly involves low-load stable combustion, stable combustion burner transformation, hot primary air heating transformation, etc. An analysis model for the flexibility transformation and operation cost of thermal power units based on the flexibility transformation costs of thermal power units is established.
The function of the flexibility modification cost of thermal power units with respect to the modification capacity is as follows:
where is cost thermal power flexibility modification and is the thermal power unit modification capacity. , , and are the corresponding coefficients.
The thermal power unit can be obtained by is the modification capacity of the kth thermal power unit and is the percentage decline in the technical output of the corresponding thermal power unit. The average retrofit cost cost of thermal power unit is shown in Table 1.
TABLE 1
| Unit capacity infimum/MW | Unit capacity supremacy/MW | Average retrofit cost/(Thousand CNY/MW) |
|---|---|---|
| 0 | 200 | 204.9 |
| 201 | 350 | 769.8 |
| 351 | 660 | 714.9 |
| 661 | 2000 | 420.7 |
Average retrofit cost of thermal power unit.
The coal consumption cost of thermal power units during operation can be calculated by the following quadratic function (Haoliang et al., 2020):
where is the thermal power operation cost; is the average output power; and , , and are the corresponding coefficients. The typical values are shown in the following table. The coal consumption operating cost coefficient of thermal power unit is shown in Table 2.
TABLE 2
| Unit capacity/MW | aop | bop | cop |
|---|---|---|---|
| (660,+∞) | 0.0072 | 242.85 | 15000 |
| (300,660) | 0.03 | 249 | 10500 |
| (200,300) | 0.03165 | 247.5 | 10200 |
| (180,200) | 0.03165 | 253.5 | 10200 |
| (150,180) | 0.03165 | 277.5 | 10200 |
| (135,150) | 0.1068 | 288.9 | 5,550 |
| (125,135) | 0.1068 | 318.9 | 5,550 |
| (100,125) | 0.1068 | 333.9 | 5,550 |
| (0.100) | 0.06195 | 358.8 | 6,600 |
Coal consumption operating cost coefficient of the thermal power unit.
2.2 Demand-side response retrofit and operating costs
In order to improve the flexibility of the power system, relevant control equipment must be configured on the demand side. At the same time, user response compensation needs to be given during the dispatching of user-side resource responses. This is the operating cost of demand-side response retrofit.
The investment cost of demand-side response transformation mainly includes the cost of control and communication equipment, equipment installation costs, and the cost of building a monitoring center for monitoring users participating in the demand response. It can be obtained by
where N is the number of customers participating in the demand-side response project and M is the number of control centers. C1 is the control equipment price, C2 is the price of the communication device, C3 is the device installation fee for each customer, C4 is the total construction fee of a monitoring center, and CM is the management cost of the demand-side response project.
The management expenses of demand-side response projects refer to the various expenses incurred by power companies in organizing and managing the daily operation of demand-side response projects. Management expenses are generally allocated based on avoidable capacity. It can be obtained by
where μ is the unit power management fee and Pt is the demand-side response power.
According to the characteristics and ability of loads to participate in the demand-side response, they can be divided into three types (
Liu et al., 2023).
1. Reducible load: the load that can be partially adjusted or completely removed according to the actual situation.
2. Shiftable load: the load that cannot be interrupted but can be adjusted to the load of other time periods as a whole.
3. Transferable load: the electrical energy required within a certain period of time is fixed, but the load at each moment can vary within a limited range.
The compensation for load participation in the demand response is as follows:
where Ccut, Cshift, and Ctrans are total compensation for reducible load, shiftable load, and transferable load, respectively. Ccut, cshift, and ctrans are unit power compensation. Pcut, Pshift, and Ptrans are the demand response capacity of reducible load, shiftable load, and transferable load, respectively.
The total cost of the demand-side response is as follows:
where on,c,t, on,s,t, and on,t,t are unit operation costs of reducible load, shiftable load, and transferable load, respectively. Pn,c,t, Pn,s,t, and Pn,t,t are real time power of reducible load, shiftable load, and transferable load at time t, respectively.
2.3 Energy storage system construction and operation costs
The construction investment cost of an energy storage system includes power cost and capacity cost. Power cost refers to the cost of power-related equipment such as inverters, while capacity cost refers to the material cost incurred in order to achieve the corresponding electrical energy storage capacity. The investment cost per year during the life cycle of the energy storage system is as follows (Xu et al., 2021; Liu et al., 2023):
where Cin is the annual investment of the energy storage system, Cp is the unit price of the energy storage system power device, PESS is the rated power, η is charging and discharging efficiency, Ce is the unit price of capacity, EESS is the rated capacity, r is the internal return rate, and n is the energy storage system life year, typically 30 years.
The operating cost of energy storage includes the material cost and labor cost of maintenance. The calculation method is as follows:
where oE,ESS,t is the operation and maintenance cost for unit capacity, EESS,t is the electricity amount at time t, oE,ESS,t is the operation and maintenance cost for unit power, and PESS,t is the operation power at time t.
2.4 Deep sea wind system cost allocation method
The output of deep sea wind farms in different regions is complementary, and the volatility of wind farms of different capacity in the same region has different impacts on power grid production. The higher the similarity between wind power fluctuation characteristics and load fluctuation characteristics, the smaller the impact on system regulation; therefore, this paper further combines the load similarity-based allocation method to allocate the above system costs (Peng et al., 2021). The wind power fluctuation cost allocation coefficient can be expressed as follows:
where Cinst is the installed wind farm capacity and S is the overall difference index of the wind farm output curve. Based on this method, wind farms that are significantly different from the system load fluctuation characteristics will bear more system costs, while wind farms with smaller differences will bear less system costs.
3 System cost allocation method for deep sea wind power
With the promotion and gradual development and maturity of carbon trading and green certificate trading markets, far-reaching offshore wind power can not only obtain income from traditional grid-connected electricity prices but also obtain income from participating in carbon trading and green certificate trading markets to ease development costs.
3.1 Model of carbon trading income
At present, the baseline method to allocate carbon emission rights quotas is used in China. The calculation formula for income from deep sea wind power participating in carbon emission rights trading is as follows:
where FCET is the carbon trading income, αCET is the carbon price, βCET is the power grid carbon emission coefficient, and PCET is the total electricity participating in carbon trading.
3.2 Model of green certificate trading income
The calculation method for the income from deep sea wind farm participation in green certificate transactions is as follows:
where FGCT is the green certificate trading income, αGCT is the green certificate price, βGCT is the green certificate and clean power generation conversion coefficient, and PGCT is the total electricity participating in green certificate trading.
4 Deep sea wind power optimization model
This paper combines the benefits of deep sea wind power in the on-grid electricity price, carbon trading, and green certificate trading market. A time-series simulation model for maximum deep sea wind power income is established based on the construction and operation costs of deep sea wind power, thermal power unit retrofit and operation costs, demand-side response and energy storage system construction, and operation costs. The flexible retrofit capacity of coal power, energy storage, demand-side response in the system, and the time series output throughout the year and the corresponding benefits are obtained.
4.1 Objective function
First, establish an objective function with the goal of maximizing the revenue of the deep sea wind power system:
where F is the wind power system income, p is the power of the correspondence power unit, ct is the wind power on-grid price, and Cco is the system cost which can be obtained as follows:
where n is the number of power buses, Cim,h is the thermal power retrofit cost, nc is the number of cables, Cf is the demand-side response retrofit cost, w is the deep sea wind turbine number, s is the energy storage system number, c is the equivalent annual value conversion factor, o means the operation cost, p is the unit power, U and D are the start-up and shut-down cost of the thermal power unit, respectively, Hn is the energy storage system capacity, is the initial energy storage system capacity, is the line capacity, and is the initial value.
4.2 Constraints
(1) Node power balance constraint
where
Ln,tis the load of
nth bus at time t,
Pn,h,tis the thermal power output,
Pn,s,tis the charging power and
Fn,s,tis the discharging power,
Pn,w,tis the wind power output,
Pn,o,tis the output of other power unit, and
Pn,l,tis the line loss.
(2) Deep sea wind power output constraint
where
Pw,maxis the maximum output of the wind power unit.
(3) Deep sea wind power utilization rate constraint
where α is the deep sea wind power utilization rate.
(4) Energy storage system charging constraint
(5) Energy storage system discharging constraint
(6) Energy storage system state of charge (SOC) constraint
where
is the energy storage system state of charge and
rn,sis the continuous discharging time.
(7) Energy storage system energy balance constraint
where is the energy loss, is the charging loss, and is the discharging loss. For pumped hydro, is natural water in amount and is natural water out amount.
5 Results and discussion
5.1 Validity verification of the system cost allocation coefficient method
This article first calculates and verifies the apportionment coefficient for two 300-MW wind farms. The typical daily output curve of the selected wind farm and load curve are shown in Figure 1. The time resolution of the wind farm output curve is 5 min. The wind power fluctuation cost allocation method proposed in this article is used to allocate costs in a multi-wind farm scenario.
FIGURE 1

Typical daily output and load curves of wind farms in a certain area.
It can be seen from the curve fluctuations in Figure 1 that in the two intervals of 0–4 a.m. and 12–16 p.m., both wind farm 1 and wind farm 2 show a certain anti-peaking characteristic, while at the intervals of 4–8 a.m. and 16–20 p.m., the output of wind farm 1 shows a significant anti-correlation characteristic to the load curve, and the output of wind farm 2 shows a certain positive correlation characteristic to the load curve. Overall, the reverse fluctuation characteristics of wind farm 1 are more obvious than that of wind farm 2, and it should bear more adjustment costs.
In the example verification, the proportions of the fluctuation change rate difference measure and the fluctuation amplitude difference measure were set as 0.8 and 0.2, respectively. Based on the wind farm output volatility cost allocation calculation method based on the fluctuation similarity theory proposed in this article, the simulation results of wind power fluctuation cost sharing coefficients of each wind farm are shown in Table 3.
TABLE 3
| Wind farm | Fluctuation change rate difference measurement | Fluctuation amplitude difference measurement | Fluctuation overall difference measurement | Fluctuation cost allocation coefficient |
|---|---|---|---|---|
| Wind farm 1 | 0.5161 | 1 | 0.6129 | 0.5213 |
| Wind farm 2 | 0.4974 | 0.8225 | 0.5625 | 0.4784 |
Cost allocation coefficient of each wind farm output fluctuation.
It can be seen from the table that the fluctuation overall difference of the load curve and output curve of wind farm 1 is 0.6129, while that of the load curve and output curve of wind farm 2 is 0.5625. The fluctuation cost sharing coefficient of 0.5213 and 0.4787, respectively.
Although the overall output curve of wind farm 1 is relatively stable, due to the four typical periods of 4 a.m.–8 a.m., 8 a.m. to 12 noon, 12 noon to 5 p.m., and 5 p.m.–11 p.m., the changes in output and load of wind farm 1 show anti-peaking characteristics, so its fluctuation cost allocation coefficient is higher than that of wind farm 2.
The analysis shows that the fluctuation cost allocation calculation method used in this article can not only reflect the stability of the wind power output curve but also reflect the degree of difference and follow-up of the output curve of each wind farm with respect to the electric load curve. The theoretical foundation was laid for the system cost allocation model.
5.2 Source–load storage coordinate optimization results
The thermal power installed capacity, carbon emission factors, and other relevant information used in the simulation calculation are shown in Table 4.
TABLE 4
| Item | Value |
|---|---|
| Thermal power capacity (MW) | 97272 |
| Maximum load (MW) | 106923 |
| Annual utilization hour | 1973 |
| Wind farm capacity (MW) | 300 |
| Offshore distance (km) | 120 |
| Power grid carbon emission factor (tCO2/MWh) | 0.5810 |
| Green certificate price (CNY) | 50 |
| Carbon emission trading price (CNY/t) | 20 |
| Electricity price (CNY/kWh) | 0.388 |
Parameters of the case study system.
The output curve and load curve of the wind farm are shown in Figure 2:
FIGURE 2

Output curve of wind farm and total load curve.
In order to analyze the operating costs and output characteristics of the system under the connection of deep sea wind power, a scenario in which thermal power units are used to replace the analyzed deep sea wind farms is constructed, which is called as the thermal power scenario, and the scenario in which deep sea wind power is connected is called as the wind power scenario. Combined with the system cost calculation method, the output curves of thermal power output, energy storage, and demand-side response in thermal power scenarios and wind power scenarios are shown in Figure 3.
FIGURE 3

Curves of source, storage, and load output under different scenarios. (A) Output curve of thermal power in different scenario. (B) Output curve of energy storage system in different scenario. (C) Demand side response curve.
It can be seen that the upper and lower limits of thermal power output in the wind power scenario are larger than that in the thermal power scenario, and the peaking depth is increased, leaving more sufficient space for consumption of deep sea wind power. This also shows that in order to absorb deep sea wind power, thermal power units pay a greater cost in operation, resulting in corresponding system operation costs.
In the wind power scenario, the energy storage is charged at night when the deep sea wind farm is generating electricity and is discharged during the daytime load peak. In the thermal power scenario, the thermal power unit that replaces the deep sea wind farm at night does not need to output or is in a low output state, and the charging power of the energy storage system is small.
The demand-side response curves in the wind power scenario and the thermal power scenario are consistent. They mainly respond to system dispatching needs when new energy is insufficient in winter and power consumption peaks in summer. It also reflects that the current demand-side response mechanism has a low degree of participation in system regulation.
5.3 System benefit analysis
The system parameters such as thermal power transformation capacity, demand response capacity, and energy storage capacity under the wind power scenario and thermal power scenario and the corresponding flexibility construction investment and operating cost parameters are detailed in Table 5.
TABLE 5
| Retrofit | Capacity | Investment (Million) | Annual investment (Million) | Annual operation (Million) | Annual total (Million) | |
|---|---|---|---|---|---|---|
| Wind power scenario | Thermal | 9727 MW | 690 | 61 | 15603 | 156.64 |
| Demand response | 1000 MW | 10008 | 889 | 2.6 | 8.916 | |
| Energy storage | 12.9 GW/49.2 GWh | 8,265 | 734 | 4.9 | 7.389 | |
| Total | 13 GW | 18963 | 1,684 | 15610 | 172.95 | |
| Thermal power scenario | Thermal | 9727 MW | 690 | 61 | 15550 | 15511 |
| Demand response | 1000 MW | 10008 | 889 | 2.6 | 891.6 | |
| Energy storage | 12.8 GW/48.7 GWh | 8,187 | 727 | 4.8 | 731.8 | |
| Total | 12.9 GW | 18195 | 1,616 | 15560 | 17134 |
Cost analysis of various flexible resources.
Compared with the wind power scenario, the total system cost in the thermal power scenario was reduced by 161 million yuan, a decrease of 0.94%. By incorporating the output curves of each wind farm into the apportionment coefficient calculation model, it can be obtained that the apportionment coefficient and cost of the selected deep sea wind farm are 0.0652 and 10.497 million yuan, respectively.
According to the deep sea wind farm cost calculation method proposed in the literature (Xu et al., 2021), it can be found that the static cost of the deep sea wind farm is 4.847 billion yuan, and the annual dynamic cost of operation, maintenance, and losses is about 157 million yuan.
After further considering deep sea wind farm participating in carbon trading and green certificate trading, the annual income of the wind farm is shown in Table 6.
TABLE 6
| Item | Value |
|---|---|
| On-grid price/(CNY/kWh) | 0.39 |
| Electricity generation/MWh | 809832.00 |
| Electricity selling income (million) | 314 |
| Carbon trading amount (thousand t) | 470.5 |
| Carbon trading income (million) | 22.58 |
| Green certificate trading income (million) | 40 |
| Total income (million) | 377 |
| Static cost (million) | 4,847 |
| Annual static cost (million) | 431 |
| Dynamic cost (million) | 157 |
| System cost (million) | 104972 |
| Net income (million) | 210 |
| Payback period (year) | 23.10 |
Wind farm annual income analysis.
From the data shown in Table 6, it can be seen that among the revenue of the deep sea wind farm, the electricity price income is 314 million yuan, accounting for 83% of the total revenue of 377 million yuan. It is the main supporting part of the cost recovery of the deep sea wind farm. Carbon trading and green certificate trading income are 22.58 million yuan and 40 million yuan, respectively, accounting for 6% and 10.7%, respectively, which has a certain supporting effect on the income of the deep sea wind farm.
It can also be seen from the table that according to the current costs and benefits, the investment payback period of the deep sea wind farm is 23 years, which is close to or even exceeds the service life of some wind farms, which greatly restricts the investment motivation of wind farm investors. The main reason for this situation is that the current investment and construction costs and operation and maintenance costs of deep sea wind power are still relatively high. In the future, with the improvement of related equipment and construction and installation technology, investment costs will be reduced to a certain extent.
At the same time, with large-scale development of offshore wind power clusters, wind farm groups can use shared resources to strengthen the sharing of operation and maintenance services and reduce operation and maintenance costs.
In addition, the current domestic carbon trading, green electricity trading, and green certificate trading markets are immature, and the prices of related products are relatively low. With the advancement of carbon peak and carbon neutrality, carbon prices and green certificate prices will still rise significantly. Compared with the EU carbon market, there is still a lot of room for growth in the benefits derived from deep sea wind power participating in carbon trading and green certificate trading. From this perspective, promoting and improving the development of carbon trading and green certificate trading markets is of positive significance for realizing the cost reduction of deep sea wind power and promoting the construction of deep sea wind power.
5.4 System benefit influence factor analysis
Since the current green certificate trading and carbon trading markets are still in the early stages of construction and lack a complete market price system, it is considered that future electricity prices, green certificate trading unit prices, and carbon trading unit prices may further change. Combined with the European carbon trading unit price of 55–90 euros/ton (equivalent to about CNY 440–663/ton), further analysis of the system annual net income and static investment payback period under different transaction price levels is shown in Figures 4–6.
FIGURE 4

Impact of electricity price on revenue and return on investment.
FIGURE 5
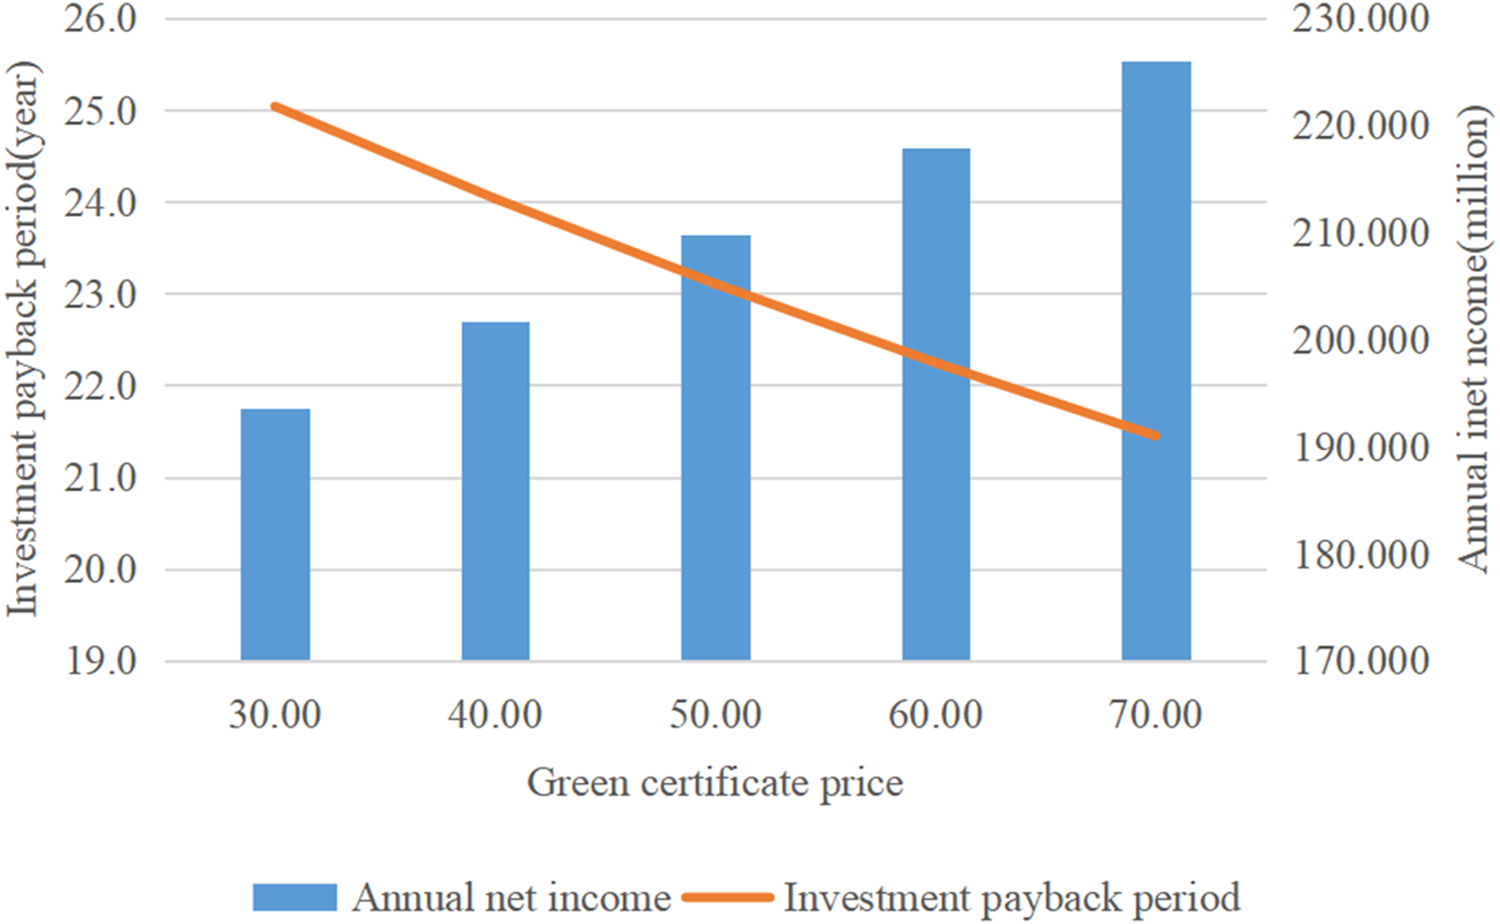
Impact of green certificate price on revenue and return on investment.
FIGURE 6

Impact of carbon price impact on revenue and return on investment.
According to Figures 4–6, as the on-grid electricity price, green certificate price, and carbon trading price of deep sea wind power rise, the annualized income of deep sea wind power shows an upward trend, while the investment payback period shows a downward trend.
The investment payback period of the deep sea wind power is mainly affected by the on-grid price of electricity. The main reason is that the wind farm generates large amounts of electricity. The increase in the on-grid electricity price can significantly increase the annual income of the wind farm. Although green certificate trading can also increase part of the income of deep sea wind power, due to the small trading volume of green certificates and small price changes, it will have little impact on the overall income and price payback period of deep sea wind power.
In terms of carbon trading, domestic carbon trading costs are significantly lower than those in Europe. Considering that the global carbon market will have price convergence in the future, if the carbon trading price in Europe is used for settlement, the investment payback period of deep sea wind power will be significantly reduced to about 10 years.
Taking into account the rising trend of electricity prices in the future and the improvement of green certificate trading and carbon trading market mechanisms in the future, the benefits of deep sea wind power participating in the power market are expected to further increase, thus effectively reducing the costs of deep sea wind power development.
In addition, we can further explore channels such as energy islands, oil and gas exploration, and offshore hydrogen production to enrich and develop the business model of deep sea wind power, improve the economic benefits of deep sea wind power, and promote the development of deep sea wind power.
6 Conclusion
This paper conducts a modeling analysis of the system costs of deep sea wind power access, introduces a system cost allocation method based on load similarity, and proposes a cost management method for deep sea wind power that considers carbon trading and green certificate trading.
With the goal of maximizing the income of deep sea wind power, a system optimization operation model is established. The components of wind farm income, investment payback years, and factors affecting income are analyzed through time-series simulation. It is verified that the method proposed in this article is effective in alleviating the cost of deep sea wind power.
The research in this article has the following conclusions.
a. The cost of the deep sea wind power system is 0.94% higher than the cost of the thermal power scenario system.
b. Electricity selling income accounts for 83% of the total revenue from deep sea wind power and is the most important component of cost recovery.
c. The green certificate market and carbon trading market have significant effects in supporting the recovery of investment costs in far-reaching offshore wind power.
d. In the future, the investment payback period of deep sea wind power will be mainly affected by the on-grid electricity price and carbon trading price. The investment payback cost is expected to be reduced to 10 years in the future.
Statements
Data availability statement
The original contributions presented in the study are included in the article/Supplementary Materials, further inquiries can be directed to the corresponding author.
Author contributions
GX: methodology and writing–original draft. WN: conceptualization and writing–review and editing. CC: software and writing–review and editing. YW: validation and writing–review and editing. XZ: formal analysis, investigation, and writing–review and editing.
Funding
The author(s) declare that financial support was received for the research, authorship, and/or publication of this article. This paper is supported by the Science and Technology Project of State Grid Jiangsu Electric Power Co., Ltd “Technical and economic analysis and business model research of deep sea wind power.” (No. J2022037).
Conflict of interest
Authors GX, WN, CC, YW, and XZ were employed by Economic and Technological Research Institute of State Grid Jiangsu Electric Power Co LTD.
The authors declare that this study received funding from State Grid Jiangsu Electric Power Co., Ltd. The funder had the following involvement in the study: Data collection.
Publisher’s note
All claims expressed in this article are solely those of the authors and do not necessarily represent those of their affiliated organizations, or those of the publisher, the editors, and the reviewers. Any product that may be evaluated in this article, or claim that may be made by its manufacturer, is not guaranteed or endorsed by the publisher.
References
1
Bai H. Yin S. Li H. Yang M. Wang F. Liu H. (2019). Optimal planning of multi energy stations considering Carbon trading cost. J. Electr. Power Sci. Technol.34 (01), 11–19. 10.19781/j.issn.1673-9140.2019.01.002
2
Chen Ye Yuting M. Wang B. Zhou Y. Yang Z. (2023). Electricity-carbon market clearing model considering dynamic carbon trading curve and analysis of Node marginal price composition mechanism. Power Grid Technol.47 (02), 613–624. 10.13335/j.1000-3673.pst.2022.1385
3
Chen X. Jiang Y. (2020). Wind power variability cost allocation method. Electr. Power Autom. Equip.40 (11), 99–106. 10.16081/j.epae.202010002
4
Guo S. Men X. Sun H. Zhang S. Sun W. (2022). China green electricity, green certificate and CCER comparative study on policy status and trends. Energy of China44 (03), 75–80. 10.3969/j.issn.1003-2355.2022.03.012
5
Haoliang X. U. Jin P. Jiang J. Zhou Y. (2020). A production-cost-simulation-based method for optimal planning of the grid interconnection between countries with rich hydro energy. J. Glob. Energy Interconnect.3 (4), 23–29. 10.1016/j.gloei.2020.03.002
6
Hoang T. K. Quéval L. Berriaud C. Vido L. (2018). Design of a 20-MW fully superconducting wind turbine generator to minimize the levelized cost of energy. IEEE Trans. Appl. Supercond.28 (4), 1–5. 10.1109/tasc.2018.2810309
7
Hu A. (2021). China's goal of achieving carbon peaks by 2030 and the main ways. J. Beijing Univ. Technol. Sci. Ed.2 (3), 1–15. 10.12120/bjutskxb202103001
8
Huang M. Wang X. Liu S. Wang X. Meng Y. Ye R. (2019). Technical and economical analysis of frequency division transmission applied to deep offshore wind power grid connection. Automation Electr. Power Syst. (5), 167–174. 10.7500/AEPS20180725005
9
Ji B. Liu Y. Zhu L. Li C. Cao B. (2020). Design of carbon emission permit trading mechanism in power industry based on consortium blockchain. Huadian Technol.42 (8), 32–40. 10.3969/j.issn.1674-1951.2020.08.005
10
Li Y. Wu M. Li Z. (2018). A real options analysis for renewable energy investment decisions under China carbon trading market. Energies11 (7), 1817. 10.3390/en11071817
11
Liu Y. Teng W. Gu Q. Sun X. Tan Y. Fang Z. et al (2023). Scaled-up diversified electrochemical energy storage LCOE and its economic analysis. Energy Storage Sci. Technol.12, 312–318. 10.19799/j.cnki.2095-4239.2022.0348
12
Mytilinou V. Kolios A. J. (2019). Techno-economic optimisation of offshore wind farms based on life cycle cost analysis on the UK. Renew. Energy132, 439–454. 10.1016/j.renene.2018.07.146
13
Nan S. Zheng C. Lu Z. Leng Y. (2023). Interaction principle and cohesive mechanism between electricity market, carbon market and green power certificate market. Power Syst. Technol.47 (01), 142–154. 10.13335/j.1000-3673.pst.2022.0375
14
Peng L. Wu D. Li Y. Liu H. Wang N. Zhou C. (2021). Optimal dispatch of multi-microgrids integrated energy system based on integrated demand response and stackelberg game. Proc. CSEE41 (04), 1307–1321+1538. 10.13334/j.0258-8013.pcsee.201845
15
Wanchun Q. Wenjia Z. Ying Q. Zongxiang L. (2021). “Technical and economic analysis of power collection and transmission schemes adapted to large-scale offshore wind farm,” in 2021 IEEE Sustainable Power and Energy Conference (iSPEC), Nanjing, China, December, 2021, 705–710.
16
Wang X. Zhao F. Liu B. Yan Lu Gao B. Fan J. (2022). Research on the bidding strategy of photovoltaic-storage combined power stations participating in electric power market considering the benefits of carbon emission reduction. Power Grid Technol.46 (11), 4208–4218. 10.13335/j.1000-3673.pst.2022.0300
17
Xiang X. Fan S. Gu Y. Ming W. Wu J. Li W. et al (2021). Comparison of cost-effective distances for LFAC with HVAC and HVDC in their connections for offshore and remote onshore wind energy. CSEE J. Power Energy Syst.7 (05), 954–972. 10.17775/CSEEJPES.2020.07000
18
Xiaolin G. Wanqiu F. Fu Y. Yi L. (2023). Joint bidding model of electricity and frequency regulation market with wind fire storage multi-agent games based on improved soft actor-critic. Power Syst. Technol.47 (05), 1920–1933. 10.13335/j.1000-3673.pst.2022.1641
19
Xu R. Zhang J. Liu M. Cao C. Chao X. (2021). Analysis of life cycle cost of electrochemical energy storage and pumped storage. Adv. Technol. Electr. Eng. Energy40, 10–18. 10.19705/j.cnki.issn2096-5125.2020.04.008
20
Xue G. Wu Y. Tan J. Chen C. (2023). “Economic analysis of deep offshore wind power based on load similarity,” in 2023 IEEE 6th International Electrical and Energy Conference (CIEEC), Hefei, China, May, 2023, 268–273.
21
Yang X. Cao B. Liu Z. Du Y. Guo L. Yang Z. et al (2022). “Caulis polygoni multiflori accelerates megakaryopoiesis and thrombopoiesis via activating PI3K/akt and MEK/ERK signaling pathways,” in 2022 5th International Conference on Energy, Electrical and Power Engineering (CEEPE), Chongqing, China, April, 2022, 1204–1209.
22
Yu D. Li H. Liu S. Fan X. (2020). Environmental economic dispatch of power system integrated with wind powerbased on an improved elowworm swarm optimization. J. Electr. Power Sci. Technol.35 (02), 84–92. 10.19781/j.issn.1673-9140.2020.02.011
23
Yuan G. Liu P. Tang F. Tian W. (2022). “Source-load” coordinated optimal dispatch considering green power certificate and carbon trading system. J. Sol. Energy Sinica43 (6), 190–195. 10.19912/j.0254-0096.tynxb.2020-1044
24
Zhang J. Yu P. Xu Z. Xu J. Zhu Z. (2021). Dynamic environmental economic dispatch of power system including wind power based on green certificate-carbon trading mechanism. Huadian Technol.43 (9), 69–77. 10.3969/j.issn.1674-1951.2021.09.009
25
Zhang M. Ge Y. Liu L. Zhou D. (2022a). Impacts of carbon emission trading schemes on the development of renewable energy in China: spatial spillover and mediation paths. Sustain. Prod. Consum.32, 306–317. 10.1016/j.spc.2022.04.021
26
Zhang Y. Chen N. Huang B. Wang C. Li J. (2022b). Methodology for calculating vre equivalent feed-in tariff based on system cost and its application. Electr. Power55 (02), 1–8. 10.11930/j.issn.1004-9649.202112074
27
Zhao W. Xiong Z. Yan P. Li F. Xu P. Lai X. (2023). Low-carbon planning of power system considering carbon emission flow. Automation Electr. Power Syst.47 (09), 23–33. 10.7500/AEPS20220530004
28
Zhu L. Zheng H. Ji H. Li G. Li H. Yao S. (2021). “Development trends and suggestions on offshore wind power of China,” in 2021 IEEE Sustainable Power and Energy Conference (iSPEC), Nanjing, China, December, 2021, 2043–2048.
Summary
Keywords
deep sea wind power, carbon trading, green certificate trading, life cycle economy, cost allocation
Citation
Xue G, Niu W, Chen C, Wu Y and Zhu X (2024) Research on the cost allocation method of deep sea wind power considering carbon trading and green certificate trading. Front. Energy Res. 12:1374524. doi: 10.3389/fenrg.2024.1374524
Received
22 January 2024
Accepted
29 April 2024
Published
24 May 2024
Volume
12 - 2024
Edited by
Donghui Zhang, Tsinghua University, China
Reviewed by
Haibo Li, Tsinghua University, China
Shu Zhang, Sichuan University, China
Enrico Maria Carlini, Terna SpA, Italy
Ding Feng, Southwest Jiaotong University, China
Updates
Copyright
© 2024 Xue, Niu, Chen, Wu and Zhu.
This is an open-access article distributed under the terms of the Creative Commons Attribution License (CC BY). The use, distribution or reproduction in other forums is permitted, provided the original author(s) and the copyright owner(s) are credited and that the original publication in this journal is cited, in accordance with accepted academic practice. No use, distribution or reproduction is permitted which does not comply with these terms.
*Correspondence: Guiyuan Xue, jsepcxuegy@126.com
Disclaimer
All claims expressed in this article are solely those of the authors and do not necessarily represent those of their affiliated organizations, or those of the publisher, the editors and the reviewers. Any product that may be evaluated in this article or claim that may be made by its manufacturer is not guaranteed or endorsed by the publisher.