 Lu Chao
 Lu Yu
Lu Yu- State Grid Shanghai Municipal Electric Power Company, Shanghai, China
Introduction: With the installation of advanced metering infrastructures, the operation data of EVs in the distribution networks can be obtained with time intervals of seconds and minutes. Based on these operation data, the impacts of integrating EVs into the distribution networks can be calculated and discussed.
Methods: In this paper, an improved clustering algorithm with a new distance index for the daily curves of different types of EVs was proposed. The different types of EVs can be classified into several typical groups and the required number of operation scenarios can be reduced. After reducing the large-scale database to typical clusters, research can be conducted on the characteristics of EVs specific to certain scenarios.
Results and discussion: In this way, the capability of integrating different types of EVs into the distribution network, such as fast EV charging stations, slow EV charging stations, and EV bus charging stations, is assessed from the perspective of load capacity size. The proposed clustering algorithm was verified with practical operation data.
1 Introduction
With the development of power electronics technology and advanced metering infrastructures, the ability of controlling and monitoring the loads in power systems was increasing in the past years. In addition, with the significant progress of communication technology, power system operators can collect a large amount of data which covers load curves, power demand, and user satisfy data to facilitate optimizing the operation schedule of the power systems (Si et al., 2021). The collected load data and the process of these data can help operators to analyze the characteristics of daily load curves, customer demand types, achieve more accurate load forecasting, and adjust the operation schedule in advanced (Chicco et al., 2004; Lang et al., 2019).
The electric vehicle (EV) has been regarded a kind of controllable loads and operation resources in power systems. The rapid growth in the number and capacity of EVs exerts a significant influence on power system operations, with the potential to affect grid stability, voltage regulation, and overall system reliability (Geth et al., 2012; Yao et al., 2014; Tu et al., 2019). The batteries installed on the EVs provide energy storage systems for the power systems. In this way, the EVs parking at the charging stations could provide operation flexibility by charging and discharging energy with power systems. When EVs are parked at charging stations, they can charge from or discharge into the power system, depending on the grid’s requirements. This bidirectional energy exchange can help balance supply and demand, improve grid resilience, and enhance the integration of renewable energy sources (Chen et al., 2018). The power and energy capacity for the batteries installed on the EVs varies a lot by different kinds of EVs and charging stations. As a consequence, identifying the types of EVs and charging stations is essential to determine the operation characteristics for EVs in the daily load curves. Furthermore, the precise types and numbers of EVs that will be parked at charging stations and connected to the power system at any given time are difficult to predict with complete accuracy (Moghaddam et al., 2018). In summary, the installation of EV charging stations introduces both opportunities and challenges for power systems. By understanding the characteristics of different EV types and charging stations, and by utilizing advanced metering and control technologies, grid operators can better manage the impact of EV charging on the power grid, ensuring efficient and reliable electricity service.
However, the analysis with large amount of data from the power systems were complex and difficult tasks. Such data were collected from various kinds of sensors in-stalled on the smart grid. On each bus in power systems, all the different types of loads are connected together and the behaviors of them will take effects on the load curve of the bus. In this way, the features captured from the load curves were consisted of different kinds of physical loads.
In order to capture the features of the EVs with various kinds of load curves, a lot of researchers have developed methods for data mining. Among these methods, clustering algorithm is a technology that can effectively achieve data mining. Deeply exploring and analyzing the characteristics of load data can effectively supports load forecasting and demand side response in the field of smart grids. In this way, the clustering algorithms in the power system can help to address the impacts of electric vehicle loads on both supply and demand sides of the grid. Based on a large amount of data, clustering algorithms can be used to explore different patterns of EV users (Dyke et al., 2010), improve the accuracy of load forecasting (Teeraratkul et al., 2018), and support demand-side response (Labeeuw et al., 2015; Alvarez et al., 2020). In various subclass algorithms of clustering algorithms, Euclidean distance is commonly used to define the similarity between different scenarios of daily load curves. However, a significant drawback of Euclidean distance is that it cannot recognize the relationships between curves of different shapes.
The daily load curves of different types of EV show different characteristics and indicate different potentials for demand response. In this way, classifying the types of EV with the daily load curves is an important task for power systems. A similarity definition that considers the weight proportion of two load characteristic parameters on the basis of Euclidean distance was proposed in this paper. The impacts of several typical electric vehicle charging loads superimposed on different loads by the clustering algorithm results were also discussed in this paper.
The primary contribution of this paper is proposing an improved clustering algorithm with a novel distance index for the study of power system loads. Compared to the commonly used distance definitions in clustering algorithms, this novel distance definition takes into account the differences of two inherent data characteristics in power systems.
2 Clustering algorithm
Advanced power metering technology increases the sampling rate and data accuracy of power systems. A large number of databases with different kinds of operating units have been generated in the recent years for power systems. The demand for processing a large number of databases, identifying outlier, and classifying and extracting useful data is increasing, clustering algorithms are widely used to solve power system problems (Figueiredo et al., 2005). proposed a data mining model that combines unsupervised learning and supervised learning to classify load curves (Kwac et al., 2014). has subdivided the types of electricity users using clustering algorithms, enhancing the ability to understand individuals and consumer groups (Chicco et al., 2006). compared the results of hierarchical clustering algorithm, k-means algorithm, and fuzzy k-means algorithm (Chicco et al., 2003a). Studied the clustering of load patterns to adapt to different types of load patterns (Chicco et al., 2003b). used unsupervised clustering algorithms and self-organizing maps to group customers with similar electrical behaviors (Gerbec et al., 2003). used hierarchical clustering algorithm and fuzzy logic to classify consumer load conditions (Gerbec et al., 2005). used probabilistic neural networks and clustering algorithms to predict typical load curves (Ryu et al., 2020). used clustering algorithms to capture the annual load characteristics of users and clearly displayed them through load images. In recent years, multiple studies have verified the feasibility of resolution technology in dimensionality reduction, reasonable profile selection and classification, and stability of typical daily load data (Li et al., 2016; Lin et al., 2019). In (Chicco et al., 2013), an original electric mode ant colony clustering algorithm based on k-means algorithm was proposed and applied to classify typical loads of non residential users. The k-means algorithm needs to determine cluster results (
However, the above literature all used traditional distance definitions and did not consider the possible impact of grid connected to electric vehicle charging loads on clustering algorithm results.
Clustering algorithms can aggregate a large amount of scattered data into a small amount of data through a series of operations. The idea of clustering algorithm is to minimize the similarity between different instances belonging to the same clusters and maximize the similarity between different instances belonging to different clusters. On this basis, in order to cope with different scenarios and handle databases of different types, dimensions, and quantities, many different clustering algorithms have been de-signed. There are five main categories of algorithms applied to smart grid: hierarchical, density-based, partition-based, grid-based, and model-based (Tsekouras et al., 2007). In terms of clustering methodologies, the existing algorithms applied to power systems are predominantly based on the K-means algorithm, whose effectiveness is contingent upon the initial setting of cluster centroids. This necessitates the involvement of more experienced engineering personnel to design specific clustering schemes. In contrast, the hierarchical clustering algorithm utilized in this paper facilitates comparison among datasets, enabling even inexperienced engineers or those encountering this type of data for the first time to achieve satisfactory clustering outcomes. However, the downside of hierarchical clustering algorithms, as compared to K-means clustering, is quite evident; due to the requirement for a greater number of computations in each clustering iteration, the computational process becomes more complex. Regarding the definition of distance, this paper introduces a novel distance metric that incorporates two data characteristics specific to power systems: load rate and peak valley difference. Currently, a widely used definition of distance is Euclidean distance (Yu, 1996), it is defined as the result when p equals 2 at the Minkowski Distance, which can be represented by Eq. 2
Manhattan distance is Minkowski Distance when p equals to 1, the expression of Manhattan distance is shown in Eq. 3.
Canberra distance is an improvement on Manhattan distance, the expression of it is shown in Eq. 4.
It is obvious that these formulas only consider the differences in various dimensions of the instance and does not consider the similarity of the shape. In order to overcome the drawbacks, this paper considers the other two commonly used load characteristics in power systems, load rate and the difference of the valley and peak load difference, in the definition of the criterion for distinguishing different clusters is the distance between the clusters. The load rate is defined as the percentage of the ratio of the average load to the maximum load during a specified period of time, used to measure the changes in load during a specified period, and to evaluate the utilization of electrical equipment. The difference of the valley and peak load difference is defined by the difference between the valley value and peak value of the daily loads in a day time. It indicates the variations of power demand of users at different periods.
In order to clustering the daily loads with different based values of power systems, the daily load curves, the load rate, the valley peak difference need to be scaled to the per unit value. This paper selects the practical load data of EV from some system buses in China, and chooses the maximum load of each bus as its base line value. The three weights
where
In each cluster, there are at least two instances. Each instance can be imported to calculate the value of D during each iteration. The average linkage was applied to determine the value of linkage criterion for the cluster. The comparison between the instances in two clusters refers to the average distance.
For two clusters
There are two different methods of hierarchical clustering algorithms. The first method is to divide one large cluster into several small clusters, so called divisive algorithm as follows, A dataset M can be divided into n disjoint clusters
The core rule of clustering algorithms is to minimize the whole distance, the detail is shown in Eq. 10.
The second method is to combine several small clusters to a large cluster, so called agglomerative algorithm. The proposed clustering method in this paper belongs to the second one, and the iteration process is described as follows.
1) Divide all EV loads from different charging stations into (n+1-k) classes, where n is the initial total number of charging stations and k is the number of iterations
2) Calculate the distance between each clustering and generate a distance matrix
3) Compare distances and combine the two clusters with the smallest distance into a new cluster.
4) Stop iterating when the minimum distance in the matrix is larger than the threshold, otherwise return to the first step
The flowchart is shown in Figure 1 as follows.
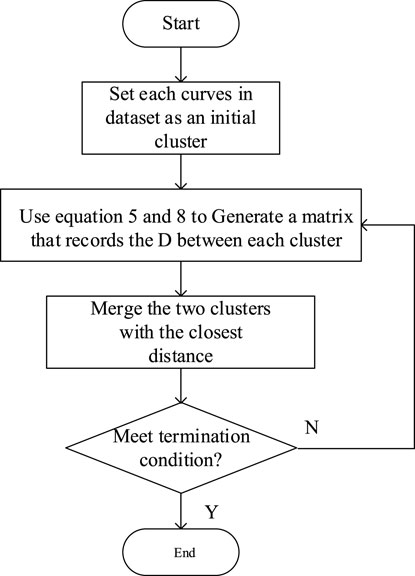
Figure 1. Flowchart of hierarchical clustering algorithm.
3 Analysis of electric vehicle integration into daily load
Three typical loads with per unit value curves collected from electric vehicle charging stations in China in 2021 are shown in Figure 2, which include the EV charging load in mixed residential and industrial areas, the EV charging load in commercial areas and the EV charging load in residential areas. Users in residential areas predominantly charge their EVs during the late night and early morning hours when electricity prices are lower, leading to peak charging loads during these times, while the number of chargers during the day is negligible. The EV charging load in commercial areas exhibits greater randomness, primarily concentrated in the afternoon and early evening hours, with occasional charging in the early morning and late night, but less than the previously mentioned periods. The EV charging load in mixed residential and industrial areas is similar to that of residential areas, peaking at night, but differs in that some users choose to charge during the midday hours. Based on the observation, many actual charging station loads can be categorized into the aforementioned three types or a combination.
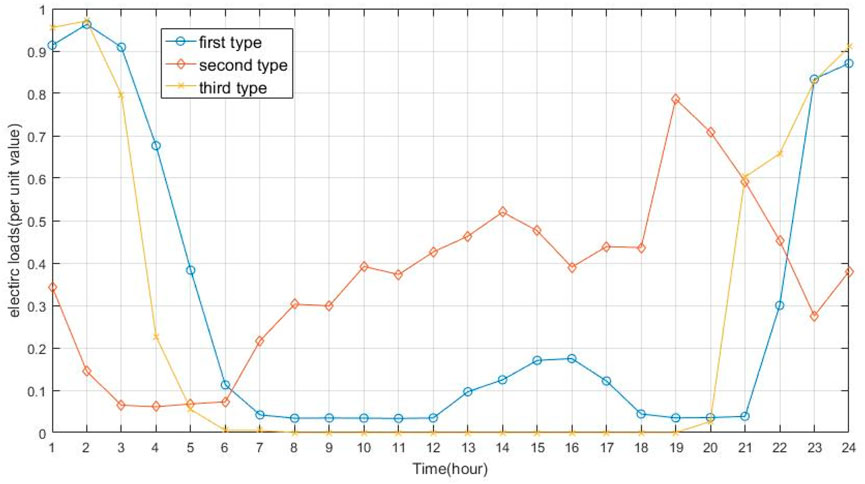
Figure 2. Three typical electric vehicle loads.
In this paper, the results of combining the daily load curves of these types of EV loads with different daily load curves were studied. With different percentage of EV loads to the daily load curves, the shapes of daily load curves can be changed and the impacts on power systems will be different. These three typical electric vehicle loads were combined with other daily load curves to generate new daily load curves. The combining method can be described as Eq. 11,
where
1) Select the load bus to add the selected EV loads on
2) The starting penetration level of EV is selected as K = 0.01, such coefficient is multiplied by the characteristic curve of the selected EV loads from the typical loads. In this paper, there are three types of EV loads for selection.
3) Start the clustering algorithm and output the results of the clustering algorithm
4) Compare the clustering results, and if the results are the same, increase the value of k and return to the second step; if the results are different, record the current k value and proceed to the next step
5) Check whether all suitable buses to add the EV loads have been calculated. If not, return to the first step.
The flowchart is shown in Figure 3.
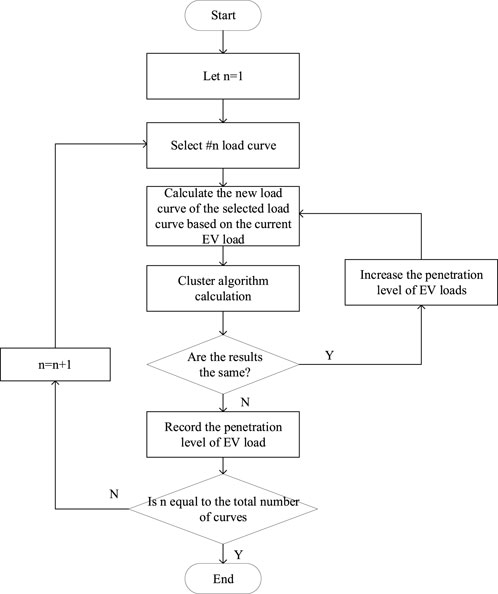
Figure 3. Flowchart of hierarchical clustering algorithm.
4 Case studies
4.1 Clustering results
In this paper, the historical daily operation data from different system buses were selected for the case studies. These curves were shown in Figure 4. The weight coefficients
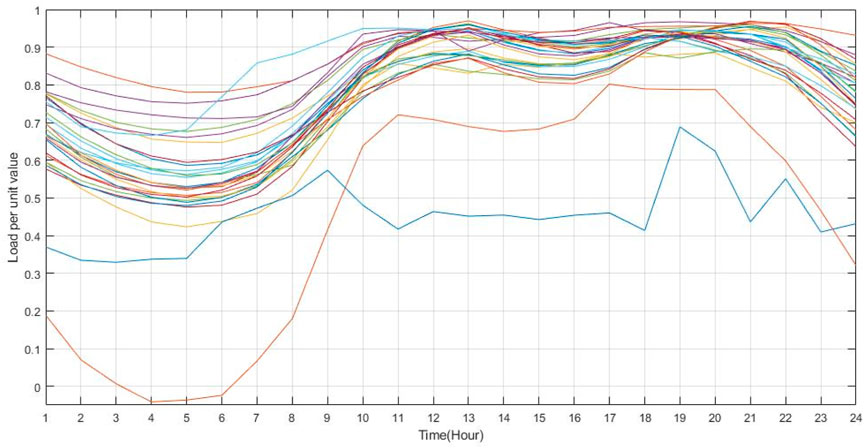
Figure 4. Scenarios of Daily Loads curves on different buses.
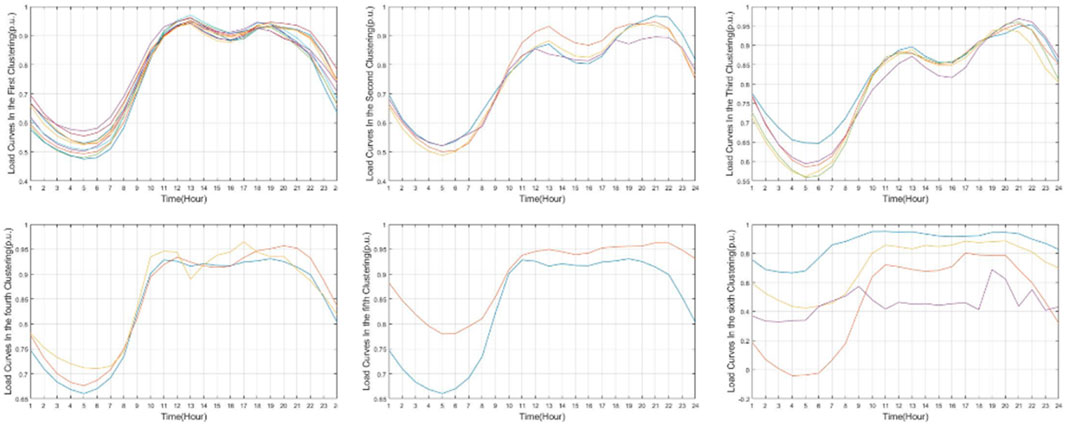
Figure 5. Clustering algorithm results without electric vehicle load.
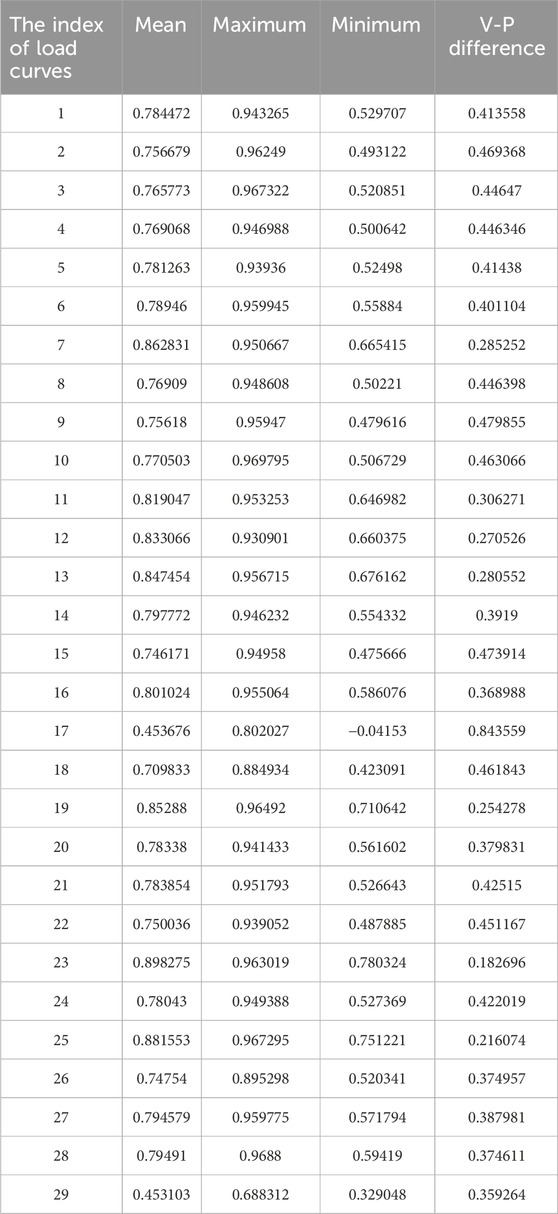
Table 1. The statistical information of 29 daily load curves.
The result in Figure 5 indicates that the curves under these five categories have significant differences, proving that considering load rate and peak to valley difference can provide reference for the overall shape of the daily load curve. The sixth category includes all the remaining curves. Meanwhile the Euclidean distance with relatively high weights separates stations with similar shapes for subtle differences in specific load curves. The clustering results indicate the three factors in Eq. 5 could classify the combined daily load curves effectively. The parameters for the case studies were listed in Table 2 as follows.

Table 2. The parameter for the clustering algorithm.
4.2 Superimposition of electric vehicle charging loads
Due to the large number of clustering results obtained from the integration of three types of electric vehicle (EV) charging loads at 25 sites, it is not feasible to present all of them. Therefore, this paper only illustrates the peak loads of EVs that are significant enough to affect the clustering outcomes in Figure 6. Figure 6 reflects the peak sizes of the three types of EV loads that 25 daily load curves can accommodate, where the magnitude of the load peak corresponds to the K coefficient in Eq. 11 discussed earlier. The results indicate that for a specific bus, it either exhibits sensitivity to all types of charging loads (with a small k value, meaning that the addition of a small amount of EV load leads to changes in clustering results) or can withstand a larger charging load (with a larger k value, even with the addition of a significant amount of EV load, the clustering results remain consistent with the initial state). As depicted in Figure 6, compared to the other two types of electric vehicle (EV) loads, the first type of EV load has a lesser impact on the daily load of all system buses. However, certain specific loads on bus 17 can accommodate a substantial amount of the second and third types of EV loads.
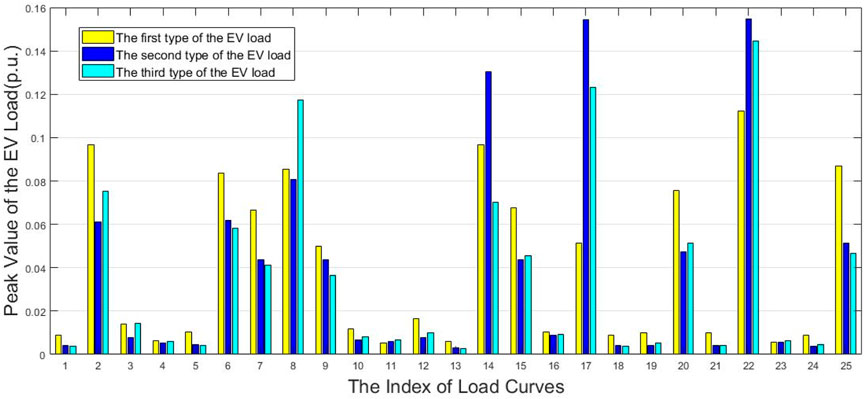
Figure 6. Electric vehicle charging loads and k values.
This numerical result also compared the different performances of electric vehicle charging loads superimposed on the daily loads on different buses in the same cluster, as shown in the following Figure 7. In order to highlight the difference for the same bus with other indices, their load rate and the valley and peak difference are also shown in Figure 7.
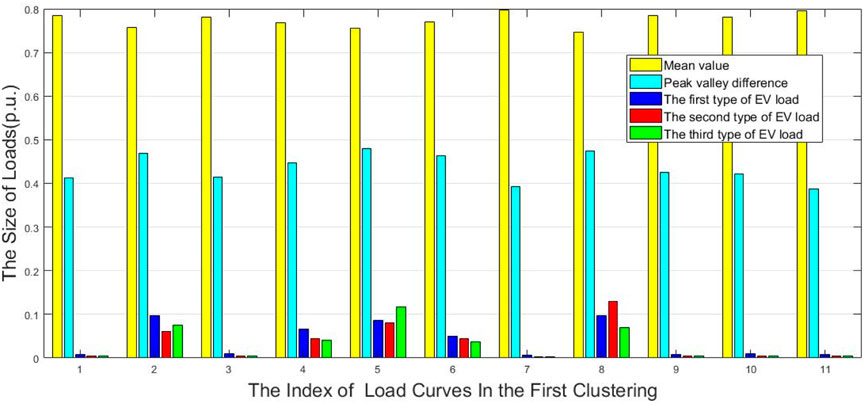
Figure 7. The k value to three types of electric vehicle charging loads, load rate and valley peak difference of the first category of initial classification.
The study indicates that the effects of the peak to valley difference and load rate on the K value are entirely opposite, while the change in k value is positively correlated with the valley peak difference, which indicates that daily load curves with smaller valley peak difference and larger load rate are more susceptible to the impact of electric vehicle charging loads, and their clustering results are more likely to be affected when they are super-imposed with very small electric vehicle loads. On the contrary, daily load curves with larger valley peak difference or smaller load rate are more resistant to the impact of electric vehicle charging loads.
5 Discussions
Figure 5 indicates that the new weight definition of similarity considering load rate and valley peak difference purposed in this paper can contribute to a load clustering result that divide load curves according to different curve shapes.
Figure 6 and Figure 7 indicate that the result of electric vehicle load superposition is influenced by the load rate and valley peak difference of the original load, as well as the type of electric vehicle load. The clustering result after superimposing electric vehicle charging loads indicates that an electric vehicle load should be connected to suitable station without affecting the overall clustering of station data, thus facilitating the management and operation of power system operators.
By changing the weight coefficient to 0.4, 0.3, and 0.3 for the weight coefficients
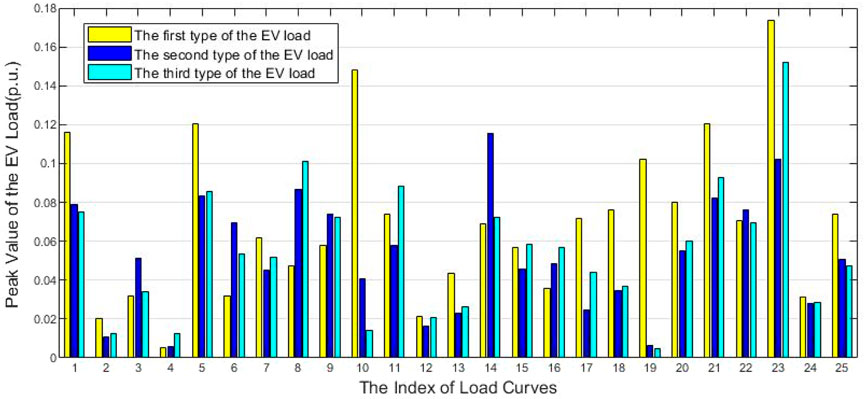
Figure 8. Electric vehicle charging loads and k values with different coefficients.
By reducing the weight of coefficient for the distance in the daily load curves, the values of the thresholds change a lot as shown in Figure 8. For the daily loads on the bus 1, the value of threshold increases more than ten times than the result in Figure 6. The average level of the thresholds in Figure 8 is larger than Figure 6. The factor of the distances with the coefficient
After adjusting the time intervals, the proposed clustering algorithm remains effective because the adjustment of time interval will not affect Eq. 5. However, due to the inherently larger computational load of hierarchical clustering algorithms, this may lead to a decrease in clustering speed. Nevertheless, this does not affect the results of the clustering. It is important to note that with changes in the time intervals, the number of the size of the load curves will increase. This may result in a change in the magnitude of the three weights in distance D, necessitating an adjustment of the weights.
When the resulting clusters differ from the typical cluster results (for example, as seen in the sixth graph in Figure 5), we consider this a potential direction of research for the future. The actual load of electric vehicle charging stations in reality may not closely follow a typical curve, and it could also be a combination of loads from multiple typical curves. Therefore, we believe that complex distributions constructed based on Poisson and mixed Gaussian distributions using other artificial intelligence algorithms could be used to fit the actual data. The accuracy of the fit can then be further determined through clustering algorithms.
This paper solely compares the application of the proposed method in the analysis of daily load profiles with different types of electric vehicle (EV) integration, without a comparison to other common clustering methods. This is because existing clustering methods in power systems are primarily based on the K-means algorithm, which requires the setting of initial cluster centroids based on empirical experience. In this study, with the variation of the K value, each new K effectively necessitates the redefinition of centroids, presenting a challenge in implementation. Other clustering algorithms are seldom used in power system research due to their individual characteristics and limitations.
6 Conclusion
A weight similarity definition that takes into account the shape of the load curve was proposed in this paper. It can distinguish curves with significant differences in load characteristics. Based on this, the impacts of three types of electric vehicle charging loads on the clustering results were studied. The results indicated that the daily load of the system buses with larger rated power load and smaller valley peak difference are more susceptible to the superposition of electric vehicle loads. At the same time, electric vehicle charging loads should be connected to suitable system buses due to the potential influence to power system. Considering this issue when make decisions on the location of electric vehicle charging loads can help the large-scale distribution network connected to electric vehicle charging station keep the characteristics of clustering. Thus, it is easier for power grid operators to plan and operate the power grid.
Data availability statement
The original contributions presented in the study are included in the article/supplementary material, further inquiries can be directed to the corresponding author.
Author contributions
LC: Conceptualization, Project administration, Writing–original draft. LiY: Conceptualization, Supervision, Writing–review and editing. LuY: Software, Writing–review and editing. DM: Methodology, Writing–review and editing. CY: Investigation, Visualization, Writing–review and editing. DR: Resources, Writing–review and editing.
Funding
The author(s) declare that financial support was received for the research, authorship, and/or publication of this article. This research was funded by the Science and Technology Program of State Grid Shanghai Municipal Electric Power Company, grant number is 520933230002.
Conflict of interest
Authors LC, LiY, LuY, DM, CY, and DR were employed by State Grid Shanghai Municipal Electric Power Company.
Publisher’s note
All claims expressed in this article are solely those of the authors and do not necessarily represent those of their affiliated organizations, or those of the publisher, the editors and the reviewers. Any product that may be evaluated in this article, or claim that may be made by its manufacturer, is not guaranteed or endorsed by the publisher.
References
Alvarez, M. A. Z., Agbossou, K., Cardenas, A., Kelouwani, S., and Boulon, L. (2020). Demand response strategy applied to residential electric water heaters using dynamic programming and K-means clustering. IEEE Trans. Sustain. Energy 11 (1), 524–533. doi:10.1109/tste.2019.2897288
Chen, H., Hu, Z., Zhang, H., and Luo, H. (2018). Coordinated charging and discharging strategies for plug-in electric bus fast charging station with energy storage system. IET Gener. Transm. Distrib. 12 (9), 2019–2028. doi:10.1049/iet-gtd.2017.0636
Chicco, G., Ionel, O.-M., and Porumb, R. (2013). Electrical load pattern grouping based on centroid model with ant colony clustering. IEEE Trans. Power Syst. 28 (2), 1706–1715. doi:10.1109/tpwrs.2012.2220159
Chicco, G., Napoli, R., and Piglione, F. (2003b). “Application of clustering algorithms and self organising maps to classify electricity customers,” in 2003 IEEE bologna power Tech conference proceedings (Bologna, Italy: IEEE).
Chicco, G., Napoli, R., and Piglione, F. (2006). Comparisons among clustering techniques for electricity customer classification. IEEE Trans. Power Syst. 21 (2), 933–940. doi:10.1109/tpwrs.2006.873122
Chicco, G., Napoli, R., Piglione, F., Postolache, P., Scutariu, M., and Toader, C. (2004). Load pattern-based classification of electricity customers. IEEE Trans. Power Syst. 19 (2), 1232–1239. doi:10.1109/tpwrs.2004.826810
Chicco, G., Napoli, R., Postolache, P., Scutariu, M., and Toader, C. (2003a). Customer characterization options for improving the tariff offer. IEEE Trans. Power Syst. 18 (1), 381–387. doi:10.1109/tpwrs.2002.807085
Dyke, K. J., Schofield, N., and Barnes, M. (2010). The impact of transport electrification on electrical networks. IEEE Trans. Industrial Electron. 57 (12), 3917–3926. doi:10.1109/tie.2010.2040563
Figueiredo, V., Rodrigues, F., Vale, Z., and Gouveia, J. B. (2005). An electric energy consumer characterization framework based on data mining techniques. IEEE Trans. Power Syst. 20 (2), 596–602. doi:10.1109/tpwrs.2005.846234
Gerbec, D., Gasperic, S., and Gubina, F. (2003). “Determination and allocation of typical load profiles to the eligible consumers,” in 2003 IEEE bologna power Tech conference proceedings (Bologna, Italy: IEEE).
Gerbec, D., Gasperic, S., Smon, I., and Gubina, F. (2005). Allocation of the load profiles to consumers using probabilistic neural networks. IEEE Trans. Power Syst. 20 (2), 548–555. doi:10.1109/tpwrs.2005.846236
Geth, F., Leemput, N., Van Roy, J., Büscher, J., Ponnette, R., and Driesen, J. (2012) “Voltage droop charging of electric vehicles in a residential distribution feeder,” in 2012 3rd IEEE PES innovative smart grid technologies europe. Berlin, Germany: ISGT Europe, 1–8.
Kwac, J., Flora, J., and Rajagopal, R. (2014). Household energy consumption segmentation using hourly data. IEEE Trans. Smart Grid 5 (1), 420–430. doi:10.1109/tsg.2013.2278477
Labeeuw, W., Stragier, J., and Deconinck, G. (2015). Potential of active demand reduction with residential wet appliances: a case study for Belgium. IEEE Trans. Smart Grid 6 (1), 315–323. doi:10.1109/tsg.2014.2357343
Lang, R., Wang, K., Wang, J., and Jia, R. (2019). “Analysis of residents differentiated power consumption behavior based on load classification,” in 2019 12th international symposium on computational intelligence and design (ISCID) (Hangzhou, China: IEEE).
Li, R., Li, F., and Smith, N. D. (2016). Multi-resolution load profile clustering for smart metering data. IEEE Trans. Power Syst. 31 (6), 4473–4482. doi:10.1109/tpwrs.2016.2536781
Lin, S., Li, F., Tian, E., Fu, Y., and Li, D. (2019). Clustering load profiles for demand response applications. IEEE Trans. Smart Grid 10 (2), 1599–1607. doi:10.1109/tsg.2017.2773573
Moghaddam, Z., Ahmad, I., Habibi, D., and Phung, Q. V. (2018). Smart charging strategy for electric vehicle charging stations. IEEE Trans. Transp. Electrification 4 (1), 76–88. doi:10.1109/tte.2017.2753403
Ryu, S., Choi, H., Lee, H., and Kim, H. (2020). Convolutional autoencoder based feature extraction and clustering for customer load analysis. IEEE Trans. Power Syst. 35 (2), 1048–1060. doi:10.1109/tpwrs.2019.2936293
Si, C., Xu, S., Wan, C., Chen, D., Cui, W., and Zhao, J. (2021). Electric load clustering in smart grid: methodologies, applications, and future trends. J. Mod. Power Syst. Clean Energy 9 (2), 237–252. doi:10.35833/mpce.2020.000472
Teeraratkul, T., O’Neill, D., and Lall, S. (2018). Shape-based approach to household electric load curve clustering and prediction. IEEE Trans. Smart Grid 9 (5), 5196–5206. doi:10.1109/tsg.2017.2683461
Tsekouras, G. J., Hatziargyriou, N. D., and Dialynas, E. N. (2007). Two-stage pattern recognition of load curves for classification of elec-tricity customers. IEEE Trans. Power Syst. 22 (3), 1120–1128. doi:10.1109/tpwrs.2007.901287
Tu, H., Feng, H., Srdic, S., and Lukic, S. (2019). Extreme fast charging of electric vehicles: a technology overview. IEEE Trans. Transp. Electrification 5 (4), 861–878. doi:10.1109/tte.2019.2958709
Yao, W., Zhao, J., Wen, F., Dong, Z., Xue, Y., Xu, Y., et al. (2014). A multi-objective collaborative planning strategy for integrated power distribution and electric vehicle charging systems. IEEE Trans. Power Syst. 29 (4), 1811–1821. doi:10.1109/tpwrs.2013.2296615
Keywords: electric vehicles (EV), clustering algorithm, euclidean distance, distribution network, typical scenarios
Citation: Chao L, Yu L, Yihua L, Menghua D, Yanjun C and Ruochen D (2024) An evaluation method for integrating EVs in distribution networks with clustering algorithms. Front. Energy Res. 12:1403430. doi: 10.3389/fenrg.2024.1403430
Received: 19 March 2024; Accepted: 18 April 2024;
Published: 09 May 2024.
Edited by:
Tianyang Zhao, Royal Institute of Technology, SwedenReviewed by:
Wenqian Yin, Nanjing Tech University, ChinaZhijun Qin, Guangxi University, China
Jiazuo Hou, National University of Singapore, Singapore
Copyright © 2024 Chao, Yu, Yihua, Menghua, Yanjun and Ruochen. This is an open-access article distributed under the terms of the Creative Commons Attribution License (CC BY). The use, distribution or reproduction in other forums is permitted, provided the original author(s) and the copyright owner(s) are credited and that the original publication in this journal is cited, in accordance with accepted academic practice. No use, distribution or reproduction is permitted which does not comply with these terms.
*Correspondence: Lu Chao, bGNfc2djY3NoQDEyNi5jb20=