 Augustin Varga
 Jan Kizek
 Miroslav Rimar2
 Šimon Staško
 Róbert Dzurňák
- 1Institute of Metallurgical Technologies and Digital Transformation, Faculty of Materials, Metallurgy and Recycling, Technical University of Kosice, Kosice, Slovakia
- 2Department of Process Technique, Faculty of Manufacturing Technologies with a Seat in Presov, Technical University of Kosice, Presov, Slovakia
Introduction: The EU’s environmental and energy policy has set goals for member states in increasing efficiency and effectiveness, reducing emissions, and lowering the consumption of fossil fuels as part of measures to decarbonize industry. An important part of the industrial sector consists of industrial furnaces, which include continuous annealing lines for the heat treatment of steel strips. Industrial furnaces operate with high energy consumption and by optimizing their energy processes it is possible to contribute to the decarbonization of the industry.
Methods: The research in this manuscript focused on the analysis and optimization of an annealing furnace installed within a continuous annealing line. The heating process in the annealing furnace is carried out by indirect heating using radiant tube burners in a protective atmosphere. Based on the analysis of the operation of the burners in the different zones of the annealing furnace, it was necessary to determine the dependencies of the parameters of the combustion process. The experiments investigated the temperatures and the composition of the flue gases at different burner outputs, both individually and in groups according to the zones.
Results: Based on the results from the measurements, the factors influencing the combustion process in the annealing furnace were identified and the thermal operation was optimized based on the O2 content in the flue gas, with 5 and 6% O2 volume as the optimization criterion.
Discussion: After mathematical relationships were derived and regression analysis was performed, dependencies were established to better distribute the fuel among the burners, resulting in fuel savings of up to 9% of the fuel consumption and CO2 emission reductions of up to 700 tCO2 per year. At the same time, the CO concentration in the flue gas was reduced. The proposed method was verified through control measurements in real operation.
1 Introduction
The EU’s current energy targets for 2030 include an 11.7% reduction in both primary (indicative) and final energy consumption compared to the 2020 forecasts (European Parliament, 2024). In the 2022 report by the International Energy Agency (IEA), it was stated that CO2 emissions increased by 0.9% over the year, reaching an all-time high of approximately 36.8 Gt (IEA, 2023). The 2023 IEA report noted that the growth of clean energy limited the rise in global emissions, with an increase of 1.1% in 2023 (IEA, 2024). This means that global energy-related CO2 emissions in 2023 rose by 410 million tons (Mt), reaching a new record high of 37.4 billion tons (Gt), compared to the increase of 490 million tons in 2022 (1.3%) (IEA, 2024).
In industry, there are thermal units in operation that have not undergone innovation, and operators are looking to optimize their performance without large investment costs. Therefore, studies are being conducted that, based on analyses, show ways to improve the performance of such thermal units.
The performance of thermal units is evaluated based on several criteria that determine their operation. The most important criterion is furnace performance, which depends on the thermal unit’s ability, such as heating furnaces, to adequately heat the charge to the required temperature according to technological needs (Baukal, 2003; Tatic et al., 2021). The heating method of the charge is chosen based on the selected technology, whether directly or indirectly, with heat sources selected according to technological requirements (Brunklaus, 1966; Tatic et al., 2021).
Thermal unit analyses are based on balance calculations, which describe directly or indirectly the most important parameters of the unit’s operation. Due to specific properties, it is not possible to create a universal calculation, but rather individual calculation procedures are developed for each unit. Such procedures can be found in many publications in journals that are specific and usually focus on a single unit, or in some publications like Brunklaus (1966) or Kitaev et al. (1970), where cumulative calculation procedures for various industrial units can be found. The foundation of these calculations is thermal heat transfer calculations (Cengel and Ghajar, 2020; Ferstl and Masaryk, 2018; Rédr and Příhoda, 1991; Varga et al., 2013) based on the technological heating regime and the required output parameters of the charge. Heat sources can include electric heating (Brunklaus, 1966; Tatic et al., 2021) or burner combustion devices. Depending on the technology needs, different types of burners can be used (Baukal, 2003; Fik, 1998). Particularly with gas burners, it is important to determine whether the charge can come into contact with the resulting flue gases (Brunklaus, 1966; Tatic et al., 2021). To prevent contact between flue gases and the charge, radiant burners or radiant tube burners are used (Brunklaus, 1966).
Brunklaus (1966) in his publication describes various types of tubular radiant burners used in different industries. A summary of the various designs can be found in the publication by Flamme et al. (2010). The development and significance of these burners were described earlier in Helfert’s (1956) publication. This shows that this type of burner has a long and rich history, and current publications indicate that research on it is still ongoing. A specific feature is the closed combustion chamber defined by the dimensions and shape of the radiant tube (Baukal, 2003; Brunklaus, 1966; Flamme et al., 2010; Wan et al., 2012).
Research on the use of radiant tubes was conducted both experimentally (Blevins and Gore, 1996; Dini et al., 2008; Hajaliakbari and Hassanpour, 2017; Mital et al., 1998; Xu et al., 2017) and numerically (Dini et al., 2008), including CFD simulations (Goeckner et al., 1992; Kim et al., 2024; Mochida et al., 1997; Tsioumanis et al., 2011). A common feature of these studies was the focus on radiant heating or combustion within the radiant tube itself.
A drawback of radiant tubes is their damage due to the weight of the tube material (Dini et al., 2008) as well as thermal wear caused by overheating of the radiant tubes under improper heating regimes (Tatic et al., 2021).
The authors aimed to propose a methodology for improving the thermal performance of radiant burner tubes, arranged into zones, based on the analysis of the operation of an annealing furnace, which is part of a continuous annealing line. The analysis is based on measurements of burner parameters divided into zones with a different number of burners in each zone. The goal is to obtain burner characteristics at different outputs and determine an optimization criterion to improve the thermal performance of the annealing furnace.
2 Materials and methods
The designation of continuous annealing furnaces with radiant heating as Continuous Annealing Lines (CAL) was introduced in the works of Kim et al. (2014), Sahay and Kapur (2007), and Strommer et al. (2017). These furnaces are used in the continuous annealing process which is a crucial step in steel production, significantly influencing the uniformity and stability of mechanical properties (Zhou et al., 2024). CAL is designed for the degreasing, cleaning, and recrystallization annealing of strip steel after cold rolling, intended for the production of tinplate. The finished product of the CAL is annealed steel strip with a clean surface after the removal of technical rolling lubricant from the five-stand tandem rolling mill, free from damage and tempering coloration, and wound into coils (Tatic et al., 2021). CAL is described in greater detail in Spišák and Majerníková (2016). A furnace with a similar design to the Continuous Annealing Line (CAL) was described by Kang and Chen (2013), Kang and Chen (2014). Based on a detailed description of the operation of Continuous Annealing Lines (CAL), several authors, such as Zhang et al. (2018) and Chen et al. (2024), have investigated the optimization of their processes, developing predictive models based on strip temperature.
The aim of this research is to perform an analysis and optimization of the combustion process in a system of radiant tube burners installed in a preheating chamber, or annealing furnace, which is part of the CAL. This optimization should help the annealing furnace to achieve fuel savings and therefore lower emissions, thus bringing the annealing furnace closer to the EU’s industrial decarbonization targets.
The annealing furnace is divided into zones, in which injector-type radiant tube burners with flue gas recuperation are installed. The annealing furnace contains 108 burners, grouped and controlled by zones. Figure 1 schematically illustrates the arrangement of the burners with staggered placement on the right and left sides of the furnace, with burner designations and zone assignments. Supplementary Table S1 lists the maximum burner outputs in each zone, the total number of burners in the zone, and the total zone output.
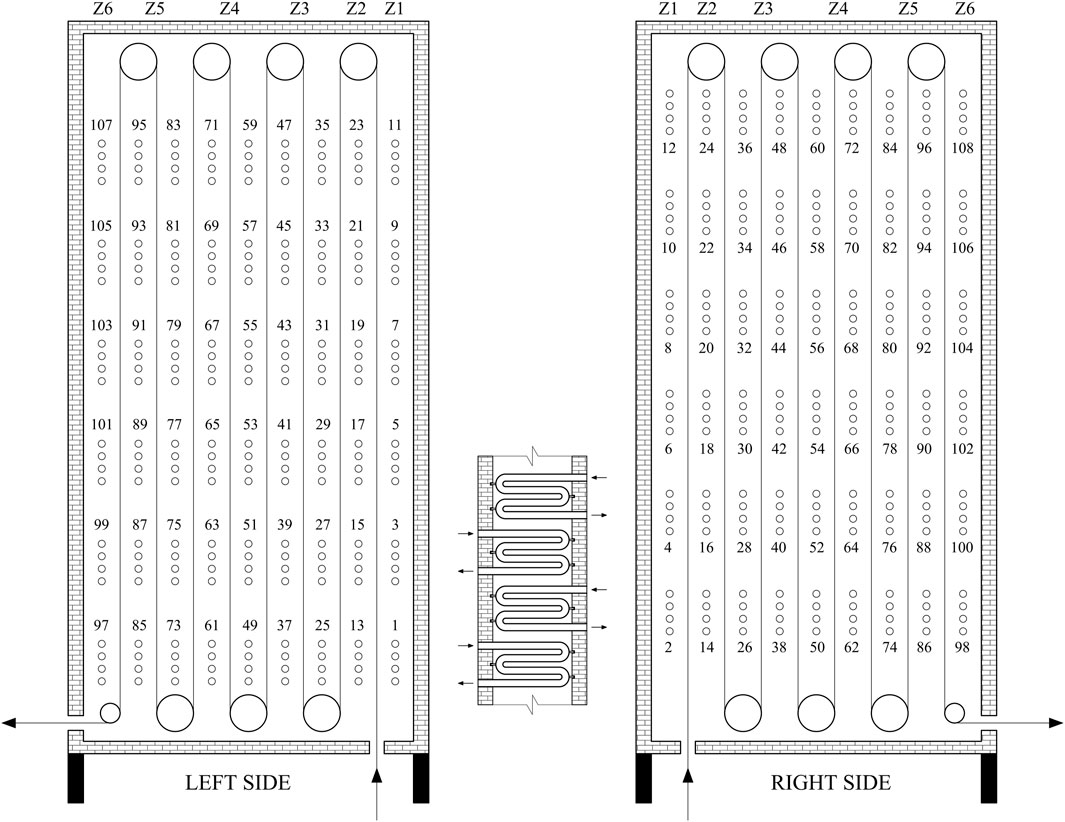
Figure 1. Layout scheme of burner radiant tubes in the annealing furnace of a continuous line.
The burner design is of type W, mounted vertically, as schematically shown in Figure 2. From Figure 2, it can be observed that the burner is designed with a counterflow flue gas recuperator, where flue gases are removed from the burners through manifolds to a common exhaust on both the left and right sides of the furnace. The heating of the steel strip occurs through heat transfer by radiation from the walls of the radiant burner tubes, radiation from the inner surface of the refractory lining, and convection by the heated protective atmosphere. The protective atmosphere consists of a gas mixture known as HNX (95 vol.% N2 + 5 vol.% H2). The burners use natural gas from the distribution network as fuel. The composition of natural gas is published on the website of SPP-Distribucia, a. s. (SPP-Distribucia, 2024).
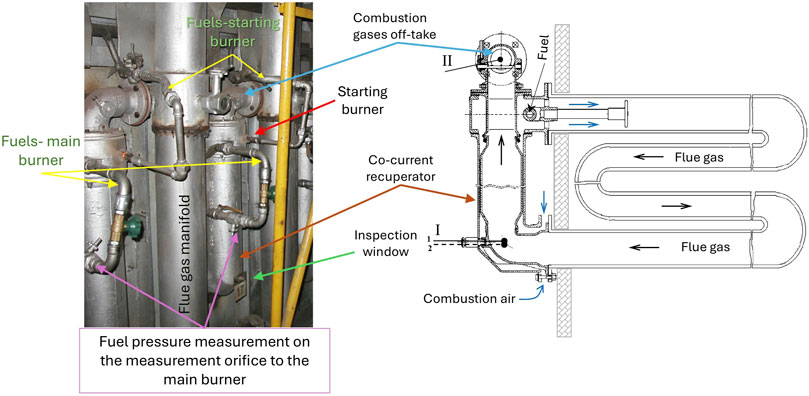
Figure 2. Diagram of a radiant tube burner with a co-current air recuperator. I – Measurement location for temperatures and flue gas composition: 1 – Thermocouple – measures the temperature of the flue gases at the outlet of the preheat chamber; 2 – Probe for flue gas sampling for analysis (O2, CO, NOx) II – Measurement location for monitoring vacuum after the recuperator and for flue gas sampling for analysis after the recuperator.
2.1 Methodology for combustion optimization
The following factors influence the combustion optimization process and subsequent combustion control:
a. Gas regulation and distribution to individual zones,
b. The relationship between gas supply to the zone and the placement of individual burners within the zone,
c. The relationship between flue gas extraction from the zone and the placement of individual burners within the zone (Figure 1),
d. Setting the flue gas vacuum in the respective zone based on gas consumption,
e. Geometric characteristics and operational condition of the burner with recuperator and radiant tubes (Figure 2),
f. Characteristics and operational condition of the exhaust pipes in each zone of the chamber.
The above factors affect the combustion process in the preheating chamber and consequently the thermal regime in the chamber, with the following parameters contributing most to the instability of the annealing furnace process in this research:
a. Pressure on the burners,
b. Underpressure behind the recuperators.
These 2 parameters affect the excess combustion air, which defines the amount of O2 delivered to the combustion process. If the O2 content is low, the combustion process may not burn the fuel, which represents a loss of fuel. At the same time there is a risk of formation of CO, which is an undesirable presence in the flue gas. Conversely, with a high excess combustion air or a high O2 content, the combustion process produces a larger quantity of flue gases which, with the same fuel consumption, share the same amount of heat between them, thus lowering the maximum achievable temperature of these flue gases. On this basis, more fuel would have to be used for the same heating process, which is uneconomical and non-environmental.
The entire process of combustion optimization, thermal regime, and regulation in the preheating chamber was divided into the following stages:
• Evaluation of gas regulation and distribution in the annealing furnace, proposal and implementation of adjustments–assessment of gas consumption regulation at the burners.
• Analysis of the combustion process after the adjustments and setting the combustion process for individual burners in the corresponding zones of the chamber–adjusting flue gas temperature, oxygen content in flue gases, and gas flow at the burner using the differential gas pressure pd.
• Determination of combustion ratio characteristics for the respective zones of the CAL as a basis for software adjustments–determining the relationship between flue gas underpressure in the zone Δpz, fuel gas consumption in the zone Qpl, and flue gas composition (O2, CO2, CO, or NOx content).
To successfully complete each stage, it is necessary to measure the following physical quantities:
• Static and differential gas pressure at the burner’s measuring orifice,
• Flue gas underpressure at the burner’s recuperator,
• O2 content in flue gases at the preheating chamber outlet or at the recuperator outlet for individual burners,
• O2 and CO or NOx content in flue gases in the common duct at the exhaust from the respective zone,
• Flue gas temperatures at the outlet of the preheating chamber for individual burners in the respective zone, or flue gas temperatures at the recuperator outlet,
• Surface temperatures of selected recuperators.
Flue Gas Analysis:.
• At measuring point I (Figure 2), analysis was performed on each burner.
• Measuring point III–this is the flue gas manifold after the burner. Analysis was conducted here only if CO was detected in the common exhaust of the respective zone, and the CO source was investigated.
• Analysis at sampling point II (Figure 2) – behind the burner’s recuperator, performed if there was no CO at the respective burner but CO was present in the manifold after the burner. This analysis was carried out to assess the condition of the burner at the recuperator.
Pressure, Vacuum, and Differential Pressure Measurement:
• At measuring point IV (orifice on the burner) (Figure 3), where static gas pressure and differential gas pressure, characterizing gas flow rate, were recorded.
• Measuring point II (Figure 2), where flue gas vacuum was measured behind the flue gas recuperator.
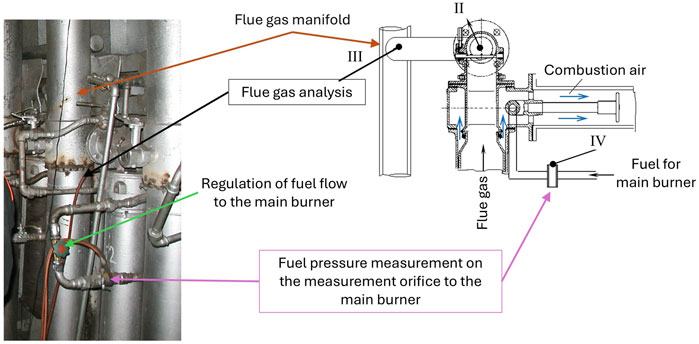
Figure 3. Schematic representation of the radiant burner with indicated measurement locations II, III, and IV. III – Flue gas analysis and temperature of flue gases exiting to the common manifold. IV – Measurement of differential pressure and static pressure at the measurement orifice for gaseous fuel to the main burner.
2.2 Materials and instrumentation for measurement
For the analysis of burner performance in terms of flue gas composition, Testo 33 gas analyzers were used to measure CO, O2, NOx in the flue gases and pressure via a pressure probe, Testo 327-2 for O2 and CO analysis in the flue gases, Testo 325 for measuring CO content up to 4 vol.%, and Testo 325-2 for measuring CO2, O2, and pressure using a pressure probe.
Temperature measurements were carried out continuously using the Dataloger MS3 control unit, to which K-type thermocouples from selected measuring points were connected. Discontinuous measurements were performed using portable thermometers from the Testo series, such as Testo 925 for measuring higher temperatures in selected burners with a K-type thermocouple probe, and the Testo 450 contact thermometer, which measured surface temperatures on the recuperator’s surface. Control measurements were also conducted using the Testo 720 thermometer with a K-type thermocouple probe.
For pressure measurements on the burner throat and directly at selected measuring points, as shown in Figures 2, 3, Testo 33, Testo 325-2, and Testo 312-3 were used.
The number of measuring devices employed indicates that obtaining the necessary data was challenging, not only in terms of the required measuring equipment but also regarding the materials used to ensure measurements in each zone of the annealing furnace.
Zones were analyzed individually, and measurements were taken at different zone power levels. Some data, such as fuel consumption for the burners, were obtained from central measurements in the CAL control room, where data on the operating performance of the CAL were also collected. Statistical data showed that the CAL operates within a range of 30%–40% of its capacity, although it can operate at up to 50% of its maximum capacity. These findings were reflected in the measurements taken within the zones, and the analysis of the burner system’s performance in the zones was limited to the 30%–40% capacity range.
2.3 Combustion characteristics as a function of O2 content in the flue gas
The mathematical expressions presented in this chapter are mainly used as a guide to derive the final formula that describes the dependence of O2 on flue gas negative pressure, but the full mathematical procedure is presented to clarify its final form. Measured data from the furnace have not been added to all relationships, with some parameters arising directly from the input measurements.
The combustion characteristic expresses the dependence of flue gas composition on the flue gas pressure drop in the respective zone. Since CO and NOx are influenced by the O2 content in the flue gases, it is necessary to determine this content.
The O2 content in the flue gases at individual burners of the continuous annealing furnace depends on:
• The gas consumption at the burner, which is defined by the differential gas pressure
• The flue gas pressure
• The pressure losses of gas, air, and flue gases from the burner inlet to the control damper in the respective zone.
The total pressure loss from the burner inlet to the flue gas damper in the zone is defined by the Equation 1:
Where
The pressure loss at the burner is determined using the equation (Varga et al., 2013; Rédr and Příhoda, 1991) Equation 2:
Where
For simplification, part of the equation is adjusted to the Equation 3:
Where kh - total resistance coefficient at the burner.
Then, the simplified equation for the pressure loss at the burner is as follows Equation 4:
The pressure loss in the manifold depends on the location of the burner relative to the common flue gas exhaust from the zone and is determined by the following Equation 5:
Where kz - total resistance coefficient in the manifold.
The pressure loss in the common flue gas exhaust from the zone is defined by the Equation 6:
Where kod–total resistance coefficient for flue gas exhaust.
The pressure losses in the manifolds of the individual zones of the annealing furnace are defined by the Equation 7:
Where w0 – gas flow velocity under normal conditions (273,15K; 101,325 Pa), (m.s-1);
Where
In Supplementary Table S2, the values for kz,c and
After adjustment for the individual sections of the manifolds, the following Equation 9 applies:
Where C2 – the coefficient of the individual sections of the manifolds, which is expressed by the Equation 10:
Where
For each burner, the following Equation 11 applies:
Where C1 – the coefficient for each burner, which is expressed by the Equation 12:
For each flue gas exhaust, the following Equation 13 can be used:
Where C3 – the coefficient for each flue gas exhaust, this constant is defined by the Equation 14:
The pressure profile from the air inlet into the burner to the flue gas pressure sensor in the common exhaust of flue gases from a given zone is described by the Equation 15:
For simplification of the calculation, part of the equation has been replaced by a constant
Then, the simplified equation for the pressure profile takes the Equation 17:
The amount of entrained air or the amount of flue gases generated depends on the vacuum in the zone, which is defined by the Equation 18:
The O2 content of the flue gas is determined using the Equation 19:
Where m–excess combustion air;
The gas consumption in the burner is determined by the Equation 20:
Where
After adjustment, the gas consumption equation takes the following Equation 21:
Where
After substituting the derived quantities, the equation for the O2 content in the flue gas is obtained in the following Equation 23:
Where
The equation for calculating the excess combustion air has the form (Varga et,al., 2013; Rédr and Příhoda, 1991) Equation 25:
Where
Part of the equation is replaced by a constant
By modification, the combustion air excess equation is simplified to the Equation 27:
After modification, the O2 content is calculated according to the Equation 28:
Part of the equation is replaced by a constant Equation 29:
Then the equation for calculating the O2 content will have the following Equation 30:
The analysis focuses on dry exhaust gases; however, during operation, it was not possible to continuously monitor the gas differential pressure at each burner. For this reason, the dependencies of oxygen content in the exhaust gases on fuel consumption and exhaust gas pressure in the zone were determined under the assumption that the fuel is evenly distributed among the burners in the given zone.
The excess combustion air in the analysis of dry exhaust gases is defined by the Equation 31:
The O2 content in dry flue gases is expressed by the following equation after adjustment of relation Equation 32:
Where
After adjustment, the equation for the O2 content in the flue gases is expressed as follows Equation 33:
Where
After mathematical adjustment, the equation for the O2 content in dry flue gases takes the following Equation 34:
Where O2,s - oxygen content in the dry flue gases at the outlet of the preheat chamber, (%); const - includes all constant variables from relations Equations 31–32.
To determine the O2 content in the flue gases depending on gas consumption and vacuum in the zone for the respective burner, or for the burners in the respective zone, an equation expressing the function of the dependence of the respective variables can be used Equation 35:
Where
The created characteristics describe the dependence of O2 on the flue gas vacuum. By adjustment, the functional dependence is simplified into a calculation model, and the basic equation is adjusted to obtain the Equation 36:
Where
The mathematical Equation 36 was obtained by modifying several formulas, or it is the final form of the O2 equation for the whole annealing furnace, so the relationship is still general. This formula was then applied to specific applications for individual zones of the annealing furnace, which are described by Formulas 37–39, while these formulas are also already based on the regressions shown in Figures 4–6.
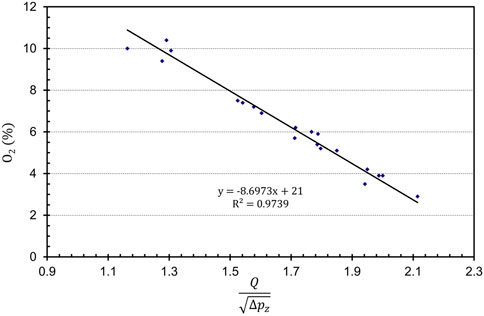
Figure 4. Regression of measured data for single-row zones 1, 2, and 6.
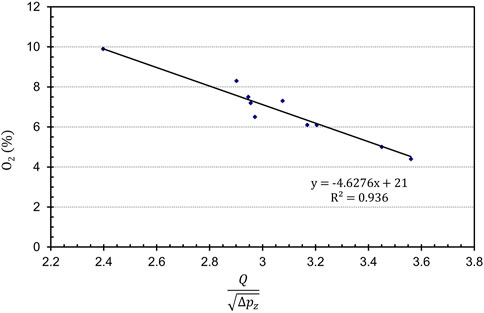
Figure 5. Regression of measured data for double-row zones 4 and 5.
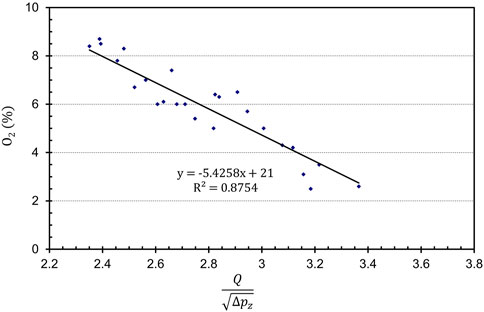
Figure 6. Regression of measured data for double-row zone 3.
3 Results and discussion
3.1 Experimental determination of dependencies
The derived Equation 34, respectively, applies under the following conditions:
• The fuel is evenly distributed to each burner,
• The burner and exhaust system do not draw in additional air,
• The burners, or radiation tubes, are identical,
• The exhaust gas temperatures at the individual burners follow the same trends and values.
It was not possible to meet all of the mentioned conditions on the given burner system, and for this reason, it was assumed that the burners in different zones at the same positions might have different characteristics, and that burners within the same zone could also have different characteristics.
These assumptions needed to be confirmed or refuted by measurements in the individual burner zones.
The following parameters were monitored during the measurements aimed at determining the characteristics:
• Gas consumption in the zone,
• Exhaust gas pressure in the zone,
• Exhaust gas composition (O2, CO, and NOx content) in the common exhausts of the zones,
• The following parameters were monitored on selected burners: differential pressure
• Exhaust gas temperature trends in the individual burners of the zone at the outlet from the annealing furnace.
In the individual zones, burners were selected that represented the average O2 values in the zone and the extreme O2 values in the zone (high or low values).
The results from the measurements aimed at determining the characteristics are presented in Supplementary Table S3. These measurements confirmed the assumptions about different characteristics on the burners in the individual zones. Subsequently, from the measured data provided in Supplementary Table S3, dependencies for the individual zones of the annealing furnace were obtained through regression analysis. The developed characteristics, based on the derived relation (36), show the dependency of O2 on the exhaust gas pressure.
The equation for setting optimal control for the single-row zones 1, 2, and 6, obtained by regression of the measured values (Figure 4), is as follows Equation 37:
From the double-row zones, values for zones 4 and 5 were selected due to the smaller variability in the measured data. The equation for setting optimal control for the double-row zones 4 and 5, obtained by regression of the measured values (Figure 5), is as follows Equation 38:
The measured results in the double-row zone 3 show specific behavior and greater variability, which is why the regression dependency was performed separately. The equation for setting optimal control for zone 3, obtained by regression of the measured values (Figure 6), is as follows Equation 39:
From these relationships, for a given fuel input at the optimal O2 content in the exhaust gases, the required exhaust gas pressure in the respective zone can be determined. These characteristics can be used in controlling the combustion process.
In Formulas 37–39, respectively in regressions Figures 4–6 it is possible to observe different values of coefficients, which are caused by the following reasons:
a. Different burner outputs in each zone - Supplementary Table S1,
b. The annealing furnace is not composed of equally sized zones, but it is composed of single-zone and two-zone parts - Supplementary Table S1,
c. Each burner was calculated with its own constant for the location of the outlet pipes to the central bus - Supplementary Table S2.
For these reasons, the modelling results resulted in different values for the flue gas parameters at the annealing furnace outlet and hence different O2 regressions and different values for the coefficients.
More precise characteristics between the O2 content in the exhaust gases and the gas consumption at the burner can be described using equations similar to (30), which are based on measurements of the gas differential pressures
Based on the data measured on the burners in zones 1 and 6, the following dependency was obtained Equation 40:
The regression for Formula 40 is shown in Figure 7.
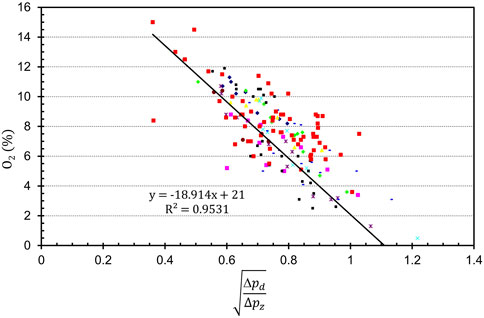
Figure 7. Regression of measured O2 content data depending on the differential pressure Δpd and flue gas underpressure Δpr at the recuperator.
The R2 value is from processing the data using a tool in excel software while graphing the linear trend line. We have also verified the above reliability value for Figures 4–7 regressions using SigmaPlot 11.0 software and confirm that these values are correct despite the indicated scatter in Figure 7 regression data.
During operation, the values of differential pressures across the orifices and the pressures at the recuperators of individual burners are not measured.
When transitioning from one power level to another, the gas is not evenly distributed to each burner, leading to differences in differential pressures. On individual recuperators and manifolds, there is varying intake of false air (depending on the operating condition of the burner, etc.), resulting in a certain variability in the oxygen content in the exhaust gases at the outlet of the preheat chamber within the respective zone.
Therefore, it is more appropriate for controlling the combustion ratios in the individual zones of the chamber to use the aforementioned relationships Equations 37–39.
3.2 Verification of characteristics for combustion process control
From the obtained combustion characteristics for the individual zones of the annealing furnace, it was concluded that achieving an optimal combustion process requires different pressure conditions in the exhaust systems.
These changes aim to achieve:
• A reduction in gas consumption in zones 1, 2, and 6,
• A slight increase in fuel consumption in zone 3,
• Minimal changes in gas consumption in zones 4 and 5.
In order to propose the optimization of combustion process control, it was necessary to verify the validity of the obtained dependencies for the annealing furnace.
The measurements intended to verify the validity of the obtained characteristics were carried out in zones 1, 2, 5, and 6. During the verification of the characteristics, the following parameters were monitored:
• Chamber performance, i.e., gas consumption,
• Zone pressure,
• Exhaust gas composition (O2, CO, NOx) in the common exhausts,
• O2 content, differential pressure
• Zone temperature.
The verification procedure was as follows:
• The above-mentioned parameters were measured under the current operating conditions,
• The gas consumption values and the exhaust gas pressure in the zone were recalculated to the optimal parameters, where the same zone temperature was to be maintained,
• An optimal O2 content in the exhaust gases of 6% was chosen. This value was selected because some burners in the respective zone did not operate with the same combustion characteristics. The O2 content in the zone should range between 3.5% and 7.5%,
• The required parameters were measured under the proposed conditions.
The O2 range between 3.5% and 7.5% was defined by the industrial partner who collaborated on part of this research and who provided the input data measurements. Based on recommendations from this partner, the specified safe O2 range was used for the annealing furnace. As mentioned earlier in this paper, lower O2 contents could result in fuel under burning, which is a loss and also CO formation. In the case of higher O2 content, the flue gas temperature would be lower, which could cause complications in the heating process itself and would need to increase the fuel consumption.
The results of the measurements from the verification of characteristics are presented in Supplementary Table S4.
From the measurements and calculations in Supplementary Table S4, it can be seen that by reducing the excess combustion air to 6%, there is a decrease in fuel consumption in the zone, a slight reduction in the exhaust gas temperatures from the annealing furnace by approximately 10°C, but the change in zone temperature is negligible.
The measurements indicate that the obtained combustion characteristics are suitable for controlling the combustion process in the annealing furnace.
The proposed optimization of the combustion process should lead to a fuel savings of approximately 6%–9% under the same operating conditions, as shown in Supplementary Table S5. With the proposed O2 content of 6 vol.% in the exhaust gases, a fuel savings of 23 m3 h-1 was calculated, and at 5 vol.% O2 content, up to 38 m3 h-1. After recalculating using the average LHV of natural gas, 37.39 MJ m-3, obtained from (SPP-Distribucia, 2024) over the last year, and the average emission factor of 56.18 tCO2. TJ-1, it follows that the annual CO2 emission savings at 6 vol.% O2 in the exhaust gases is 423.2 tCO2 per year, and at 5 vol.% O2 content, up to 700 tCO2 per year.
The introduction to this article states that the EU targets an 11.7% reduction in energy consumption by 2030. In the research presented in this article, the analysis and optimization of the annealing furnace resulted in estimated fuel savings in the range of 6%–9% of consumption. Comparing this fuel saving with the EU target shows that a fuel saving of 6%–9% meets the EU target of 51.2%–76.92%. It should be noted that the optimization only affected part of the combustion process, and it was possible to approach the EU target of more than 50% of the required energy savings.
4 Conclusion
Measurements on the annealing furnace revealed deficiencies in the operation of the burner system and helped clarify the functioning of the radiant burner tubes. The developed methodology for optimizing combustion in the burner system demonstrated potential improvements in managing the thermal performance of the annealing furnace. The results of flue gas analysis from the combustion process served as a control parameter for creating mathematical dependencies applicable for implementation in the CAL software control.
The created dependency models of parameters for single-row and double-row burner configurations in the zones were confirmed by control measurements, validating the proposed methodology.
The validity of the created mathematical dependencies was verified for selected O2 contents in the flue gases, based on combustion statics and control measurements. It was found that with proper adjustment of the individual zones, the O2 content in the flue gases ranges from 4-9 vol.% depending on the burner’s location. At approximately 40% line capacity, CO emissions in the flue gases were completely eliminated, as confirmed by control measurements in the flue gas exhaust before the chimney.
The following are sections that were not included in this research, but their inclusion in future research could provide new results and insights:
a. Investigating the unevenness of the fuel distribution as the annealing furnace power is varied.
b. Use of O2 content outside the range of 3.5%–7.5%.
c. Changes in ambient environmental characteristics related to the change of season or time of year. Ambient temperature, humidity, atmospheric pressure and form change during different months of the year. Future research may investigate the effect of these environmental changes on the combustion process.
Data availability statement
The original contributions presented in the study are included in the article/Supplementary Material, further inquiries can be directed to the corresponding author.
Author contributions
AV: Conceptualization, Formal Analysis, Investigation, Methodology, Project administration, Supervision, Validation, Writing – original draft, Writing – review and editing, Funding acquisition. JK: Conceptualization, Data curation, Formal Analysis, Investigation, Methodology, Project administration, Validation, Visualization, Writing – original draft, Writing – review and editing. MR: Funding acquisition, Writing – review and editing, Investigation, Resources. ŠS: Conceptualization, Data curation, Formal Analysis, Visualization, Writing – original draft, Writing – review and editing, Validation. RD: Data curation, Formal Analysis, Writing – review and editing, Funding acquisition, Investigation.
Funding
The author(s) declare that financial support was received for the research and/or publication of this article. This work was supported by the Slovak Research and Development Agency (APVV-23-0034), VEGA grant agency for supporting research work (VEGA 1/0151/24), and the Cultural and Educational Grant Agency of the Ministry of Education, Research, Development, and Youth of the Slovak Republic (KEGA 024TUKE-4/2024).
Conflict of interest
The authors declare that the research was conducted in the absence of any commercial or financial relationships that could be construed as a potential conflict of interest.
Generative AI statement
The author(s) declare that no Generative AI was used in the creation of this manuscript.
Any alternative text (alt text) provided alongside figures in this article has been generated by Frontiers with the support of artificial intelligence and reasonable efforts have been made to ensure accuracy, including review by the authors wherever possible. If you identify any issues, please contact us.
Publisher’s note
All claims expressed in this article are solely those of the authors and do not necessarily represent those of their affiliated organizations, or those of the publisher, the editors and the reviewers. Any product that may be evaluated in this article, or claim that may be made by its manufacturer, is not guaranteed or endorsed by the publisher.
Supplementary material
The Supplementary Material for this article can be found online at: https://www.frontiersin.org/articles/10.3389/fenrg.2025.1504820/full#supplementary-material
References
C. E. BaukalJr. (2003). Industrial burners handbook. 1st ed. (Boca Raton: CRC Press). doi:10.1201/9780203488805
Blevins, L. G., and Gore, J. P. (1996). Radiative efficiency of a quartz radiant heating tube. Combust. Sci. Technol. 112, 369–373. doi:10.1080/00102209608951967
Cengel, Y., and Ghajar, A. (2020). “Heat and mass transfer: fundamentals and applications,” in SI units. 6th ed (USA: McGraw Hill).
Chen, K., Dai, M., Xu, L., Xu, S., Xie, X., Hu, X., et al. (2024). Inverse parameter identifications and forward strip temperature simulations of the continuous annealing line with physics-informed neural network and operation big data. Eng. Appl. Artif. Intell. 127, 107307. doi:10.1016/j.engappai.2023.107307
Dini, G., Monir Vaghefi, S. M., Lotfiani, M., Jafari, M., Safaei-Rad, M., Navabi, M., et al. (2008). Computational and experimental failure analysis of continuous-annealing furnace radiant tubes exposed to excessive temperature. Eng. Fail. Anal. 15, 445–457. doi:10.1016/j.engfailanal.2007.05.007
European Parliament (2024). Fact sheets on the european union - Energy policy: general principles. Available online at: https://www.europarl.europa.eu/factsheets/sk/sheet/68/energeticka-politika-vseobecne-zasady (Accessed September 10, 2024).
Ferstl, K., and Masaryk, M. A. (2018). Collection of examples from heat transfer - heat transfer by radiation and evaporation of water. 1st ed. Bratislava: SPEKTRUM STU.
Flamme, M., Milani, A., Wünning, J. G., Blasiak, W., Yang, W., Szewczyk, D., et al. (2010). in Radiant tube burners in industrial combustion testing. Editor Ch.E. BaukalJr. 1st ed. (Boca Raton: CRC Press), 487–504. doi:10.1201/EBK1420085280
Goeckner, B. A., Helmich, D. R., McCarthy, T. A., Arinez, J. M., Peard, T. E., Peters, J. E., et al. (1992). Radiative heat transfer augmentation of natural gas flames in radiant tube burners with porous ceramic inserts. Exp. Therm. Fluid Sci. 5, 848–860. doi:10.1016/0894-1777(92)90129-S
Hajaliakbari, N., and Hassanpour, S. (2017). Analysis of thermal energy performance in continuous annealing furnace. Appl. Energy 206, 829–842. doi:10.1016/j.apenergy.2017.08.246
Helfert, F. (1956). Development and significance of the radiant tube in modern furnace design. Gaswärme 5, 336–343.
IEA (2023). CO2 emissions in 2022. Available online at: https://www.iea.org/reports/co2-emissions-in-2022 (Accessed September 10, 2024).
IEA (2024). CO2 emissions in 2023. Available online at: https://www.iea.org/reports/co2-emissions-in-2023 (Accessed September 10, 2024).
Kang, Z. W., and Chen, T. C. (2013). Three-dimensional temperature distributions of strip in continuous annealing line. Appl. Therm. Eng. 58, 241–251. doi:10.1016/j.applthermaleng.2013.03.062
Kang, Z. W., and Chen, T. C. (2014). Longitudinal residual warpage of strip in continuous annealing line. Appl. Therm. Eng. 62, 1–12. doi:10.1016/j.applthermaleng.2013.09.004
Kim, Y., Lee, J., Shin, K. S., Jeon, S. H., and Chin, K. G. (2014). Effect of dew point on the formation of surface oxides of twinning-induced plasticity steel. Mater. Charact. 89, 138–145. doi:10.1016/j.matchar.2014.01.012
Kim, N., Guahk, Y. T., and Ko, Ch. (2024). Numerical simulation of an industrial radiant tube burner using OpenFOAM. Fuel Commun. 19, 100119. doi:10.1016/j.jfueco.2024.100119
Kitaev, B. I., Zobnin, B. F., Ratnikov, V. F., Telegin, A. S., Lisienko, V. G., Bratchikov, S. G., et al. (1970). in Heat engineering calculations of metallurgical furnaces. Editor A. S. Telegin (Moscow: Metallurgiya).
Mital, R., Gore, J. P., and Viskanta, R. (1998). A radiation efficiency measurement procedure for gas-fired radiant burners. Exp. Heat. Transf. 11, 3–21. doi:10.1080/08916159808946551
Mochida, A., Kudo, K., Mizutani, Y., Hattori, M., and Nakamura, Y. (1997). Transient heat transfer analysis in vacuum furnaces heated by radiant tube burners. Energy Convers. Manag. 38, 1169–1176. doi:10.1016/s0196-8904(96)00146-x
Sahay, S. S., and Kapur, P. C. (2007). Model based scheduling of a continuous annealing furnace. Ironmak. and Steelmak. 34, 262–268. doi:10.1179/174328107X165708
Spišák, E., and Majerníková, J. (2016). “Thin steel sheets - methods for evaluating their properties,”. 1st ed. Kosice: TU of Kosice.
SPP-Distribucia (2024). Natural gas composition and emission factor. Available online at: https://www.spp-distribucia.sk/dodavatelia/informacie/zlozenie-zemneho-plynu-a-emisny-faktor/ (Accessed September 16, 2024).
Strommer, S., Niederer, M., Steinboeck, A., Jadachowski, L., and Kugi, A. (2017). Nonlinear observer for temperatures and emissivities in a strip annealing furnace. IEEE Trans. Ind. Appl. 53, 2578–2586. doi:10.1109/TIA.2017.2669327
Tatic, M., Lukac, L., and Sucik, G. (2021). Industrial furnaces in metallurgical secondary production. 1st ed. Kosice: Technical University of Kosice.
Tsioumanis, N., Brammer, J. G., and Hubert, J. (2011). Flow processes in a radiant tube burner: combusting flow. Energy Convers. Manag. 52, 2667–2675. doi:10.1016/j.enconman.2011.02.008
Varga, A., Jablonský, G., Lukáč, L., and Kizek, J. (2013). Thermal technology for metallurgists. 1st ed. Košice: Technical University of Košice.
Wan, F., Wang, Yq., and Qin, Sr. (2012). Modeling of strip heating process in vertical continuous annealing furnace. J. Iron Steel Res. Int. 19, 29–36. doi:10.1016/S1006-706X(12)60096-X
Xu, H. T., Liao, X. W., Qu, Z. G., Li, Y. Z., and Chen, J. (2017). Experimental study of the effect of a radiant tube on the temperature distribution in a horizontal heating furnace. Appl. Therm. Eng. 112, 1–7. doi:10.1016/j.applthermaleng.2016.10.208
Zhang, Y., Jin, Y., Cao, W., Li, Z., and Yuan, Y. A. (2018). “Dynamic data-driven model for predicting strip temperature in continuous annealing line heating process,” in 37th Chinese Control Conference (CCC), 25-27 July 2018 (Wuhan, China: IEEE), 1887–1891.
Keywords: radiant tube burner, recuperator, flue gas analysis, combustion optimization, pressure loss
Citation: Varga A, Kizek J, Rimar M, Staško Š and Dzurňák R (2025) Experimental determination of parameter dependencies in the combustion process of a radiant tube burner system. Front. Energy Res. 13:1504820. doi: 10.3389/fenrg.2025.1504820
Received: 25 October 2024; Accepted: 14 August 2025;
Published: 11 September 2025.
Edited by:
Maria Grazia De Giorgi, University of Salento, ItalyReviewed by:
Guangcai Gong, Hunan University, ChinaNikita Martyushev, Tomsk Polytechnic University, Russia
Copyright © 2025 Varga, Kizek, Rimar, Staško and Dzurňák. This is an open-access article distributed under the terms of the Creative Commons Attribution License (CC BY). The use, distribution or reproduction in other forums is permitted, provided the original author(s) and the copyright owner(s) are credited and that the original publication in this journal is cited, in accordance with accepted academic practice. No use, distribution or reproduction is permitted which does not comply with these terms.
*Correspondence: Jan Kizek, amFuLmtpemVrQHR1a2Uuc2s=