 Julia Terrapon-Pfaff
 Josua Braun
 Sibel Raquel Ersoy
 Magdolna Prantner1
 Peter Viebahn
- 1Wuppertal Institute for Climate, Environment and Energy, Division Future Energy and Industry Systems, Wuppertal, Germany
- 2German Aerospace Center (DLR), Institute of Networked Energy Systems, Stuttgart, Germany
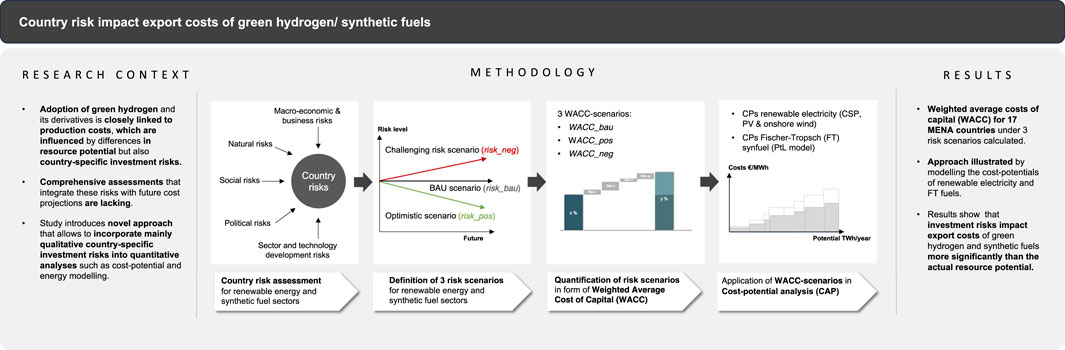
Green hydrogen, produced from renewable energy sources such as wind and solar, is increasingly recognized as a critical enabler of the global energy transition and the decarbonization of industrial and transport sectors. The successful adoption of green hydrogen and its derivatives is closely linked to production costs, which can vary substantially between countries, depending not only on resource potential but also on country-specific financing conditions. These differences arise from country-specific risk factors that affect the costs of capital, ultimately influencing investment decisions. However, comprehensive assessments that integrate these risks with future cost projections for renewable energy, green hydrogen, and its synthetic downstream products are lacking. Using the Middle East and North Africa (MENA) as an example, this study introduces a novel approach that allows to incorporate mainly qualitative country-specific investment risks into quantitative analyses such as cost-potential and energy modelling. Our methodology calculates weighted average costs of capital (WACC) for 17 MENA countries under different risk scenarios, providing a more nuanced assessment compared to traditional models that use uniform cost of capital assumptions. The results indicate significant variations in WACC, such as between 4.67% in the United Arab Emirates and 24.84% in Yemen or Syria in the business-as-usual scenario. The incorporation of country-specific capital cost scenarios in quantitative analysis is demonstrated by modelling the cost-potential of Fischer-Tropsch (FT) fuels. The results show that country-specific investment risks significantly impact costs. For instance, by 2050, the starting LCOFs in high-risk scenarios can be up to 180% higher than in lower-risk contexts. This underlines that while renewable energy potential and its cost are important, it are the country-specific risk factors—captured through WACC—that have a greater influence in determining the competitiveness of exports and, consequently, the overall development of the renewable energy, green hydrogen and synthetic fuel sectors.
1 Introduction
So called green hydrogen, produced from renewable sources such as wind and solar, is increasingly being recognised as a key strategic element to drive the global energy transition and the decarbonization of the industrial and transport sector forward. The acceptance and widespread application of green hydrogen and its derivatives, however, will strongly depend on the costs. A key element driving the cost are the expenses for renewable electricity. Therefore, countries with high renewable energy potential that can produce renewable electricity at low cost are expected to become the leading producers and exporters of green hydrogen and its synthetic downstream products. In this context the Middle East and North Africa (MENA) are frequently highlighted as potential future producers and exporters due to their favourable solar and wind energy potentials and geographic proximity to major demand centres in Europe and/or Asia.
The costs and, more generally, the decision whether to invest in a particular technology are strongly influenced by country-specific circumstances. This is particularly true for capital-intensive renewable energies, where investment and financing costs are the primary determinant of the levelised cost of electricity (LCOE) (Egli, 2020; Waissbein et al., 2013). The same applies to the production of synthetic fuels derived from renewable energies, where energy costs are also the largest cost factor. In the production of hydrogen with electricity from wind and solar sources, for example, the average share of energy costs in the total costs is around 50%–70%. Differences in financing costs (debt and equity) can therefore strongly influence the development of the green hydrogen sectors in different countries. The impacts of country risks on the cost of capital can be reduced through various mechanisms, such as guarantees, off-take agreements or initial financing from national or multilateral development banks (Hamilton, 2011). These mechanisms play a key role in reducing the risks associated with entering certain markets. In the long term, however, the development and expansion of the renewable and synthetic fuel sector requires significant investment on a large scale from the private sector (Waissbein et al., 2013). Accordingly, it is necessary to take into account the risks perceived by private investors and assess the impact of these risks on financing costs and ultimately on electricity, hydrogen and synthetic fuel generation costs (Schinko and Komendantova, 2016).
So far, however, the impact of country risks on costs has been included only to a very limited extent in the systematic assessment of country potentials (Bogdanov and Child, 2019; Labordena et al., 2017). Most research on risks in the renewable sector is qualitative and only a few studies have investigated how country risks are reflected in the cost of capital (Schinko and Komendantova, 2016). Exceptions are the studies by Peters (2011), who examines the economics of solar energy technologies in the United States, Germany, Spain, China and Egypt, and Schmidt et al. (2012), who analyse the costs of wind and solar energy in six selected developing countries. Furthermore, Ondraczek et al. (2013) show that the capital costs for photovoltaics have a stronger influence on the electricity production costs worldwide than the quality of solar resources. Similarly, Schinko and Komendantova (2016) conclude that for North Africa, the capital costs for Concentrated Solar Power (CSP) are much higher than in Europe, and that risk reduction can have a strong impact on the cost of electricity generation. In this context, Labordena et al. (2017) have shown in their study that variations in risk between countries affect the cost of electricity from CSP more than variations in solar resources, even in Southern Africa. The previous studies thus show that country risks have a significant influence on costs and thus ultimately also on the investment decision.
The fact that capital cost differences between countries have hardly been taken into account so far does not only apply to the analysis of today’s situation, but also to the future costs for renewable energies as well as green hydrogen, synthetic fuels and their precursors. Thus, when modelling energy scenarios, largely uniform assumptions on capital costs are used for all countries worldwide. For example, the International Energy Agency (IEA) assumes capital costs of 7%–8% for all countries, the International Renewable Energy Agency (IRENA) assumes 7.5% for OECD countries and China, and 10% for the rest of the world (Bogdanov and Child, 2019; Egli et al., 2019). This approach is criticised by Egli et al. (2019), among others, because while it allows for the comparison of technologies, the results can be distorted or even reversed when comparing across different countries. In general, the lack of consideration of country risks in the capital costs means that the costs in developing and emerging countries are assumed to be too low and too high for industrialised countries (ibid.), which does not allow a realistic statement about future expansion and export potentials. Despite the existing criticism, however, there are as yet no accepted methods for projecting country risk costs for the future. According to Bogdanov and Child (2019), using today’s capital costs is not an option, as the country situation can change over time, resulting in a higher bias than with uniform capital cost assumptions.
To address this research gap, this study develops an approach that allows considering the impact of country-specific risks on the future costs of renewable electricity and green hydrogen-based synthetic fuels. In specific, this approach can be used to calculate country-specific weighted average costs of capital (WACCs) for different scenarios. WACC is a financial metric that is used to measure overall cost of capital, accounting for costs of its equity and debt, serving as a tool for determining the economic viability of potential investments. The determined country-specific WACCs can then be applied in the context of cost-potential analysis (CPA) or energy scenario modelling to compare and analyse country-specific differences. In this study, the approach was applied to calculate WACCs for three risk scenarios for 17 countries in the MENA region. The group of countries studied includes Algeria, Bahrain, Egypt, Iraq, Iran, Jordan, Kuwait, Lebanon, Libya, Morocco, Oman, Qatar, Saudi Arabia, Syria, Tunisia, the United Arab Emirates (UAE) and Yemen. The determined country-specific WACC scenarios were subsequently applied in the modelling of cost-potentials (CPs) to investigate the influence of country risks on the future costs of renewable electricity and synthetic fuels that could be produced and made available for export in the analysed MENA countries. The results could inform the development of investment strategies that account for risk differentials, potentially enhancing the economic sustainability and resilience of the green hydrogen development in the MENA region. For policymakers, understanding the interplay between country risks and WACC allows for the creation of more informed and effective policies. This could include incentives for investments in regions with higher risks or support mechanisms like guarantees or insurance to lower the effective WACC and attract private investment.
2 Methods
To account for the costs of country risks, the risks must first be mapped and then converted into costs. To this end, an approach was developed to determine country-specific WACCs for different scenarios (Figure 1). First, risks for renewable energy and synthetic fuel sectors are assessed for each country, including a business-as-usual scenario (risk_bau) and two opposing scenarios (risk_pos and risk_neg). Next, current equity and debt capital costs (WACC-bau) are calculated. Future capital costs are then determined by quantifying risk contributions to current financing costs and adjusting for the two risk scenarios (WACC-pos and WACC-neg).
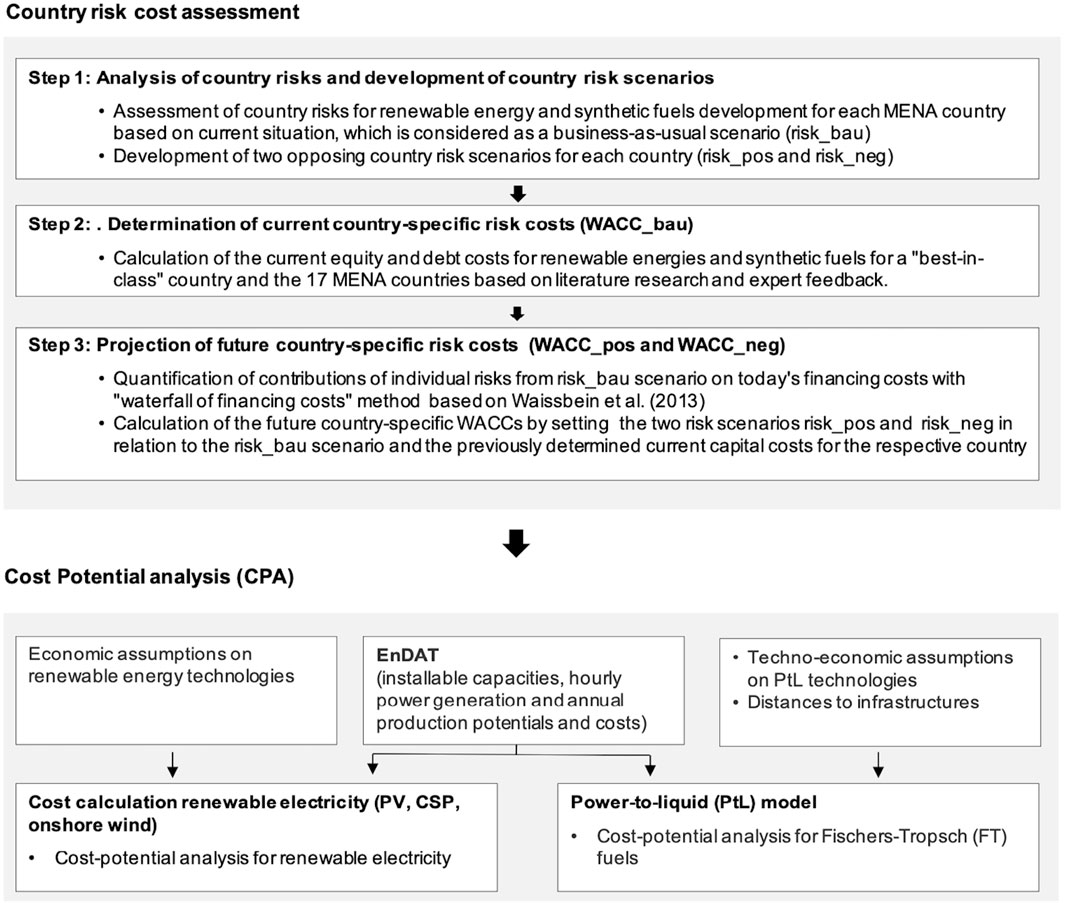
Figure 1. Overview of country risk cost assessment and cost-potential analysis approach.
In a second step, these WACC scenarios are applied in a CPA to assess their impact on renewable electricity and FT-based synthetic fuel generation costs in different countries. The methods for determining WACCs and cost-potential modelling are outlined in the following sections.
2.1 Future risk costs calculation approach
2.1.1 Analysis of country risks and development of risk scenarios
The basis for determining country-specific risk costs is an assessment of individual country risks (Table 1) for the development of the renewable energy, green hydrogen, and synthetic fuel sectors. Eleven risks were assessed in detail for each of the 17 MENA countries, evaluated along two dimensions: “likelihood” and “impact.” Likelihood, as defined by ISO 31000 (2018), refers to the probability that an event will occur, while impact refers to the consequences of that event, which can be positive or negative, direct or indirect (ISO, 2018). These dimensions were combined into a single risk value (Aven, 2017), with higher values indicating higher risk. In this study, likelihood and impact were scored on a five-point scale and multiplied to calculate the risk value, resulting in an assessment for each risk in both sectors. The individual risk scores were then aggregated into an overall country risk score, which ranged from a minimum of 11 to a maximum of 275 points (Terrapon-Pfaff et al., 2024).
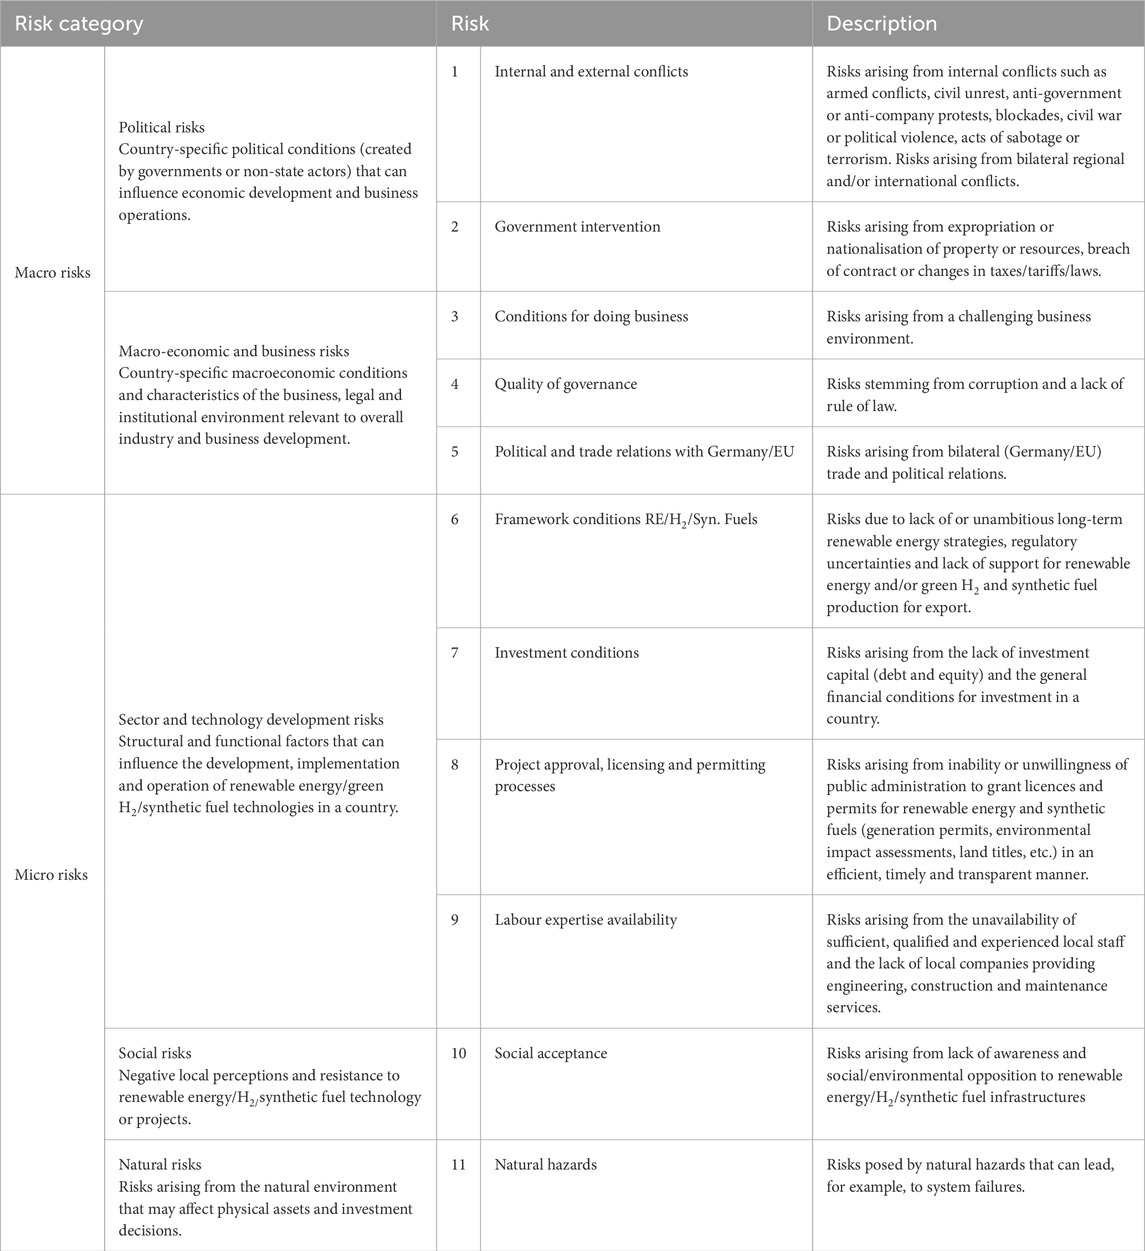
Table 1. Overview of country risks considered in the risk assessment (Terrapon-Pfaff et al., 2024).
Although risk assessments typically reflect current or near-future risks, this study aimed to estimate long-term risks. Therefore, three risk scenarios were developed: a baseline scenario (risk_bau), a positive scenario (risk_pos) where risks decrease, and a challenging scenario (risk_neg) where risks increase. These scenarios were tailored to each of the 17 MENA countries, with risks assessed accordingly. While each risk and country may evolve differently, this approach expands the exploration of possibility ranges. The resulting risk scores (provided in the Supplementary Materials 1, 2) serve as the basis for estimating country-specific risk costs.1
2.1.2 Determination of current country-specific risk costs
To translate country risks into costs, their impact on the cost of capital is measured, based on the assumption that higher risks require higher returns, thus raising capital costs (Waissbein et al., 2013). This study follows the UNFCCC (2015) recommendation to use country-specific WACCs when financing cost details are unavailable, as seen in similar studies (e.g., Labordena et al., 2017; Noothout et al., 2016; Ondraczek et al., 2013; Schinko and Komendantova, 2016). The level of the WACC is thus viewed as an indicator of the risk level in a country. The required capital can be sourced from external parties, such as investors and banks, or from internal resources. It is calculated from the cost of equity and debt capital and their ratio, with debt representing a real cost and equity an opportunity cost (Ondraczek et al., 2013).
In this study, equity and debt costs are distinguished across 17 countries for both the renewable energy as well as green hydrogen and synthetic fuel sectors using country risk premiums. Differentiating between renewable energy technologies such as solar and wind, and emerging technologies like green hydrogen, due to varying degrees of technological maturity, infrastructure needs, and regulatory environments. Renewable energies are well-established and clear regulatory frameworks often exists, whereas green hydrogen and the subsequent synthesis processes are still in their early stages, facing greater uncertainties and complexities. This includes challenges such as the need for new infrastructure, adaptation of existing networks, and a less developed, more complex supply chain that requires specialised equipment and materials. However, no distinction is made between individual technologies, as the variation in capital costs between technologies is minimal compared to country differences (Egli et al., 2019), and cross-country cost variations for a given technology are hard to quantify (Ondraczek et al., 2013). Therefore, uniform technology risk premiums were assumed for renewable energy, green hydrogen, and synthetic fuels. The cost of capital consists of three components: interest on safe investments, country risk premium, and technology risk premium, with separate calculations for equity and debt cost. The cost of debt (CoD) is calculated according to Equation 1:
The risk-free interest rate is based on long-term debt securities, specifically the average interest rate on 10-year US government bonds (0.86% p.a., March 2019). Country risk premiums are derived from Damodaran (2020), which provides sector-averaged data. While specific data for renewable or synthetic fuel sectors is unavailable, the risks differ, especially given that the synthetic fuel sector is still in its early stages. Therefore, the average country risk premium from Damodaran (2020) was used for the renewable sector, with an additional country-specific technology risk premium added for synthetic fuels.
For debt costs, the technology-specific risk premiums—representing inherent risks of each technology—were set at an average of 4% for renewable energy and 5% for synthetic fuels, based on literature (Henbest et al., 2015; Noothout et al., 2016) and expert opinions. The applied parameters are summarized in Table 2 (a detailed overview of the financial input data can be found in the Supplementary Material 3).
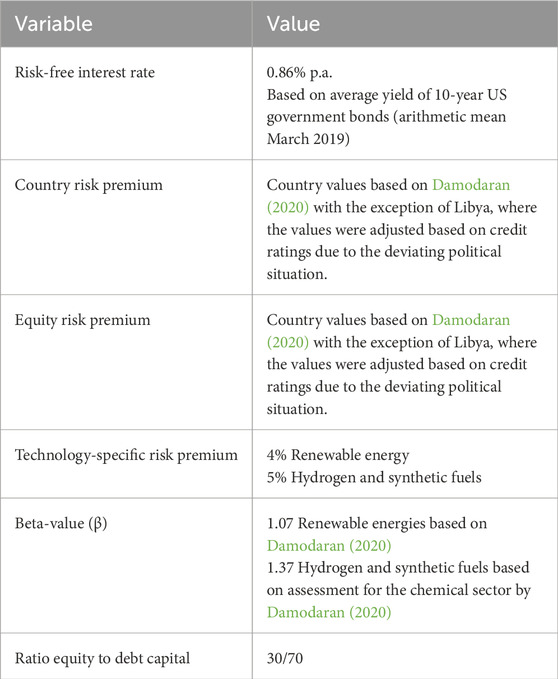
Table 2. Overview of parameters used to calculate the weighted average cost of capital (WACC).
The calculation of the cost of equity (CoE) in Equation 2 is based on the Capital Asset Pricing Model (CAPM):
The risk-free interest rate is determined as described for the CoD calculation. The equity risk premium (ERP) represents the difference between the returns on a risk-free asset and investments in projects/shares, and is multiplied by the beta value (β). Beta measures the risk of equity investments in renewable or synthetic fuels compared to the market index (β > 1 indicates higher risk, β < 1 lower risk). For the renewable energy sector, the value of β = 1.07 from Damodaran (2020) is used. For the synthetic fuel sector, due to the lack of specific beta values, the value for basic chemicals (β = 1.37) is applied, as synthetic fuels are considered riskier.
Additionally, the debt-to-equity ratio, assumed to be 70% debt and 30% equity, is used to calculate the WACC. This ratio is common in the renewable energy sector and large-scale energy projects in general, where debt financing is often preferred due to lower borrowing costs and government-backed incentives (IRENA and CPI 2018; Noothout et al., 2016; Waissbein et al., 2013). In the case of emerging technologies such as green hydrogen and synthetic fuels, this intermediate ratio also reflects the early stage of development of the technology and the market. It corresponds, for example, to the ratio of 71/29% for the NEOM green hydrogen project in Saudi Arabia (World Bank, 2023). However, it is important to note that this ratio can vary considerably in practice depending on the country and specific project conditions. Based on the calculated CoD and equity in Equations 1, 2, the WACC is determined using Equation 3:
The nominal values given were inflation-adjusted and it was further calculated with the real discount rates in order to enable an intertemporal comparison. For the inflation adjustment, average values of the Consumer Price Index (CPI) and the GDP deflator from 2010–2018 by country and country group were calculated from the World Bank dataset (World Bank, 2020). As the values are based on the US dollar currency and US markets as reference, a rescaling of the WACC results to Euros was performed. The result of the analysis are country-specific WACCs from the valuation of the current situation, which are used in the following analysis as WACCs for the business-as-usual scenario (WACC_bau).
2.1.3 Projection of future country-specific risk costs
The next step is to determine the WACC for two risk scenarios (risk_pos and risk_neg). To do this, the “financing cost waterfall” method developed by Waissbein et al. (2013) is applied. Assuming that technology-inherent risks and associated capital costs are the same across all countries, the capital cost differences for debt and equity are defined as country-specific risk costs. These are calculated by comparing the risk premiums for each country in the WACC_bau scenario to those of a “best-in-class” country, which has very low risks and financing costs. The difference between the interest rates of the “best-in-class” country (here assumed to be the United States for both debt and equity, following Damodaran, 2020) and the analysed country represents the country risk. The country risk costs can then be broken down by individual risks, allowing for the quantification of each risk’s contribution to financing costs. To calculate the proportional contribution of each individual risk to the capital cost difference (d), the risk scores for the eleven risks are compared to the difference relative to the best-in-class country using Equation 4:
The result is a “financing cost waterfall,” where the risk premium for each risk category is iteratively allocated to the total financing cost. This calculation is done separately for equity and debt, as these investors face different risks (Waissbein et al., 2013). Equity investors are exposed to risks from the planning phase, whereas debt investors typically enter later, once business plans and licenses are secured (ibid.). As a result, planning phase risks are excluded from debt capital interest calculations.
By allocating current risk costs to individual risks, future capital costs can be estimated by comparing the risk scores for the two scenarios (risk_pos and risk_neg) to the current risk environment (risk_bau) and the previously determined capital costs (WACC-bau) for each country relative to the “best-in-class” country. These calculations yield the cost of capital difference for both scenarios, reflecting the increased or decreased risk in the selected country. Equation 5 is used to calculate the cost of capital difference (d) for the risk_pos scenario:
Equation 5 used to calculate the capital cost difference (d) for the risk_pos scenario is also applied to the risk_neg scenario, with the risk values for this scenario (
2.2 Cost-potential analysis for Fischer-Tropsch fuel
To assess the impact of country-specific risks on the costs of renewable electricity and synthetic fuels for export in MENA countries, the three WACC scenarios (WACC_bau, WACC_pos, WACC_neg) were applied alongside a reference scenario (WACC_ref) with an average WACC of 6% in a CPA (see the detailed methodology and results for the reference scenario in Braun et al., 2024). The CPA includes determining technical generation and export potentials and the associated production costs, so called CPs. The CPs were modelled for electricity from PV, CSP, and wind onshore, used for Fischer-Tropsch (FT) based synthetic fuel production, with hydrogen as an intermediate product, for the years 2030, 2040 and 2050. FT is a catalytic chemical process that converts a mix of hydrogen and carbon monoxide into liquid hydrocarbons, which can then be processed into synthetic diesel and gasoline. The CPs show annual generation and export potentials and levelised production costs, with data sorted by ascending production costs and cumulated potentials. For determining domestic and export CPs, a long-term RE potential analysis, CO2 potentials analysis and energy demand analysis were carried out. The underlying methodology of Braun et al. (2024) is summarized in the following.
The renewable potential analysis was carried out with the DLR’s energy data analysis tool (EnDAT) and includes the determination of RE resources and available land area as well as a power plant modelling. The results of this analysis provided installable capacities and hourly power or heat production for the specified RE technologies at a spatial resolution of 0.045° (approx. 5 km). In order to perform the further CPA for FT fuels, the data was aggregated at a coarser resolution of 0.45° (approx. 50 km) in the 17 MENA countries.
The costs for FT fuels were determined by modelling a Power-to-Liquid (PtL) route. The techno-economic PtL model optimizes the design of generation plants, adhering to relevant constraints such as mass and energy balances. These plants were modelled as stand-alone units without grid connections. Inputs included hourly electricity or heat generation time series of the RE potential analysis, techno-economic assumptions for system components and distance maps to infrastructure. For the WACC_bau, WACC_pos and WACC_neg case, the country- and technology-specific WACCs are integrated as interest rate in the plant optimization modelling. For the WACC_ref case, a constant WACC of 6% was used. The electricity supply considered a renewable energy power plant, energy storage (battery or thermal), and electricity transmission. The electricity transmission from the RE power plant to the PtL plant was assumed to be a high-voltage direct current (HVDC) line with direct connection between the two sites. The PtL plant included a PEM electrolyser, hydrogen storage, and FT synthesis including a RWGS reactor. To optimize infrastructure, the PtL plant was assumed to be located near a port serving as export hub, with renewable electricity sourced from local solar or wind plants within a 50 km grid cell. The two commodities water (H2O) and CO2 were included in the modelling system as external variables. H2O was assumed to be sourced from nearby seawater desalination plants utilizing reverse osmosis technology, fuelled primarily by renewable energies. CO2 was assumed to be obtained either from nearby carbon capture and use (CCU) facilities or from direct air capture (DAC) systems. The amount of fuel produced was estimated based on the maximum locally installable renewable energy capacity. A flowchart of considered components and commodities can be found in Braun et al. (2024).
The technical fuel generation potential does not consider the countries’ own demand. Therefore, the generation potential was split into domestic and export potentials, by considering this electricity and synfuel demands. The countries’ own demands underly an energy scenario which aims a 100% renewable supply by 2050. The domestic potentials were linked to the cheapest fuel generation potentials, while the export potentials were allocated to the more expensive ones. Moreover, favourable renewable potentials were reserved exclusively for meeting the remaining domestic electricity demand of other sectors. As a result, this allocation creates a noticeable gap between the most expensive domestic fuel potentials and the cheapest fuel export-oriented potentials. The analysis utilized the resulting energy demands from the energy scenario ALT2, presented in Braun et al. (2024). This scenario assumes a 100% renewable energy system combined with moderate efficiency developments, leading to relatively high energy demands in each country.
For the domestic fuel production, CO2 from iron and steel and cement production facilities were considered in the sense CCU. Therefore, a CO2 scenario assuming the current policy and an ambitious technology development was taken into account. This scenario resulted in comparatively low future CO2 emissions from the industry considering primarily process related CO2. Furthermore, the CO2 potential was limited to the utilization for the domestic synfuel production. Different costs are assumed for deriving CO2 from iron and steel or cement. The resulting CO2 CPs were used for the cheapest fuel potentials. In contrast to the use of CCU for domestic potentials, the export fuel potentials considered CO2 only from DAC to ensure a 100% green fuel production. The specific costs for CO2 refer to a stream with a purity higher than 95%.
3 Analysis and results
This section explores the impact of country-specific risks on financing costs for renewable energy, hydrogen, and synthetic fuels. Section 3.1 examines current risk costs (Section 3.1.1) and projects future risk costs under scenarios of both decreasing and increasing risks (Section 3.1.2). Section 3.2 applies these scenarios to FT fuel production, offering a detailed analysis of local production costs (Section 3.2.1), starting costs under various scenarios (Section 3.2.2), production potentials alongside their associated costs (Section 3.2.3), and the impacts of country-specific risk costs, using a reference scenario as a benchmark (Section 3.2.4).
3.1 Country-specific risk costs
3.1.1 Current country-specific risk costs
The WACC modelling was initially conducted for a business-as-usual scenario, reflecting the current risk environment and prevailing financing costs (as described in Section 2.1.2). This analysis yielded the WACCs for renewable energy and synthetic fuels across 17 MENA countries (Table 3). The results highlight significant differences in WACCs among the analysed countries. The lowest WACCs were observed in Kuwait, the UAE, Qatar, and Saudi Arabia for both renewable energy development and the emerging sectors of green hydrogen and synthetic fuels. Within individual countries, WACCs for renewable energy projects were consistently lower than those for green hydrogen and synthetic fuel projects. However, when comparing across countries, nations with generally lower WACCs often exhibit significantly lower capital costs for green hydrogen and synthetic fuels than countries with medium to high WACCs for renewable energy projects. Accordingly, renewable energy projects in countries with high risks are likely to be less attractive and more costly compared to green hydrogen and synthetic fuel projects in countries with lower risks. Consequently, countries with low WACCs may see accelerated development of the green hydrogen sector and downstream synthetic fuel industries. In contrast, countries with higher WACCs might experience slower or more limited growth, even in the upstream renewable energy sector.
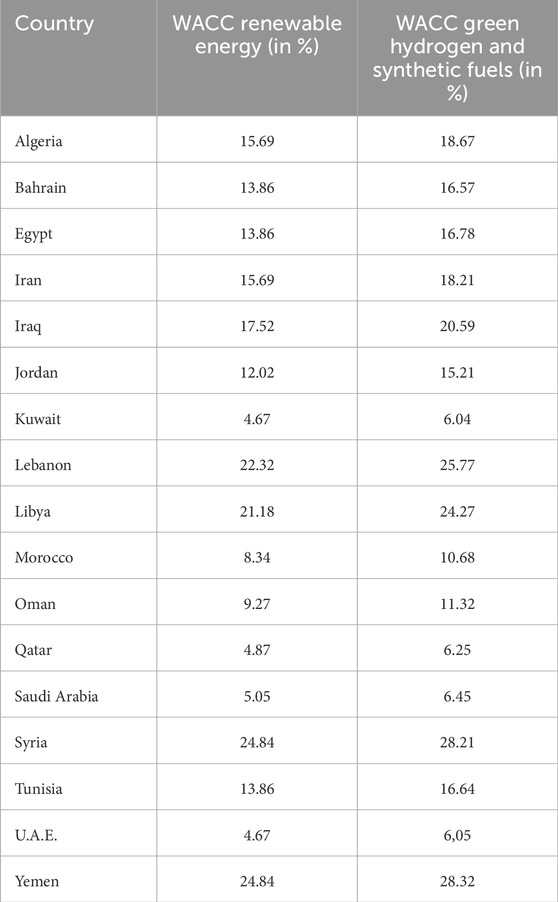
Table 3. Weighted average cost of capital (WACC)_bau in % (inflation-adjusted, before taxes)2.
Following the determination of WACCs for the business-as-usual scenario (WACC_bau), which reflects the current risk environment for renewable energy and the green hydrogen/synthetic fuel sectors, the contribution of country-specific risks to debt and equity costs was analysed by applying Equation 4. In the following, the contributions of individual risks to the capital costs are analysed for renewable energies (3.1.1.1), and subsequently for green hydrogen and synthetic fuels (3.1.1.2).
3.1.1.1 Current country-specific risk costs for renewable energies
Figure 2a illustrates that debt costs for the renewable energy sector in all analysed MENA countries exceed those of the United States, the “best-in-class” country with estimated debt costs of approximately 4.86%. The Gulf states—Kuwait, Qatar, the UAE, and Saudi Arabia—show debt costs close to the United States, ranging between 5%–6%. In contrast, conflict-affected countries like Syria and Yemen exhibit debt costs exceeding 25%, with macro risks such as internal conflicts, governance quality, and business conditions significantly driving up costs. Similarly, Figure 2b highlights the elevated equity costs for the renewable energy sector. While the USA’s equity costs are estimated at 7.29%, only Kuwait, Qatar, Saudi Arabia, and the UAE achieve comparable levels. Countries like Morocco (12.18%), Oman (13.18%), Jordan (16.11%), and Tunisia (18.07%) fall in the mid-range, with equity costs between 12%–18%. Given the capital-intensive nature of renewable energy, reliance on costly equity and debt capital can significantly hinder sector development, limiting progress to isolated large-scale projects.
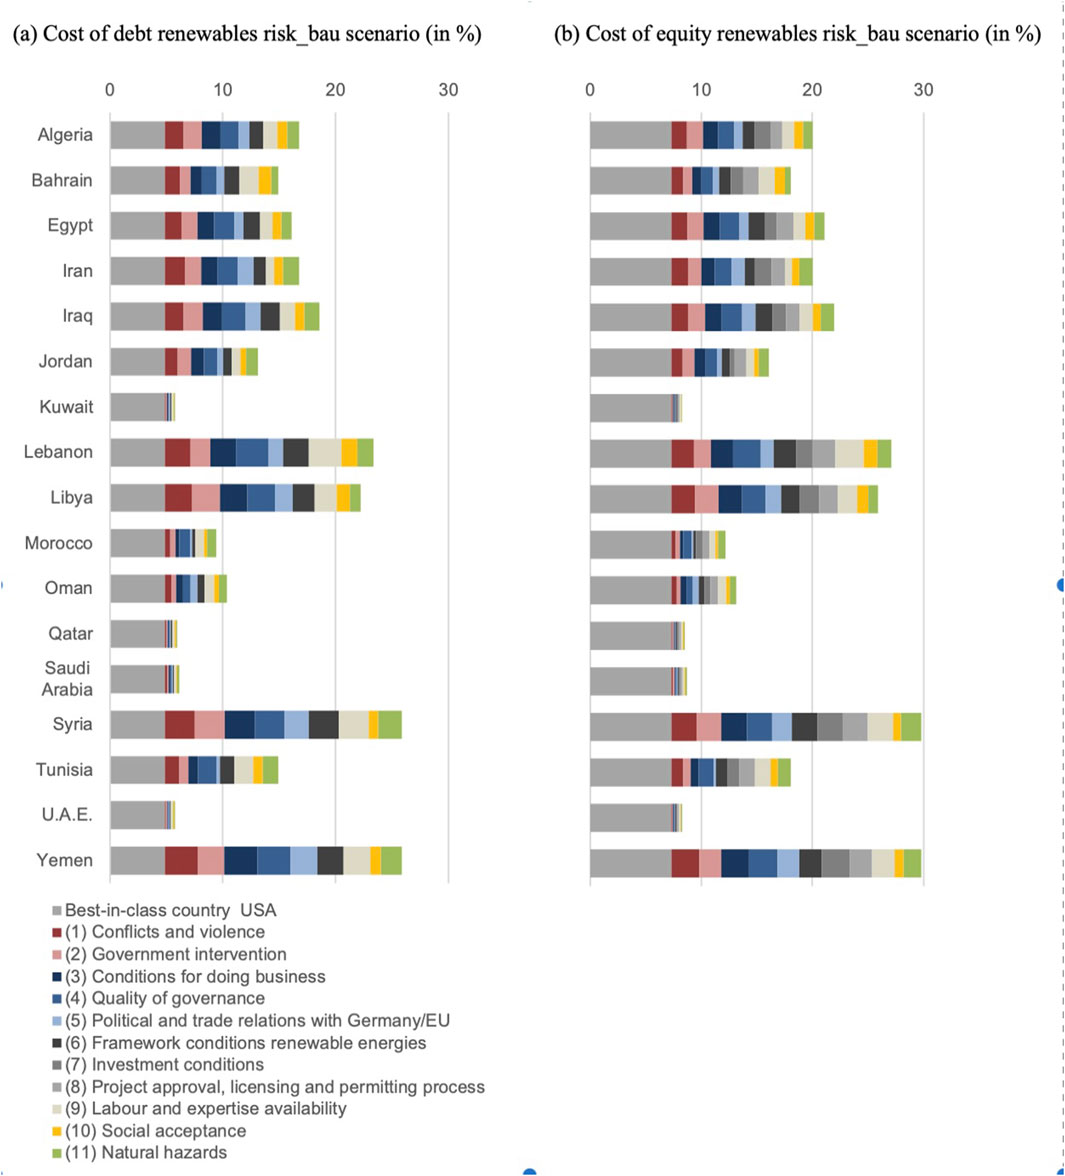
Figure 2. Contribution of country risks to cost of debt (a) and equity (b) for renewable energies.
3.1.1.2 Current country-specific risk costs for green hydrogen and synthetic fuels
The CoD and CoE in the green hydrogen and synthetic fuels sector in developing regions is notably higher compared to the more mature renewable energy sector. These elevated financing costs are driven by a range of investment risks that are more pronounced in emerging sectors. For debt financing (Figure 3a), macroeconomic risks are the most influential, particularly (1) Conflicts and violence, (2) Government intervention, (3) Conditions for doing business and (4) Quality of governance. These factors drive up borrowing costs, while other risks also play a role but to a lesser extent. In contrast, the cost of equity (Figure 3b) is more affected by sector-specific development risks, including (6) Framework conditions for green hydrogen and synthetic fuels, (7) investment conditions in green hydrogen and synthetic fuels technologies, (8) Project approval, licensing and permitting processes as well as (9) Labour and expertise availability. These factors are particularly pronounced in countries in the midrange such as Morocco, Oman, Jordan, and Tunisia.
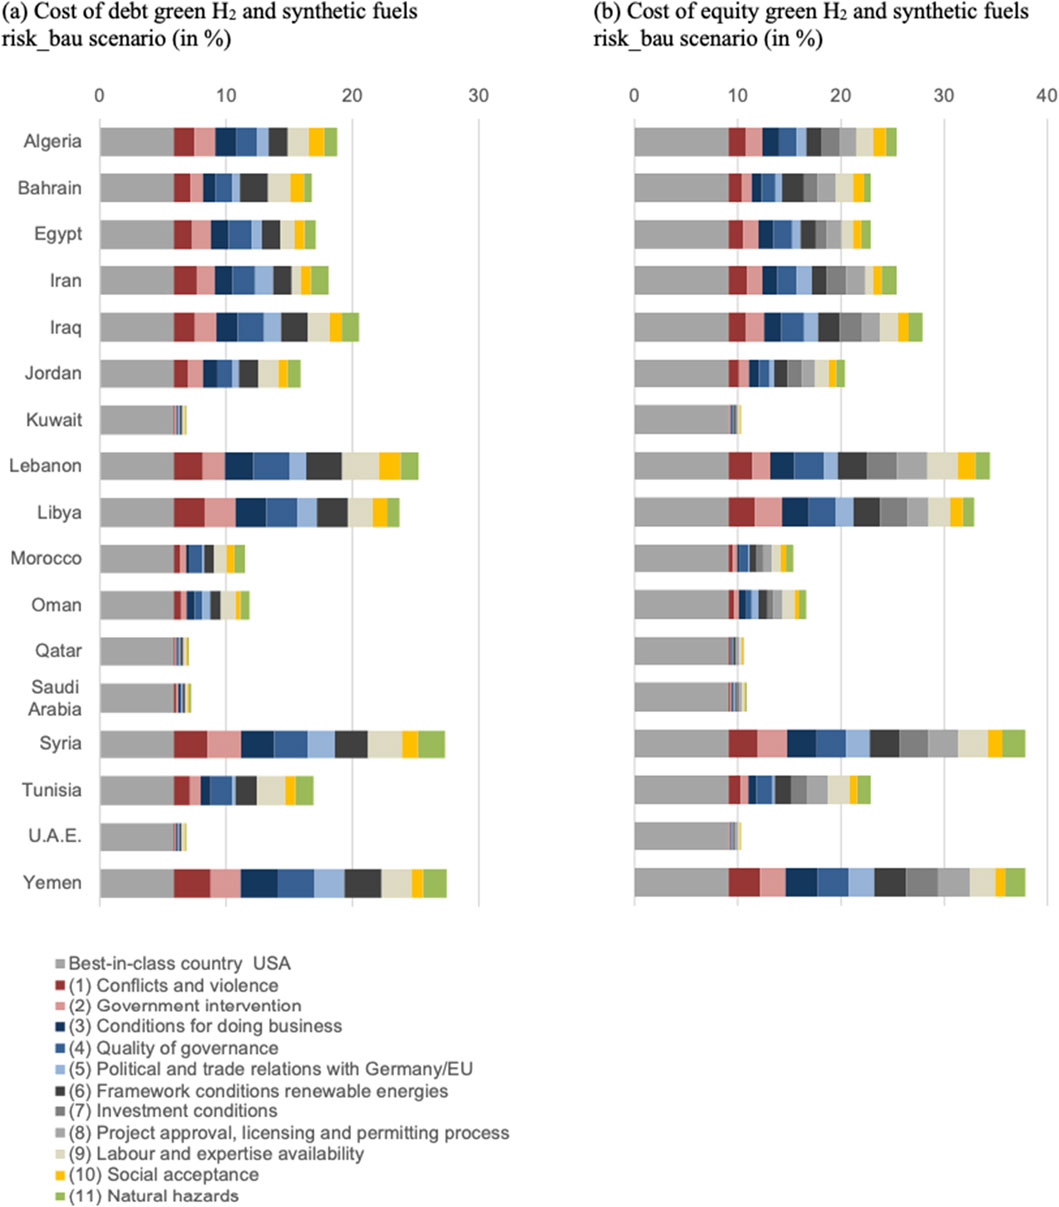
Figure 3. Contribution of country risks to cost of debt (a) and equity (b) for green hydrogen and synthetic fuels.
When examining actual capital costs, the United States, considered the “best-in-class” benchmark, has relatively low financing costs, with debt at 5.86% and equity at 9.09%. The Gulf States—Kuwait, Saudi Arabia, Qatar, and the UAE—show similar but slightly higher capital costs, with debt ranging from 6.87% to 7.24%, and equity between 10.34% and 10.86%. In contrast, countries like Morocco and Oman experience much higher financing costs, with debt reaching 11.47% and 11.85%, respectively, and equity costs surpassing 15%. A larger group of countries, including Algeria, Bahrain, Egypt, Iran, Iraq, Jordan, and Tunisia, experience even higher financing costs, with borrowing costs exceeding 15% and equity costs exceeding 20%. These figures are substantially higher than those in the United States and Saudi Arabia and the Gulf states Kuwait, Qatar and U.A.E. Given the capital-intensive nature and long lifespan of energy sector assets, these elevated financing costs could severely affect the competitiveness of the green hydrogen and synthetic fuel sector in these countries. The most significant challenges are faced by conflict-ridden countries such as Libya, Syria, Yemen, and Lebanon, where the financing costs are exceptionally high due to political instability and economic crises.
3.1.2 Scenarios for country-specific risk costs
Following the modelling of the individual risk contributions to capital costs in a business-as-usual scenario, country-specific risk costs were determined for two alternative scenarios: one with decreasing risks (risk_pos) and another with increasing risks (risk_neg). These scenarios provide insights into how shifts in risk factors can influence financing costs for renewable energy and green hydrogen and synthetic fuels projects.
3.1.2.1 Scenarios for country-specific risk costs renewable energies
Figure 4 illustrates the WACCs associated with these scenarios (WACC_pos and WACC_neg) as well as the risk_bau scenario (WACC_bau) for the renewable energy sector, highlighting notable country-specific variations. The derisking portrayed in the risk_pos scenario depends on various factors, with a key contributor being improved (4) quality of governance, which addresses issues such as weak institutions, corruption, and legal challenges in countries like Algeria, Egypt, Iran, Iraq, Morocco, and Lebanon. This substantially reduces risks and lowers WACCs in these countries, contributing to overall improvements with reductions ranging from 1.94% to 6.69% in the risk_pos scenario compared to the risk_bau scenario. Another significant contributor to derisking is the enhancement of (6) framework conditions for renewable energy. Countries like Saudi Arabia and Tunisia benefit from clearer, more supportive policies that reduce uncertainties and foster investor confidence. Additionally, addressing (9) labour and expertise availability is essential, particularly in Gulf States such as Bahrain, Kuwait, Qatar, and the UAE. Expanding the skilled workforce in the renewable energy sector reduces development risks and minimizes costs associated with importing labour. These factors contribute to WACC values dropping to approximately 11.31% in Bahrain, 4.35% in Kuwait, 4.42% in Qatar, and 4.28% in the UAE. In contrast, countries such as Libya, Syria, and Yemen continue to face significantly higher WACC values in the risk_pos scenario—14.52%, 16.47%, and 17.61%, respectively. These elevated values are primarily driven by ongoing challenges related, for example, to (1) conflict and violence, which are expected to persist despite efforts to mitigate risks.
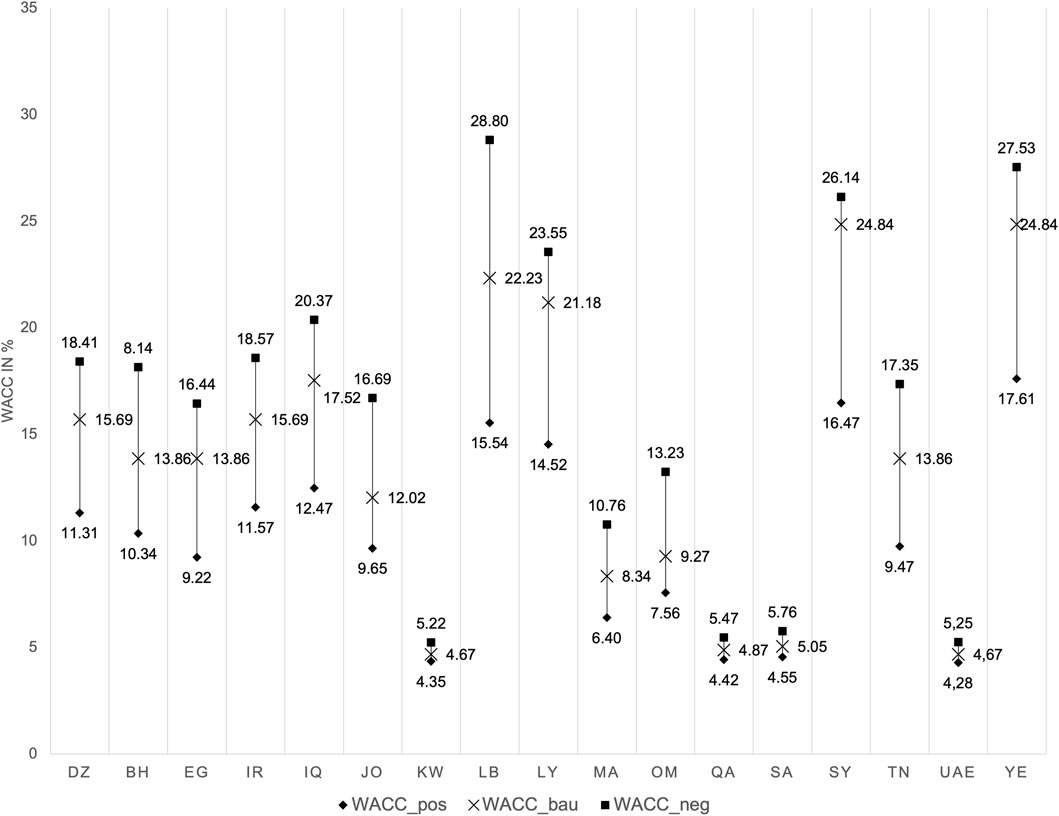
Figure 4. Weighted average cost of capital (WACC) scenarios renewable energy development.
In the risk_neg scenario, several factors significantly increase financing costs across countries. As shown in 4, nations like Bahrain, Jordan, Lebanon, and Oman experience notable rises in their WACC values. For example, Bahrain’s WACC increases by 4.28 percentage points (from 13.86% to 18.14%), Jordan’s by 4.67 percentage points (from 12.02% to 16.69%), Lebanon’s by 6.57 percentage points (from 22.23% to 28.8%), and Oman’s by 3.96 percentage points (from 9.27% to 13.23%). Other countries, such as Algeria and Iran, already have relatively high baseline WACC values of around 15.69%, which rise to 18.41% and 18.57%, respectively, in the risk_neg scenario. These increases reflect the continued influence of systemic risks, including weak institutions and unstable political climates. A significant factor contributing to these increases are, for example, (6) unfavourable framework conditions for renewable energies, especially in countries like for countries like, Bahrain, Egypt or Jordan. (11) Natural hazards also contribute to increasing capital costs, particularly in Algeria, Egypt, and Tunisia, where environmental risks add layers of uncertainty. For instance, in Tunisia, this is one of the factors contributing to the increase of the WACC from 13.86% to 17.35. Yemen sees an even more pronounced increase, with its WACC rising from 24.84% in the risk_bau scenario to 27.53%, underscoring how heightened risks such as (1) conflict and violence exacerbate financing challenges. In Iran and Kuwait, macro risks emerge as particularly influential factors, while micro risks, including project-specific obstacles, are especially critical in Libya and Yemen. Overall, the risk_neg scenario highlights how a combination of unfavourable framework conditions, political instability, natural hazards, and geopolitical risks collectively influence financing costs. These rising costs threaten the attractiveness of renewable energy investments in the region, further highlighting the importance of targeted risk-mitigation strategies to create a more stable investment climate.
3.1.2.2 Scenarios for country-specific risk costs for green hydrogen and synthetic fuels
Figure 5 illustrates the WACC values for all three scenarios for the hydrogen and synthetic fuels sector. Financing the transition to net-zero emissions through technologies like green hydrogen and synthetic fuels presents unique challenges. These technologies remain in the early stages of development. To scale up production and achieve long-term emissions reductions, substantial derisking will be necessary to increase investments and support the growth of these emerging technologies. Additionally, growing market experience will play a key role in reducing financing costs. As more projects are completed, insights gained from these experiences can help mitigate project-specific risks, further lowering capital costs.
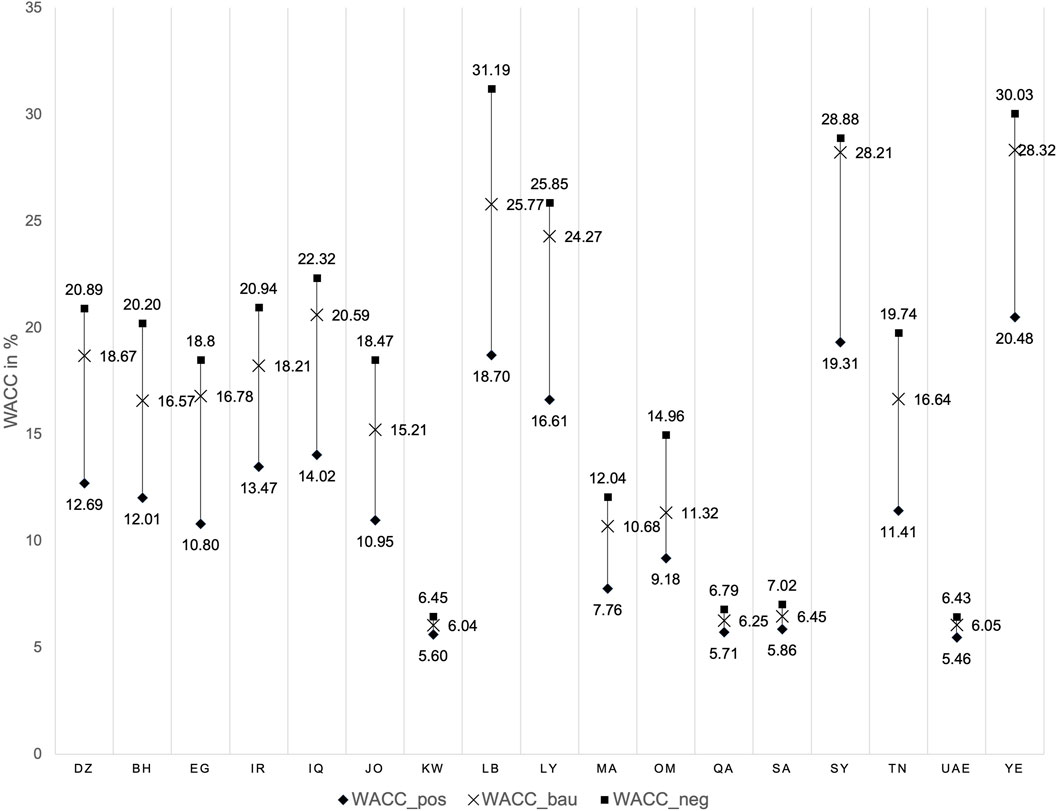
Figure 5. Weighted average cost of capital (WACC) scenarios green hydrogen and synthetic fuels.
Insights from the risk_pos scenario suggest that various factors could significantly aid in derisking and lowering WACC values. Conflict-ridden countries like Syria and Yemen show the greatest potential for reductions, with WACC values dropping from 28.21% to 19.31% in Syria (−8.90%) and from 28.32% to 20.48% in Yemen (−7.84%). Similarly, North African countries like Algeria, Egypt, and Tunisia, along with Iran and Iraq, exhibit strong potential for lowering WACC values. For example, Algeria’s WACC decreases from 18.67% to 12.69% (−5.98%), Egypt’s from 16.78% to 10.80% (−5.98%), and Tunisia’s from 16.64% to 11.41% (−5.23%). Iraq sees a reduction from 20.59% to 14.02% (−6.57%), while Iran experiences a decline from 18.21% to 13.47% (−4.74%). Critical sector related factors to reduce risks and therewith WACCs are, for example, (9) labour and expertise availability, particularly in countries like Bahrain, Jordan, Oman, Qatar, and the U.A.E. Addressing workforce challenges and increasing expertise in hydrogen and synthetic fuels can significantly reduce risks and lower equity and debt costs. Similarly, improvements in (6) framework conditions for hydrogen and synthetic fuels could ease risks especially in Bahrain, Kuwait, Saudi Arabia, Tunisia, and Yemen by fostering a more supportive policy environment. Streamlined (8) project approval, licensing, and permitting processes, alongside (7) improved investment conditions, are expected to further mitigate risks, particularly in countries like Algeria, Saudi Arabia, and the U.A.E. This contributes to overall WACC reductions, with Saudi Arabia reaching 5.86%, and the U.A.E. 5.46% in the risk_pos scenario. Overall, the risk_pos scenario highlights those improvements in labour and expertise availability, framework conditions, project approval processes, investment conditions, and reductions in conflicts are key to mitigating risks and reducing financing costs for hydrogen and synthetic fuels projects across various countries.
In the risk_neg scenario, multiple factors are anticipated to elevate risks for the hydrogen and synthetic fuels sector, consequently raising both equity and debt costs. Among the most significant challenges are unfavourable (6) framework conditions for hydrogen and synthetic fuels. The absence of clear and supportive policies or regulatory frameworks poses a major barrier to large-scale investments in these sectors, leading to WACC increases in countries such as Algeria, Bahrain, Iraq, Saudi Arabia, and the U.A.E. For instance, this challenge is one of the factors that contributes to increasing WACC values in Algeria to 20.89% and in Saudi Arabia to 7.02%. On the macro level (1) conflicts and violence are also critical risk drivers, especially in countries like Iran, Iraq, Jordan, Oman, Qatar, and Saudi Arabia. Political instability and security concerns in these regions can create unpredictable investment climates, deterring investors and raising financing risks. For instance, this contributes to Iran’s WACC increasing to 20.94% and Iraq’s to 22.32% in the risk_neg scenario. Similarly, the risk of (2) government intervention in countries such as Iraq, Lebanon, Oman, and Saudi Arabia adds volatility, with state-imposed regulations or policy changes potentially further complicating sector development. For example, this factor contributes to the rise of Oman’s WACC to 14.96% in this scenario. (9) Labour and expertise availability is another factor contributing to WACC rises, posing significant challenges in Bahrain, Iraq, and Tunisia, where shortages of skilled labour and technical expertise could contribute to driving up financing costs. For instance, Bahrain’s overall WACC rises to 20.20% and Tunisia’s to 19.74% in the risk_neg scenario. (10) Social acceptance is another key factor, as public opposition or concerns about the environmental and social impacts of hydrogen and synthetic fuels development may lead to delays, increased costs, and heightened investment risks. (5) Political and trade relations with Germany and the EU (5) could further influence investment flows. Strained relations or unfavourable trade policies may deter foreign investment, contributing to overall WACC increases in the risk_neg scenario, such as 12.04% in Morocco and a striking 31.19% in Lebanon. In sum, the risk_neg scenario underscores how unfavourable regulatory frameworks, political instability, labour shortages, social challenges, environmental risks, and geopolitical factors collectively increase investment uncertainty and financing costs for hydrogen and synthetic fuel sector development across these regions.
3.2 Resulting costs and potentials for FT fuel incorporating country-specific risk cost scenarios
The following section presents the results of applying the country-specific risk cost scenarios in the form of WACCs to the cost-potential modelling for FT fuel. First, the local production costs for the WACC_bau scenario are discussed (3.2.1). Next, the starting levelised production costs for all WACC scenarios are presented (3.2.2), followed by the FT fuel potentials with their corresponding production costs (3.2.3). All results for the WACC_ref case are sourced from Braun et al. (2024) and serve as a benchmark to compare with the country-specific WACC results across the three scenarios.
3.2.1 Local levelised costs of fuel
The local levelised costs of fuel (LCOFs) shown in Figure 6 represent the cost per analysed spatial raster cell. The analysis considers FT fuel production using electricity from Concentrated Solar Power Parabolic Troughs (CSP-PT), Photovoltaic (PV), and wind onshore, applying the WACC_bau scenario for 2030. The pixel-based results are aggregated into cost categories with a contour function. White areas are excluded due to land cover, geological or meteorological constraints. The results indicate that FT fuel production powered by CSP-PT and PV achieves the lowest costs, ranging between 180 and 230 €/MWh, in regions near the Red Sea in Saudi Arabia. Additional low-cost areas, with costs between 230 and 280 €/MWh, are identified along the Atlantic coast south of Tarfaya and in Oman. For FT fuel production powered by onshore wind energy, the lowest costs range between 280 and 330 €/MWh, with hotspots along the Atlantic coast south of Tarfaya and in central Saudi Arabia. The modeling results also reveal that for other WACC scenarios and projection years (2040, 2050), the local hotspots with low production costs remain consistent, although cost ranges vary (see Section 3.2.3).
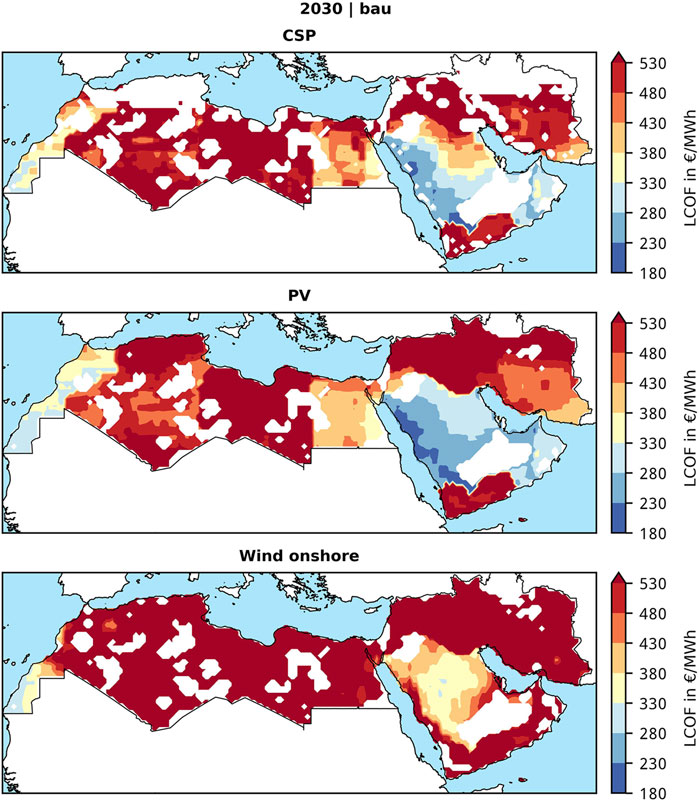
Figure 6. Local levelised costs of fuel (LCOFs) of generation potential produced with electricity from CSP-PT, PV and wind onshore in the WACC_bau case in 2030.
3.2.2 Starting levelised costs of fuel
In addition to local LCOFs, a key parameter for identifying favourable countries for FT fuel production is the starting LCOF. The starting LCOF represents the lowest production cost achieved due to optimal meteorological and infrastructure conditions within each country. Figure 7 presents the overall starting LCOFs for FT fuel generation potentials across MENA countries, years, and WACC scenarios.
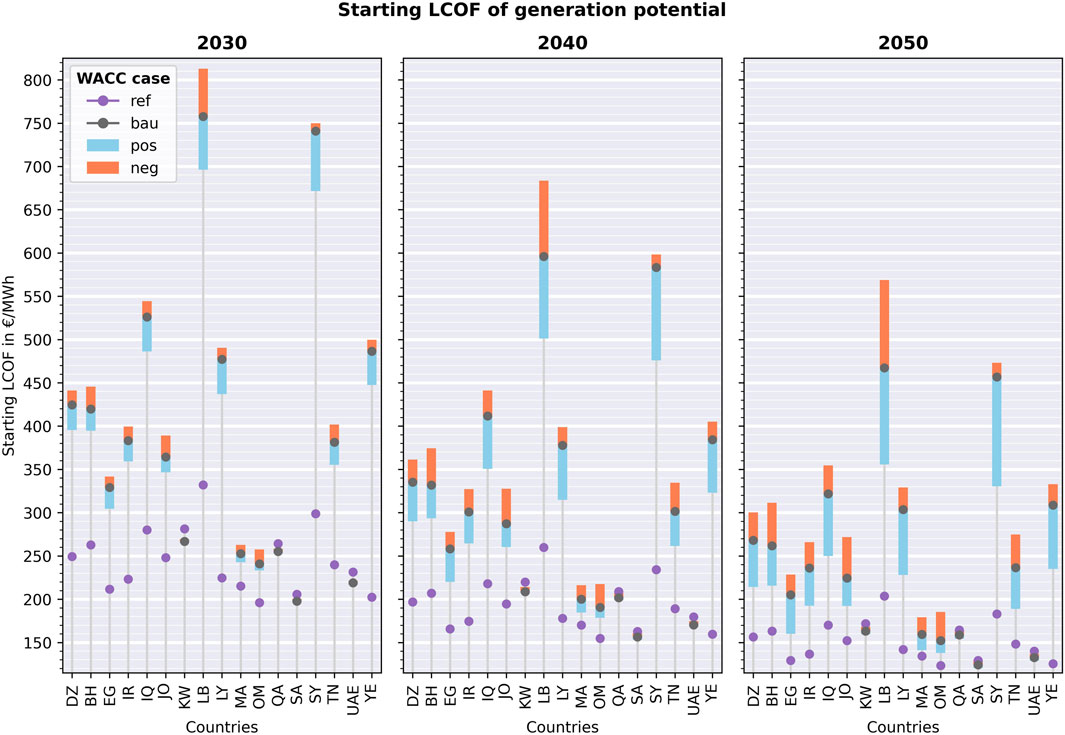
Figure 7. Starting levelised costs of fuel (LCOFs) of Fischer-Tropsch fuel generation potential for the considered MENA countries, years, and WACC cases. The shown starting LCOFs are the minimal LCOFs between the starting LCOFs of the RE technologies PV, CSP-PT and wind onshore.
The starting LCOFs for FT fuel generation potential across MENA countries, as presented in Figure 7, highlight clear trends influenced by WACC scenarios or investing conditions and temporal factors. Significant cost reductions are observed over time for all countries, driven by technological progress and economies of scale. Oman and Saudi Arabia consistently demonstrate the lowest LCOFs across most scenarios and years. Other countries, including the UAE, Morocco, and Qatar, display competitive costs under favourable conditions but exhibit higher sensitivity to unfavourable financing scenarios, such as WACC_neg. Yemen and Egypt show potential for cost-effective FT fuel generation, particularly under scenarios with favourable financing (e.g., WACC_ref and WACC_pos). Overall, the results underscore the critical role of financing, infrastructure development, and renewable resource availability in shaping FT fuel production potential across the region.
While Figure 7 displays the LCOFs for the overall potential, Figure 8 focuses on the starting LCOFs of FT fuel potential specifically for export. These starting LCOFs represent the lowest-cost production potential remaining after subtracting the assumed domestic electricity and synfuel demand under a 100% renewable scenario, calculated for each country. The analysis highlights notable variations in costs across countries, years, and WACC scenarios, as detailed below.

Figure 8. Starting levelised costs of fuel (LCOFs) of Fischer-Tropsch fuel export potential for the considered MENA countries, years, and WACC cases. The shown starting LCOFs are the minimal LCOFs between the starting LCOFs of the RE technologies PV, CSP-PT and wind onshore after subtracting the most favourable resources reserved for their domestic demand under a 100% renewable scenario.
The results from Figure 8 reveal several critical insights regarding the export potential of FT fuels in the MENA region under varying WACC scenarios or investing conditions and timeframes. Similar to the results in Figure 7, Oman and Saudi Arabia consistently emerge as the most cost-competitive exporters, with Oman leading across most scenarios and Saudi Arabia maintaining strong competitiveness under favourable financing (e.g., WACC_pos). The export-specific analysis highlights the sensitivity of costs to financing conditions, as seen exemplary for the starting LCOF in 2030 in Oman rising from 240 €/MWh under WACC_pos to 264 €/MWh under WACC_neg. This emphasizes the importance of affordable and accessible funding to sustain competitive export costs. While Oman and Saudi Arabia lead in terms of low costs, countries like the UAE and Morocco also exhibit relatively low LCOFs, especially under the favourable scenario WACC_pos. In contrast, the countries Bahrain, Kuwait, Qatar, Lebanon and the UAE do not show starting LCOFs in some cases in Figure 8. Based on the analysis of Braun et al. (2024), these countries do not have any relevant export potential, because the available potential is expected to be needed for domestic demands in an assumed 100% renewable future. These findings align with the trends observed in Figure 7, reinforcing the central role of financing conditions, technological progress, and resource optimization in shaping MENA’s FT fuel export landscape.
3.2.3 Cost-potentials for FT fuel
Figure 9 shows the CPs of FT fuel in the MENA countries in 2030 for the WACC cases WACC_ref, WACC_bau, WACC_pos and WACC_neg. They distinguish between the potential used domestically (black boxes) and the potential intended for export (green boxes). In the case of domestic potential, it is also indicated whether the fuels were produced using CO2 from industrial CCS processes (squared or crosshatched boxes).
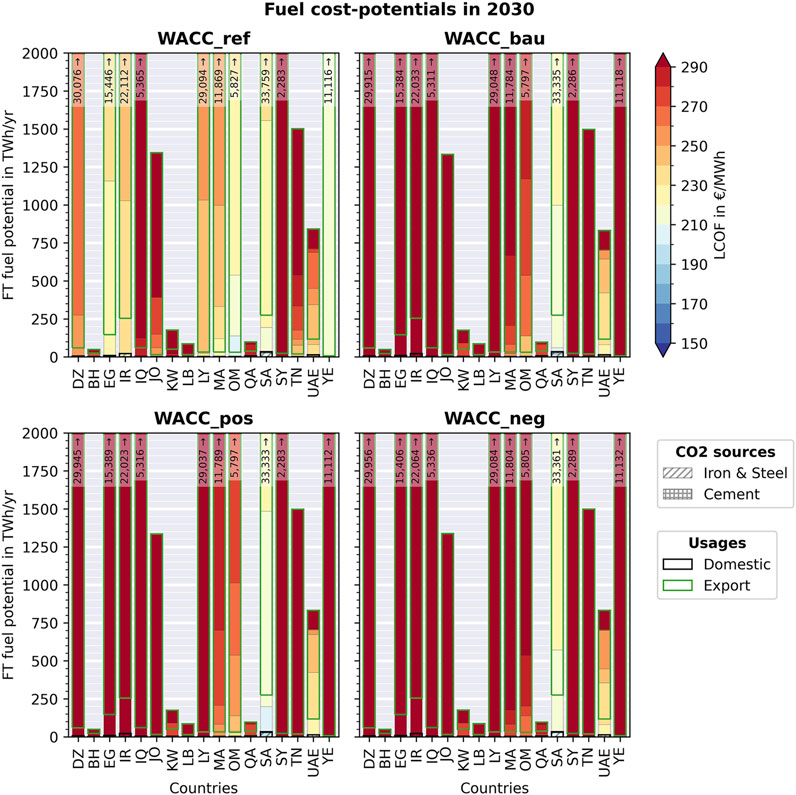
Figure 9. Cost-potentials of Fischer-Tropsch fuels in the MENA countries in 2030 for the WACC cases WACC_ref, WACC_bau, WACC_pos and WACC_neg. The export potentials are the remaining fuel potentials after deduction of the cheapest RE electricity potentials for the country’s own electricity demand according to the energy scenario ALT2 in Braun et al. (2024).
In the WACC_ref case, the most fcost-effective technical generation potentials between €190–220/MWh show up in Egypt, Morocco, Oman, Saudi Arabia and Yemen, reaching 3,300 TWh in total. In comparison, under the WACC_bau, WACC_pos and WACC_neg scenario, the costs shift and the fuel potentials in the same cost range between €190–220/MWh emerge prominently only in Saudi Arabia and reach 1,000 TWh under WACC_bau, rising to 1,500 TWh in WACC_pos, and declining to 570 TWh in WACC_neg. Further potentials between €220–260/MWh with key contribution from Saudi Arabia, the UAE, Morocco, Oman and Qatar reach in total 15,800 TWh under WACC_bau, rising to 16,600 TWh in WACC_pos, and declining to 15,500 TWh in WACC_neg.
For exports, the WACC_ref case demonstrates strong capacities, with 3,100 TWh between €200–220/MWh, with Saudi Arabia and Yemen contributing to these most cost-effective export potentials. Under the WACC_bau, WACC_pos, and WACC_neg cases, export potentials in the same cost range between €200–220/MWh show up only in Saudi Arabia. Those export potentials reach 720 TWh under WACC_bau, 1,200 TWh under WACC_pos, and 300 TWh under WACC_neg. Slightly more costly export potentials between €220–260/MWh reach 15,700 TWh under WACC_bau, increase to 16,400 TWh in WACC_pos, and decrease to 15,400 TWh in WACC_neg. These potentials primarily arise in Saudi Arabia, Oman, Morocco and the UAE.
Figure 10 shows the cost-potentials of FT fuel in the MENA countries in 2040 for the WACC cases WACC_ref, WACC_bau, WACC_pos and WACC_neg. The achievable costs here are considerably lower than in 2030.

Figure 10. Cost-potentials of Fischer-Tropsch fuels in the MENA countries in 2040 for the WACC cases WACC_ref, WACC_bau, WACC_pos and WACC_neg. The export potentials are the remaining fuel potentials after deduction of the cheapest RE electricity potentials for the country’s own electricity demand according to the energy scenario ALT2 in Braun et al. (2024).
In the WACC_ref case, the most cost-effective technical generation potentials are in the range of €150–180/MWh and therefore €40/MWh lower than in 2030. They reach 17,000 TWh mostly coming from Yemen, Saudi Arabia, Oman and Egypt but also from Morocco, the UAE, Iran and Libya. In comparison, under the WACC_bau, WACC_pos and WACC_neg scenario, the costs shift and the fuel potentials in the same cost range between €150–180/MWh only emerge in Saudi Arabia and also the UAE. The potentials reach 7,700 TWh under WACC_bau, rising to 9,400 TWh in WACC_pos, and declining to 2,800 TWh in WACC_neg. Further potentials between €180–220/MWh with key contribution from Saudi Arabia and the UAE, but also from Kuwait, Morocco, Oman and Qatar reach 17,600 TWh under WACC_bau, 22,200 TWh in WACC_pos, and 19,300 TWh in WACC_neg.
For exports, the WACC_ref case demonstrates strong capacities, with 15,200 TWh most cost-effective export potentials between €150–180/MWh, mostly from Yemen, Saudi Arabia and Oman but also from Egypt and Morocco. Under the WACC_bau, WACC_pos, and WACC_neg cases, export potentials in the same cost range between €150–180/MWh show up only in Saudi Arabia. These export potentials reach 6,800 TWh under WACC_bau, 8,300 TWh under WACC_pos, and 1,900 TWh under WACC_neg. Slightly more costly export potentials between €180–220/MWh reach in total 16,800 TWh under WACC_bau, 21,500 TWh in WACC_pos, and 18,800 TWh in WACC_neg. These potentials primarily arise in Saudi Arabia, Oman, Morocco and the UAE.
Figure 11 shows the cost-potentials of FT fuel in the MENA countries in 2050 for the WACC cases WACC_ref, WACC_bau, WACC_pos and WACC_neg. The achievable costs are once again considerably lower than in 2040.
Figure 11. Cost-potentials of Fischer-Tropsch fuels in the MENA countries in 2050 for the WACC cases WACC_ref, WACC_bau, WACC_pos and WACC_neg. The export potentials are the remaining fuel potentials after deduction of thecheapest RE electricity potentials for the country’s own electricity demand according to the energy scenario ALT2 in Braun et al. (2024).
In the WACC_ref case, the most cost-effective technical generation potentials are between €120–140/MWh and therefore €30–40/MWh lower than in 2040. They reach in total 6,700 TWh, primarily coming from Yemen and Oman, but also from Saudi Arabia, Egypt, Iran, the UAE and Morocco. In comparison, under the WACC_bau, WACC_pos and WACC_neg scenario, the costs shift and the fuel potentials in the same cost range between €120–140/MWh emerge only in Saudi Arabia and the UAE. The potentials reach in total 1,800 TWh under WACC_bau, rising to 6,900 TWh in WACC_pos, and declining to 190 TWh in WACC_neg. Further potentials between €140–170/MWh with key contribution from Saudi Arabia, the UAE and Oman, but also from Kuwait, Morocco, and Qatar reach 21,700 TWh under WACC_bau, 25,800 TWh in WACC_pos, and 19,800 TWh in WACC_neg.
For exports, the WACC_ref case demonstrates strong capacities, with 5,700 TWh most cost-effective export potentials between €120–140/MWh, coming from Yemen and Oman. Under the WACC_pos case, export potentials in the same cost range between €120–140/MWh show up only in Saudi Arabia, reaching 4,700 TWh. The WACC_bau and WACC_neg scenarios do not show any potentials in this cost range. Slightly more costly export potentials between €140–170/MWh reach in total 20,200 TWh under WACC_bau, 24,300 TWh in WACC_pos, and 17,100 TWh in WACC_neg. These potentials primarily arise in Saudi Arabia, but also in Oman and Morocco.
These findings underscore the critical role of favourable financial conditions in unlocking the full potential of FT fuel production and export capabilities across the region. Country-specific investment risks impact FT fuel potentials and LCOF deviations across MENA countries. Without accounting for country-specific risks, cost-effective potentials emerge in Oman, Yemen, Saudi Arabia, Morocco, Egypt, Iran, and Libya. However, when country-specific risks are considered, Egypt, Iran, and Libya lose their cost-effectiveness due to elevated risks, while the previously less viable potentials, for example, in the UAE become favourable. Saudi Arabia’s already cost-effective potentials improve further, while Morocco and Oman remain viable, with only slight cost increases. Overall, factoring in investment risks positions Saudi Arabia, UAE, Oman and Morocco as the most favourable regions for FT fuel production.
3.2.4 Impact of country-specific risks on costs for FT fuel
The impacts of country-specific risks on costs for FT fuel are further analysed in Figure 12, which shows the deviations of starting LCOFs under the different WACC scenarios (WACC_bau, WACC_pos and WACC_neg) from the WACC_ref case. A high deviation occurs in Lebanon, Libya, Syria and Yemen from +94% to +151% in 2030, from +76% to +163% in 2040, and from +61% to +180% in 2050. These significant deviations suggest substantial cost volatility driven by heightened risks. The progressively increasing deviations over time indicate challenges in achieving financial predictability in these regions. Countries like Bahrain, Algeria, Egypt, Iraq, Iran, Jordan, and Tunisia display moderate deviations from +40% to +94% in 2030, from +33% to +102% in 2040 and from +24% to +109% in 2050. While these economies face challenges, they remain relatively more stable than those in the high-deviation group. The UAE, Kuwait, Morocco, Oman, Qatar, and Saudi Arabia show the lowest deviations from −6% to +32% in 2030, from −7% to +40% in 2040 and from −8% to +50% in 2050. Across all groups, the range of deviations generally increase from 2030 to 2050, particularly in high- and moderate-risk countries. This is because the WACCs considering investment risks deviate more from the reference WACC of 6% over time. This highlights the growing uncertainty in fuel costs over time, possibly due to evolving global financial conditions, geopolitical risks, or limited progress in mitigating investment risks.
Figure 12. Deviations of starting LCOFs of the generation potential to the WACC_ref case.
4 Discussion and conclusion
This study provides valuable insights into the influence of country-specific investment risks on the development and competitiveness of renewable energy, green hydrogen, and subsequent synthetic fuel sectors in the MENA region. The methodological approach developed and applied in this research marks a significant advancement by quantifying qualitative risk factors and integrating them into cost and potential analyses. By incorporating WACCs, the study goes beyond traditional models that primarily focus on technical potential, capturing nuanced differences in financing conditions across countries. The results show that country-specific investment risks significantly impact costs. For instance, by 2050, the starting LCOFs in high-risk scenarios can be up to 180% higher than in lower-risk contexts. This underlines the central role of investment environments in shaping sectoral competitiveness. Favourable risk profiles are critical for attracting investment, whereas challenges posed by high-risk contexts drive up financing costs and hinder sectoral development.
While this study provides valuable insights into the role of country-specific investment risks, several limitations must be acknowledged. First, the methodological approach relies on the quantification of typically qualitative country risks into future capital cost premiums. However, this quantification is grounded in current capital costs, which leads to potential deviations between the projected capital cost mark-ups and the actual risk scenarios. This limitation is particularly pronounced for countries with currently low costs of capital, where even under challenging scenarios, the relative changes in the WACC are modest compared to the reference case. Consequently, the actual development of WACC in these countries may deviate significantly from the modeled values, potentially exhibiting a much wider range of variability. Second, the analysis is conducted at the level of sectoral development within a country, which may not fully reflect the conditions or cost structures of individual projects. Variability in project-specific factors, such as location, scale, and technological design, may result in cost of capital structures that diverge from the aggregated sectoral estimates. In addition, the availability of governmental or multilateral financing instruments, which were not explicitly accounted for in this study, can provide capital at lower costs than those calculated here, potentially altering the competitiveness of certain projects or regions.
Despite its limitations, the study provides valuable insights by quantifying qualitative risks and highlighting their crucial role in shaping sector development and competitiveness. In doing so, it responds to the IEA’s (2021) call for more detailed assessments of investment risks and cost of capital, particularly in emerging and developing countries, as well as in newer technologies and sectors with limited financial track records. The findings highlight large countries with relatively low WACCs and lower investment risks, such as Saudi Arabia, the United Arabian Emirates, Oman, and Morocco, as key candidates for export-oriented renewable energy and green hydrogen development. In contrast, smaller countries like Qatar and Kuwait, despite having favourable resource potential, will primarily require these resources to meet their domestic energy demand. The results further underscore that cost-effective renewable energy potential alone is not enough to determine export viability, with investment environments playing a critical role. High-risk contexts like Yemen, Iran, and Libya face elevated production costs despite their high resource potential. Additionally, rising inflation and increasing interest rates, driven by global monetary tightening policies from central banks like the US Federal Reserve and the European Central Bank, could significantly impact financing for renewable energy, green hydrogen and synthetic fuels sectors. Higher capital costs, coupled with supply chain disruptions, could make securing affordable financing more difficult. This, in turn, could delay or hinder the implementation of renewable energy, hydrogen, and synthetic fuel projects in the MENA region. In conclusion, the findings suggest that while the MENA region holds immense potential for renewable energy, green hydrogen, and synthetic fuel development, countries can only fully capitalize on these advantages if the costs of capital reach levels that ensures a competitive edge compared to other regions.
Future research should focus on the sensitivity of cost of capital assessments to political, economic, and geopolitical shifts. Changes in governance and evolving regulatory frameworks can significantly impact financing conditions, introducing uncertainty for long-term sector planning. To address this comprehensive project and country assessments, enriched by detailed case studies, are essential for understanding the impact of qualitative factors on investment risks. Systematic evaluations should span a broader array of projects and variables, identifying factors that contribute to project success or failure. Furthermore, research should consider risks not only from an investor’s perspective but also from the perspective of potential exporters of renewable energy, hydrogen and synthetic fuels, which often differ from those experienced by investors and that are typically analysed in existing studies. Risk assessments from an exporter’s perspective should further not only account for market access, trade barriers, and geopolitical issues, but also for sustainability concerns such as environmental impacts, social considerations, and the long-term viability of the energy transition. By addressing these gaps research can offer a more holistic understanding of the challenges and opportunities in scaling renewable energy, hydrogen and synthetic fuel exports. This nuanced approach will enhance risk management strategies and support investment decisions.
Data availability statement
The raw data supporting the conclusions of this article will be made available by the authors, without undue reservation.
Author contributions
JT-P: Conceptualization, Formal Analysis, Investigation, Methodology, Project administration, Supervision, Writing – original draft, Writing – review and editing. JB: Data curation, Formal Analysis, Investigation, Methodology, Writing – original draft, Writing – review and editing. SE: Investigation, Methodology, Writing – review and editing. MP: Writing – review and editing, Investigation, Formal Analysis, Methodology. JK: Funding acquisition, Supervision, Writing – review and editing. PV: Funding acquisition, Project administration, Supervision, Writing – review and editing.
Funding
The author(s) declare that financial support was received for the research and/or publication of this article. The authors gratefully acknowledge the financial support of the German Federal Ministry for Economic Affairs and Climate Action (grant no. 3EIV181A and C). The sole responsibility for the content of this paper lies with the authors.
Conflict of interest
The authors declare that the research was conducted in the absence of any commercial or financial relationships that could be construed as a potential conflict of interest.
The author(s) declared that they were an editorial board member of Frontiers, at the time of submission. This had no impact on the peer review process and the final decision.
Generative AI statement
The author(s) declare that no Generative AI was used in the creation of this manuscript.
Publisher’s note
All claims expressed in this article are solely those of the authors and do not necessarily represent those of their affiliated organizations, or those of the publisher, the editors and the reviewers. Any product that may be evaluated in this article, or claim that may be made by its manufacturer, is not guaranteed or endorsed by the publisher.
Supplementary material
The Supplementary Material for this article can be found online at: https://www.frontiersin.org/articles/10.3389/fenrg.2025.1546876/full#supplementary-material
Footnotes
1For a detailed description of the methodology for the risk assessment please refer to Terrapon-Pfaff et al., 2024.
2Individual CoD and CoE are provided in the Supplementary Material 3.
References
Aven, T. (2017). Improving risk characterisations in practical situations by highlighting knowledge aspects, with applications to risk matrices. Reliab. Eng. and Syst. Saf. Special Sect. Appl. Probabilistic Graph. Models Dependability, Diagnosis Prognosis 167, 16742–16748. doi:10.1016/j.ress.2017.05.006
Bogdanov, D., Child, M., and Breyer, C. (2019). Reply to ‘Bias in energy system models with uniform cost ofcapital assumption. Nat. Commun. 10, 4587. doi:10.1038/s41467-019-12469-y
Braun, J., Pregger, T., Scholz, Y., and Kern, J. (2024). Modeling levelized costs and technical potentials for green synthetic fuel generation and exports in the MENA region. Front. Energy Res. Sustain. Energy Syst.
Damodaran, A. (2020). Country default spreads and risk premiums. Available online at: http://pages.stern.nyu.edu/∼adamodar/New_Home_Page/datafile/ctryprem.html.
Egli, F. (2020). Renewable energy investment risk: an investigation of changes over time and the underlying drivers. Energy Policy 140, 140111428. doi:10.1016/j.enpol.2020.111428
Egli, F., Steffen, B., and Schmidt, T. (2019). Bias in energy system models with uniform cost of capital assumption. Nat. Commun. 10, 4588. doi:10.1038/s41467-019-12468-z
Hamilton, K. (2011). Investing in renewable energy in the MENA region: financier perspectives. EEDP Work. Pap. Available online at: https://www.chathamhouse.org/sites/default/files/0611hamilton.pdf.
Henbest, S., Mills, L., Orlandi, I., Serhal, A., and Pathania, R. (2015). Levelized cost of electricity: DFID 28 priority countries. London, UK: Bloomberg New Energy Finance, 1–21.
IEA (2021). The cost of capital in clean energy transitions. Available online at: https://www.iea.org/articles/the-cost-of-capital-in-clean-energy-transitions.
IRENA and CPI (2018). Global landscape of renewable energy finance, 2018. Abu Dhabi: International Renewable Energy Agency.
ISO (2018). ISO 31000:2018(en), Risk management — Guidelines. Available online at: https://www.iso.org/obp/ui/#iso:std:iso:31000:ed-2:v1:en.
Labordena, M., Patt, A., Bazilian, M., Howells, M., and Lilliestam, J. (2017). Impact of political and economic barriers for concentrating solar power in Sub-Saharan Africa. Energy Policy 102, 10252–10272. doi:10.1016/j.enpol.2016.12.008
Noothout, P., Jager, D. de, and Tesnière, L. (2016). The impact of risks in renewable energy investments and the role of smart policies. Brussels: European Commission.
Ondraczek, J., Komendantova, N., and Patt, A. (2013). WACC the dog: the effect of financing costs on the levelized cost of solar PV power. SSRN Electron. J. 75. doi:10.2139/ssrn.2321130
Peters, M. (2011). The role of technology policy in fostering technical change: lessons from the cases of solar and wind power. Zürich, Switzerland: ETH Zurich. Available online at: http://hdl.handle.net/20.500.11850/153360.
Schinko, T., and Komendantova, N. (2016). De-risking investment into concentrated solar power in North Africa: impacts on the costs of electricity generation. Renew. Energy 92, 92262–92272. doi:10.1016/j.renene.2016.02.009
Schmidt, T., Born, R., and Schneider, M. (2012). Assessing the costs of photovoltaic and wind power in six developing countries. Nat. Clim. Change 2, 2548–2553. doi:10.1038/nclimate1490
Terrapon-Pfaff, J., Ersoy, S. R., Prantner, M., and Viebahn, P. (2024). Country risks analysis for the development of green hydrogen and synthetic fuel sectors in the MENA region. Front. Energy Res. 12, 1466381. doi:10.3389/fenrg.2024.1466381
UNFCCC (2015). Republic of Yemen: intended nationally determined contribution (INDC) under the UNFCCC. Available online at: https://www4.unfccc.int/sites/submissions/INDC/Published%20Documents/Yemen/1/Yemen%20INDC%2021%20Nov.%202015.pdf.
Waissbein, O., Glemarec, Y., Bayraktar, H., and Schmidt, T. S. (2013). Derisking renewable energy investment. A framework to support policymakers in selecting public instruments to promote renewable energy investment in developing countries. N. Y. Energy Invest. Dev. Ctries.
World Bank (2020). GDP deflator. Available online at: https://databank.worldbank.org/metadataglossary/world-development-indicators/series/NY.GDP.DEFL.ZS.
World Bank (2023). Neom green hydrogen project. Available online at: https://ppi.worldbank.org/en/snapshots/project/neom-green-hydrogen-project-11504.
Nomenclature
Beta value (β) measures the risk of equity investments in renewable or synthetic fuels compared to the market index.
Capital Asset Pricing Model (CAPM) Calculates expected return on assets based on risk.
Carbon Capture and Use (CCU) Technologies that capture CO2for industrial use.
Direct Air Capture (DAC) systems Technologies that extract CO2directly from the atmosphere.
Concentrated Solar Power Parabolic Troughs (CSP-PT) Solar thermal collector that is used for concentrating sunlight with parabolically curved mirrors
Photovoltaic (PV) Converts sunlight directly into electricity using solar cells.
Consumer Price Index (CPI) Measures changes in the price level of consumer goods and services.
Cost of Debt (CoD) Interest rate paid by a company on its debts.
Cost of Equity (CoE) Return required by shareholders to invest in project.
Cost-Potential Analysis (CPA) Evaluates how much electricity/fuel can be generated at what cost.
Cost-Potentials (CPs) Potentials and the associated production costs.
DLR’s Energy Data Analysis Tool (EnDAT) Tool for analyzing energy-related data.
Equity Risk Premium (ERP) Difference between the returns on a risk-free asset and investments in projects/shares.
Fischer-Tropsch (FT) fuels Synthetic fuels created from carbon monoxide and hydrogen.
Gross Domestic Product (GDP) Total value of goods and services produced within a country.
High-Voltage Direct Current (HVDC) Efficiently transmits large amounts of electricity over long distances.
International Energy Agency (IEA) Autonomous inter-governmental organisation within the OECD framework that works on energy.
International Renewable Energy Agency (IRENA) Intergovernmental organization that supports countries in their transition to a sustainable energy future.
Levelised Cost of Electricity (LCOE) Average cost to generate a unit of electricity over a generator’s lifetime.
Levelised Costs of Fuel (LCOFs) Average cost to produce a unit of fuel considering full lifecycle costs.
Middle East and North Africa (MENA) Region encompassing countries in both the Middle East and North Africa.
Power-to-Liquid (PtL) process that converts electrical energy and carbon dioxide (CO2) into synthetically produced liquid hydrocarbon.
Risk scenarios risks for renewable energy and synthetic fuel sector development assessed for each country, including a business-as-usual scenario (risk_bau) and two opposing scenarios: a positive scenario (risk_pos) describing improved conditions, and a negative scenario (risk_neg) depicting worsened conditions.
Terawatt-hour (TWh) A unit of energy equivalent to one trillion watts for 1 hour.
United Arab Emirates (UAE) Country known for its oil resources and investments in renewable energy.
Water (H2O) Molecular compound consisting of two hydrogen atoms bonded to an oxygen atom; used in electrolysis and synthesis processes.
Weighted Average Cost of Capital (WACC) A blended cost of capital that measures financing costsby proportionately weighing a company’s use of debt and equity financing.
WACC scenarios model varying impacts on financing costs under current equity and debt capital costs (WACC-bau) and improved, (WACC-pos) or worsened conditions (WACC-neg) respectively.
Carbon Dioxide (CO2) A greenhouse gas used in synthetic fuel production and targeted for reduction in climate efforts.
Keywords: weighted average cost of capital (WACC), country risk, renewable energy, green hydrogen, PtX, Fischer-Tropsch fuel, cost-potentials, equity and debt
Citation: Terrapon-Pfaff J, Braun J, Ersoy SR, Prantner M, Kern J and Viebahn P (2025) Country risk impacts on export costs of green hydrogen and its synthetic downstream products from the Middle East and North Africa. Front. Energy Res. 13:1546876. doi: 10.3389/fenrg.2025.1546876
Received: 17 December 2024; Accepted: 29 April 2025;
Published: 19 May 2025.
Edited by:
Ahmad T. Mayyas, Khalifa University, United Arab EmiratesReviewed by:
Ana Inés Torres, Carnegie Mellon University, United StatesMuhammad Sadiq, Khalifa University, United Arab Emirates
Copyright © 2025 Terrapon-Pfaff, Braun, Ersoy, Prantner, Kern and Viebahn. This is an open-access article distributed under the terms of the Creative Commons Attribution License (CC BY). The use, distribution or reproduction in other forums is permitted, provided the original author(s) and the copyright owner(s) are credited and that the original publication in this journal is cited, in accordance with accepted academic practice. No use, distribution or reproduction is permitted which does not comply with these terms.
*Correspondence: Julia Terrapon-Pfaff, anVsaWEudGVycmFwb24tcGZhZmZAd3VwcGVyaW5zdC5vcmc=