 Josua Braun
 Thomas Pregger
 Jürgen Kern*†
- Department of Energy Systems Analysis, Institute of Networked Energy Systems, German Aerospace Center (DLR), Stuttgart, Germany
The use of fossil fuels is the main cause of greenhouse gas emissions and a major driver of climate change. Although direct electrification can replace fossil fuels in many applications, certain sectors will continue to require high-density energy sources in the future, such as long-distance aviation, maritime shipping, and some high-temperature processes in the industry. For these applications, electricity-based synthetic gases and fuels, produced from renewable energies through Power-to-X (PtX) processes, represent a sustainable solution. This paper presents a novel approach for the large-scale estimation of PtX production costs and potentials, considering regional solar and wind power conditions. At its core is the DLR_ITEMS GlobalFuel framework, which calculates local production costs using temporally and spatially resolved data. The framework uses linear optimization to design cost-optimal systems by dimensioning the components for maximal efficiency. It accommodates various converter and storage technologies, enabling high utilization rates even with fluctuating renewable electricity supply. The methodology supports the analysis of multiple pathways by integrating different technologies and assumptions, including wind power, photovoltaics or concentrated solar power, electrolysis, and synthesis. This analysis provides a spatially detailed overview of future PtX generation potential and its levelized production costs. Additionally, the inclusion of domestic demand for renewable energy (RE) and green fuels enables realistic estimates of the export potentials of individual countries, highlighting production and export hot spots. This work focuses on the cost potentials of Fischer–Tropsch fuel production in the Middle East and North Africa (MENA) region. The findings indicate that domestic demand in large territorial countries has a moderate impact on the increase in levelized production costs for export potential. In contrast, small countries often have to fully utilize their limited renewable energy resources for domestic supply of electricity and green fuels. The analysis identifies the most favorable fuel potentials in the MENA region, with cost-optimal ranges between 190 and 220 €/MWh and an estimated annual production potential of 3,400 TWh in 2030. Of this, approximately 3,100 TWh could be available for export markets.
1 Introduction
The adoption of climate-neutral technologies and energy sources is essential across all sectors and applications to meet global climate protection targets (Teske et al., 2021). A no-regret solution is the extensive direct electrification of processes, heating systems, vehicle drives, and more, using renewable electricity (Schreyer et al., 2024). However, certain applications—such as long-haul aviation, heavy goods transport, and shipping—are difficult to electrify and will continue to require high energy density fuels in the long term (Pregger et al., 2020).
In these cases, green synthetic gases and fuels offer a climate-neutral alternative to fossil fuels by enabling a CO2 cycle rather than releasing fresh CO2 into the atmosphere. Synthetic gases, like methane, and liquid fuels, such as methanol or ammonia, can be produced using renewable energy (RE), hydrogen, and CO2. Compared to biomass, the solar and wind energy potentials in the Middle East and North Africa (MENA) region are significantly higher, with relatively low requirements (Fthenakis and Kim 2009). Therefore, this article focuses on the potential and costs of fuels that can already be produced today using energy from photovoltaics (PV), concentrating solar thermal power (CSP) plants, and onshore wind power plants, along with current conversion technologies in a typical Power-to-X (PtX) production route.
Current energy system analyses for Europe indicate that many countries with a high energy demand and reliance on fossil fuel imports today will also import renewable energy sources in the future (Guidehouse 2022; Verheugt 2023; Seck et al., 2022). Several studies have already investigated possible European import corridors for renewable energies and the associated opportunities for a secure energy supply (Pregger et al., 2011; Fasihi et al., 2017; ENTSOG 2023). A well-founded representation of import potentials and costs in energy system analyses enables a realistic analysis of the transformative system developments in the European countries and the associated infrastructure requirements for energy supply (Kanudia et al., 2013; Fattahi et al., 2024; Neumann et al., 2024). Hydrogen has long played a prominent role in this context, while the option of importing synthetic hydrocarbons with higher energy density has gained increasing attention in recent years.
To meet the growing future demand for synthetic fuels (synfuels), it is essential to identify regions and countries where these fuels can be produced cost-effectively. Comprehensive techno-economic analyses play a crucial role in this process by estimating and comparing energy potentials and the associated production costs based on the resource availability and standardized production models. Since hydrogen and synfuel production remain highly energy-intensive, even with anticipated efficiency gains, regions with abundant and favorable RE resources hold a significant advantage. The availability of land, access to water resources, skilled labor, and proximity to industrial infrastructure also play important roles in the selection of production sites.
In recent years, several studies have been carried out to perform a techno-economical analysis of the potentials and future production costs of different types of renewable synfuels [see, e.g., overviews provided by (Brynolf et al., 2018; Schemme et al., 2020)]. Advanced model-based analyses of local systems using a developed open-source tool (pyGRETA) were recently published by Buchenberg et al. (2023). They estimated the potentials and costs of synfuels produced using RE via PEM electrolyzers and Fischer–Tropsch (FT) synthesis for different future years in selected countries worldwide, focusing on decentralized and off-grid production routes. Pfennig et al. (2023) developed a PtX potential atlas as a web application. The atlas shows the production potential for hydrogen and five synthetic hydrocarbons in 2050 for selected locations worldwide. Furthermore, it provides information on transportation costs for PtX product liquefaction and shipping from the production site to Europe. IRENA (2022) presented global cost and potential estimates for green hydrogen in 2050 based on wind and PV energy. Their analysis used a geospatial approach that accounted for exclusion zones, assumed dedicated (off-grid) plants, and included cost and efficiency parameters for electrolyzers, considering country-specific interest rates. Lux et al. (2021) determined supply curves for hydrogen and synthetic methane production in the MENA region using an energy system optimization model for 2030 and 2050. The modeling takes into account various production concepts, including different electrolyzers, gas storage, water desalination, direct air capture (DAC) of CO2, liquefaction, compression, and catalytic methanation, as well as the necessary expansion of the power system infrastructure (producers, storage, and electricity grid). The spatially and temporally resolved modeling adopts the perspective of the energy system and is therefore not suited to evaluate the optimal production concept from the perspective of the investor or operator. Brändle et al. (2021) estimated and compared local supply costs of renewable and natural gas-based hydrogen in 94 countries for 2030 and 2050. They used clustered, country-level data on wind and PV potentials, along with capital cost assumptions for RE and low- and high-temperature electrolyzers, and applied a linear optimization model to determine the optimal combinations of RE and electrolyzer technologies based on country- and technology-specific hourly capacity factor profiles. Heuser et al. (2020) modeled global production costs and a future supply scheme for green hydrogen, identifying locations with favorable PV and wind conditions and mapping potential hydrogen trade relations. The cost-optimal allocation of demand and supply regions takes into account costs for inland pipeline transport and shipping of liquefied hydrogen.
Most of the studies focus only on selected locations, and some pursue system cost optimization in order to determine the optimal energy mix or the optimal integration in the energy system. In contrast, our modeling approach with the framework DLR_ITEMS GlobalFuel (alias GlobalFuel) is used to calculate cost potentials for large regions such as continents with a relatively fine spatial (e.g., 50 × 50 km) and temporal (hourly) resolution from the local/regional perspective of an investor or operator. It enables the implementation of solar and wind power, converters such as electrolysis, synthesis, or water desalination, electricity and gas storage, transport options, other infrastructure components, and purchases of external resources. Those components can be set up in a flexible way to approach different PtX routes and scenarios for analysis. The model results provide a detailed insight into cost-optimal designs of production routes in order to determine, for example, regional generation centers, required storage capacities, or optimal capacity utilization. This paper describes the methodology of the framework GlobalFuel and shows results for domestic and export cost potentials of fuels based on FT synthesis. FT fuels are highly drop-in compatible and can be used directly in existing engines and infrastructure without requiring significant modifications. Furthermore, the follow-up products, such as kerosene, diesel, and gasoline, have a wide range of applications, primarily in the transport sector.
However, modeling the technical generation potential alone is not sufficient to realistically estimate a country’s export potential. A key aspect to consider is that the developments and investments required for export purposes rely on an additional expansion of both renewable electricity generation and synthetic fuel production. It is crucial that this expansion does not come at the expense of the exporting countries’ own energy transition, which would otherwise undermine global climate protection goals. For a better assessment of export potentials and costs, this aspect was considered in our application of the GlobalFuel model. We have estimated the long-term MENA countries’ potential domestic demand for renewable electricity and synfuels and taken this into account when determining spatially differentiated cost potentials for exports. The aim is to investigate the challenges that such developments and corresponding visions could pose and their impact on the remaining export potential under the assumption of land competition.
2 Materials and methods
An overview of the overall approach and methodology of modeling cost potentials for FT fuels is also presented in Braun et al. (2022). The work includes a comprehensive analysis of RE potential (see section 0) and energy scenario (see Section 2.2). The resulting hourly RE yields, maximal installable RE capacities, and domestic energy demands serve, among others, as input for the subsequent fuel cost-potential analysis. Elements of the fuel cost-potential analysis are illustrated in Figure 1, which shows the scope of the developed GlobalFuel framework. The framework includes an optimization model, a fuel potential analysis, a cost-potential manipulation, and various visualizations of results. The optimization model represents the customized PtX process (see Section 2.4), taking into account the RE yield, as well as detailed techno-economic assumptions regarding PtX components and commodities. It primarily calculates component capacities and plant system costs, from which levelized production costs are derived. The potential analyses consider the maximum installable RE capacities and the ratio between the installed RE power plant capacity and the amount of produced fuel in the optimization model. This results in the actual fuel potential. The raw production costs and potentials are regionalized to countries and then further manipulated by domestic energy demands and CO2 cost potentials, resulting in the final cost potentials of green FT fuels (see Section 2.6).
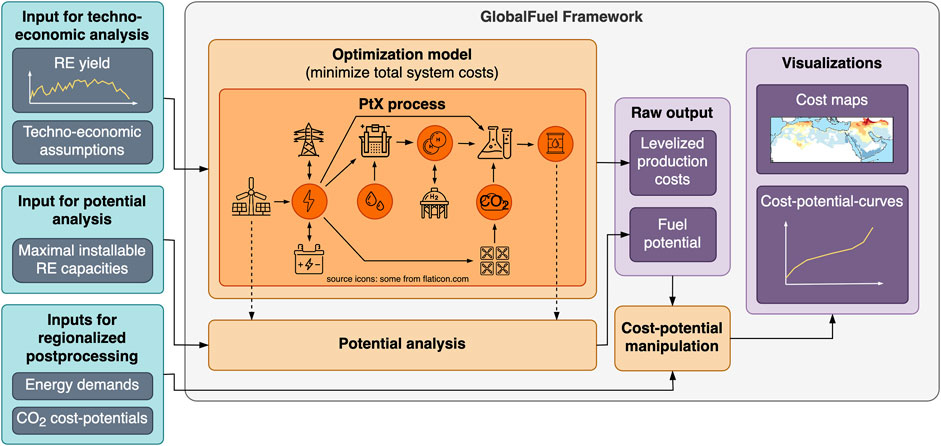
Figure 1. Concept of modeling fuel production routes and obtaining cost-potential curves.
The calculations are carried out for a large number of locations defined by a grid across the entire MENA region with a spatial resolution of 0.45° × 0.45° (approximately 50 km × 50 km) and for 2030, 2040, and 2050. The MENA region consists of 17 countries, namely, Algeria (DZ), Bahrain (BH), Egypt (EG), Iran (IR), Iraq (IQ), Jordan (JO), Kuwait (KW), Lebanon (LB), Libya (LY), Morocco (MA), Oman (OM), Qatar (QA), Saudi Arabia (SA), Syria (SY), Tunisia (TN), the United Arab Emirates (UAE), and Yemen (YE).
2.1 Modeling RE potentials
The time series of RE generation is calculated using the DLR Energy Data Analysis Tool (EnDAT), based on Scholz (2012) and Stetter (2014). To determine the potential of each considered RE technology to deliver energy for synfuel generation, EnDAT uses information on available land areas and installation densities as well as meteorological data. Land availability depends on land cover type, exclusion criteria, and competing uses. To avoid competition between the three RE technologies considered (CSP-PT, PV, and onshore wind), we assume a land utilization factor of 33% each for the potential land cover types: bare, grass, shrub, and sparse lands. The weather data used correspond to a representative meteorological year from the MERRA-2 dataset. According to Stetter (2014), 2002 is selected as the representative year for the MENA region. Global horizontal irradiance (GHI), the temperature at 2 m above the earth’s surface, and the absolute wind speed are used. Furthermore, the Direct Normal Irradiance (DNI) is derived according to Stetter (2014). Finally, EnDAT applies power plant models of the considered technologies and thus calculates installable capacities in suitable areas and the corresponding hourly generation profiles. More information on the generation of RE potentials and time series can be found in Supplementary Material.
Corresponding to the resolution of the MERRA-2 reanalysis data, a spatial resolution of 0.45° × 0.45° (approximately 50 km × 50 km) is used. The temporal resolution of the data is hourly. For each grid cell considered, a time series of the RE generation potential over 1 year with 8,760 points is therefore available. For PV and onshore wind, the generation potential is the electrical output of the plant; for CSP, it is the thermal output of the solar field.
2.2 Development of demand scenarios for MENA countries
The potential future energy demand was estimated separately for the two regions—Middle East and North Africa—across several scenario variants.
• A reference Scenario (REF) follows the “Current Policies Scenario” from the IEA’s World Energy Outlook.
• The alternative moderate RE strategy (ALT) represents a comparison case reflecting a moderate path for efficiency improvements, RE expansion, and fuel demand.
• The advanced 100% RE scenario (ADV) follows narratives in which each country achieves 100% RE and complete CO2 emission avoidance by 2050.
• ALT with 100% synthetic fuels in 2050 (ALT2) combines the moderate efficiency and RE expansion strategies of the ALT scenario with the assumption that all remaining fossil fuels are fully replaced by 2050, thereby meeting the 100% RE target.
The scenarios were developed using a simple storyline and simulation approach in order to obtain results that are as transparent and understandable as possible. They do not claim to be optimal in terms of costs or other indicators and criteria but are intended to show a fundamentally possible, exemplary development according to normative goals and assumptions. The methodology is based on bottom–up energy scenario modeling with an accounting framework and a calibration of the model with country-specific statistical data (in particular from the IEA World Energy Balances) on one hand and available regional scenarios that fit the narratives of a far-reaching energy transition on the other hand. The participation of an international MENA advisory board in the underlying research project (Pregger 2022) enabled a review and discussion of the key narratives by experts from the MENA region. The MENA countries’ own demand was estimated through 2050 based on plausible long-term targets for the use of synthetic energy sources (green hydrogen and power-to-liquid (PtL)) and renewable energies. From today’s perspective, these are the maximum estimates that can be used to quantify a possible impact on the availability and costs of renewable electricity and, thus, on export potential. A focus was placed on the bottom–up estimation of future final energy demand in the transportation sector, supplemented by rough estimates of electricity and fuel demand for the other sectors. Further information on the scenarios and the demand assessment methodology can be found in Supplementary Material.
2.3 Modeling levelized production costs
The aim is to estimate economically reasonable levelized production costs. This can be achieved by designing a cost optimal production plant in which all components are coordinated to ensure that no component is oversized while fulfilling the production requirements. Therefore, the model optimizes the building capacity of each component by minimizing the total system costs. The cost-optimal solution is determined using linear programming, which involves defining a mathematical model based on linear relationships. The linear relationships are implemented in the general algebraic modeling system (GAMS) using the CPLEX solver. The production route comprises different components: commodities, sources, converters, storage units, transport links, and sinks. Model components of the same type share similar parameters and are obtained using the same mathematical equations.
• Commodities represent energy carriers or physical goods such as electricity, hydrogen, or CO2. The model balance is based on these commodities. For each time step, all incoming and outgoing flows must sum up 0 for each commodity, ensuring that sources and sinks are balanced. Commodities can be imported, produced, stored, transported, or consumed.
• Sources are used to model commodity flows entering the system’s boundary as imports. For example, the electricity provided by a PV or wind power plant or the purchase of CO2 from the cement industry builds a source. The available amount of commodities can be hourly or annually limited.
• Converters convert commodities into other commodities. For example, an electrolyzer converts electricity and water into hydrogen. Therefore, commodity requirements per unit of commodity outputs are defined as specific demand parameters.
• Storages receive a medium or commodity, hold it for a specified duration, and then release it subsequently. The storage can be charged in times of abundance and discharged when needed. A typical storage unit would be a battery that stores electricity.
• Transport links are used to transport commodities from one location to another, e.g., within a country to demand centers or exports to other countries.
• Sinks are used to model commodity flows leaving the system boundary for consumption. For example, hydrogen demand is represented as a sink. Sinks can be used to force the model to build a fuel production plant and optimize its system costs. The amount of commodities consumable by a sink can be indicated or limited by a profile or annual sum.
Multiple model components can be defined and linked to each other for building a production route. The production route of this work is defined in Section 2.4. Since we are modeling a system that is operated with fluctuating RE, a high temporal resolution is advisable. The framework allows the temporal resolution to be determined by the available data. In our modeling, we use a temporal resolution of 1 h, which is very common as a compromise between model accuracy and computational load.
2.4 Definition of the PtL route
Based on the general approach shown in Section 2.3, we define the specific PtL production route for the optimization model in this section. In simple terms, the production of FT fuel requires electricity, water (H2O), and carbon dioxide (CO2). Figure 2 shows modeling elements considered for the PtL route to produce FT fuels.
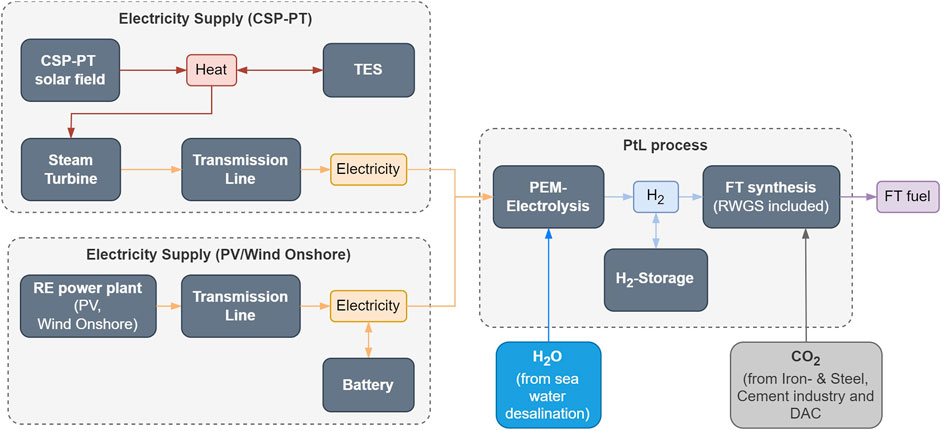
Figure 2. Flowchart for modeling electricity supply linked to the PtL process.
A key underlying assumption in this analysis is that both the electricity supply system and the PtL plant are designed and built from scratch, following a greenfield development approach. This ensures the additionality of renewable electricity for the production of green fuels in order not to impair the transformation of the entire energy system of the countries. In this analysis, consistent with previous assessments, we focus on off-grid power plants that operate independently of the main energy grid. To accommodate the dependency on scenario assumptions, the production costs are calculated for three different RE electricity sources (CSP, PV, and onshore wind).
To mitigate the risk of exacerbating water scarcity in the MENA region, we assume that all water used is sourced from seawater desalination. Our cost estimates are based on a seawater reverse osmosis (SWRO) system, primarily powered by renewable electricity.
FT synthesis requires carbon monoxide (CO), which is produced from CO2 through a reverse water-gas shift (RWGS) reaction. The CO2 required for the RWGS reaction can be captured from the ambient air using direct air capture (DAC) or from industrial processes using carbon capture and use (CCU). Since DAC is a very new and energy-intensive technology, CCU is, in general, the cheaper option but has limited potential depending on the industrial activities and emissions. The two largest industrial emitters of CO2 are the iron and steel and the cement industries (Leeson et al., 2017). For this work, CO2 from these two industries is considered a source for the domestic fuel supply through CCU. The CO2 potential of CCU for each country is limited to its own CO2 emissions from the iron and steel and cement industries. The future CO2 emissions and, therefore, limits for synthetic fuel production are dependent on the underlying scenario. For this work, a CO2 scenario from Hu (2019) was taken, which assumed current policies and ambitious technology development, resulting in comparatively low industrial CO2 emissions in the future. Figure 3 shows the estimated CO2 potentials calculated with technology-specific emission factors and corresponding scenario functions of Hu (2019) aggregated to countries. In contrast to the use of CCU for domestic supply, the export fuel potentials rely exclusively on unlimited CO2 from DAC to ensure 100% green fuel production.
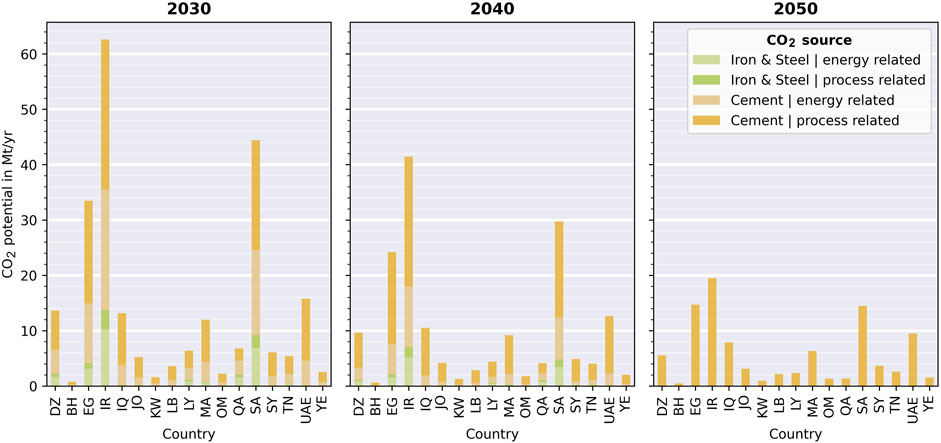
Figure 3. Energy- and process-related CO2 potentials of the iron and steel and cement industries for the considered years and countries, based on Hu (2019).
For hydrogen generation, proton exchange membrane (PEM) electrolysis is considered. PEM electrolysis exhibits a superior dynamic operation behavior, offering the potential to connect the device directly to fluctuating power sources (Albrecht et al., 2016). Compared to alkaline electrolysis (AEL), PEM shows a better load change behavior and a wider part load range (Töpler and Lehmann 2017; Tremel and Aufl, 2018). Compared to the solid oxide electrolyzer cell (SOEC), PEM electrolysis exhibits a higher technology readiness level (Zelt et al., 2021).
To ensure synfuel production using 100% green electricity, the system operates autonomously with integrated storage options and no electricity input from the power grid. In the case of PV and onshore wind, Li-ion battery storage is considered, while in the case of CSP, a thermal energy storage (TES) system using molten salt is assumed. We consider a buffer storage unit like a gas tank for hydrogen storage.
The output product of the PtL process is FT fuel, from which other final products such as kerosene, diesel, and gasoline can be refined. FT fuel is produced via FT synthesis involving the RWGS reaction.
Necessary investments in power transmission lines are included in the synfuel production costs to ensure that infrastructure expenses are not passed on to the general public. Due to long transmission distances, high-voltage direct current (HVDC) lines with DC converters are assumed (see also Figure 4).
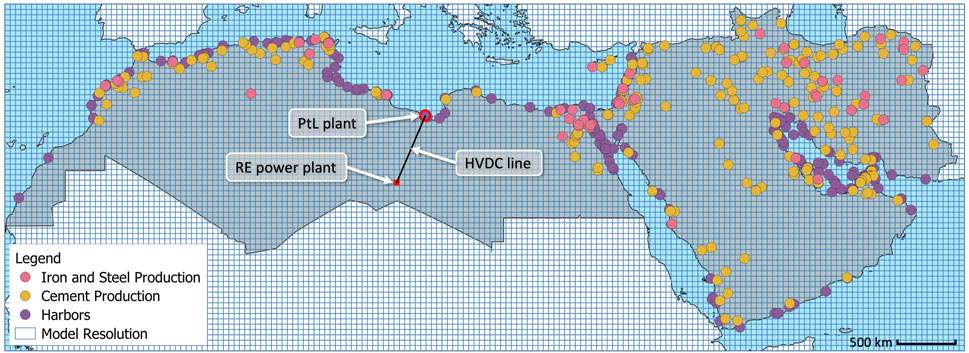
Figure 4. Considered MENA region and spatial resolution of the analysis using the GlobalFuel model. Considered export ports (purple) and CO2 emission sites from iron and steel production (red) and cement production (yellow). Furthermore, the figure shows an example of the location of the PtL plant site and the built HVDC line for the given pixel with its RE power plant for green electricity generation.
The various components of a PtL route can have different locations and, therefore, require different transport routes for electrical energy and raw materials. It is assumed that the PtL plant—including electrolysis, hydrogen storage, and FT synthesis—is located close to the nearest port, minimizing transport distances for the possible export of the produced FT fuels. In addition, iron and steel and cement plants are usually located near the coast, which shortens the transport distances for CO2 (see Figure 4). Water electrolysis near the port offers the advantage of sourcing H2O from nearby seawater desalination plants, eliminating the need to transport water through the desert. The short transport distances of H2O, CO2, and FT fuel are, therefore, neglected in the cost analysis. The locations of the export ports are taken from the World Port Index (WPI) dataset from MSI (2020) (see Figure 4). For the distance of the HVDC line between the RE power plant and the PtL plant, the beeline distance is assumed for simplification.
2.5 Implementation of the optimization model
The production route is represented through flow balances that include the capacities of the system components. The cost calculation provides the total costs that are minimized by the model. The cost calculation also includes the component capacities and, additionally, feedstock costs. The model includes generation, converters, storage components, and commodities. Components and commodities of one type share similar parameters, as shown in Table 1. The model variables are determined using the optimization model. Input parameters are assumptions that enter the model as constants. The specific component capacities and capital expenditure (CAPEX) refer to the maximum output flow of the component. The specific CAPEX refers to the capacity of the component. The specific fixed operating expenses (OPEX) are expressed as annual shares of the CAPEX for the respective technologies.
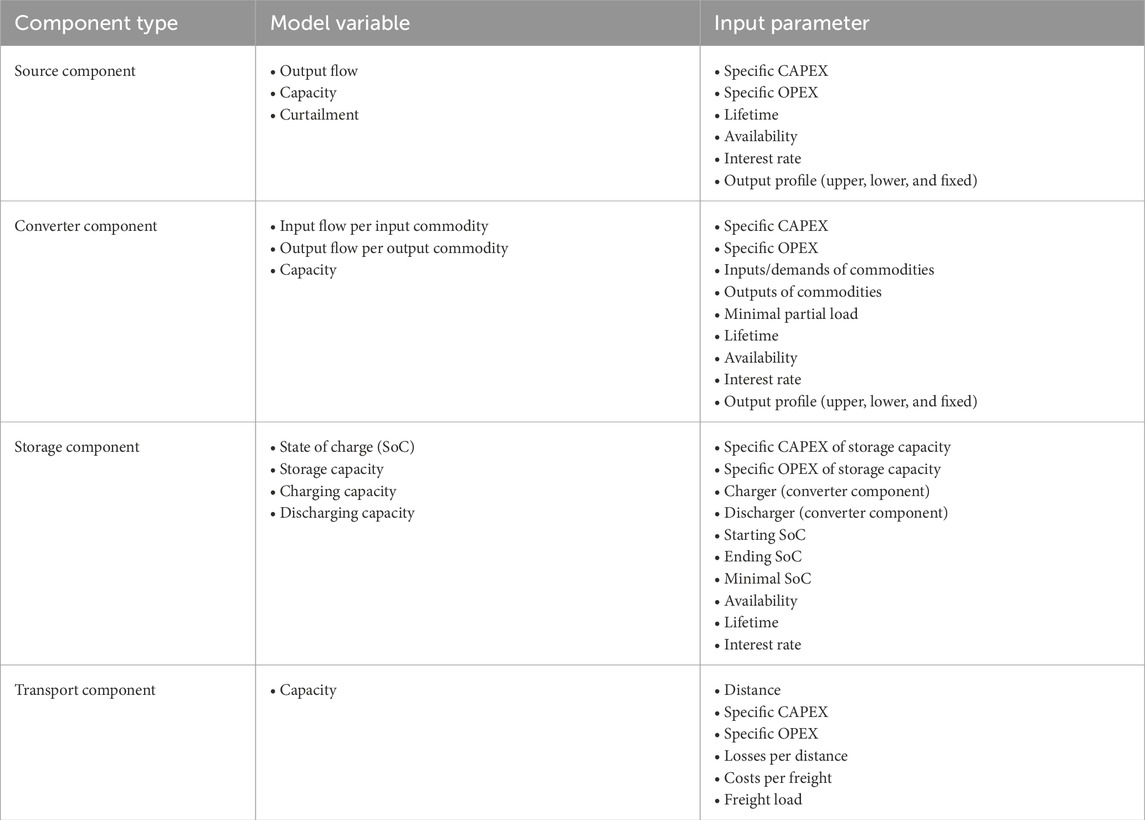
Table 1. Model variables and parameters of the different component types.
2.5.1 Flow balances
The RE power plant supplies the system, as a generation component, with hourly RE electricity generation
Converter components convert the input flow
The hourly state of charge (SoC) of storage components
The input and output flows of each commodity are balanced so that they are equal at each point in time, as shown in Equation 2-4:
2.5.2 Cost calculation
The annual costs
The annual cost
The annuity factor
The commodity costs
The model’s total plant cost
The corresponding net production costs (levelized costs of fuel,
2.5.3 System constraints
The system is optimized for 1 full year of production, using an hourly time resolution. The model is constrained to produce a specified yearly amount of PtX
Additional constraints are as follows: the output flows of each component are limited to their respective capacities. The SoC of each storage component is also limited to its storage capacity. Furthermore, the initial and final SoC of each storage component are set to 50% of their storage capacity. This ensures that no external energy enters the closed system. Finally, all output flows and inputs are positive real numbers
2.6 Fuel potential analysis
The fuel potential analysis derives the techno-economic maximum fuel potential
This scaling is then applied to the fuel potential
2.7 Derivation of cost-potentials
For the derivation of the final cost potentials, the domestic demands calculated in Section 2.2 and the CO2 cost potentials are applied to the raw production cost and fuel potentials.
The land utilization factors for each RE technology were assumed to exclude any overlap of land areas. Hence, the cost potentials of each RE technology case are summarized into one cost-potential curve.
The fuel potential and levelized production costs within the same grid cell are interconnected, as illustrated in Figure 5.
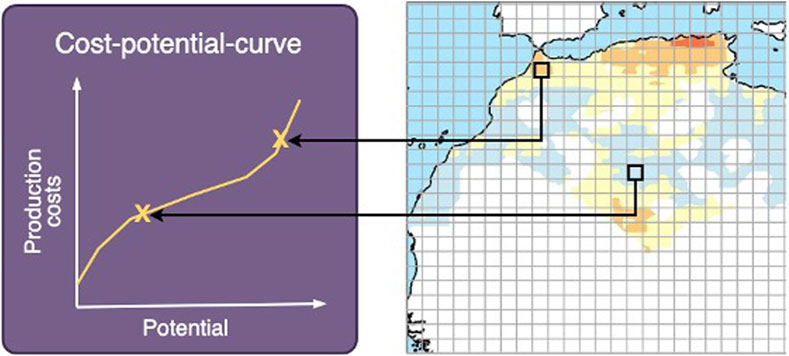
Figure 5. Composition of the cost-potential curve from the spatial model output.
2.7.1 Application of domestic demands
Each determined countries’ own demand was taken into account to allocate the modeled fuel generation potentials between usage for domestic and export markets. Therefore, domestic potentials were matched with the most cost-effective fuel generation options, while export potentials were assigned to more expensive alternatives. Furthermore, favorable RE potentials were reserved for meeting future domestic electricity demand in the remaining sectors, including industry, transport, households, and services, as well as for hydrogen generation, grid losses, and conversion losses. This leads to a gap between the most expensive domestic potentials and the cheapest export potentials. By taking countries’ own demand into account, an influence on both the total potential and the production costs of synfuels for export can be determined.
2.7.2 Application of CO2 cost-potentials
The pixel-wise modeling of fuel levelized production costs is carried out using with specific reference costs for CO2. The actual county-specific CO2 cost potentials are applied in a post-processing step. Therefore, the lowest fuel cost potentials in a country are matched with the lowest CO2 potentials. Once a CO2 cost potential is exhausted, the next-cheapest potential is used. In addition, the CO2 potential with the lowest cost is allocated first to meet domestic synthetic fuel demand, while the remaining CO2 potential is used for export fuel production. The assumed CO2 costs in 2030/2040/2050 are 39/34/30 €/tCO2 from the iron and steel industry, 42/28/15 €/tCO2 from the cement industry (based on Leeson et al., 2017), and 60/40/32 €/tCO2 from DAC (based on Fasihi et al., 2019). The final total plant costs, under the consideration of the CO2 potentials
The levelized production costs are then recalculated using Equation 2-10.
2.8 Techno-economic assumptions
The literature research shows a wide range of techno-economic assumptions. For example, the investment cost of utility-scale solar PV in 2030 can range from 350 to 1,050 $/kW (Ghadim et al., 2025). In this study, assumptions were chosen from sources that present values within an average range to avoid creating an overly optimistic or pessimistic scenario. The techno-economic assumptions are provided in Supplementary Material. An overview of the modeling components is provided as follows.
• The PV power plant is defined as consisting of tilted, permanently mounted PV panels.
• The CSP power plant with a parabolic trough includes a solar field for a system using thermal oil as the heat transfer fluid, a TES system as a common two-tank molten salt system, and a conventional steam turbine.
• The onshore wind power plant corresponds to a typical new plant with moderate technological development (4.4–5.5 MW nominal capacity).
• Electricity is transmitted via an HVDC line with a DC converter station at the beginning and the end.
• Water electrolysis is PEM electrolysis based on a 100-MW system.
• The assumptions for FT synthesis already include the RWGS reaction and hydrocracking for product preparation and separation with a share of 60% diesel, 25% kerosene, and 15% naphtha.
• The battery corresponds to a Li-ion system.
• The hydrogen storage unit refers to a gas tank that serves as a buffer storage in which the hydrogen is stored under pressure.
• The assumptions for the costs of the starting materials H2O and CO2 are assumed to be exogenous.
• H2O is obtained from water desalination, which is operated with a share of renewable electricity of 77%.
• For CO2, costs are based on current extraction methods from cement production, specifically oxyfuel combustion and amine scrubbing.
• For all components, a lifetime of 20 years is expected.
• An exemplary weighted average cost of capital (WACC) of 6% is used as the interest rate for all investments in technologies in all countries.
• The cost assumptions for CO2 from cement or iron and steel production are taken from Leeson et al. (2017), who discussed only capture processes with a CO2 purity higher than 95%.
• The cost assumptions for DAC are taken from Fasihi et al. (2019), who discussed only systems with a CO2 purity higher than 99%. The high CO2 purity of the CO2 stream allows further pretreatment to be omitted.
Many of the used technologies such as CSP, PV, onshore wind, SWRO, PEM electrolysis, battery storage and hydrogen storage show a high technology readiness level (TRL) of 9 for large-scale implementation. For technologies like DAC (TRL 5), CCU (TRL 6), and FT synthesis with integrated RWGS (TRL 6), further development is necessary for large-scale implementation. But all of those technologies are expected to reach a TRL of 9 until 2030 (Zelt et al., 2021; O’Connell et al., 2018).
3 Results
The resulting levelized costs and potentials of FT fuel for the different techno-economic assumptions are presented below. Modeling using GlobalFuel was carried out here as an example of a PtL route; the method and calculated indicators can also be transferred to other PtX products such as hydrogen, methane, methanol, or ammonia. Which of these products may be more profitable depends, among other factors, on the regional infrastructure for transportation and the presence of established markets for chemicals. Quantities of the fuel refer to its lower heat value.
3.1 Local levelized production costs
Figure 6 show the local FT fuel costs separately according to the power generation technology used. For the visualization on a map, the pixel-based results are post-processed with a contour function that aggregates the results into cost categories. The white areas show areas that were excluded due to land cover, geological, or meteorological constraints.
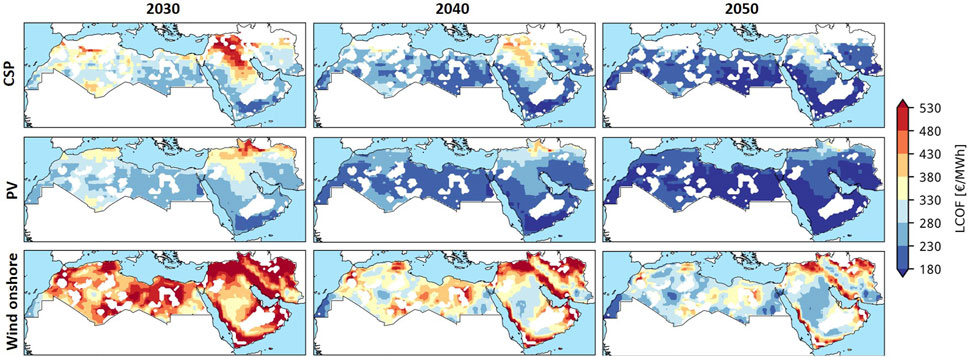
Figure 6. Local levelized production costs for FT fuel with electricity from CSP, PV, and onshore wind in 2030, 2040, and 2050.
It is found that FT fuel production with electricity from CSP and PV achieves the lowest costs on the Atlantic coast south of Tarfaya, around the Red Sea in Egypt and Saudi Arabia, Yemen, Oman, southeastern Iran, and southern Libya. The FT fuel production with electricity from onshore wind energy achieves the lowest costs on the Atlantic coast south of Tarfaya, southern Libya, southeastern Egypt, southeastern Iran, central Algeria, and central Saudi Arabia.
3.2 Starting levelized production costs
Figure 7 shows the starting LCOF, representing the lowest possible production costs derived from the pixel-by-pixel analysis by country and power generation technology for the years 2030, 2040, and 2050. Based on the uniform assumption of a 6% WACC across all countries, the most favorable production costs in the MENA region are primarily found in Oman, Yemen, Saudi Arabia, Egypt, and Morocco. Oman offers the lowest absolute production costs at 196, 155, and 123 €/MWh in 2030, 2040, and 2050, respectively. Alongside the countries mentioned before, Iran, Libya, and the UAE are also favorable, with slightly higher fuel production costs.
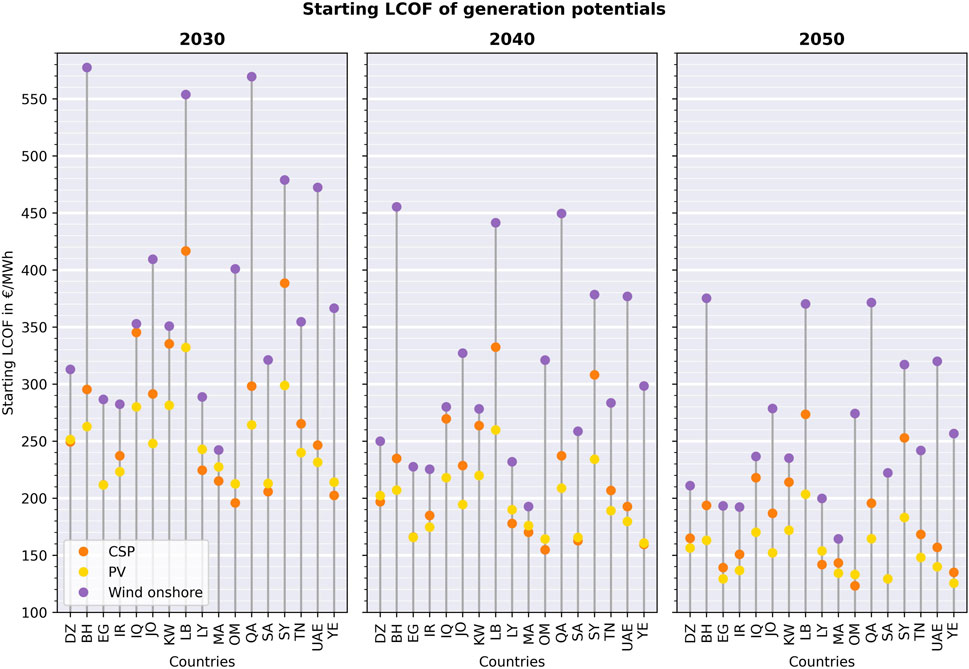
Figure 7. Starting LCOF for FT fuel generation potentials based on considered years, RE technologies, and MENA countries.
The cheapest fuel production costs in Algeria, Libya, Morocco, Oman, Saudi Arabia, and Yemen are achieved with electricity from CSP, closely followed by PV. In contrast, the remaining MENA countries achieve the cheapest fuel production costs with electricity from PV. However, the use of CSP in Egypt and the United Arab Emirates is only slightly more expensive (up to approximately 15 €/MWh) than PV-based fuel generation.
Morocco also exhibits competitive fuel production costs with onshore wind power. Furthermore, Algeria, Kuwait, Iran, and Libya demonstrate relatively low production costs for onshore wind compared to solar energy sources.
The production costs decrease over time due to the assumed learning curves of the technologies used. By 2050, the lowest production costs have decreased by an average of 36% for CSP, 38% for PV, and 32% for onshore wind compared to 2030.
3.3 Possible effects of own consumption on export potentials
Figure 8 shows the resulting final energy demand scenarios for the transport sector estimated for the MENA countries considered. Compared to the 9,600 PJ in 2015, according to the statistics, the bottom–up assumptions made for mileage, efficiency, and electrification result in a maximum demand of approximately 23,000 PJ per year in the reference case for 2050 and 15,000 PJ per year in the moderate consumption case (ALT and ALT2). In the ADV scenario, the assumptions of maximum possible efficiency and electrification developments result in total consumption for 2050 falling below today’s values, although the situations in North Africa and the Middle East are very different. The results of the estimation of the total final energy demand for all sectors per country can be found in Supplementary Material.
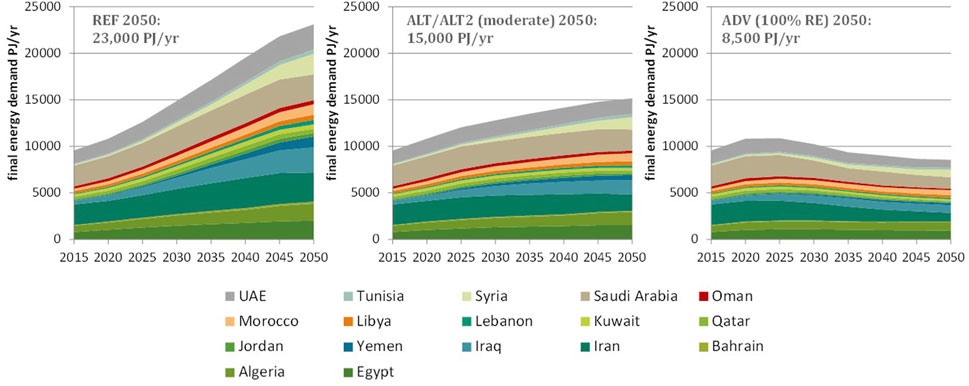
Figure 8. Results of the estimation of final energy demand in transport in the MENA countries for all scenarios.
The resulting electricity consumption to be covered by renewable energies by 2050 is shown in Figure 9, with a distinction by sector and application. The ALT2 scenario represents the maximum development with an increase in total electricity demand by a factor of 12 in the entire MENA region compared to 2021 (by a factor of 6 in the ADV scenario). Assuming 100% renewable electricity generation, this means an increase in installed capacity for wind and solar power in the ADV scenario to approximately 4,500 GW in a mixed RE supply derived from the existing potentials, with renewable electricity generation of approximately 9,700 TWh in 2050 for all MENA countries considered. In the ALT2 scenario, both the generation capacities and annual electricity volumes demand in 2050 are more than twice as high. As a result, the demands on the electricity system in the two 100% RE scenarios are enormous, with maximum annual expansion rates of between 500 and 600 GW of installed solar and wind power plant capacity in the ALT2 scenario. Country-specific scenario data can be found in Supplementary Material, including an overview chart of sectoral electricity consumption.
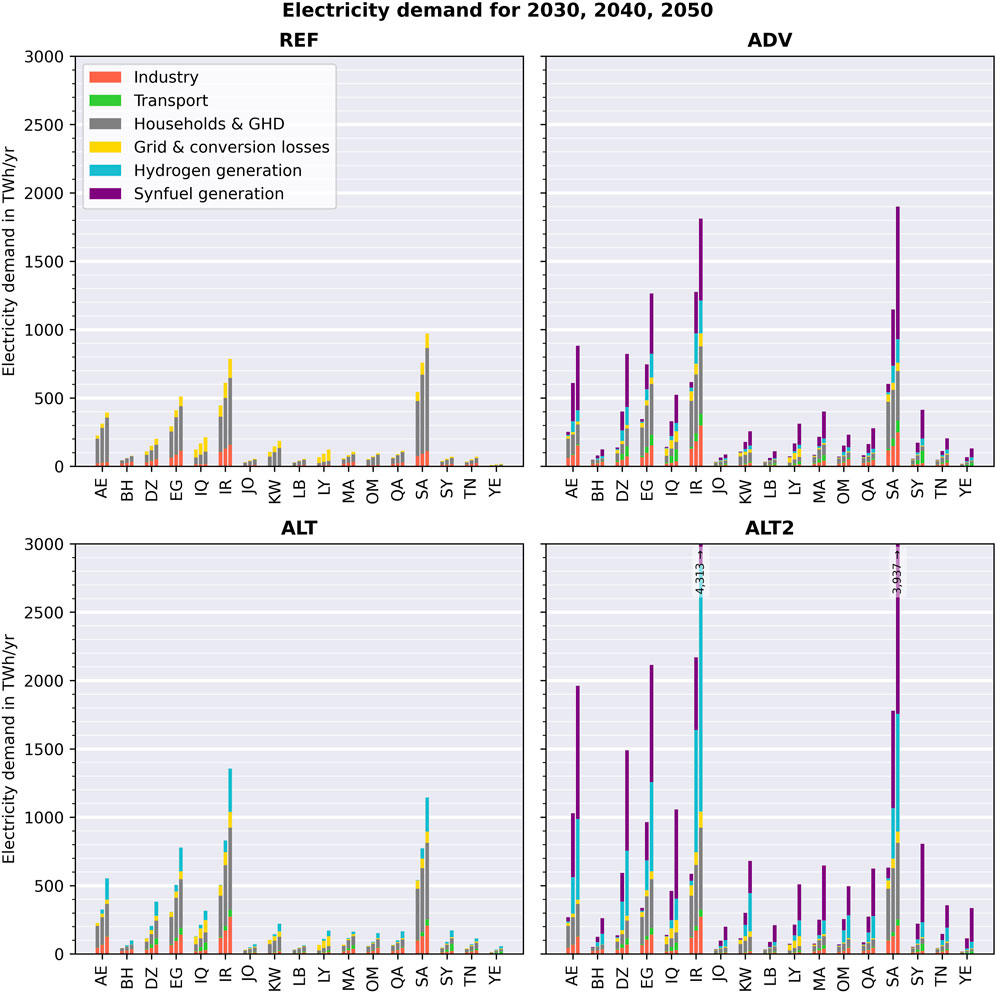
Figure 9. Results of the estimation of renewable electricity demand in the MENA countries for all scenarios.
To estimate the influence of domestic demand on the cost potentials, the best RE locations for the country’s own supply are used in each case. Additional technology expansion for export to Europe begins with the remaining available land potential. Depending on the ambitious climate protection targets assumed in the scenarios, this assumption has a maximum impact on the production costs of electricity and synthetic fuels for export. The effects on the costs and potentials of fuel production for export are presented under the assumptions made and the estimated pessimistic case of maximum own demand in Figure 10.
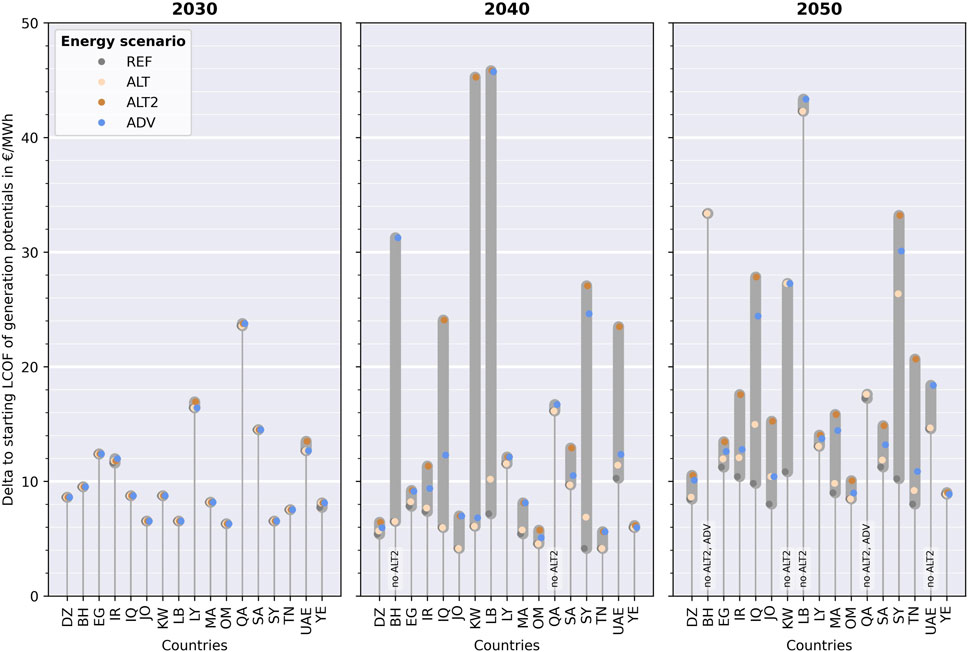
Figure 10. LCOF delta between the starting LCOF of generation and that of export potentials.
For favorable countries, the starting costs for export potentials, after the deduction of their own demands, are moderately higher than those for generation potentials in 2030, 2040, and 2050. The estimated development of generation costs in the energy scenarios considered over the three scenario years is €6, €4-6, and €8-10/MWh in Oman; €8, €6, and €9/MWh in Yemen; €14, €9-13, and €11-15/MWh in Saudi Arabia; €12, €8-9, and €11-13/MWh in Egypt; and €8, €5-8, and €9-16/MWh in Morocco.
In the energy scenarios, domestic demand in 2030 is very similar, so relevant differences in costs and potential only emerge in the years that follow. The increase in domestic demand in all countries over time suggests that the deltas and, thus, the starting costs for export potentials are increasing. However, in some cases, the deltas are lower in future years. This is due to the fact that the starting costs of generation potentials increase more than the starting costs of export potentials. This is mainly because of the change in the cost structure of the CO2 potentials. In more detail, the decrease in the CO2 cost for the cheapest export potentials is lower than the decrease in the CO2 cost for the cheapest generation potentials.
Figure 10 shows the country-specific results in the form of cost differences for the lowest possible generation costs in the event that self-consumption is taken into account for each of the four energy scenarios considered. In contrast to the REF case, in which self-consumption is largely generated by renewable electricity for conventional electricity consumers, self-consumption increases sharply in the alternative scenarios—particularly in ADV and ALT2—due to the additional demand for hydrogen and synthetic fuels. The cost differences increase accordingly, but they develop very differently in absolute terms, especially depending on the country-specific potentials.
To summarize, in favorable large territorial countries, the increase amounts to up to 7 €/MWh in 2030 and up to 16 €/MWh in 2050. For rather small countries with limited renewable electricity potential and high population density, their own demands show a relevant effect on their fuel export potential. It is found that in countries like Bahrain, Lebanon, Qatar, Kuwait, and the UAE, the available RE sites are largely or entirely utilized for domestic electricity and synfuel production in 100% RE scenarios.
3.4 Technical cost potentials of production
Figure 11 presents the cost potentials of FT fuel generation in the entire MENA region for the years 2030, 2040, and 2050. Notably, it reveals that much of FT fuel production relies on electricity generated from PV, which accounts for approximately 71% of the total. CSP contributes approximately 22% to FT fuel generation, with comparable costs. In contrast, wind energy from onshore installations plays a relatively minor role, accounting for approximately 7% of the total, primarily driven by more expensive potential. The lower share of CSP compared to PV is mainly due to the larger total excluded area as PV systems can be built on steeper slopes; for example, the lower potential of wind, compared to that of solar technologies, can be attributed to the rather poor wind conditions relative to the high solar radiation in the MENA region.
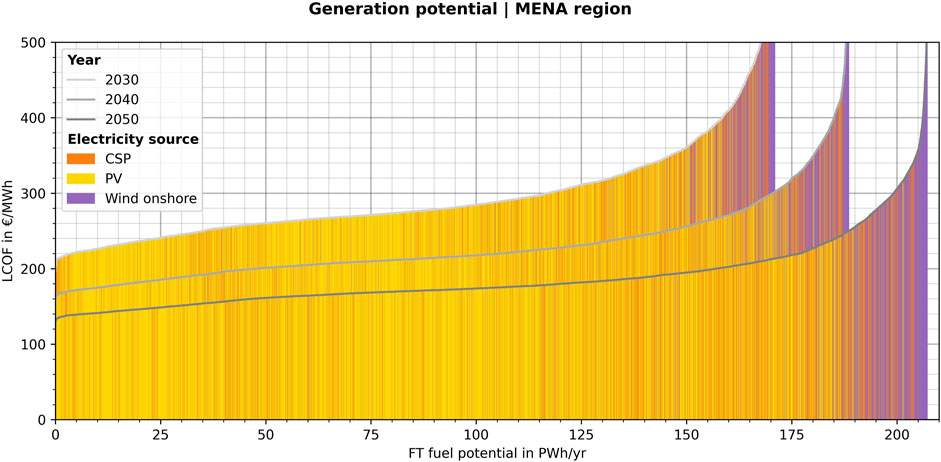
Figure 11. Cost potentials of the FT fuel generation potential in the entire MENA region in 2030, 2040, and 2050.
Figure 12 illustrates the cost potentials of the fuel generation potential in 2030, 2040, and 2050 for the considered MENA countries. For the entire MENA region, the modeling results in a potential FT fuel production of 170,000 TWh/yr in 2030, which increases to 210,000 TWh/yr in 2050. Compared to Germany’s estimated demand of approximately 370 TWh/yr of conventional fuels in 2050, based on a broad mix of drive technologies [scenario ‘Brennstoffmix’ in Krüger and Doré (2022)], the total FT fuel generation potential is extremely high.
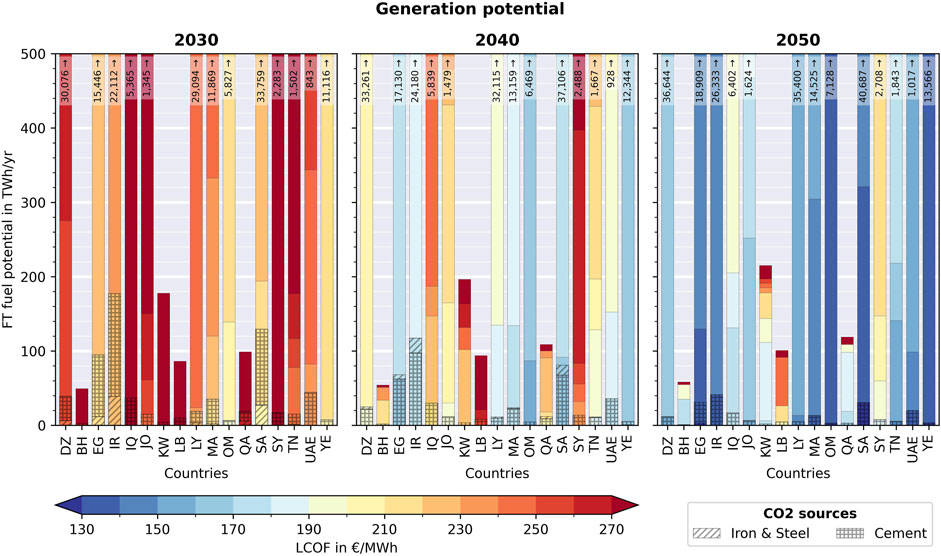
Figure 12. Cost potentials of the FT fuel generation potential in 2030, 2040, and 2050 for the considered MENA countries.
Figure 12 further provides insights into the potentials, highlighting their associated costs. In 2030, fuel potentials between 190 and 200 €/MWh are concentrated in Oman, with approximately 7 TWh/yr available. When considering cost options below 210 €/MWh, additional fuel potentials emerge in Saudi Arabia (28 TWh/yr) and Yemen (7 TWh/yr), while Oman’s potential increases to approximately 130 TWh/yr. By 2040, the cheapest fuel options between 150 and 160 €/MWh are found in Oman, with approximately 87 TWh/yr available. Expanding this cost range to below 170 €/MWh reveals a diverse set of countries with substantial fuel potential: Egypt (62 TWh/yr), Oman (500 TWh/yr), Saudi Arabia (92 TWh/yr), and Yemen (2,300 TWh/yr). By 2050, the most affordable fuel options below 130 €/MWh will be dispersed across several countries, including Egypt (3 TWh/yr), Oman (3 TWh/yr), Saudi Arabia (30 TWh/yr), and Yemen (3 TWh/yr). However, when considering slightly higher costs below 140 €/MWh, a broader range of countries offers significant fuel potentials: the UAE (21 TWh/yr), Egypt (130 TWh/yr), Iran (41 TWh/yr), Morocco (13 TWh/yr), Oman (950 TWh/yr), Saudi Arabia (290 TWh/yr), and Yemen (5,200 TWh/yr).
Figure 13 illustrates the cost potentials of the FT fuel export potential in 2030, 2040, and 2050 for the considered MENA countries. The export potentials are derived by considering the countries’ own electricity and synfuel demand in the ALT2 energy scenario. In this scenario, the countries’ needs to reach the 100% RE target are relatively high, as an upper estimate of a possible reduction in export potential. This has a significant impact, especially on countries with small areas and high populations. Bahrain, Kuwait, Lebanon, Qatar, and the UAE show lower export potentials compared to their technical generation potential. In some of these countries, no export potential emerges in the long term due to increasing own demand. For large territorial countries, their own electricity and synfuel demands do not have a significant effect on the total potential. However, as the most cost-effective RE locations are reserved for meeting the domestic electricity demand, the costs of fuel export potentials increase. This effect is further reinforced by the assumption that the most cost-effective CO2 potentials are allocated to the countries’ own synfuel production.
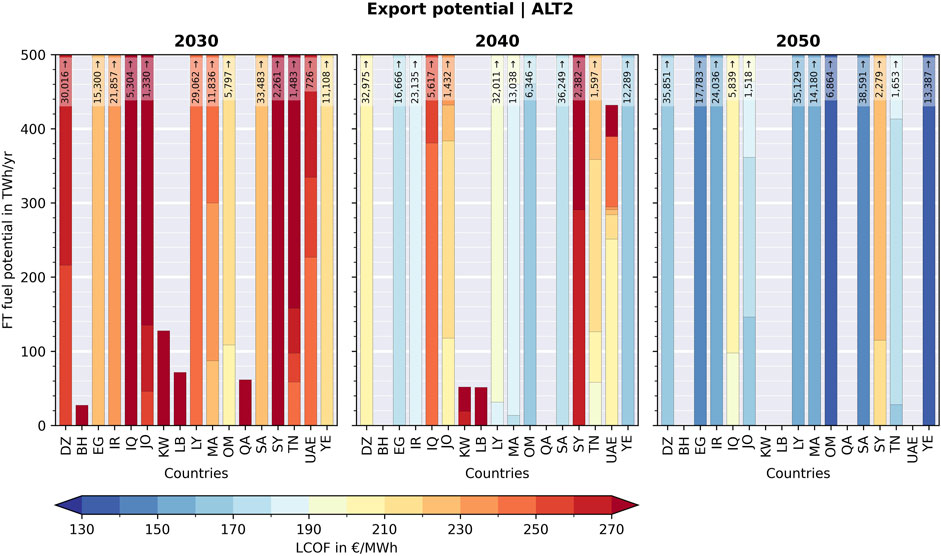
Figure 13. Cost potentials of the FT fuel export potential in 2030, 2040, and 2050 for the considered MENA countries. The export potentials are derived by considering the countries’ own demand of the countries in the ALT2 energy scenario.
For 2030, the cheapest fuel export potentials between 200 and 210 €/MWh are approximately 110 TWh/yr, located in Oman. When considering cost options between 210 and 220 €/MWh, additional fuel potentials emerge in Oman (400 TWh/yr) and Yemen (2,600 TWh/yr). By 2040, the most affordable fuel options between 160 and 170 €/MWh are found in Oman (496 TWh/yr) and Yemen (2,300 TWh/yr). Expanding this cost range to 170–180 €/MWh reveals a diverse set of countries with substantial fuel potential: Egypt (900 TWh/yr), Morocco (13 TWh/yr), Oman (2,000 TWh/yr), Saudi Arabia (2,600 TWh/yr), and Yemen (7,000 TWh/yr). By 2050, the cheapest fuel options between 130 and 140 €/MWh will be located in Oman (690 TWh/yr) and Yemen (5,000 TWh/yr). When considering slightly higher costs between 140 and 150 €/MWh, a broader range of countries offers significant fuel potential: Egypt (1,200 TWh/yr), Oman (3,200 TWh/yr), Saudi Arabia (6,000 TWh/yr), and Yemen (6,200 TWh/yr).
The export cost potentials shown correspond to the extreme energy scenario ALT2, which results in relatively high export costs. As illustrated in Figure 14, the lowest costs for export potentials are lower under the assumption of own consumption according to the ADV scenario than in the ALT2 scenario. The moderate REF and ALT energy scenarios without achieving climate neutrality result in lowest costs for export potentials. The real costs of exports may, therefore, be significantly lower than the cost potentials estimated under the assumptions made in this assessment, as shown in Figure 13.
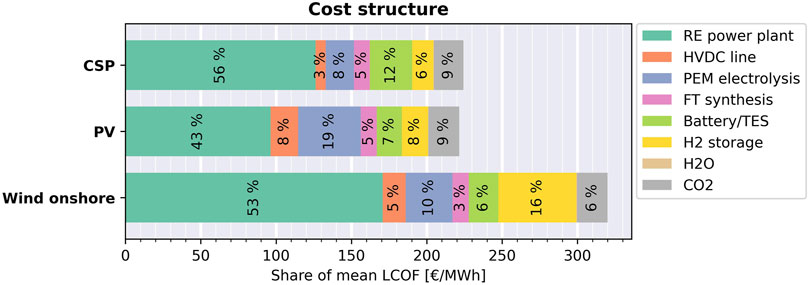
Figure 14. Cost shares of system components and commodities. The cost shares are the mean values of the corresponding cheapest 10% of locations in the year 2030.
To summarize, the prospects for producing synfuels using green electricity in the MENA region appear highly promising. The estimates range from approximately 3,400 TWh in 2030 at costs between 190 and 220 €/MWh and approximately 6,700 TWh in 2050 at costs between 120 and 140 €/MWh. The majority of this potential comes from countries such as Egypt, Morocco, Oman, Saudi Arabia, and Yemen. Considering countries’ own demands, the export potentials in the same corresponding cost ranges amount to 3,100 TWh in 2030 and 5,700 TWh in 2050. In comparison, the demand for PtL fuels in Germany is significantly lower, with estimates suggesting up to 140 TWh in 2030 and up to 430 TWh in 2050 (Krüger and Doré 2022).
3.5 Production cost structure
Figure 14 illustrates the cost breakdown of system components and commodities of PtX plant optimization. The cost shares are represented by the mean values of the cheapest 10% of locations in 2030 for the corresponding renewable electricity sources: CSP, PV, and onshore wind. Notably, the RE power plant constitutes the largest share, with approximately 56%, 43%, and 53%, respectively. The high cost share indicates that the economic assumptions of the RE power plant are especially sensitive to the resulting production costs. Storage costs, including battery/TES and hydrogen storage, also account for a significant proportion, approximately 18%, 15%, and 22%, due to the nature of fluctuating RE sources in combination with the required minimum loads for fuel production. The high storage capacities and the associated costs are mainly due to the required minimum load. This indicates that the required minimal load for the FT synthesis is also a sensitive parameter for the resulting production costs.
The cost share for PEM electrolysis is approximately 8%, 19%, and 10%, respectively. CO2 procurement accounts for moderate shares of approximately 9%, 9%, and 6%. It has to be mentioned that the cost structure is presented for the most cost-effective potentials, with CO2 sourced from the iron and steel industry as the lowest-cost option. In contrast, under the given assumptions, the costs of CO2 from DAC would be approximately 1.5 times higher. This increase in CO2 costs would translate into an approximate 5%, 5%, and 3% increase in production costs for the three considered RE technologies, respectively. These findings suggest that the choice of the CO2 source has a significant impact on the resulting production costs. Figure 14 further shows that FT synthesis (5%, 5%, and 3%), power transmission (3%, 8%, and 5%), and water procurement (less than 1% in each case) account for relatively low-cost shares. Notably, the electricity transmission costs for CSP are substantially lower than those for PV and onshore wind. As discussed in Section 2.4, the model structure and component layout differ between CSP and PV/onshore wind. The reduced electricity transmission costs associated with CSP can be attributed to the fact that energy can be buffered in the TES system before transmission, resulting in a lower peak load. Placing the energy storage at the RE source site instead of the demand site leads to lower electricity transmission costs. Thus, the shown production costs for fuel with electricity from PV and onshore wind can potentially be lower.
The higher production costs for fuel production with electricity from onshore wind are mainly due to higher storage requirements and higher specific investment costs of the wind turbine.
3.6 Full load hours and capacities
In general, the local wind and solar conditions affect the full load hours or capacity factor of the RE power plant. High capacity factors in power generation enable higher capacity factors for electrolysis and FT synthesis, leading to lower production costs without having to increase the storage capacities.
Figure 15 illustrates the resulting full load hours for the RE power plant, PEM electrolysis, and FT synthesis and the specific storage capacity. The specific storage capacity refers to a storage capacity converted into fuel equivalents per capacity of FT synthesis. The full load hours for the RE power plant are approximately 2,200 h (CSP), 1,600 h (PV), and 1800 h (onshore wind), respectively. Their load is slightly below their potential maximum. This suggests that a modest reduction in capacity, accompanied by a slight curtailment, may be a more cost-effective approach. The full load hours for PEM electrolysis are approximately 8,300 h (CSP), 3,600 h (PV), and 5,100 h (onshore wind). The load in the case of PV and onshore wind is comparatively lower than that in the case of CSP. High-load electrolysis can only be achieved with a higher energy storage capacity. Under the assumptions made, low-load electrolysis with high capacity appears to be more cost-effective than high-load electrolysis with low capacity. The total storage capacities are approximately 60 kWhfuel/kWFTS (CSP), 40 kWhfuel/kWFTS (PV), and 190 kWhfuel/kWFTS (wind onshore). This shows a significantly higher need for storage capacities in the case of onshore wind. Interestingly, the specific capacity of the TES system in the case of CSP is higher than that of the battery in the case of PV and onshore wind. The low specific storage capacity in the case of PV and onshore wind indicates that the storage capacity of the battery is only designed to ensure that the minimum load required for PEM electrolysis is maintained at all times. The more cost-effective hydrogen storage system is used to guarantee the required minimum load of the FT synthesis. In the case of CSP, the TES system enables more cost-effective energy storage than the battery. Based on the assumptions made, it appears to be more cost-optimal for CSP to increase the load of electrolysis using a TES system. However, a significant proportion is still stored in the form of hydrogen. For onshore wind power, it is likely that a relatively large H2 storage facility will be required to compensate for prolonged periods of low wind speeds. Shutting down production during these periods could lead to lower storage requirements and potentially reduce production costs.
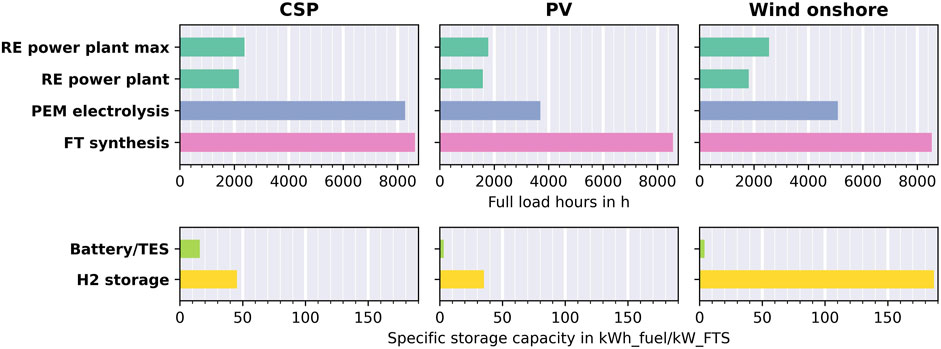
Figure 15. Resulting full load hours for the RE power plant, PEM electrolysis, and FT synthesis and the specific storage capacity (referring to a storage capacity converted into fuel equivalents per capacity of FT synthesis). The values are expressed as the mean of the corresponding cheapest 10% of locations in the year 2030.
4 Discussion
The results presented are subject to uncertainties, which can add up due to numerous uncertainties in techno-economic assumptions and input data. The results must, therefore, always be viewed in the light of the assumptions made and the underlying methodology. For example, the selected weather year, with its fluctuation in solar and wind power, has a significant influence on the design of the PtL plant and its costs. Years with more or less weather fluctuations and extreme weather events can lead to different capacity factors of the components or the need for more or less storage capacity, which, in turn, leads to different potentials and production costs. In this work, a representative weather year was chosen in order to minimize the inaccuracy. The assumptions about the availability of land are also uncertain, which has an influence on the overall potential for renewable electricity and PtL. For example, areas change due to construction activity, forest fires, desertification, renaturation, etc., so that the availability of land for the use of RE deployment can change in the future. Furthermore, the terrain, e.g., in mountainous areas, can have an impact on the construction, operation, and maintenance costs of RE power plants (Feng et al., 2025). However, this aspect is neglected so as to reduce the complexity. The utilization factors by land cover type, which were applied evenly to the MENA regions, also have a large influence on the overall potential and, therefore, represent a major uncertainty. The potentials are determined on the basis of land areas that can be advantageous and disadvantageous due to their meteorological conditions. If the upper limit for the use of a certain land cover type could be set depending on regional conditions, a higher favorable potential could be considered in the analysis.
As found, the CO2 cost potentials have a noteworthy impact on the resulting levelized production costs of synfuel. These potentials can increase if imports of CO2 are considered or decrease through alternative pathways that achieve carbon neutrality in industries such as iron and steel (Hu, 2019). Moreover, the costs of CO2 capture and utilization can vary, with DAC potentially offering a more cost-effective solution than our initially assumed conservative scenario.
In addition, the analysis of the technical potential is based on a uniform and moderate interest rate and, therefore, does not take into account the country-specific investment environment and possible investment risks. These can significantly influence the costs of hydrogen and its derivatives in each country and, thus, also affect the selection of potential export countries. A corresponding cost-potential analysis under the consideration of country-specific investment risks was conducted by Terrapon-Pfaff et al. (2025).
Compared to the results shown, lower costs could be achieved through further system optimization if free capacities of existing infrastructures such as refineries and power transmission lines are used, thus reducing the extent of the new infrastructure required. Furthermore, there is potential to reduce the high share of storage costs through a renewable electricity mix consisting of solar technologies and wind power, as well as other renewable options if available.
Furthermore, a stand-alone system was assumed for modeling, which neither feeds electricity into the grid nor draws electricity from the grid. This ensures fuel production from 100% green electricity by full additionality of the RE power plant capacities. If the RE power plant and fuel production plant are connected to the power grid, the fuel production plant would have to be operated in a net-zero mode in order to guarantee the additionality of renewable electricity generation. In net-zero operation, the same amount of electricity that the fuel production draws from the grid must be fed into the grid by the RE power plant over a certain period of time. This mode of operation enables a higher utilization and, thus, a reduction in costs for electrolysis and FT synthesis and cost savings for batteries, TES, and hydrogen storage. However, in an energy system that is not 100% based on RE, the electricity drawn from the grid is not guaranteed to be 100% green electricity.
In this cost-potential analysis for PtL, PEM electrolysis in combination with FT synthesis was selected as the production route. Other technologies, such as alkaline electrolyzers or solid oxide electrolyzers, lead to different fuel potentials and production costs due to changes in techno-economic parameters. For example, a higher efficiency of water electrolysis can reduce the demand for electricity and, thus, the RE power plant costs. The potential can generally be increased through more efficient technologies, and the results may change accordingly compared to our prospective assumptions.
The fuel production costs also depend on transportation costs within the country. For example, a favorable RE potential in one region can be used to achieve low fuel production costs despite electricity transmission costs at a location in another region. In the cost-potential analysis, the port-location strategy was selected, in which the PtL plants are located near ports. Other strategies and other assumptions for transportation costs result in different transportation structures, which influence the production costs and, therefore, also the location of the low-cost hotspots.
The calculated technical production costs for FT fuel from PV and CSP electricity are very close to each other. The electricity costs for CSP are significantly higher than for PV, which is mainly due to its power block that includes a steam turbine and TES. The costs for TES are already included for CSP, while additionally required batteries are not included in the calculation of PV electricity costs. However, these storage costs are included in the production route when using PV electricity. In addition, CSP can have advantages over PV that are not reflected in cost modeling. The steam turbine of CSP plants can be operated with a backup burner that uses biomass, fossil, or synthetic fuels. The option of backup operation enables an increase in secured output (capacity remuneration), can provide balancing energy on demand, and contributes to grid stability.
To be able to run the PtL plant optimization on a large number of locations and scenarios, some simplifications were performed to reduce the computational runtime. The cost calculation neglects transport costs for H2O from seawater desalination plants, CO2 from industry sites, and FT fuel to export hubs and costs for further plant components such as CO2 storage. Furthermore, technical simplifications are performed for detailed process characteristics such as self-discharge or time-dependent capacity loss of storages or load-dependent efficiencies, especially for the fluctuating load of the electrolysis. The impact of these simplifications needs to be observed in further studies. Moreover, an investigation into integrated modeling of seawater desalination or DAC could provide insights into the synergies of these processes with the PtX process.
The results can be partly compared with those of the current literature. In Buchenberg et al. (2023), for example, the calculated costs for FT fuels are 110 €/MWh in Africa by 2050. In comparison, Pfennig et al. (2023) estimated synthetic hydrocarbons costs between 110 €/MWh and 130 €/MWh in MENA countries by 2050. Lux et al. (2021) calculated costs between 70 €/MWh and 120 €/MWh for green hydrogen and synthetic methane in the MENA region by 2050, respectively. Calculations of Brynolf et al. (2018) resulted in production costs in the range of 200–280 €2015/MWh fuel in 2015 and 160–210 €2015/MWh fuel in 2030.
Furthermore, we have made assumptions about the potential domestic demand for renewable electricity and fuels in order to consider the countries’ own energy requirements. The extent to which the assumed development paths are possible under the current and expected political, economic, and social framework conditions could not be taken into account. The scenarios, thus, formulate possible requirements for the national transformations of the energy supply that appear necessary for climate protection from a global perspective and are fundamentally feasible from a purely techno-economic point of view. Other assumptions will lead to different results, but the order of magnitude of the influence on export potentials and costs could be demonstrated. Particularly, with regard to the potential demand for green synthetic fuels, there is a high degree of uncertainty about how and in what quantities electricity-based fuels can be produced, transported, distributed, and integrated into the fuel markets in the countries. It can be assumed that in the necessary infrastructure development for electricity generation, hydrogen electrolysis, storage units, and synthesis plants for hydrocarbons or ammonia, there will be no separation between domestic demand and export, but investments need an economic perspective for both. However, due to the high financial strength of potential importing countries, exports could be refinanced better and earlier than supplying the domestic market. The early implementation of export routes could also provide an important impetus for investments in renewable technologies for the energy markets of the exporting countries. In this case, the expansion of electricity generation from renewable energies would also be prioritized to supply new export routes and, thus, delay the domestic supply of electricity from renewable energies. Our study follows the narrative that this does not happen in order to avoid criticism of energy colonialism. Therefore, even in the case of parallel expansion for both purposes, the best land potentials are allocated to domestic supply and deducted to determine the cost-potentials for export. In this sense, our approach represents a maximum estimate of the effect of self-supply on export potential.
There are still many unanswered questions regarding the rapid and massive expansion of renewable energies, fuel production routes, and the parallel implementation of energy cooperation between European and MENA countries. This also requires high standards in both the exporting and importing countries in terms of the renewability and environmental friendliness of the electricity used and the green fuels produced. It also requires a willingness to pay more for energy in the future than in the past.
5 Conclusion
This study advances the research field by addressing the development of methods for the techno-economic assessment of PtX products, resulting in a novel modeling framework with high temporal and spatial resolution. It also provides detailed estimates of levelized production costs and renewable energy potentials in the MENA region through a transparent, scenario-based approach.
By leveraging a bottom–up modeling of production routes and incorporating techno-economic characterization of current and future technologies, this study addresses key research questions regarding the role of renewable electricity, hydrogen, and PtL in the MENA region as well as their potential as import options for Europe. The findings confirm that the MENA region has significant renewable energy potential, capable of supporting cost-effective PtL production.
The estimated PtL production costs decrease from approximately 196 €/MWh in 2030 to 123 €/MWh in 2050, highlighting the substantial opportunities for green fuel production in the MENA region. However, the competitive landscape between PtL fuels and alternative synthetic energy carriers, such as hydrogen, underscores the need for strategic planning in resource allocation and export priorities. Additionally, addressing domestic renewable energy and synfuel demands, particularly in smaller MENA countries, significantly impacts export potentials as these nations will prioritize their own needs.
The estimated scenarios show enormous opportunities but also very great challenges for the supply of renewable energies in the MENA countries. This results in a huge need for infrastructure and targeted investment in the expansion of RE technologies, which is not yet on the political agenda in most countries. Taking into account the countries’ own demand for renewable electricity and synfuels leads to adjusted cost-potentials for exports. This leads to rather small impacts on the potential for large territorial countries and the MENA region as a whole. Nevertheless, the consideration of countries’ own demand increases the costs of the synfuel export potentials.
Solar-based electricity production (PV and CSP) emerges as the most economically viable route, although wind power can complement production in specific regions like Morocco and Iran, reducing costs through hybrid systems. Other possible RE sources such as offshore wind, ocean energy, or hydropower are not taken into account but are likely to play only minor roles in the MENA region.
The quantitative estimates for different renewable electricity supplies appear plausible in comparison with previous work. Although the RE potential is unevenly distributed, almost all MENA countries and regions have a significant potential at low costs and are, therefore, suitable for PtX production.
The results also emphasize the pivotal role of system components in determining PtL production costs, with electricity generation plants accounting for the largest share of costs (40%–60%) and storage systems (battery, TES, and hydrogen storage) contributing 15%–25%. However, the ability to operate the fuel synthesis process at lower partial loads has the potential to significantly reduce the cost share of the storage components.
Despite the clear technical potential, the realization of large-scale PtL production and exports depends on overcoming substantial challenges, including infrastructure development, investment mobilization, and alignment with political and socio-economic frameworks in MENA countries. Ensuring sustainable exports to Europe requires addressing domestic renewable energy demands and fostering local stakeholder engagement. Using the DLR GlobalFuel Framework, the study identifies potential production hot spots where green fuels could be produced cost-effectively, but achieving these targets necessitates a comprehensive approach, integrating technological, economic, and political strategies.
The findings highlight the maturity of key technologies like renewable electricity generation (PV, CSP, and wind), electrolysis, synthesis processes, and seawater desalination but also stress the urgency of advancing integration technologies and addressing systemic challenges. As the energy transition unfolds, the focus must expand beyond technical potentials to include market design, governance, and cross-border collaboration, ensuring that PtL production becomes a feasible and sustainable pillar of future energy systems.
Data availability statement
The raw data supporting the conclusions of this article will be made available by the authors, without undue reservation.
Author contributions
JB: Conceptualization, Data curation, Formal Analysis, Investigation, Methodology, Software, Validation, Visualization, Writing – original draft, Writing – review and editing. TP: Conceptualization, Data curation, Formal Analysis, Funding acquisition, Investigation, Methodology, Writing – original draft, Writing – review and editing. JK: Formal Analysis, Funding acquisition, Investigation, Project administration, Writing – review and editing. YS: Data curation, Methodology, Software, Writing – original draft, and Writing – review and editing.
Funding
The author(s) declare that financial support was received for the research and/or publication of this article. This work is based on the MENA-Fuels project (https://wupperinst.org/en/p/wi/p/s/pd/789) funded by the Federal Ministry for Economic Affairs and Climate Action (Federal Ministry of Economic Affairs and Energy) as part of the German Federal Government’s energy research program (FKZ 03EIV181, duration: October 2018 to June 2022). In addition, this research was funded by the Energy Program of the German Aerospace Center in 2022–2024.
Acknowledgments
The authors thank Massimo Moser, whose work formed the basis for the framework development and the analysis. He started the work at DLR and moved to Transnet BW during the MENA-Fuels research project. They would also like to thank Alexandra Baumgartner for supporting the bottom–up assessment of the MENA countries’ energy demand scenarios as part of her student research at DLR.
Conflict of interest
The authors declare that the research was conducted in the absence of any commercial or financial relationships that could be construed as a potential conflict of interest.
Generative AI statement
The author(s) declare that Generative AI was used in the creation of this manuscript. To improve language.
Publisher’s note
All claims expressed in this article are solely those of the authors and do not necessarily represent those of their affiliated organizations, or those of the publisher, the editors and the reviewers. Any product that may be evaluated in this article, or claim that may be made by its manufacturer, is not guaranteed or endorsed by the publisher.
Supplementary material
The Supplementary Material for this article can be found online at: https://www.frontiersin.org/articles/10.3389/fenrg.2025.1550419/full#supplementary-material
References
Albrecht, F. G., König, D. H., Baucks, N., and Dietrich, R.-U. (2016). A standardized methodology for the techno-economic evaluation of alternative fuels – a case study. Fuel 194, 511–526. doi:10.1016/j.fuel.2016.12.003
Brändle, G., Schönfisch, M., and Schulte, S. (2021). Estimating long-term global supply costs for low-carbon hydrogen. Appl. Energy 302, 117481. doi:10.1016/j.apenergy.2021.117481
Braun, J., Kern, J., Scholz, Y., Hu, W., Moser, M., Schillings, C., et al. (2022). Technische und risikobewertete Kosten-Potenzial-Analyse der MENA-Region. Teilbericht 10 das Bundesministerium für Wirtschaft und Klimaschutz (BMWK). Available online at: https://wupperinst.org/fileadmin/redaktion/downloads/projects/MENA-Fuels_Teilbericht10_Kostenpotenziale.pdf (Accessed July 15, 2024).
Brynolf, S., Taljegard, M., Grahn, M., and Hansson, J. (2018). Electrofuels for the transport sector: a review of production costs. Renew. Sustain. Energy Rev. 81, 1887–1905. doi:10.1016/j.rser.2017.05.288
Buchenberg, P., Addanki, T., Franzmann, D., Winkler, C., Lippkau, F., Hamacher, T., et al. (2023). Global potentials and costs of synfuels via fischer–tropsch process. Energies 16 (4), 1976. doi:10.3390/en16041976
ENTSOG (2023). Learnbook on hydrogen supply corridors. Clean Hydrogen Alliance Transm. Distribution Roundtable. Eur. Clean Hydrogen Alliance. Available online at: https://www.entsog.eu/sites/default/files/2023-04/web_entsog_230311_CHA_Learnbook_230418.pdf (Accessed October 14, 2024).
Fasihi, M., Bogdanov, D., and Breyer, C. (2017). Long-term hydrocarbon trade options for the maghreb region and europe—renewable energy based synthetic fuels for a net zero emissions world. Sustainability 9 (2), 306. doi:10.3390/su9020306
Fasihi, M., Efimova, O., and Breyer, C. (2019). Techno-economic assessment of CO2 direct air capture plants. J. Clean. Prod. 224, 957–980. doi:10.1016/j.jclepro.2019.03.086
Fattahi, A., Dalla Longa, F., and van der Zwaan, B. (2024). Opportunities of hydrogen and ammonia trade between Europe and MENA. Int. J. Hydrogen Energy 83, 967–974. doi:10.1016/j.ijhydene.2024.08.021
Feng, X., Zhang, Z., Chen, Q., Guo, Z., Zhang, H., Wang, M., et al. (2025). Integrating remote sensing, GIS, and multi-criteria decision making for assessing PV potential in mountainous regions. Renew. Energy 241 (2025), 122340. doi:10.1016/j.renene.2025.122340
Fthenakis, V., and Kim, H. C. (2009). Land use and electricity generation: a life-cycle analysis. Renew. Sustain. Energy Rev. 13 (6-7), 1465–1474. doi:10.1016/j.rser.2008.09.017
Ghadim, H. V., Haas, J., Breyer, C., Gils, H. C., Read, E. G., Xiao, M., et al. (2025). Are we too pessimistic? Cost projections for solar photovoltaics, wind power, and batteries are over-estimating actual costs globally. Appl. Energy 390, 125856. doi:10.1016/j.apenergy.2025.125856
Guidehouse (2022). Five hydrogen supply corridors for Europe in 2030. Utrecht, The Netherlands: European Hydrogen Backbone. Available online at: https://ehb.eu/files/downloads/EHB-Supply-corridors-presentation-ExecSum.pdf (Accessed October 14, 2024).
Heuser, P. M., Grube, T., Heinrichs, H., Robinius, M., and Stolten, D. (2020). Worldwide hydrogen provision scheme based on renewable energy. Available online at: https://www.preprints.org/frontend/manuscript/a5252f6991a813bb761f35b4235693a3/download_pub (Accessed October 14, 2024).
Hu, W. (2019). Potential analysis of industrial CO2 sources for the provision of synthetic fuels. Stuttgart: Universität Stuttgart, Aerospace Engineering and Geodesy.
IRENA (2022). Global hydrogen trade to meet the 1.5°C climate goal: green hydrogen cost and potential. Abu Dhabi: International Renewable Energy Agency IRENA. Available online at: https://www.irena.org/Publications/2022/May/Global-hydrogen-trade-Cost.
Kanudia, A., Gerboni, R., Loulou, R., Gargiulo, M., Labriet, M., Lavagno, E., et al. (2013). Modelling EU-GCC energy systems and trade corridors. Int. J. Energy Sect. Manag. 7 (2), 243–268. doi:10.1108/IJESM-01-2012-0007
Krüger, C., and Doré, L. (2022). “Nachfrageszenarien – Storylines und Herleitung der Entwicklung der Nachfrage nach Synfuels und Grundstoffen,” in Teilbericht 5 an das Bundesministerium für Wirtschaft und Klimaschutz (BMWK). Available online at: https://wupperinst.org/fileadmin/redaktion/downloads/projects/MENA-Fuels_Teilbericht5_Basisszenarien_Storylines.pdf (Accessed July 15, 2024).
Leeson, D., Mac Dowell, N., Shah, N., Petit, C., and Fennell, P. S. (2017). A Techno-economic analysis and systematic review of carbon capture and storage (CCS) applied to the iron and steel, cement, oil refining and pulp and paper industries, as well as other high purity sources. Int. J. Greenh. Gas Control 61, 71–84. doi:10.1016/j.ijggc.2017.03.020
Lux, B., Gegenheimer, J., Franke, K., Sensfuß, F., and Pfluger, B. (2021). Supply curves of electricity-based gaseous fuels in the MENA region. Comput. and Industrial Eng. 162, 107647. doi:10.1016/j.cie.2021.107647
MSI (2020). “World port index,” in Maritime safety information (MSI). Available online at: https://msi.nga.mil/Publications/WPI.
Neumann, F., Hampp, J., and Brown, T. (2024). Energy imports and infrastructure in a carbon-neutral European energy system. Prepr. Res. Square. Available online at: https://www.researchsquare.com/article/rs-4218656/v1 (Accessed November 15, 2024).
O’Connell, A., Konti, A., Padella, M., Prussi, M., and Lonza, L. (2018). Advanced alternative fuels technology market report 2018, EUR 29937 EN. Luxembourg: European Commission. doi:10.2760/894775,JRC118306
Pfennig, M., Böttger, D., Häckner, B., Geiger, D., Zink, C., Bisevic, A., et al. (2023). Global GIS-based potential analysis and cost assessment of Power-to-X fuels in 2050. Appl. Energy 347, 121289. doi:10.1016/j.apenergy.2023.121289
Pregger, T. (2022). Szenarien zur Eigenbedarfsanalyse für die MENA-Länder: Teilbericht 9 an das Bundesministerium für Wirtschaft und Klimaschutz (BMWK). Available online at: https://wupperinst.org/fileadmin/redaktion/downloads/projects/MENA-Fuels_Teilbericht_9_MENA-Szenarien_v2.pdf (Accessed July 15, 2024).
Pregger, T., Lavagno, E., Labriet, M., Seljom, P., Biberacher, M., Blesl, M., et al. (2011). Resources, capacities and corridors for energy imports to Europe. Int J Energy Sect. Man 5 (1), 125–156. doi:10.1108/17506221111120938
Pregger, T., Schiller, G., Cebulla, F., Dietrich, R.-U., Maier, S., Thess, A., et al. (2020). Future fuels—analyses of the future prospects of renewable synthetic fuels. Energies 13 (1), 138. doi:10.3390/en13010138
Schemme, S., Breuer, J. L., Köller, M., Meschede, S., Walman, F., Samsun, R. C., et al. (2020). H2-based synthetic fuels: a techno-economic comparison of alcohol, ether and hydrocarbon production. Int. J. Hydrogen Energy 45 (8), 5395–5414. doi:10.1016/j.ijhydene.2019.05.028
Scholz, Y. (2012). Renewable energy based electricity supply at low costs. Development of the REMix model and application for Europe. Stuttgart: Universität Stuttgart.
Schreyer, F., Ueckerdt, F., Pietzcker, R., Rodrigues, R., Rottoli, M., Madeddu, S., et al. (2024). Distinct roles of direct and indirect electrification in pathways to a renewables-dominated European energy system. One Earth 7 (2), 226–241. doi:10.1016/j.oneear.2024.01.015
Seck, G. S., Hache, E., Sabathier, J., Guedes, F., Reigstad, G. A., Straus, J., et al. (2022). Hydrogen and the decarbonization of the energy system in europe in 2050: a detailed model-based analysis. Renew. Sustain. Energy Rev. 167, 112779. doi:10.1016/j.rser.2022.112779
Stetter, D. (2014). Enhancement of the REMix energy system model: global renewable energy potentials, optimized power plant siting and scenario validation. Stuttgart: Universität Stuttgart.
Terrapon-Pfaff, J., Braun, J., Raquel Ersoy, S., Prantner, M., Kern, J., and Viebahn, P. (2025). Country risk impacts on export costs of green hydrogen and its synthetic downstream products from the Middle East and North Africa. Front. Energy Res. 13, 1546876. doi:10.3389/fenrg.2025.1546876
Teske, S., Pregger, T., Simon, S., Naegler, T., Pagenkopf, J., Deniz, Ö., et al. (2021). It is still possible to achieve the Paris climate agreement: regional, sectoral, and land-use pathways. Energies 14 (8), 2103. doi:10.3390/en14082103
Töpler, J., and Lehmann, J. (2017). “Wasserstoff und Brennstoffzelle,” in Technologien und Marktperspektiven. 2. Aufl. Berlin, Heidelberg: Springer Vieweg.
Verheugt, M. (2023). Study on hydrogen in ports and industrial coastal areas. Luxembourg: Clean Hydrogen Joint Undertaking; Deloitte.
Zelt, O., Kobiela, G., Ortiz, W., Scholz, A., Monnerie, N., Rosenstiel, A., et al. (2021). Multikriterielle Bewertung von Bereitstellungstechnologien synthetischer Kraftstoffe. MENA-Fuels Teilbericht 3 das Bundesministerium für Wirtschaft und Klimaschutz (BMWK). Available online at: https://wupperinst.org/fileadmin/redaktion/downloads/projects/MENA-Fuels_Teilbericht3_Technologiebewertung.pdf (Accessed July 15, 2024).
Keywords: power-to-X, synthetic fuel, Fischer–Tropsch fuel, green hydrogen, renewable energy, levelized cost of fuel, Middle East and North Africa, export potential
Citation: Braun J, Pregger T, Kern J and Scholz Y (2025) Costs and export potentials of green synthetic fuels produced in the MENA region. Front. Energy Res. 13:1550419. doi: 10.3389/fenrg.2025.1550419
Received: 23 December 2024; Accepted: 10 June 2025;
Published: 24 July 2025.
Edited by:
Muyiwa S. Adaramola, Norwegian University of Life Sciences, NorwayReviewed by:
Marcin Wołowicz, Warsaw University of Technology, PolandDaofan Cao, Hangzhou TE Baylab Co., Ltd., China
Copyright © 2025 Braun, Pregger, Kern and Scholz. This is an open-access article distributed under the terms of the Creative Commons Attribution License (CC BY). The use, distribution or reproduction in other forums is permitted, provided the original author(s) and the copyright owner(s) are credited and that the original publication in this journal is cited, in accordance with accepted academic practice. No use, distribution or reproduction is permitted which does not comply with these terms.
*Correspondence: Jürgen Kern, anVlcmdlbi5rZXJuQGRsci5kZQ==
†ORCID: Jürgen Kern, orcid.org/0000-0002-6722-7264; Josua Braun, orcid.org/0000-0001-5181-5881; Yvonne Scholz, orcid.org/0000-0002-1633-3825; Thomas Pregger, orcid.org/0000-0002-6728-7451