 Olli-Pekka Hilmola
 Lea Fobbe
 Robin von Haartman1
 Per Hilletofth
- 1Department of Industrial Management, Industrial Design and Mechanical Engineering, University of Gävle, Gävle, Sweden
- 2Estonian Maritime Academy, Tallinn University of Technology, Tallinn, Estonia
Due to increasing emission reduction requirements and higher energy prices, manufacturing companies have started to pay attention to the energy efficiency of supply chains, instead of focusing solely on operations. As emission reduction and energy efficiency often share the same objectives, these are frequently addressed together in earlier research. The aim of this research is to examine, through a survey, the level of energy efficiency work conducted by manufacturers with suppliers, and the drivers behind such activities. Based on survey findings completed in 2024, Swedish manufacturers are taking initial steps in energy efficiency work along with suppliers. Typically, suppliers are asked to provide energy use information and analyses. Top management support is the most important driver for this work, followed by a company’s environmental profile, production cost reduction, and an emphasis on Scope 3 emission reduction. There is also some evidence that companies with the public sector as their main customer are more active in energy efficiency work with suppliers.
1 Introduction
Earlier research already in the previous decade concluded that energy efficiency within the supply chain context is an important and expanded research area (Marchi and Zanoni, 2017; Marchi et al., 2018; Centobelli et al., 2018). However, in these earlier literature reviews, a marginal amount of research work was conducted. Earlier research has concluded that energy efficiency investments (like heating system integration; see Miah et al., 2018) are typically needed among small- and medium-sized suppliers, but companies lack proper finance to complete these (Marchi and Zanoni, 2017; Marchi et al., 2018; Centobelli et al., 2018). It has been suggested that their customers (larger companies or even corporations) would provide, e.g., loan guarantees, so that investments are possible and loan terms as well as interest rates are reasonable (Marchi et al., 2018). In a wider context, supply chain energy efficiency should incorporate, e.g., transportation mode selection, loading of vehicles, location of suppliers, product packaging considerations, and product/service redesign (Beheshtinia and Fathi, 2023; Axon and Darton, 2023). Typically, less proximity to suppliers is an advantage for transportation emissions, and using railways lowers the emissions further (Gonzales-Garcia et al., 2009; Brodt et al., 2013; Rizet et al., 2012). Companies also need to reconsider order frequencies and order lot sizes as a too tightly set Lean system is not necessarily environmentally just and energy-efficient (Fahimnia et al., 2015).
In the supply chain literature, supplier engagement, including assessment and collaboration, has been recognized as crucial to positively impact the sustainability performance (Gimenez and Tachizawa, 2012; Seuring and Müller, 2008; Teller et al., 2016). By engaging with suppliers, focal firms can better implement sustainability practices, share costs, and risks with other supply chain actors and increase their competitive advantage (Fobbe, 2020; Meqdadi et al., 2020). Furthermore, scholars and practitioners have highlighted the key role of supplier engagement to reduce Scope 3 emissions and gain insights into the energy savings potential across the entire supply chain, which cannot necessarily be achieved by focusing merely on individual companies (Fagundes Alves et al., 2024; Farsan et al., 2018; Sharma et al., 2024). For example, a study by Butt et al. (2024) showed that among other strategies effectively using suppliers’ data, effective communication, support, and guidance are important to mitigate suppliers’ Scope 3 emissions. Although this shows the crucial position of focal companies to influence suppliers in energy-related issues (Marchi et al., 2018), scholars also point out that very few companies truly engage with their suppliers, when it comes to energy efficiency and reduction of greenhouse gas emissions (Ellram and Tate, 2024; Marchi and Zanoni, 2017).
This research uses a survey targeted at Swedish manufacturers to gain further information about the drivers and level of work with suppliers in improving the energy efficiency. Although energy efficiency has been dealt with in recent research on supply chain management (Marchi and Zanoni, 2017; Marchi et al., 2018; Centobelli et al., 2018), surveys about the overall status of this theme are lacking and rare (Azevedo et al., 2013; Lawrence et al., 2019). Studies mainly consider large companies or small- and medium-sized enterprises (Jalo et al., 2021; Hasan et al., 2021), but there are no studies applying a supply chain perspective. In addition, analyzing a high-income and well-industrialized European country with the effects of the ongoing Ukrainian war and Russian sanction implementations is a rather unique and new environment for this topic. In Sweden (and many other European countries), electricity prices increased significantly in 2022–2023, and this created challenges for societies, supply chains, and companies to live under new realities (Martin-Valmayor et al., 2023). In addition, within this background, there is a constant demand by the European Union to decrease CO2 emissions at all possible levels. Our research problem in this study could be described with following research question: “What is the level of work in supply chains concerning energy efficiency and what are the possible drivers?”
This research is structured as follows: Section 2 reviews recent research on energy efficiency improvements in supply chains and uses mostly case study research works in this analysis. Thereafter, Section 3 introduces the research environment and methodology. Section 4 elucidates the survey analysis, where we analyze the level of energy efficiency work with suppliers. Section 5 analyzes drivers for this work and shows possible correlations between drivers and work items. Section 6 provides the conclusions and avenues for further research in this area.
2 Literature review: energy efficiency in supply chains
Production of raw materials such as metals, iron, and aluminum requires much energy and was one of the typical themes of energy efficiency research in the early phases of supply chain research (Tan and Khoo, 2005; Ferretti et al., 2007). Tan and Khoo (2005) proposed that coal should be avoided in energy production for production process (and natural gas should be used instead), while Ferretti et al. (2007) examined the benefits of liquid aluminum within deliveries for customers (instead of solid aluminum). Gonzales-Garcia et al. (2009), in turn, focused on energy efficiency in pulp manufacturing within the supply chain context. There was approximately 10% saving potential if local wood supply was preferred instead of importing it from abroad. Form early on, a clear linkage was observed between energy efficiency and CO2 emission reduction—large Asian automotive manufacturers considered energy efficiency the key element, especially when expanded it to the supply chain (Lee and Cheong, 2011), while in the European car manufacturing supply chain, it was simply viewed as a means to reduce energy consumption as the main target (Azevedo et al., 2013). In the early phases, research also emphasized the utility of the supply chain approach on use of materials—scrap production and unused products are vital in improving the energy efficiency of steel and aluminum production (Milford et al., 2011), while the usage of recycled material in floor material production is a way to significantly reduce energy use (Lu et al., 2011), or using more biomass in the production of support structures of shoes leads to energy efficiency (Brochardt et al., 2011). The life cycle approach was also observed in the early phases of research works as the product usage phase is typically neglected in the energy efficiency improvement of supply chains. For example, the computer use phase consumes 30%–40% energy (as energy consumption concerns both production and use; Deng et al., 2011). As most emissions still originate from the production and supply chain, it is also reasonable to recycle and refurbish used devices.
Oil and other fossil fuels play an important role in supply chains and their energy efficiency. This was an often-studied theme in more recent research works. In very large logistics service producers, it was a part of green supply chain management practices to transition to using alternative and more sustainable fuels (Cosimato and Troisi, 2015), while at the national economy level (China), oil import was analyzed to consider four main risks (supply, economic, transportation, and dependence), which together had only increased during the years (Zhang et al., 2013). Europe is very much dependent on energy imports, and in five of six case studies, this dependency was rather significantly based on Russian imports (Urciuoli et al., 2014). However, Urciuoli et al. (2014) illustrated, through case studies, that holding inventories is one way of managing short- and medium-term risks. This is needed as in some industries, oil dependency and higher polluting transportation modes are difficult to avoid, like in global fast fashion. As continents differ in production and consumption, supply chains are often very dependent on air freight (Orcao and Pérez, 2014). As Beheshtinia and Fathi (2023) illustrated with a case study (paint production), even less favorable and high emission transportation modes have their improvement potential as optimization and a supply chain approach could bring substantial energy savings. In food and raw material production, there are of course opportunities to produce more energy and electricity from waste (or unused) raw materials; for example, in production of rice, where there is an opportunity to replace expensive energy by harvesting rice husk and using it to produce heat and electricity for the rice mill (Lim et al., 2013). Even if it is generally accepted throughout the world that energy efficiency in the use of oil and gas is challenging for industries due to numerous reasons mentioned earlier, there are currently even economically advanced and industrialized countries (like the United States of America), which hold significant own reserves due to new innovations in the extraction of these raw materials (Martin-Valmayor et al., 2023).
3 Research methodology
An online survey was designed to analyze the supply chain energy management practices of Swedish manufacturing companies. The web application Qualtrics XM was used to administer the survey. The survey consisted of three sections: the first section focused on general company information, including markets served, main customers, company ownership, and the amount of product offered. The second section included questions focused on supplier management, such as the number of suppliers, supplier selection criteria, and supplier engagement; i.e., the level of work on energy efficiency in the supply chain that companies are requesting from their suppliers. The third section focused specifically on supply chain energy management, including questions on drivers to work with energy efficiency in the supply chain. The questions related to drivers were designed based on previous research focused on energy efficiency in manufacturing, particularly studies using questionnaires to investigate the drivers for energy efficiency, such as Rohdin et al. (2007), and the extensions discussed by Johanson and Thollander (2018) and Lawrence et al. (2019). In addition, new drivers that have an explicit focus on the supply chain and working with suppliers were added. The questions were based on 7-point Likert scales, and every question had the option to be left unanswered. To ensure clarity of the questions, avoid leading the respondents, and validate the questions, the survey was tested by experts in energy management in the manufacturing industry (Forza, 2002). Only part of the survey is analyzed in this research work.
A list with 1,199 companies that fall under the Swedish act on energy audits (Sveriges Riksdag, 2014) was obtained by making a list all the companies who had filed a report during the years 2017–2021 and removing duplicates. For the period 2017–2020, the list included the email addresses of 278 companies within NACE codes 10-32. These companies were contacted directly via email, but 49 messages bounced back due to erroneous email addresses. Approximately 20 other respondents contacted the research team in order to be excluded for various reasons primarily because they no longer held a relevant position for answering the survey. Subsequently, a list of relevant companies that reported in 2021, but not included in the email list for the years 2017–2020, was compiled. In order to find appropriate contacts, i.e., personnel familiar with energy and supply chain management efforts, we contacted the companies over the phone. This helped improve the reliability of the study, ensuring the familiarity of the respondents with the topic of the survey questions. Data were collected between October and December 2024, and a total of 391 surveys were sent out; the remaining companies did not show interest in participating or could not be reached.
In order to increase the response rate, two reminders were sent out. This led to a total of 70 individual companies who answered the survey, which results in a response rate of 17.9%. The response rate is consistent with those of other survey studies with similar approaches (Jazairy and von Haartman, 2020). In addition, studies with a similar focus, i.e., analysis of drivers and barriers of energy management, typically have a smaller sample size (Brunke et al., 2014; Jalo et al., 2021) or similar size of respondents (Hasan et al., 2021).
It has to be highlighted that not all companies answered all questions; therefore, the number of responses per questions can differ. Respondents in the following are typically medium- to large-sized companies, with a median number of employees of approximately 400 (this information is based on an optional answer of 53 respondents). Due to the lower response rate in this study and even possibly lower response numbers of particular questions, non-response bias was tested. Survey responses were divided into two sub-groups: 1) those responding in October–November 2024 (n = 24–25) and 2) late responses of the first reminder and those of the second (last) reminder, given in December 2024 (n = 13–17). From both sub-groups, mean values were calculated, and two group responses were compared to each other using t-tests. None of the following two question areas and their numerous questions demonstrated statistical differences between answers of these two sub-groups (not even being close to the 5% threshold). So, with high probability, non-response bias is not an issue here, and the following dataset is representative of the Swedish situation.
4 Working with suppliers toward improving energy efficiency
In the completed survey, responses on work with suppliers concerning energy efficiency received, in general, low values in responses [scale from 1 (“not at all”) to 7 (“completely”)], where the most typical (mode class) answer of all the subquestions given in Figure 1 was 1 (not at all). So, we could conclude that companies, in general, do not work that much with suppliers to improve the energy efficiency. This could be noted in Figure 1 as in six out of eight subquestions had a median response value of 1 (not at all) as well. Remaining two subquestions had a median value of 2. In all of the subquestions, the average (mean) was above the median value, indicating that there were few higher numerical value responses. This indicates that some companies do work with suppliers, but they are rather few in overall response base.
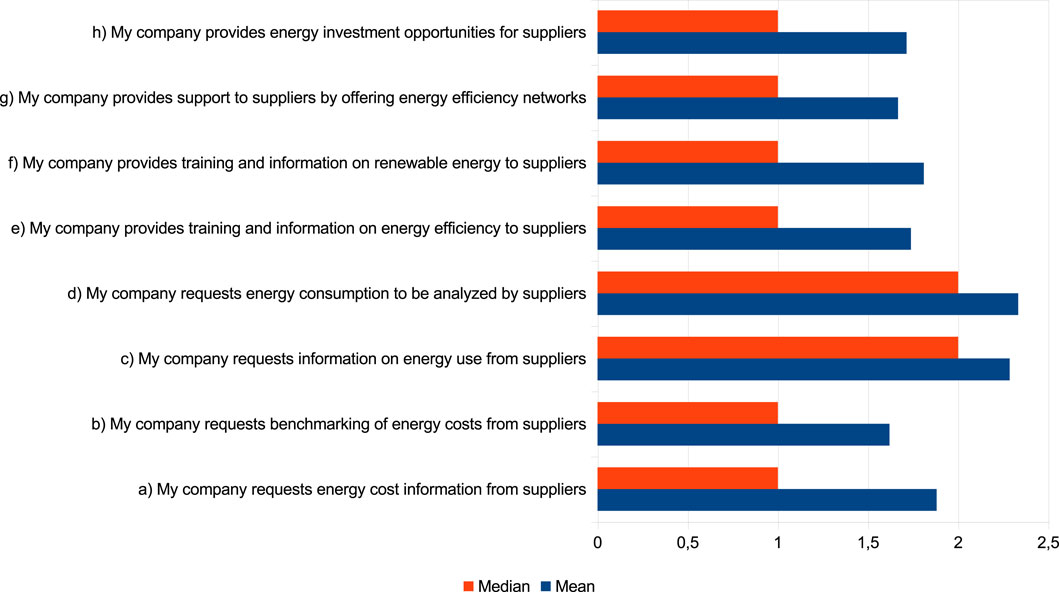
Figure 1. Question: “How well following statements describe your company’s work with suppliers concerning energy efficiency?,” where the scale is ranging from 1 (not at all) to 7 (completely). (n = 42).
As examining mean ratings of subquestions in Figure 1, it is notable that subquestions, “c) My company requests information on energy use from suppliers” and “d) My company requests energy consumption to be analyzed by suppliers,” received more attention and actions from companies. These are also statistically different (p = 0.05, t-test) from the two lowest rated subquestions, “b) My company requests benchmarking of energy costs from suppliers” and “g) My company provides support to suppliers by offering energy efficiency networks.” So, it could be concluded that if interactions and actions occur with suppliers concerning energy efficiency, they are mostly one way from sourcing company toward suppliers, where suppliers are asked to gather information and analyze it. Other more sophisticated approaches (where other parties and organizations are also involved) receive rather low attention.
When analyzing responses to different subquestions of this theme, it was surprising that all subquestion items were positively correlated with each other (see Supplementary Appendix A for details). Most of these correlations were statistically significant with the highest possible level as there were only two in a p-value level of 0.05 and one in a level of 0.01. This only further illustrates the similarity in responses, what was already said from the median values of subquestions. All subquestions received very low ratings, therefore showing strong positive correlations.
We further analyzed responses in Figure 1 by dividing answers into two different groups using different criteria (served markets, domestic vs international; main customers, public vs private sector; amount of products offered to the markets; and company ownership, domestic vs. foreign). Interestingly, only a statistically significant difference appeared in these divisions between “public” and “not public” as main customers (companies might have both public and private sector customers—for this analysis, all companies were included in the public sector if it was selected alone or together with the private sector for consumer and/or business sales). It should be noted that a small group of companies mainly serve the public sector (only six responses), and even if there exist statistical difference (Figure 1), it remains unclear whether this would hold on a larger scale.
Statistically significant different (p = 0.05, t-test) responses in Figure 2 between two groups were identified to be within “a) My company requests energy cost information from suppliers,” “c) My company requests information on energy use from suppliers,” “d) My company requests energy consumption to be analyzed by suppliers,” and “h) My company provides energy investment opportunities for suppliers.” Based on Figure 2, in all of these four subquestions, public sector-serving companies are having clearly much higher ratings and actions, with their suppliers concerning energy efficiency. In the remaining responses, the situation remains the same, where public sector-serving companies have higher ratings; however, these public sector-serving companies do not have statistically significant differences from private sector-serving companies (the latter concerns both consumer and business as a main customer).
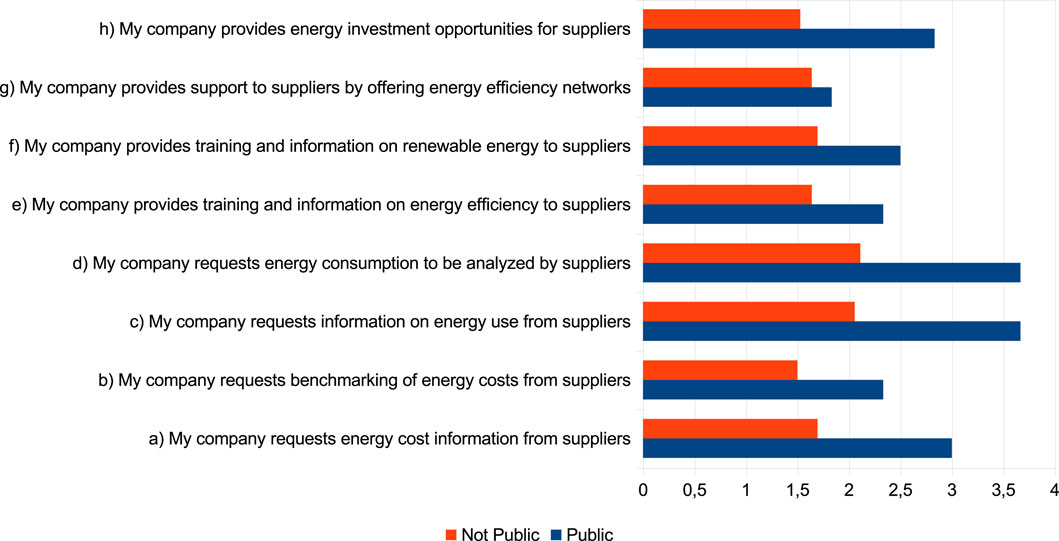
Figure 2. Question: “How well following statements describe your company’s work with suppliers concerning energy efficiency?,” divided into two groups with respect to the served customers, and mean values are shown (not public, n = 36; public, n = 6).
As already mentioned, three other divisions to two groups did not result in any statistically significant different responses. The number of offered products was only potentially different from these three, where a lower amount of products offered (<500 products) was nearly in all subquestion areas (seven) having higher ratings as compared to companies offering more than 500 products. In two other divisions (location of main market and ownership), the average ratings in responses were much closer to each other, and statistical differences were not even near.
5 Drivers of supply chain energy efficiency work
The survey also consisted of a question concerning drivers of energy efficiency in the supply chain (Figure 3). Respondents felt differently from drivers as most often the highest response class (mode class) included 5 or 6 respondents. This is further supported by examining the median values in Figures 3 – as a very strong driver was felt to be “t) Full support from top management” as its median value as 7 and the average was also the highest, being 5.7. This was followed by four items, which had a median value of 6, and these were as follows: “h) Company’s/Corporate group’s environmental profile,” “k) Reduce production costs,” “i) Reduce scope 3 emissions,” and “n) Consumer/customer demands and questions.” The less important and lowest median (3), as well as the mean value (3.2) item, was, in turn, “s) Incentive agreement/third party financing/Energy performance contracting.” This was followed by six drivers having a median value of 4: “o) International competition,” “u) Allocation of energy costs,” “w) Ability to utilize and disseminate individuals’ knowledge of support and production processes,” “v) Internal training,” r) “Pressure from different types of environmental organisations/sectoral organisations,” and “f) Energy management system”.
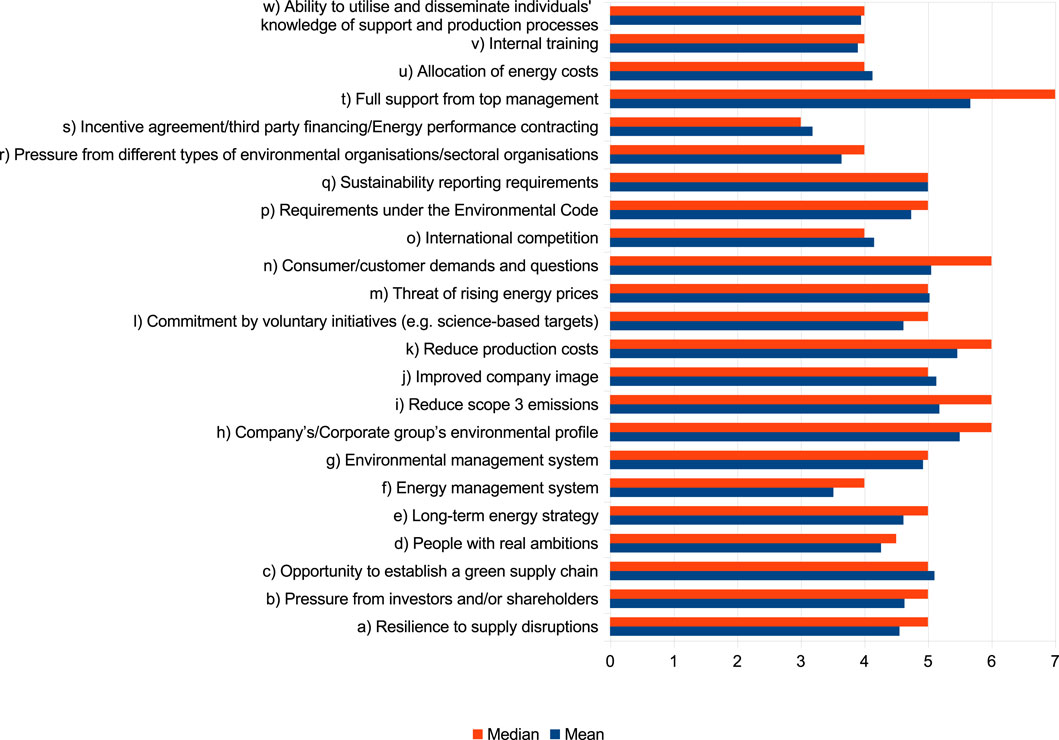
Figure 3. Question: “To what extent do you consider the following factors to be drivers in your work on energy efficiency in the supply chain?,” where the scale is ranging from 1 (not driver at all) to 7 (very strong driver). (n = 38–39).
It could be said that most important drivers of energy efficiency within the supply chain are related to top management, profile (marketing), production costs and aggregate outside of own operation emissions, and customers (sales). Other more wider and less concrete items had lower importance, like international competition and allocation of energy costs. Most important energy efficiency drivers in supply chains in this survey are concrete and provide results in the short to medium term (and are somehow connected to the financial sustainability of companies).
There were numerous statistically significant correlations among the asked items of drivers (see Supplementary Appendix B for the correlation matrix), with all of them being positive (answering, e.g., high in some questions resulted in a high value in the correlated items). Statistical significance varied from 0.05 to 0.001. There were negative correlations as well, but these were typically having a rather low statistically insignificant negative correlation (between −0.1 and −0.2). Interestingly, there were some drivers, which did not have statistically significant correlations with other drivers or probably only one or two. These were as follows: “f) Energy management system,” “i) Reduce scope 3 emissions,” and l) “Commitment by voluntary initiatives (e.g., science-based targets).” From these, three second (“i) Reduce scope 3 emissions”) was rated as a rather important driver by respondents—its lack of correlation with other drivers could indicate that it has gained importance only very recently and remains isolated from other decisions.
Logically, drivers should have a connection to energy efficiency work of supply chains. This was tested with the correlation matrix and statistical significance of the found correlations. As revealed in Figure 4, few correlations exist between drivers and supply chain energy efficiency work. In total, four correlations statistically significant were found. These all are understandable causalities, where, e.g., driver of “l) Commitment by voluntary initiatives (e.g., science-based targets)” increases work with “e) My company provides training and information on energy efficiency to suppliers” or “o) International competition” and “u) Allocation of energy costs” drive work of “a) My company requests energy cost information from suppliers.” Concerning the four drivers having causality, all were rated as having at best average importance among all drivers. The challenge for companies is that highest-ranked drivers do not have a connection to the current supply chain efficiency work.
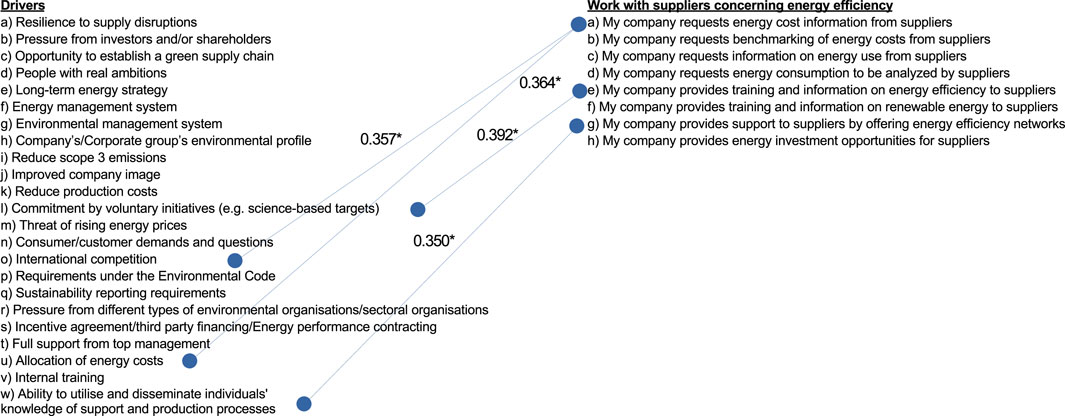
Figure 4. Correlations between drivers and supply chain energy efficiency work. (n = 32; *, p-value sign. 0.05 level).
6 Concluding discussion
Despite numerous changes and challenges of energy price and long-term availability in Europe in recent years (Martin-Valmayor et al., 2023), it is interesting to note that energy efficiency improvement in supply chains is still taking its initial steps among survey respondents. It seems that public sector customers serving companies are more active in this field, and in general, suppliers are asked to provide energy consumption information and analyze it. Among drivers for this change, respondents felt that the most important was the top management support for these changes. This was followed by customer/consumer requests, own climate and emission reduction objectives, and cost reduction. The results of this survey support the literature review findings of Marchi and Zanoni (2017)—in their review, most of the studies regarded energy efficiency as an additional flow to be analyzed (and having related cost implications). In addition, many of the most important drivers are similar with those of the research findings of Centobelli et al. (2018); however, top management support is new and did not exist in their literature research findings. Analysis of the current state and search of improvement paths for energy efficiency was observed in earlier research on supply chain management research (Tan and Khoo, 2005; Ferretti et al., 2007; Gonzales-Garcia et al., 2009).
The novel finding in this research work is that both supply chain-based energy efficiency work and drivers themselves have substantial correlations with each other. However, between these, there exist very few causalities. This comes down to the initial stages of supply chain energy efficiency work, which received rather low response values. Currently found correlations anyway provide some route forward of supporting energy efficiency work through drivers.
Sweden has a leading position on research on energy efficiency. Previous studies, mainly conducted in Sweden, but also internationally, show similar results regarding drivers (Ahmad et al., 2020; Jalo et al., 2021; Johansson and Thollander, 2018). Research on engaging suppliers/working with suppliers has mainly highlighted its importance and, therefore, the lack. This is an important part of the novelty of the paper to highlight how suppliers are involved and in what way. Our survey shows that information is merely requested from manufacturing companies toward suppliers, while dialogue and further development are less at the agenda. Therefore, it is understandable that investment collaboration is not common (overall). However, public sector-serving manufacturers (as a main customer) have much more activity in this regard with suppliers, and it could shed some light on how development activities could be increased further.
Due to increasing pressure from governmental institutions to consider the sustainability, and with that, the energy efficiency efforts in the supply chain and reporting about it, this study gives insights not only to managers on how to approach the topic but also to policymakers. Considering the recent discussions on the implementation of new sustainability directives and omnibus package by the European Commission, the results may support decision-makers and policymakers on how to facilitate energy efficiency in the supply chain.
As a further research in the area, we would like to examine the long-term effects of energy availability in Northern Europe. The increasing use of energy due to the appearance of data centers and a low-emission steel industry, these will have a significant impact on the energy demand and availability in the long term. Examination should be manufacturing-focused, analyzing how they have prepared for this change and what kind of challenges they foresee in the forthcoming years. A case study would be the most suitable approach for this endeavor.
Data availability statement
The raw data supporting the conclusions of this article will be made available by the authors, without undue reservation.
Author contributions
O-PH: validation, data curation, methodology, writing – original draft, investigation, visualization, software, formal analysis, resources, and writing – review and editing. LF: investigation, writing – review and editing, validation, conceptualization, writing – original draft, methodology, project administration, visualization, and data curation. RH: investigation, data curation, writing – review and editing, validation, conceptualization, resources, writing – original draft, project administration, methodology, and supervision. PH: conceptualization, data curation, resources, funding acquisition, supervision, writing – review and editing, project administration, and methodology.
Funding
The author(s) declare that financial support was received for the research and/or publication of this article. Authors of this research manuscript hold gratitude for research grant funding from the Swedish Energy Agency for a research project entitled as “Sustainability Assurance of Supply Chains” (project number: 52744-1).
Conflict of interest
The authors declare that the research was conducted in the absence of any commercial or financial relationships that could be construed as a potential conflict of interest.
Generative AI statement
The author(s) declare that no Generative AI was used in the creation of this manuscript.
Publisher’s note
All claims expressed in this article are solely those of the authors and do not necessarily represent those of their affiliated organizations, or those of the publisher, the editors and the reviewers. Any product that may be evaluated in this article, or claim that may be made by its manufacturer, is not guaranteed or endorsed by the publisher.
Supplementary material
The Supplementary Material for this article can be found online at: https://www.frontiersin.org/articles/10.3389/fenrg.2025.1619417/full#supplementary-material
References
Ahmad, I., Arif, M. S., Cheema, I. I., Thollander, P., and Khan, M. A. (2020). Drivers and barriers for efficient energy management practices in energy-intensive industries: a case-study of iron and steel sector. Sustainability 12 (18), 7703. doi:10.3390/su12187703
Axon, C. J., and Darton, R. C. (2023). Energy Demand Reduction: supply chains and risk analysis. Energy Effic. 16 (84), 84. doi:10.1007/s12053-023-10165-x
Azevedo, S. G., Govindan, K., Carvalho, H., and Cruz-Machado, V. (2013). Ecosilient Index to assess the greenness and resilience of the upstream automotive supply chain. J. Clean. Prod. 56, 131–146. doi:10.1016/j.jclepro.2012.04.011
Beheshtinia, M. A., and Fathi, M. (2023). Energy-efficient and sustainable supply chain in the manufacturing industry. Energy Sci. and Eng. 11, 357–382. doi:10.1002/ese3.1337
Brochardt, M., Wendt, M., Pereira, G. M., and Sellitto, M. A. (2011). Redesign of a component based on ecodesign practices: environmental impact and cost reduction achievements. J. Clean. Prod. 19, 49–57. doi:10.1016/j.jclepro.2010.08.006
Brodt, S., Kramer, K. J., Kendall, A., and Feenstra, G. (2013). Comparing environmental impacts of regional and national-scale food supply chains: a case study of processed tomatoes. Food Policy 42, 106–114. doi:10.1016/j.foodpol.2013.07.004
Brunke, J. C., Johansson, M., and Thollander, P. (2014). Empirical investigation of barriers and drivers to the adoption of energy conservation measures, energy management practices and energy services in the Swedish iron and steel industry. J. Clean. Prod. 84 (1), 509–525. doi:10.1016/j.jclepro.2014.04.078
Butt, A. S., Alghababsheh, M., Sindhwani, R., and Gwalani, H. (2024). Role of supplier engagement to reduce Scope 3 emissions in circular supply chains. Bus. Strategy Environ. 34 (1), 598–611. doi:10.1002/bse.3994
Centobelli, P., Cerchione, R., and Esposito, E. (2018). Environmental sustainability and energy-efficient supply chain management: a review of research trends and proposed guidelines. Energies 11 (2), 275. doi:10.3390/en11020275
Cosimato, S., and Troisi, O. (2015). Green supply chain management: practices and tools for logistics competitiveness and sustainability. The DHL case study. TQM J. 27 (2), 256–276. doi:10.1108/TQM-01-2015-0007
Deng, L., Babbitt, C. W., and Williams, E. D. (2011). Economic-balance hybrid LCA extended with uncertainty analysis: case study of a laptop computer. J. Clean. Prod. 19, 1198–1206. doi:10.1016/j.jclepro.2011.03.004
Ellram, L. M., and Tate, W. L. (2024). Impact pathways: a call for impactful research in supply chain GHG emissions reduction. Int. J. Operations Prod. Manag. 45 (1), 236–245. doi:10.1108/IJOPM-07-2023-0574
Fagundes Alves, M. Y., Marques Vieira, L., and Beal Partyka, R. (2024). Suppliers’ GHG mitigation strategies (Scope 3): the case of a steelmaking company. J. Manuf. Technol. Manag. 35 (2), 383–402. doi:10.1108/JMTM-05-2023-0162
Fahimnia, B., Sarkis, J., and Eshragh, A. (2015). A tradeoff model for green supply chain planning: a leanness-versus-greenness analysis. Omega 54, 173–190. doi:10.1016/j.omega.2015.01.014
Farsan, A., Chang, A., Kerkhof, A., Cserna, B., Yan, C., Rangel Villasana, F., et al. (2018). Value change in the value chain: best practices in scope 3 greenhouse gas management. Sci. Based Targets Initiative. Available online at: https://files.sciencebasedtargets.org/production/legacy/2018/12/SBT_Value_Chain_Report-1.pdf (Accessed May 30, 2025).
Ferretti, I., Zanoni, S., Zavanella, L., and Diana, A. (2007). Greening the aluminium supply chain. Int. J. Prod. Econ. 108, 236–245. doi:10.1016/j.ijpe.2006.12.037
Fobbe, L. (2020). Analysing organisational collaboration practices for sustainability. Sustainability 12 (6), 2466. doi:10.3390/su12062466
Forza, C. (2002). Survey research in operations management: a process-based perspective. Int. J. Operations Prod. Manag. 22 (2), 152–194. doi:10.1108/01443570210414310
Gimenez, C., and Tachizawa, E. M. (2012). Extending sustainability to suppliers: a systematic literature review. Supply Chain Manag. 17 (5), 531–543. doi:10.1108/13598541211258591
Gonzales-Garcia, S., Berg, S., Feijoo, G., and Moreira, M. T. (2009). Comparative environmental assessment of wood transport models: a case study of a Swedish pulp mill. Sci. Total Environ. 407 (11), 3530–3539. doi:10.1016/j.scitotenv.2009.02.022
Hasan, A. S. M. M., Tuhin, R. A., Ullah, M., Sakib, T. H., Thollander, P., and Trianni, A. (2021). A comprehensive investigation of energy management practices within energy intensive industries in Bangladesh. Energy 232, 120932. doi:10.1016/j.energy.2021.120932
Jalo, N., Johansson, I., Andrei, M., Nehler, T., and Thollander, P. (2021). Barriers to and drivers of energy management in Swedish SMEs. Energies 14 (21), 6925. doi:10.3390/en14216925
Jazairy, A., and von Haartman, R. (2020). Measuring the gaps between shippers and logistics service providers on green logistics throughout the logistics purchasing process. Int. J. Phys. Distribution and Logist. Manag. 51 (1), 25–47. doi:10.1108/IJPDLM-08-2019-0237
Johansson, M. T., and Thollander, P. (2018). “A review of barriers to and driving forces for improved energy efficiency in Swedish industry– Recommendations for successful in-house energy management”, 82. Elsevier Ltd, 618–628. doi:10.1016/j.rser.2017.09.052Renew. Sustain. Energy Rev.
Lawrence, A., Nehler, T., Andersson, E., Karlsson, M., and Thollander, P. (2019). Drivers, barriers and success factors for energy management in the Swedish pulp and paper industry. J. Clean. Prod. 223, 67–82. doi:10.1016/j.jclepro.2019.03.143
Lee, K.-H., and Cheong, I.-M. (2011). Measuring a carbon footprint and environmental practice: the case of Hyundai Motors Co. (HMC). Industrial Manag. and Data Syst. 111 (6), 961–978. doi:10.1108/02635571111144991
Lim, J. S., Manan, Z. A., Alwi, S. R. W., and Hashim, H. (2013). A multi-period model for optimal planning of an integrated, resource-efficient rice mill. Comput. Chem. Eng. 52, 77–89. doi:10.1016/j.compchemeng.2012.12.007
Lu, D., Overcash, M., and Realff, M. J. (2011). A mathematical programming tool for LCI-based product design and case study for a carpet product. J. Clean. Prod. 19, 1347–1355. doi:10.1016/j.jclepro.2011.04.004
Marchi, B., and Zanoni, S. (2017). Supply chain management for improved energy efficiency: review and opportunities. Energies 10 (10), 1618. doi:10.3390/en10101618
Marchi, B., Zanoni, S., Ferretti, I., and Zavanella, L. E. (2018). Stimulating investments in energy efficiency through supply chain integration. Energies 11 (4), 858. doi:10.3390/en11040858
Martin-Valmayor, M. A., Gil-Alana, L., and Infante, J. (2023). Energy prices in Europe. Evidence of persistence across markets. Resour. Policy 82, 103546. doi:10.1016/j.resourpol.2023.103546
Meqdadi, O., Johnsen, T. E., Johnsen, R. E., and Salmi, A. (2020). Monitoring and mentoring strategies for diffusing sustainability in supply networks. Supply Chain Manag. 25 (6), 729–746. doi:10.1108/SCM-08-2019-0288
Milford, R. L., Allwood, J. M., and Cullen, J. M. (2011). Assessing the potential of yield improvements, through process scrap reduction, for energy and CO2 abatement in the steel and aluminium sectors. Resour. Conservation Recycl. 55, 1185–1195. doi:10.1016/j.resconrec.2011.05.021
Orcao, A. I. E., and Pérez, D. R. (2014). Global production chains in the fast fashion sector, transports and logistics: the case of the Spanish retailer Inditex. Investig. Geográficas 2014 (85), 115–127. doi:10.14350/rig.40002
Rizet, C., Browne, M., Cornelis, E., and Leonardi, J. (2012). Assessing carbon footprint and energy efficiency in competing supply chains: review – Case studies and benchmarking. Transp. Res. Part D Transp. Environ. 17 (4), 293–300. doi:10.1016/j.trd.2012.01.002
Rohdin, P., Thollander, P., and Solding, P. (2007). Barriers to and drivers for energy efficiency in the Swedish foundry industry. Energy Policy 35 (1), 672–677. doi:10.1016/j.enpol.2006.01.010
Seuring, S., and Müller, M. (2008). From a literature review to a conceptual framework for sustainable supply chain management. J. Clean. Prod. 16 (15), 1699–1710. doi:10.1016/j.jclepro.2008.04.020
Sharma, A., Borah, S. B., Haque, T., and Adhikary, A. (2024). Engaging customers and suppliers for environmental sustainability: investigating the drivers and the effects on firm performance. J. Acad. Mark. Sci. 53, 341–366. doi:10.1007/s11747-023-00995-7
Sveriges Riksdag (2014). Lag (2014:266) om energikartläggning i stora företag (in Swedish, title freely translated to English: “Law concerning energy mapping in large companies”). Available online at: https://www.riksdagen.se/sv/dokument-och-lagar/dokument/svensk-forfattningssamling/lag-2014266-om-energikartlaggning-i-stora_sfs-2014-266/Retrieved April 15, 2025).
Tan, R. B. H., and Khoo, H. H. (2005). An LCA study of a primary aluminum supply chain. J. Clean. Prod. 13, 607–618. doi:10.1016/j.jclepro.2003.12.022
Teller, C., Kotzab, H., Grant, D. B., and Holweg, C. (2016). The importance of key supplier relationship management in supply chains. Int. J. Retail Distribution Manag. 44 (2), 109–123. doi:10.1108/IJRDM-05-2015-0072
Urciuoli, L., Mohanty, S., Hintsa, J., and Boekseijn, E. G. (2014). The resilience of energy supply chains: a multiple case study approach on oil and gas supply chains to Europe. Supply Chain Manag. Int. J. 19 (1), 46–63. doi:10.1108/SCM-09-2012-0307
Keywords: energy efficiency, supply chain, manufacturing, Sweden, survey
Citation: Hilmola O-P, Fobbe L, Haartman Rv and Hilletofth P (2025) Energy efficiency of manufacturing supply chains: Swedish survey findings. Front. Energy Res. 13:1619417. doi: 10.3389/fenrg.2025.1619417
Received: 28 April 2025; Accepted: 13 June 2025;
Published: 03 July 2025.
Edited by:
A. S. M. Monjurul Hasan, University of Technology Sydney, AustraliaReviewed by:
Towfique Rahman, Griffith University, AustraliaFrancielle Fenerich, Universidade Estadual de Maringá, Brazil
Helena Fidlerova, Slovak University of Technology in Bratislava, Slovakia
Copyright © 2025 Hilmola, Fobbe, Haartman and Hilletofth. This is an open-access article distributed under the terms of the Creative Commons Attribution License (CC BY). The use, distribution or reproduction in other forums is permitted, provided the original author(s) and the copyright owner(s) are credited and that the original publication in this journal is cited, in accordance with accepted academic practice. No use, distribution or reproduction is permitted which does not comply with these terms.
*Correspondence: Olli-Pekka Hilmola, b2xsaS1wZWtrYS5oaWxtb2xhQGhpZy5zZQ==