 Jesse C. Duroha1
 Kenny Malmquist2Nicolas Vad1Patrick Dilsaver2Clarice Malotte2Heather Matthews2Diana Ordonez2Niklas Lariviere1Matt Harrison2
 Anthony J. Marchese1*
- 1College of Engineering, University of Rhode Island, Kingston, RI, United States
- 2SLR Consulting, Fort Collins, CO, United States
In response to the growing global interest in hydrogen as an energy carrier, this study provides the first attempt to develop a baseline inventory of U.S. hydrogen emissions from production, distribution and storage. The scope of this study was limited to pure hydrogen emissions and excludes emissions from low purity hydrogen streams and carriers. A detailed literature search was conducted, utilizing various greenhouse gas emissions inventory protocol principles and guidelines, to consolidate a list of activity data and emission factors. The best available activity data and emission factors were then selected, via a Multi-Criteria-Based Decision Making Method named Technique for Order Preference by Similarity to Ideal Solution, or modelled using best-engineering estimates. The study estimated total U.S. hydrogen emissions of 0.063 MMTA with emission bounds ranging from 0.02 to 0.11 MMTA. Given the total estimated H2 production capacity of 7.97 MMTA, the study estimates a total U.S. hydrogen emission rate for production, distribution and storage of 0.79% (0.26%–1.32%). To reduce the uncertainty in the estimated total hydrogen emissions, future work should be conducted to measure facility-level hydrogen emission factors across multiple sectors. The inventory framework developed in this study can serve as a living document that can be updated and enhanced as more empirical data is obtained. This study also provides detailed insights regarding key emission or leakage sources and causes from each supply chain stage. The insights and conclusions from this study can provide direction for hydrogen production companies and safety professionals as they develop hydrogen emission mitigation measures, and controls.
1 Introduction
Hydrogen (H2) is gaining interest as a promising energy carrier in current and future efforts to decarbonize the global energy portfolio and meet greenhouse gas emissions targets (International Energy Agency, 2021). H2 is considered to be a clean alternative fuel since it contains no carbon atoms and does not absorb infrared radiation in the atmosphere (Derwent, 2018; Roueff et al., 2019; Hauglustaine et al., 2022). As a result, there is a growing global and national interest in the utilization of H2 to store electricity produced by intermittent renewable energy sources, and as a fuel for electricity production, transportation, and building heating (Field and Derwent, 2021; International Energy Agency, 2021; National Renewable Energy Laboratory, 2022).
The International Energy Agency (2021) reported that, since 2019, over 16 countries have published national hydrogen strategies aimed at defining the role of H2 within their future energy economy. In 2020, the U.S. Department of Energy’s Office (DOE) of Fossil Energy’s released a strategic plan to accelerate research, development, and deployment of H2 technologies in the U.S. This plan involves significant research initiatives across all segments of the H2 supply chain (US DOE, 2020). In 2023, the U.S. also announced plans to fund seven regional clean H2 hubs across the country, capable of producing over three million metric tons of clean H2 annually, aiming to significantly decarbonize various end-use sectors, and create numerous job opportunities (The White House, 2023). These projects aim to meaningfully contribute to the United Nations’ Sustainable Development Goal 7 “to ensure access to affordable, reliable, sustainable and modern energy for all” (United Nations, 2025). Consequently, H2 is projected to play key role in supporting a future clean energy economy, however an obstacle to its future widespread use revolves around its potential negative impact as an indirect greenhouse gas (Ocko and Hamburg, 2022; Esquivel-Elizondo et al., 2023).
H2 acts as an indirect greenhouse gas through its involvement in chemical reactions that increase the lifespan or concentration of other potent greenhouse gases, including methane (Derwent et al., 2006; Derwent, 2018). The oxidation of H2 in the troposphere results in the depletion of hydroxyl (OH) radicals that act as a sink for methane (Derwent, 2018; Paulot et al., 2021). This consequently increases the atmospheric lifespan of methane. H2 oxidation reactions also ultimately lead to the formation and increase of other greenhouse gases, specifically tropospheric ozone, and stratospheric water vapor (Derwent, 2018; Derwent et al., 2020; Field and Derwent, 2021; Paulot et al., 2021). The indirect greenhouse gas effect of H2 has led to the emergence of research efforts to quantify current and potential H2 emissions across the supply chain.
The Inventory of U.S. Greenhouse Gas Emissions and Sinks 1990–2022 (EPA, 2024), published by the United States Environmental Protection Agency, has served as the foundational document detailing emissions inventories for a comprehensive list of greenhouse gases nationally. Since its initial release in the early 1990s, multiple studies have been conducted to update its findings with more precise empirical data and results (Lamb et al., 2015; Zimmerle et al., 2015; Zimmerle et al., 2019). EPA (2024) now operates as a living document updated annually, regularly incorporating new research findings. There is growing interest in emulating this inventory approach for H2 emissions however due to limitations in sensor technology H2 emissions from infrastructure across the supply chain (i.e., production, distribution and storage, end-use) is difficult to empirically quantify. Current commercially available sensor technologies are suitable for measuring higher H2 concentrations to ensure safe operating conditions but lack the sensitivity to quantify overall site-level emissions (Najjar, 2019; Ocko and Hamburg, 2022; Esquivel-Elizondo et al., 2023). While research into sensors capable of detecting atmospheric-concentrations of H2 has increased significantly in recent years, the focus remains primarily in safety and process monitoring applications, making many unsuitable for site-level emission rate quantification (Chauhan and Bhattacharya, 2019; Ramaiyan et al., 2023; Liu et al., 2024; Swager et al., 2024; Benitto et al., 2025). To date only one study has empirically measured H2 emissions at an industrial park in the European union with a relatively high degree of uncertainty (Westra et al., 2024), highlighting the need for broader measurement efforts. Larger scope H2 measurement campaign efforts will likely be underway soon with the recent announcement of a new sensor capable of filling this research gap (Momeni et al., 2025). However, in the current absence of empirical measurement data, emerging H2 emissions research has mainly focused on identifying emission sources, and developing emission factor estimates via expert opinions, calculations via proxies, laboratory experiments, and modelling (Cooper et al., 2022; Fan et al., 2022; Frazer-Nash Consultancy, 2022; Esquivel-Elizondo et al., 2023).
Emerging H2 emissions studies have either taken a global approach toward H2 emissions research (Cooper et al., 2022; Fan et al., 2022; Esquivel-Elizondo et al., 2023) or have focused on specific areas in Europe (Frazer-Nash Consultancy, 2022). The primary focus of these studies has been the production, distribution and storage segment with end-use being acknowledged as the least understood segment with little to no data available regarding activity data or emission factors (Cooper et al., 2022; Fan et al., 2022). Cooper et al. (2022) defined specific global H2 supply chain cases and estimated or modelled emission factors mainly utilizing calculations via proxies and modelling. Although, Cooper et al. (2022) proposed emission factors for specific sources within the production, distribution and storage segment, their estimation efforts did not extend to some H2 emission sources within these segments that are prominent within the U.S. supply chain (e.g., Underground Hydrogen Storage [UHS], Fuel Cell Electric Vehicles [FCEV] Stations). Frazer-Nash Consultancy (2022) focused on the United Kingdom supply chain and proposed a wide range of emission factor estimates for various sources. Esquivel-Elizondo et al. (2023) and Fan et al. (2022) build on this foundation and provide an overview of the available knowledge on emission factor estimates across global value chains. Arrigoni and Bravo Diaz (2022) and Pranda and de Reals (2023) provided emission factor estimates across the U.S. supply chain based on expert opinion. These studies have provided a foundation for H2 emissions research; however, they primarily focus on developing and presenting emission factor estimates and do not collate or apply the relevant activity data needed to estimate emissions. Thus, no study to date has attempted to present an initial comprehensive estimate of H2 emissions across the U.S. supply chain.
One key distinction between the current research on H2 emissions and the previous work on a comparable gas within EPA (2024), for instance methane, is the lack of a detailed inventory of emission sources (i.e., activity data) and emission factors. A detailed methane inventory existed as part of earlier versions of EPA (2024) before the methane emissions measurement campaigns (Marchese et al., 2015; Mitchell et al., 2015). While the methane emissions contained in earlier versions of EPA (2024) were incomplete and ultimately underreported, the inventory still represented a powerful tool to inform the design, implementation, and dissemination of the methane emissions measurement campaigns.
Since no comparable H2 emissions inventory currently exists, the goal of this study is to review the hydrogen emissions literature in order to develop a baseline H2 emissions inventory for the U.S. H2 supply chain infrastructure. Majority of the H2 emissions literature has focused on the production through to the distribution and storage segment and highlights the lack of current knowledge regarding activity data, emission sources, and emission factors associated with H2 end-use (Arrigoni and Bravo Diaz, 2022; Cooper et al., 2022; Fan et al., 2022). Thus, to provide an initial baseline H2 emissions inventory this study limits its scope to the production, distribution and storage segment. A detailed literature review and expert interviews were conducted to compile the best available emission factors, and activity data for a wide range of U.S. H2 supply chain emission sources within these segments. Then emissions estimates were calculated for those sources. In cases where information was lacking, best-engineering estimates for emission factors and activity data were developed or modelled. This initial inventory framework can inform the design and implementation of future H2 measurement campaigns and provides a framework that can be updated and enhanced as more precise empirical data is obtained. This study is in alignment with the United Nations’ Sustainable Development Goal 7 (United Nations, 2025).
2 Methodology
The primary goal of this project was to develop a baseline H2 emissions inventory based on current U.S. H2 supply chain infrastructure for the production, distribution and storage segments. Figure 1 presents the stepwise methodology involved in developing the inventory for this study. The steps in Figure 1 are based on various greenhouse gas emissions inventory protocol principles and guidelines (EPA, 2004; GPC, 2014; IPCC, 2024). The scope of this study is defined (Section 2.1). The data collection and inventory process is explained (Section 2.2). An overview of the method for selecting or estimating emission factors is provided (Section 2.3, 2.4). In Section 3, the results of each supply chain stage is provided and more detail regarding emission factor selection and estimation process, including key in emission sources are provided. The overall results of the study (activity data, emission factors, and emissions estimate) is provided in Table 11. Finally, Section 4 details discussions, overall contribution, limitations and future work of this study.
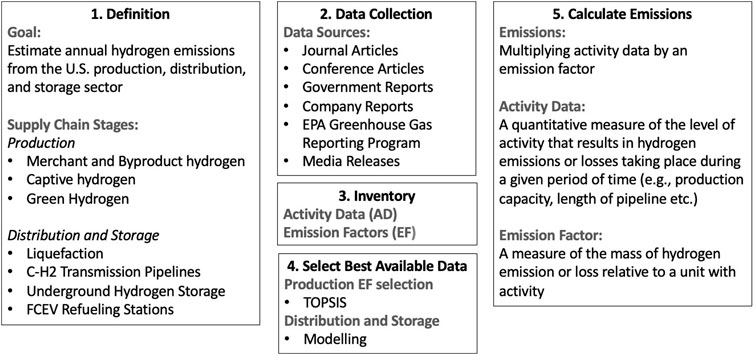
Figure 1. Stepwise methodology of the inventory process for this study.
2.1 Scope of the study
Hydrogen is an important chemical commodity in various industries including oil refining, methanol production, and ammonia production (Joseck et al., 2016). The H2 supply chain can be divided into three basic segments: Production, distribution and storage, end-use. The scope of this study was limited to pure H2 emissions and excludes emissions from low purity H2 streams (natural gas or C-H2 blends and low purity H2 byproducts) and H2 storage or carrier materials (ammonia and alkali metal hydrides). This study also primarily focused on emissions from the production, distribution and storage due to the lack of H2 end-use data availability in the U.S. Table 1 shows the supply chain stages and segments included within the scope of this study.
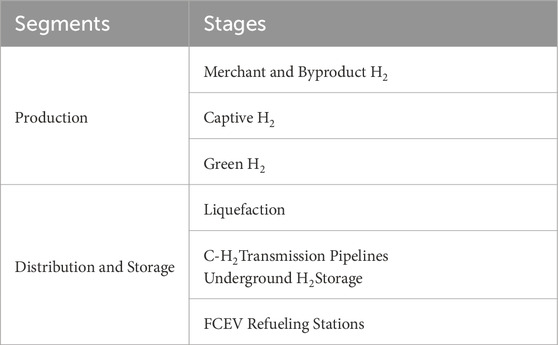
Table 1. Supply chain segments and stages within the scope of this study.
The Production segment deals with H2 production which occurs primarily through steam methane reforming (SMR). SMR production reportedly represents about 95% of H2 production in the U.S (National Renewable Energy Laboratory, 2022). The SMR process involves methane reacting with high-temperature steam in the presence of a catalyst to produce hydrogen, carbon monoxide and carbon dioxide. Then carbon monoxide is reacted with steam in the presence of a catalyst (water-gas shift reaction) to form carbon dioxide and hydrogen. In some production facilities carbon capture, utilization and storage (CCUS) is utilized to reduce carbon dioxide emissions (National Renewable Energy Laboratory, 2022). When CCUS is not used, the H2 produced from natural gas or methane is termed “Gray” Hydrogen. When CCUS is used, the H2 produced is termed “Blue” Hydrogen.
SMR production can also be classified as Merchant or Captive Hydrogen based on end-use. “Merchant” Hydrogen refers to H2 produced on-site then sold to customers via pipeline, tank, or truck delivery. “Captive” Hydrogen refers to H2 produced by the consumer for internal use. As a result, merchant hydrogen is expected to have longer average transporting distances, while the transport segment for captive hydrogen is negligible in comparison. “By-product” Hydrogen refers to H2 that is produced from by-product process streams and can either be sold to customers as Merchant H2, or used internally as Captive H2 (Connelly et al., 2019). Since Captive hydrogen is necessarily produced for internal use, it is included in the scope of this study as a separate supply chain stage from Merchant and Byproduct hydrogen (Table 1). Green Hydrogen typically refers to hydrogen produced via electrolysis powered by renewable energy sources such as wind and solar energy. This method of producing hydrogen is still emerging and represents the vast minority of hydrogen production worldwide (National Renewable Energy Laboratory, 2022).
The Distribution and Storage segment involves the modes through with H2 is transported from production facilities to customers. H2 is either transported in gaseous form as C-H2 or liquified and transported as L-H2. Current modes of C-H2 transportation in the U.S. include through transmission pipelines, and tanker trucks or trailers (Arrigoni and Bravo Diaz, 2022). UHS facilities connected to the network of H2 transmission pipelines are used to store the produced H2 and supplement delivery to customers as demand fluctuates (Zhu et al., 2023). Some of the produced H2 is also liquefied and stored or transported, via tanker trucks, as L-H2 to various end-uses (Arrigoni and Bravo Diaz, 2022). Hydrogen is also stored on-site and dispensed through FCEV refueling stations (US DOE, 2023).
2.2 Data collection and inventory process
A detailed literature search and review process was conducted to consolidate a list of emission factors and activity data associated with the H2 supply chain stages within the scope of this study. This literature search and review process took place from February 2023 until October 2024. During the literature search and review process, published peer reviewed studies, conference articles, technical reports from governmental and non-governmental agencies, the EPA Greenhouse Gas Reporting Program (EPA GHGRP, 2023), and media or press releases were reviewed in detail. Data was also acquired from independent energy research and business intelligence groups and from expert interviews with H2 researchers and professionals. The overall goal of this process was to understand the H2 supply chain, and compile information regarding available emission factors and activity data. Each literature or data source was thoroughly screened, and relevant information was extracted and manually coded in a Microsoft Excel spreadsheet Inventory codebook (Supplementary Spreadsheet). Table 2 provides brief descriptions of key categories of information, that were retrieved from the literature, and stored in the inventory codebook. Within the Inventory Codebook (see Supplementary Spreadsheet) all the relevant information found pertaining to activity data was stored in Supplementary Table SA1, while all the relevant data pertaining to emission factors was stored in the Supplementary Table SA2. These tabs represent a compendium of U.S. H2 activity data and emission factors. This data collection and inventory process resulted in 813 activity data entries and 27 emission factor entries.
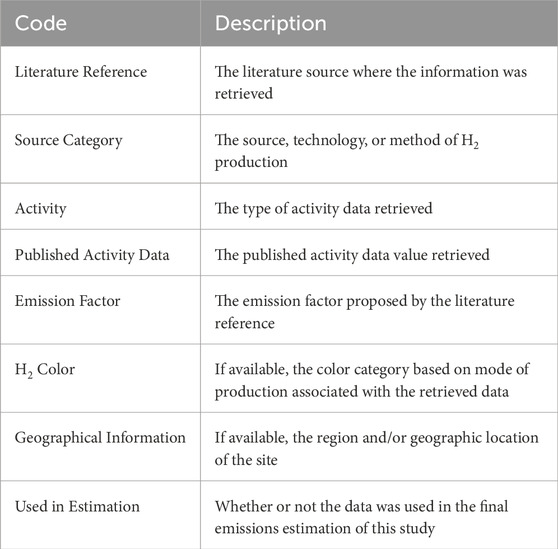
Table 2. Key information included in inventory codebook in supplementary spreadsheet.
2.3 Production emission factor selection approach
For the supply chain stages in the Production segment multiple sources were found presenting differing emission factors, thus for this segment, a Multi-Criteria-Based Decision Making Method (MCDM) method named Technique for Order Preference by Similarity to Ideal Solution (TOPSIS) was utilized as the main tool for selecting the best available emission factors.
MCDM methods allow the unbiased selection of an alternative when conflicting options are presented. TOPSIS, is one of the most powerful decision-making techniques that utilizes logical data about different alternatives to select the best available option (Jozi and Majd, 2014). It was developed by Hwang and Yoon (1981) and has been used in different areas including technology selection (Halicka, 2020), material selection (Kumar et al., 2014), investment selections (Zeng and Xiao, 2016), among other areas (Shyjith et al., 2008; Amudha et al., 2021). The steps involved in utilizing the TOPSIS method in this study are detailed below.
TOPSIS ranks the closeness or distance of various alternatives from an ideal solution based on the relative importance of key attributes and criteria (Kumar et al., 2014). The first step in utilizing the TOPSIS methodology was identifying the attributes and criteria that were most important for emission factor selection. Table 3 shows the TOPSIS emission factor selection parameters developed by the authors. First important attributes and criteria for emission factor selection were chosen based on recommendations from research literature (Cooper et al., 2022; EPA, 2024) as year of study (or recency), measurement approach, and source reliability. Weights (
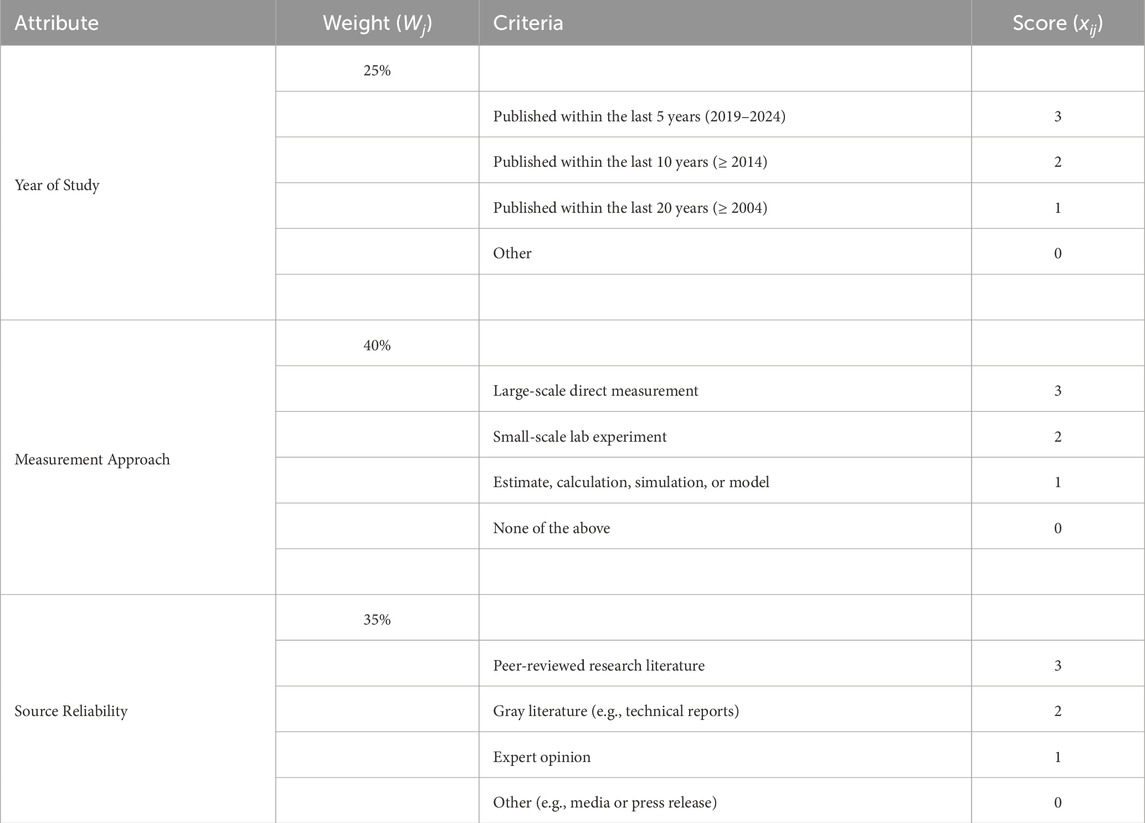
Table 3. TOPSIS emission factor selection parameters.
When differing emission factor alternatives were obtained from different sources, the TOPSIS method consists of first normalizing the different alternatives in accordance with Equation 1:
where
Subsequently, the ideal best (Si+) and ideal worst (Si−) value would be identified to then calculate the distance from the Si+ and Si−. Finally, the performance each alternative is calculated following Equation 5:
2.4 Distribution and storage emission factor estimation approach
A literature review was conducted to consolidate a list of emission factors for the H2 distribution and storage segment (Supplementary Table SA2). When no emission factors were found in the literature, our approach was to model H2 emissions using estimate emission factors. Specific details regarding the emission factor estimation processes for each supply chain stage is presented in Section 3.2. For the liquefaction stage, an emission factor estimate was retrieved from previous L- H2 literature reviews (Section 3.2.1). For C-H2 transmission pipelines, comparable natural gas systems and emission factors and the differences in physical properties between methane and hydrogen was used to estimate relative loss and leak rates (Section 3.2.2). For UHS, an emission factor was modelled based on UHS operating characteristics and features (Section 3.2.3). And finally for FCEV Refueling Stations, an emission factor estimate was retrieved from an FCEV Refueling Station emissions study (Section 3.2.4).
2.5 Calculating emissions
Emissions were calculated for each supply chain stage in this study using Equations 6, 7 below:
where
The overall emission rate can be calculated by dividing emissions
3 Results
3.1 Production
3.1.1 Activity data
Through the literature search process, a detailed list of hydrogen production activity data was consolidated and stored in Supplementary Table SA1. There were 104 Merchant and Byproduct (MB) sites identified with production capacities ranging from 1 MTD to 557 MTD (Supplementary Table SA1, Index 1–1.111). Most of the sites found (97%) were Merchant producers and utilized SMR. The remaining (3%) of sites produced hydrogen through Byproduct process streams. Most of the sites were gray hydrogen producers, however two blue hydrogen production sites were identified. The total production capacity for MB sites was 14918.7 MTD, which is approximately 5.44 MMTA. Figure 2 shows the production capacity distribution of MB sites.
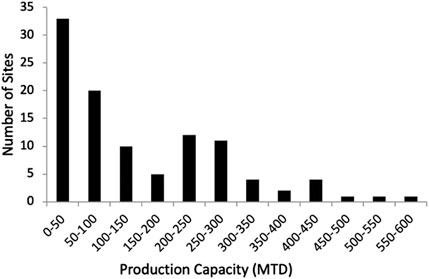
Figure 2. Distribution of production capacity in metric tons per day (MTD) for the operational merchant and byproduct hydrogen sites (n = 104) inventoried in the supplementary spreadsheet.
This study also found 46 Captive (C) hydrogen sites with production capacities ranging from 4.7 MTD to 787.7 MTD (Supplementary Table SA1, Index 14–14.46). All identified sites were refineries that produce hydrogen and utilize it on-site for various chemical processes. The total production capacity for C sites was 6818.97 MTD, which is approximately 2.49 MMTA. Figure 3 shows the production capacity distribution of C sites.
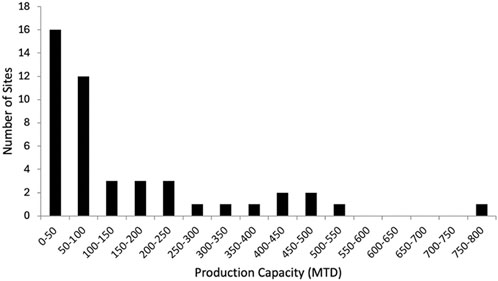
Figure 3. Distribution of production capacity in metric tons per day (MTD) for the operational captive hydrogen sites (n = 46) inventoried in the supplementary spreadsheet.
This study found 38 Green Hydrogen (G) sites with production capacities ranging from 0.5 MTD to 15 MTD (Supplementary Table SA1, Index 10–10.120). The three primary electrolyzer technologies are alkaline electrolysis (ALK), proton exchange membrane (PEM), and solid oxide electrolysis (SOEC) cells (National Renewable Energy Laboratory, 2022). In situations where the production capacity was unclear, the electrolyzer capacity was used to estimate production capacity through the following conversion factors in Equations 8–10 recommended by IEA (2023). When the electrolyzer technology was unclear it was assumed to be PEM, since the majority of electrolyzers in the U.S. are PEM (Arjona, 2023). Figure 4 shows the production capacity distribution of G sites. The distribution of green hydrogen sites shows that green hydrogen production is still new and emerging in the U.S., majority of sites found (76%) had a relatively small production capacity (2 MTD or less).
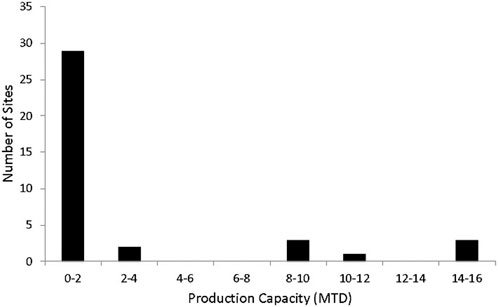
Figure 4. Distribution of production capacity in metric tons per day (MTD) for the operational green hydrogen sites (n =38) inventoried in the supplementary spreadsheet.
3.1.2 Emission factors selection
3.1.2.1 Steam methane reforming
SMR is the representative hydrogen production process for the Merchant and Byproduct, and Captive hydrogen stages. Emission sources associated with SMR production primarily include leakage through pipework and equipment purging (Esquivel-Elizondo et al., 2023). Hydrogen is typically emitted as part of the start-up and shutdown operational procedures associated with SMR, however in some plants this hydrogen is flared rather than vented (Arrigoni and Bravo Diaz, 2022). Hydrogen is also emitted from equipment purging during maintenance, during fault conditions, or to remove impurities during post-processing (Esquivel-Elizondo et al., 2023). In blue hydrogen production there can also be an additional purging during post-processing to remove residual H2 in the stream (Frazer-Nash Consultancy, 2022; Esquivel-Elizondo et al., 2023).
Through the literature search process, a list of studies that presented emission factors for the SMR production process were compiled (Table 4). Xia et al. (2019) was the only study found that performed a small scale SMR lab experiment to estimate hydrogen leakage. In their experiment they use the nitrogen leakage detected via an online gas chromatograph to estimate the amount of hydrogen leaked. They estimated hydrogen leakage in their experiment was less than 1% of the total hydrogen flux. Other studies proposed emission factors through modelling approaches. In their emissions rate model for blue hydrogen supply chain cases Cooper et al. (2022) utilized an emission rate of 0.55% (0.1%–1.0%) of hydrogen throughput. Arrigoni and Bravo Diaz (2022) also proposed that hydrogen losses from SMR are very limited and present a loss rate as low as 0.0001%. Other proposed emission factors for SMR from the literature were 1%–1.5% loss rate Fan et al. (2022) and 0%–0.5% loss rate (Frazer-Nash Consultancy, 2022). The TOPSIS methodology was applied to these emission factors (Table 4) and the emission factor presented in Xia et al. (2019) and Arrigoni and Bravo Diaz (2022) were found to have the highest and second highest performance (
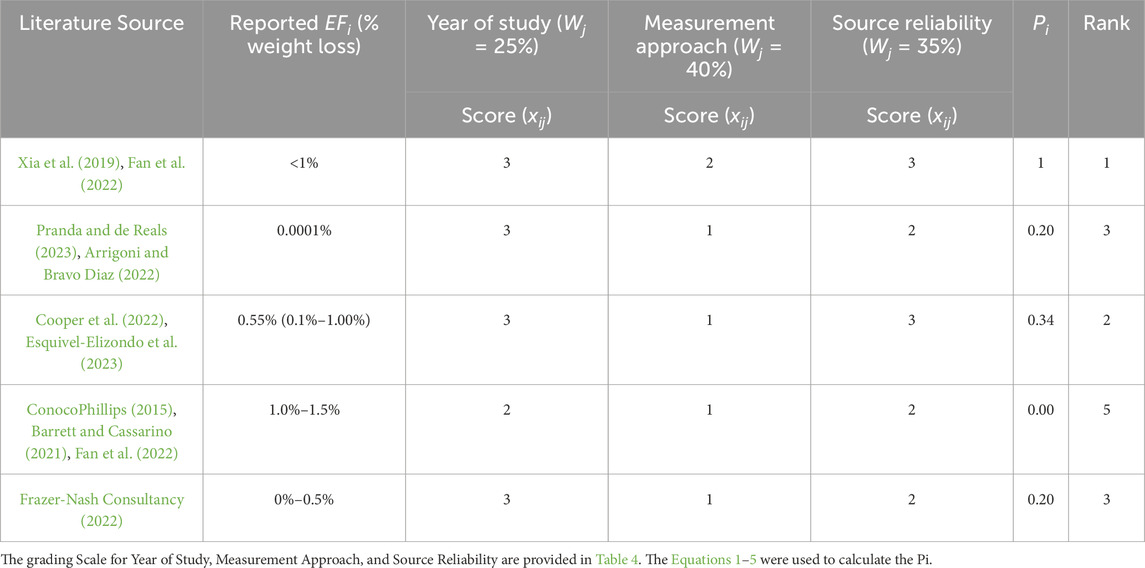
Table 4. Comparative table ranking steam methane reforming emission factors utilizing TOPSIS methodology.
3.1.2.2 Green hydrogen
Green Hydrogen production primarily occurs via electrolysis in the U.S. (National Renewable Energy Laboratory, 2022). Frazer-Nash Consultancy (2022) presents the four categories for potential leakage during electrolysis as leakage through casing and pipework, venting during start-up and shutdown, contamination of the vented oxygen (hydrogen crossover), and operational purging to remove impurities. Operational purging is proposed as a main source of leakage, while leakage through casing and pipework is presented as negligible (Frazer-Nash Consultancy, 2022). Other prominent leakage sources include processes such as dryers’ regeneration, and hydrogen and oxygen crossover (Arrigoni and Bravo Diaz, 2022), however Frazer-Nash Consultancy (2022) proposes incorporating technology to recombine the hydrogen purged and vented during crossover as a means of mitigating emissions.
Through the literature search process, a list of studies that presented emission factors for the green hydrogen production via electrolysis were compiled (Table 5). Multiple studies (Fan et al. (2022); Esquivel-Elizondo et al., 2023) ascribe a H2 loss rate of 2%–4% of the produced hydrogen to the electrolysis process. This emission factor is based on electrolyzer system efficiency testing results by NREL that present H2 dryer loss rates during electrolysis being up to 4% of the produced hydrogen (Harrison and Peters, 2013). Fan et al. (2022) utilized a similar emission rate of 2.05% (0.1%–4.0%) of hydrogen throughput, in their emission rate model for their green hydrogen supply chain case. Other green hydrogen emission factors in the literature include Frazer-Nash Consultancy (2022) proposing a loss rate with a lower limit (LL) of 0.24%–3.32%, and an upper limit (UL) of 0.52%–9.2% of produced hydrogen in their emissions model. Arrigoni and Bravo Diaz (2022) presents a loss rate of 0.2% of produced hydrogen associated with electrolysis. The TOPSIS methodology was applied to these emission factors (Table 5) and the emission factor presented in Harrison and Peters (2013) and Fan et al. (2022) had the highest performance (
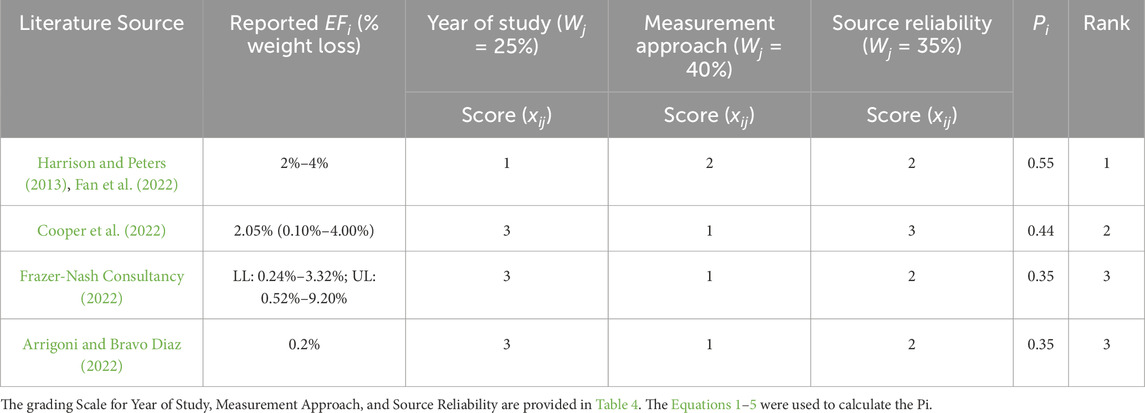
Table 5. Comparative table ranking green hydrogen emission factors utilizing TOPSIS methodology.
3.2 Distribution and storage
3.2.1 Liquefaction
3.2.1.1 Activity data
Hydrogen is typically liquified when it is cooled down to a temperature below 20 K at 101.325 kPa. Liquefied hydrogen (L-H2) has a higher volumetric density compared to compressed H2 gas (C-H2) and therefore provides a more cost-effective means of storing and transporting large quantities of H2 over extended distances (Valenti, 2016; Cardella et al., 2017; Yin and Ju, 2020). The U.S. has the largest H2 liquefaction capacity in the world, with over 15 H2 liquefaction plants, and a collective liquefaction capacity of at least 326 MTD (Qiu et al., 2021). L-H2 is typically stored in cryogenic tanks and transported via tanker trucks/trailers to various end-uses (Arrigoni and Bravo Diaz, 2022). Current end-uses that are supplied with L-H2 in the U.S. include H2 refueling stations, FCEV, stationary fuel cell power stations, and applications in aviation such as fuel rocket engines (Cardella et al., 2017; Qiu et al., 2021; Chen et al., 2022).
3.2.1.2 Emissions estimation
Emission sources associated with L-H2 conversion include leakage during start-up and maintenance, leaks from equipment (fugitive emissions, venting, purging, and boil-off), emissions from H2 engine slip (incomplete combustion of H2), and leaks during transfer operations such as truck loading and unloading (Arrigoni and Bravo Diaz, 2022; Cooper et al., 2022; Esquivel-Elizondo et al., 2023; Pranda and de Reals, 2023).
Similar to other H2 segments, the available emission factors for L-H2 production are based on estimates, or models rather than empirical data (Cooper et al., 2022; Ocko and Hamburg, 2022; Esquivel-Elizondo et al., 2023). After a detailed literature search, Pranda and de Reals, 2023 were the only primary source that proposed an emission factor for U.S. L-H2 production and is thus cited in most of the recent literature (Arrigoni and Bravo Diaz, 2022; Esquivel-Elizondo et al., 2023; Pranda and de Reals, 2023 from Air Liquide presented estimates for losses, mainly from the liquefaction process and boil-off during transfer operations, ranging from 10%–20% of the delivered L-H2 (Arrigoni and Bravo Diaz, 2022). Applying this emission factor to the U.S. L-H2 production capacity (326 MTA; Qiu et al., 2021) we estimate emissions from H2 liquefaction, storage and transport can range anywhere from 11899 MTA to 23798 MTA.
3.2.2 Transmission pipeline
3.2.2.1 Activity data
The United States Pipeline and Hazardous Safety Administration reported that there are 1598.8 miles (2573 km) of H2 transmission pipeline in the U.S. (PHMSA, 2024). This study’s inventory of pipeline activity data is recorded in Supplementary Table SA1, Index 25–25.33. These transmission pipelines serve a large network of refineries, chemical manufacturing plants and hydrogen producers mainly along the Gulf Coast and in other geographic locations such as California and Indiana (Penev et al., 2019).
3.2.2.2 Estimating emissions
The H2 transmission pipeline emission factor was calculated using the assumption of choked flow through an orifice at standard temperature and pressure conditions (STP). The mass flow rate (
where
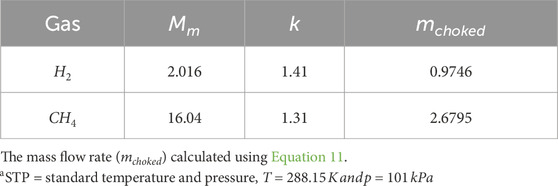
Table 6. The mass flow rates of
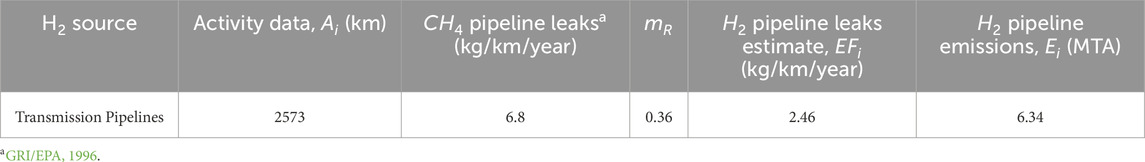
Table 7. Hydrogen transmission pipeline activity data, emission factor, and emissions estimate.
3.2.3 Underground Hydrogen Storage
3.2.3.1 Activity data
There are three UHS facilities in the U.S: (1) Clemens, (2) Moss Bluff, (3) Spindletop (Zhu et al., 2023). These UHS facilities in Texas all use salt caverns to store H2, especially in periods of low demand. Then, to minimize production inefficiencies due to fluctuations in demand, the stored H2 is used to supplement supply to refineries and other petrochemical customers in the gulf coast (Panfilov, 2016). These three facilities have a collective net storage capacity or total cavern storage volume of 2,046,000 m3 (Panfilov, 2016; Zivar et al., 2021; Zhu et al., 2023). In each facility, cushion gas is always injected into the salt cavern and remains there for the entire period the cavern is used for storage (Tarkowski and Uliasz-Misiak, 2022; Miocic et al., 2023). The purpose of cushion gas is to maintain a defined minimum pressure in the cavern, thus allowing effective injection and extraction of H2 gas. Therefore, the usable H2 capacity of a UHS salt cavern equals the net storage capacity minus the cushion gas capacity.
3.2.3.2 Estimating emissions
Previous research has identified the primary pathways for H2 leakage in Salt Cavern Hydrogen Storage (SCHS) as leakage losses through the wellbore, caprock, and cavern (Zhu et al., 2023). Wellbore losses can occur due to corrosion overtime, mechanical failure, or hydrogen embrittlement (Zhu et al., 2023). Other sources of emissions are associated with surface equipment during operation (e.g., compressors, pipework), including deliberate releases during scheduled or emergency shutdowns, and maintenance (Fan et al. (2022); Frazer-Nash Consultancy, 2022; Esquivel-Elizondo et al., 2023).
After a detailed literature search, the authors were unable to find any empirical research detailing H2 emission factors associated with SCHS Systems. Previous studies acknowledge major uncertainty associated with SCHS emissions due to a lack of data (Fan et al. (2022); Frazer-Nash Consultancy, 2022; Esquivel-Elizondo et al., 2023; Zhu et al., 2023). Consequently, a best-engineering estimate was developed for U.S. SCHS based on the available body of existing knowledge and research. Table 8 details the properties utilized to estimate emissions (Table 9) for the U.S. UHS sites. A detailed estimation methodology is provided in the following paragraphs.
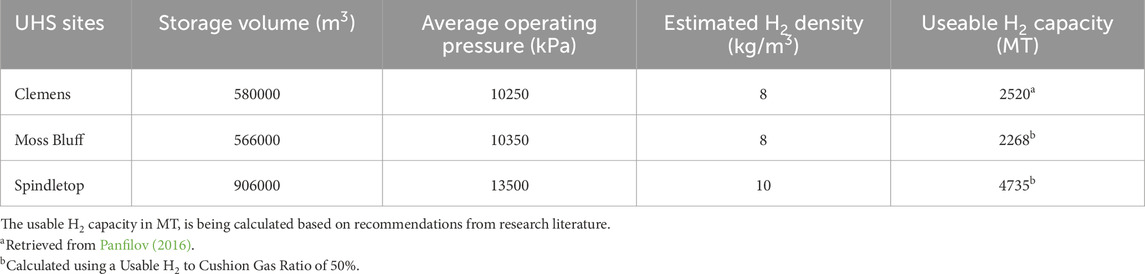
Table 8. Properties of underground hydrogen storage sites.
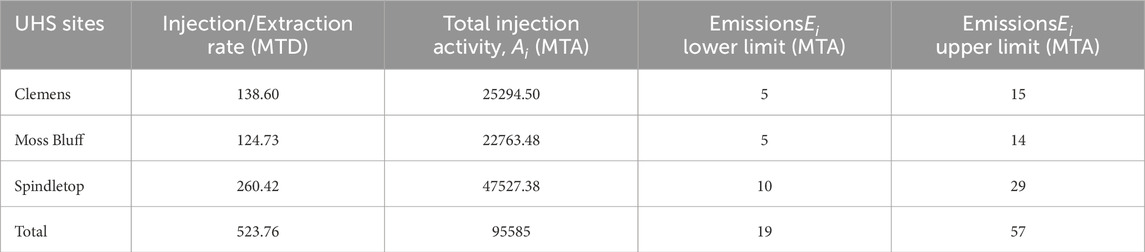
Table 9. Calculation of total and per site hydrogen emissions for underground hydrogen storage sites.
Previous published literature has provided key details regarding the operating conditions (e.g., operating pressure, depth, and storage capacity) of the U.S. SCHS sites (Panfilov, 2016; Zivar et al., 2021; Miocic et al., 2023; Zhu et al., 2023; Ruiz Maraggi and Moscardelli, 2024). For instance, Panfilov, 2016 reports the usable H2 capacity of the Clemens cavern as 2520 metric tons. Based on the operating pressure of Clemens cavern (70–137 bar) provided in Zhu et al., 2023, we estimate the usable H2 to account for about 50% of its net storage capacity (Karakilcik and Karakilcik, 2020), with the cushion gas accounting for the remaining capacity. Hence, in our estimation calculations we assumed the usable H2 capacity to cushion gas ratio was also 50% in the Moss Bluff and Spindletop caverns (Table 8). This assumption is consistent with previous research that specifies cushion gas typically occupies at least 20%–30% of the salt cavern volume (Crotogino et al., 2010; Karakilcik and Karakilcik, 2020; Tarkowski and Uliasz-Misiak, 2022).
Previous studies have also provided guidance on the withdrawal rates, injection/withdrawal cycles, and emission rates associated with SCHS. The maximum salt cavern filling and discharge rates are governed by 1 MPa/day, which corresponds to maximum withdrawal rates of approximately 10% of the cavern storage capacity per day (Crotogino et al., 2010; Karakilcik and Karakilcik, 2020). Salt caverns can experience up to 10 injection/withdrawal turnovers per year (Karakilcik and Karakilcik, 2020; Tarkowski and Uliasz-Misiak, 2022). Additionally, previous UHS models have proposed emission rates from surface operations (equipment leaks, compressor seals, depressurization) to typically range from 0.02%–0.06% of the stored hydrogen mass per year (Fan et al. (2022); Frazer-Nash Consultancy, 2022; Esquivel-Elizondo et al., 2023). Hence, to develop an emissions estimate for U.S. SCHS, we assumed each site is operating year-round, with 10 injection/withdrawal turnovers per year. We used a salt cavern filling and discharge rate of 5.5% of the cavern storage capacity per day. This would mean every 18.25 days there is an injection/withdrawal turnover. We also build upon previous UHS models and incorporate a daily H2 emissions rate of 0.02%–0.06% of the stored H2. This results in an estimate for the maximum emissions from U.S. SCHS ranging from 19 MTA to 57 MTA (Table 9).
3.2.4 FCEV refueling stations
3.2.4.1 Activity data
Majority of the market for FCEV refueling stations are in California (US DOE, 2023). The setup and infrastructure utilized in FCEV refueling stations vary, depending on the form of hydrogen delivered to the station (i.e., C-H2 vs. L-H2), and the class of vehicle being served (i.e., passenger vehicles, fuel cell busses, and class 8 trucks; (California Energy Commission, 2024). Losses in FCEV refueling stations are primarily due to purging in the case of C-H2, and boil off when dealing with L-H2 (Arrigoni and Bravo Diaz, 2022; California Energy Commission, 2024) reported 47 operational stations, and 38 planned stations.
3.2.4.2 Estimating emissions
To estimate emissions for FCEV refueling stations, the estimated H2 demand was used as the activity data for calculating emissions. The estimated H2 demand was calculated by multiplying the fuel consumption by the yearly distance travelled of representative or comparable vehicles, and the number of FCEVs in the U.S (Table 10).
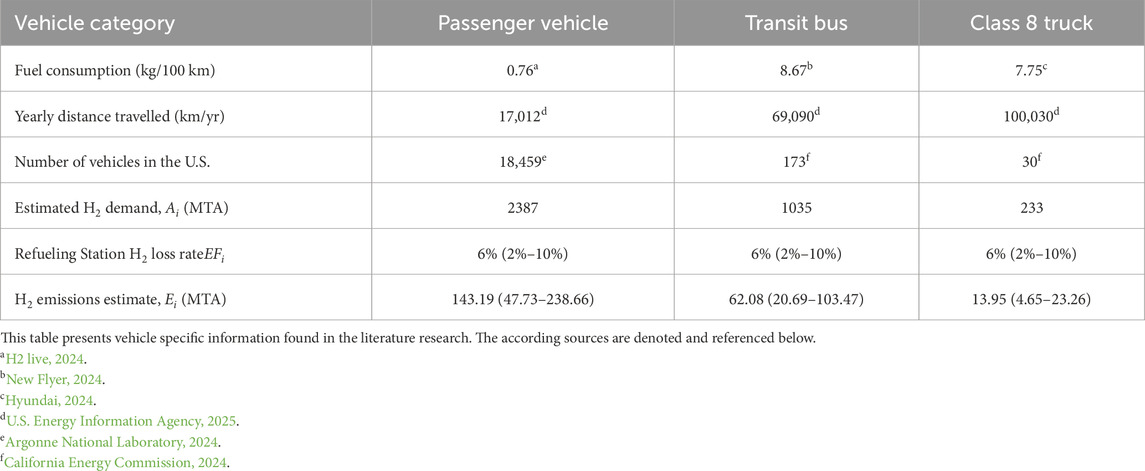
Table 10. Emission calculations for fuel cell electric vehicle refueling stations.
Only 2 studies were found that propose loss rates from FCEV refueling stations (Arrigoni and Bravo Diaz (2022); Genovese et al., 2020; Arrigoni and Bravo Diaz (2022)). Genovese et al., 2020 proposed a loss rate of 2%–10% of the hydrogen from an L-H2 refueling station, based on mass flow meter readings, over a 5-month period. Arrigoni and Bravo Diaz (2022) presents a loss rate of 3%–8.5% of the delivered hydrogen, depending on the form of hydrogen delivered (C-H2 vs. L-H2). To provide a conservative estimate, a loss rate of 2%–10% of the delivered hydrogen is utilized as the best available emission factor in this study. Multiplying this loss rate by the estimated H2 demand provides an estimate for FCEV refueling stations emissions in the U.S (Table 10).
4 Discussion
4.1 Overall emissions and contributions
The goal of this study was to review the hydrogen emissions literature in order to develop a baseline H2 emissions inventory for the U.S. production, distribution and storage segments. The scope of this study was limited to pure hydrogen emissions and excludes emissions from low purity H2 streams. This study also provides detailed insights regarding key emission or leakage sources and causes from each supply chain stage.
Figure 5 presents a U.S. map showing the geographic distribution of the operational hydrogen production facilities found in this studies literature search. The results of this study’s inventory detail the current U.S. H2 production capacity to be about 7.97 MMTA (Table 11). This number is slightly lower than but is still consistent with previous reporting of U.S. hydrogen production being about 10 MMTA (US DOE, 2018; International Energy Agency, 2024; U.S. Energy Information Administration, 2024). Hydrogen production companies are a difficult population to obtain data from. A potential reason for the small discrepancy between this inventory’s production results and previous reporting could be a lack of clarity or distinction between decommissioned sites, planned sites, and operational sites. This study is unique because it presents an inventory of production facilities to corroborate its results and is careful to distinguish between decommissioned, planned, and operational sites when calculating the U.S. H2 production capacity results. This study also estimated total hydrogen emissions from the U.S. production, distribution and storage segment to be about 0.0629 MMTA (Table 11), with emission bounds ranging from 0.02 to 0.11 MMTA. Thus, this study estimates the hydrogen leakage or emission rate to be about 0.79%, with emission rate bounds ranging from 0.26% to 1.32%. Substituting the International Energy Agency (2024) reported U.S. hydrogen production output of 10 MMTA as the production activity data in this study only reduces the resulting emission rate by 0.05%–0.12% which indicates a negligible discrepancy in terms of sensitivity between utilizing the International Energy Agency (2024) activity data or using this study’s inventoried production activity data.
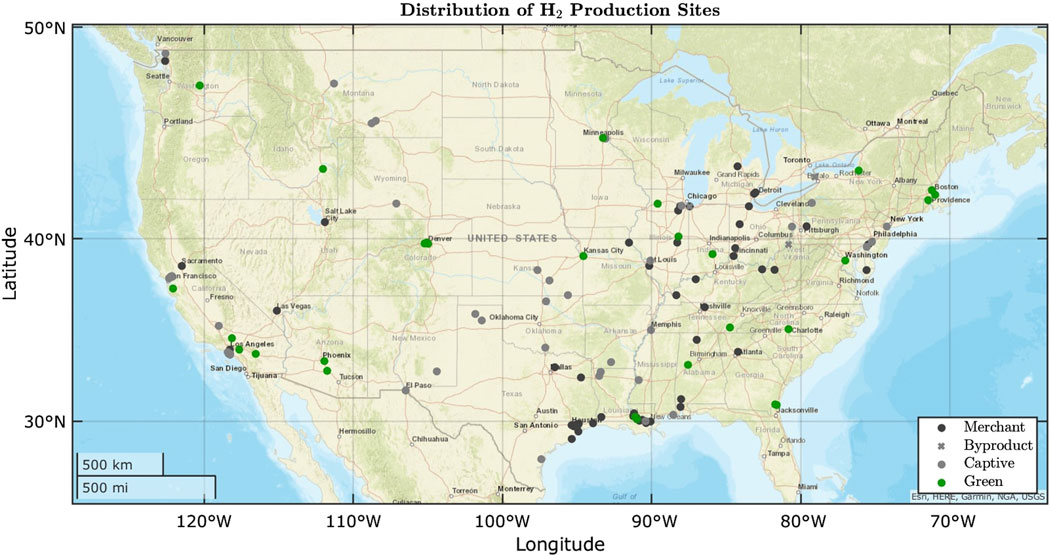
Figure 5. A U.S. map showing the geographic distribution of the operational hydrogen production facilities (n = 188) found in the studies literature search.
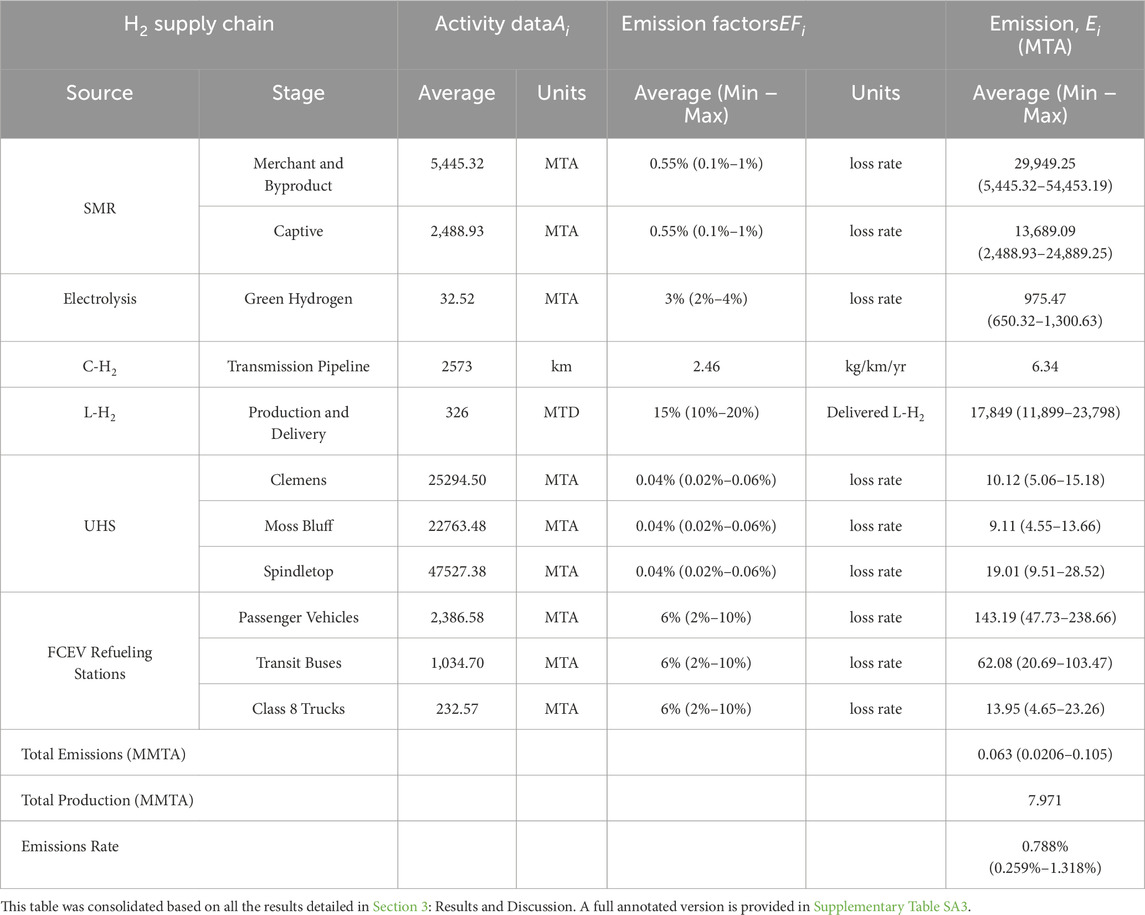
Table 11. Overall emissions estimate based on best available emission factors and activity data for the U.S. production, distribution and storage segments.
This study significantly contributes to the research literature by (i) consolidating a detailed list of hydrogen activity data (Supplementary Table SA1) and emission factors (Supplementary Table SA2) and (ii) estimating emissions across the relevant supply chain stages. The insights and conclusions from this study can provide direction for hydrogen production companies and researchers as they develop hydrogen emission mitigation measures, controls, and goals. The inventory framework developed in this study can also be utilized to inform the design and implementation of future facility-level hydrogen emission measurement studies and can serve as a living document that can be updated and enhanced as more empirical data is obtained.
4.2 Limitations and data gaps
Previous research is clear about the lack of empirical data available to quantify hydrogen emissions across the supply chain, especially in the end-use segment (Arrigoni and Bravo Diaz, 2022; Cooper et al., 2022; Fan et al., 2022). Therefore, it is important to clarify the limitations of this study. Firstly, majority of the emission factors were either retrieved from hydrogen emission reviews, estimated, or modelled. Few emission factors were based on small-scale experiments, and none of the emission factors were based on large-scale hydrogen measurement studies. Secondly, end-use emissions were not included in the results of this study due to the lack of data availability (activity data and emission factors) needed to sufficiently estimate majority of end-use emissions (Arrigoni and Bravo Diaz, 2022; Fan et al., 2022). One exception is emissions from FCEV’s, which were estimated based on data available in the literature but not included in the final inventory. The FCEV emissions estimation is based on a FCEV exhaust analysis performed by Pearman et al. (2021). As presented in detail in Section 4.2.2, the total emissions of H2 from FCEV’s was estimated to be 77.83 MTA. Lastly, the production activity data utilized in this study is based on production capacity rather than output and thus does not account for downtime in production due to maintenance or other unexpected occurrences.
4.2.1 End-use emissions
Most hydrogen end-use applications can be assigned to one of three broad categories: industrial facilities, energy or electricity generation, and mobility or transportation. Industrial facilities include ammonia and methanol production, petroleum refineries, chemical or synthetic fuels, and iron or steel production. Electricity generation includes hydrogen generators, stationary fuel-cells, and building heating. Transportation includes FCEVs and applications in aviation, and shipping. Hydrogen usage and reporting is still emerging in the U.S. market thus the exact usage for each of the applications is unclear. However, previous sources suggest that a vast majority (about 90%) of the produced hydrogen in the U.S. is used for petroleum refining, ammonia production (fertilizer production), and methanol production. While, the remaining (about 10%) are utilized in other applications including treating metals, and processing foods (Connelly et al., 2019; National Renewable Energy Laboratory, 2022). Hydrogen end-use leakage is the least understood compared to the production and distribution segments (Fan et al., 2022). Hydrogen end-use emission studies are primarily focused on quantitative risk analysis and plant surveys to prevent large-scale fires or explosions (Spouge, 2005; Mohammadfam and Zarei, 2015). Quantification of facility level leaks (small and distributed leaks) are less urgent and thus largely absent from the literature (Fan et al., 2022). Previous studies have proposed or assumed a similar emission factor (0.5%) as gray hydrogen production to emissions from industrial facilities such as refining, chemical or synthetic fuels, and iron or steel production (Fan et al., 2022). In various modelling studies, loss rates between 0.5%–3% have been assumed or proposed for electricity generation, and building heating; based on comparable natural gas infrastructure (Alvarez et al., 2012; Fischer et al., 2018; Hormaza Mejia and Brouwer, 2018; Fan et al., 2022). Other hydrogen end-use emission factors are virtually unexplored. Quantifying hydrogen end-use activity data and emission factors represents a major data gap and is an important future work for estimating emissions from the entire hydrogen value-chain. In Section 4.2.2 we propose FCEV emissions estimation process.
4.2.2 Fuel cell electric vehicles emissions
Hydrogen emissions from FCEVs includes hydrogen residues in the exhaust from the fuel cell due to incomplete reactions, permeation through storage vessels, and leakage from high pressure valves, pipelines, and joints (Hao et al., 2020; Pearman et al., 2021). Emissions from FCEVs also occur during start-up, shut-down, and vehicle idling (Hao et al., 2020).
There are three main groups of FCEVs in the U.S: (1) Passenger vehicles, (2) Fuel cell busses, and (3) Class 8 trucks. Majority of the FCEV market and infrastructure (including refueling stations) in the U.S. is currently in California (US DOE, 2023). Argonne National Laboratory (2024) reports 18,459 FCEV passenger vehicles have been sold in the U.S. since 2014. California Energy Commission (2024) reports 173 fuel cell transit busses, and 30 Class 8 trucks in operation in California.
There is a lack of empirical research detailing leakage rates and emission factors for FCEVs. Only one study was found that proposed an average hydrogen exhaust concentration (Pearman et al., 2021). Pearman et al. (2021) utilized a prototype FCEV exhaust analyzer to perform an exhaust analysis on a commercial FCEV. Under simulated urban driving conditions, their graphical analysis indicates an average exhaust hydrogen concentration of about 0.75%. Thus, we applied the exhaust hydrogen concentration proposed by Pearman et al. (2021) through fuel cell stochiometric relationships to estimate an exhaust emission factor for FCEVs.
An emission factor for the hydrogen residues in the exhaust was estimated for the three classes of FCEVs: passenger vehicles, fuel cell busses, and class 8 trucks. Since majority of the FCEV market is currently in California, it is used as the reference state in this analysis. The Toyota Mirai, New Flyer xcelsior Charge H2 bus, and the Hyundai XCIENT Fuel Cell Truck are used as the representative passenger vehicles, fuel cell bus, and class 8 truck respectively in our estimation. The Toyota Mirai represents 88% of FCEV passenger vehicles in California, the New Flyer xcelsior Charge H2 bus represents 60% of FCEV transit buses, while all class 8 trucks in California are a Hyundai XCIENT Fuel Cell Trucks (California Energy Commission, 2024). The hydrogen exhaust emissions were estimated for the passenger vehicle and scaled up to the bus and class 8 truck based on their fuel cell stoichiometry (Equations 14–18) and the relative fuel consumption of the respective vehicles. The methodology employed in these calculations is detailed in the following paragraphs. Our estimation assumed that dry air is used at the inlet of the fuel cell, the entire amount of O2 reacts with the H2 in the fuel cell, and the produced water is vaporized. Based on the stochiometric equation (Equation 14), and the molar conservation requirements for hydrogen, oxygen and nitrogen (Equations 15–17), the molar exhaust ratios can be calculated using Equation 18:
where
By using the hydrogen exhaust concentration result from Pearman et al. (2021),
Then the molar fractions are converted into mass fractions using Equation 19, with
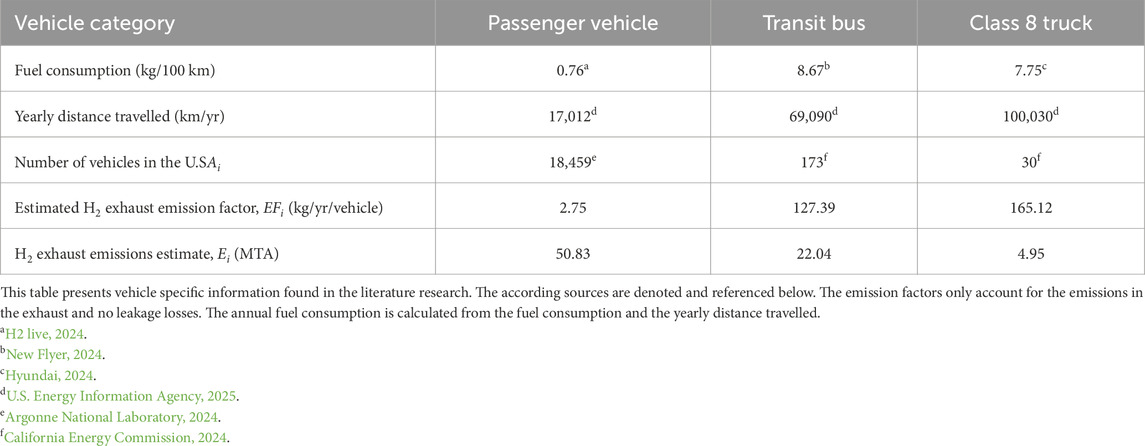
Table 12. Overall emissions estimate based on best available emission factors and activity data for the U.S. production, distribution and storage segments.
Then, by multiplying the mass fraction of hydrogen at the outlet with the total mass flow rate (Equation 21), the hydrogen exhaust mass flow rate (
This estimation methodology results in a H2 exhaust emissions estimate from FCEV’s of 77.83 MTA. Future work should focus on large-scale hydrogen measurement research to empirically measure emissions from the hydrogen transportation sector (FCEV’s and FCEV fueling stations). Previous pump to wheel studies aimed at quantifying methane emissions from the transportation sector can be utilized as a framework and guide (Clark et al., 2017).
4.3 Future work
This study is the first to present a baseline inventory of hydrogen emissions in the U.S. Its goal is to provide an initial inventory framework that can be updated as more empirical data is obtained. Future work should focus on large-scale hydrogen measurement research to empirically measure, quantify, and confirm emissions across the supply chain (production to end-use). Hydrogen end-uses include ammonia and methanol production, oil refining, transportation, power generation and other industrial processes. With the recent announcement of a new sensor capable of site-level emission rate quantification (Momeni et al., 2025), future measurement studies can utilize tracer flux ratio to quantify site-level emissions (Marchese et al., 2015; Mitchell et al., 2015). The tracer flux ratio technique involves releasing tracer gas at the hydrogen production site at known flow rates (typically 5 to 40 standard liters per minute). The concentrations of the tracer gas and hydrogen emitted from the site can then be measured downwind of the facility. The measured downwind concentration ratios of the hydrogen gas to the tracer gases, in combination with the known tracer release rate, can then be used to determine the facility-level emission rate of hydrogen (Mitchell et al., 2015). Additionally, physics-based Bayesian plume model inversion methodologies as detailed in (Momeni et al., 2025) can also be utilized to quantify facility-level hydrogen emission rates. These methodologies would be particularly useful for site-level quantification (e.g., SMR, electrolysis, ammonia and methanol production) and for quantifying emission from equipment at the process level (e.g., pipelines, storage, loading/unloading). Future empirical measurement research will reduce the uncertainty depicted by the upper and lower emission rate estimates in this study and provide empirical data for hydrogen processes outside of the scope of this study. Additionally, previous pump to wheel studies aimed at quantifying methane emissions from the transportation sector can be utilized as a framework and guide for measuring hydrogen emissions from FCEV’s and FCEV fueling stations (Clark et al., 2017).
Author contributions
JD: Writing – review and editing, Formal Analysis, Visualization, Validation, Investigation, Methodology, Data curation, Writing – original draft, Conceptualization. KM: Formal Analysis, Visualization, Methodology, Supervision, Conceptualization, Project administration, Data curation, Investigation, Writing – review and editing. NV: Investigation, Writing – original draft, Visualization, Data curation, Formal Analysis, Methodology. PD: Data curation, Formal Analysis, Methodology, Investigation, Writing – original draft. CM: Formal Analysis, Methodology, Visualization, Data curation, Writing – original draft, Investigation. HM: Formal Analysis, Methodology, Data curation, Visualization, Writing – original draft, Investigation. DO: Writing – original draft, Formal Analysis, Methodology, Conceptualization, Visualization, Data curation, Investigation. NL: Methodology, Formal Analysis, Data curation, Writing – original draft, Visualization, Conceptualization. MH: Data curation, Visualization, Conceptualization, Project administration, Writing – review and editing, Methodology. AM: Funding acquisition, Formal Analysis, Visualization, Supervision, Project administration, Conceptualization, Validation, Writing – review and editing, Methodology, Investigation.
Funding
The author(s) declare that financial support was received for the research and/or publication of this article. The authors acknowledge Environmental Defense Fund for funding this study and providing guidance on its scope.
Acknowledgments
The authors were independently responsible for study design, data collection, analysis and interpretation, reporting included in this research. The authors also acknowledge Marya el Malki, Antoon Visschedijk, Ingrid Super, Hugo Denier van der Gon from TNO for their constant technical feedback, guidance, and encouragement with the inventory development process of this study. Also thank you to Nigel Clark, David McKain, and Derek Johnson from West Virginia University for providing direction and guidance with the transportation segment data collection.
Conflict of interest
Authors KM, PD, CM, HM, DO, and MH were employed by SLR Consulting.
The remaining authors declare that the research was conducted in the absence of any commercial or financial relationships that could be construed as a potential conflict of interest.
Generative AI statement
The author(s) declare that no Generative AI was used in the creation of this manuscript.
Any alternative text (alt text) provided alongside figures in this article has been generated by Frontiers with the support of artificial intelligence and reasonable efforts have been made to ensure accuracy, including review by the authors wherever possible. If you identify any issues, please contact us.
Publisher’s note
All claims expressed in this article are solely those of the authors and do not necessarily represent those of their affiliated organizations, or those of the publisher, the editors and the reviewers. Any product that may be evaluated in this article, or claim that may be made by its manufacturer, is not guaranteed or endorsed by the publisher.
Supplementary material
The Supplementary Material for this article can be found online at: https://www.frontiersin.org/articles/10.3389/fenrg.2025.1650479/full#supplementary-material
References
Alvarez, R. A., Pacala, S. W., Winebrake, J. J., Chameides, W. L., and Hamburg, S. P. (2012). Greater focus needed on methane leakage from natural gas infrastructure. Proc. Natl. Acad. Sci. 109 (17), 6435–6440. doi:10.1073/pnas.1202407109
Argonne National Laboratory (2024). Light duty electric drive vehicles monthly sales updates. Available online at: https://www.anl.gov/esia/light-duty-electric-drive-vehicles-monthly-sales-updates.
Arjona, V. (2023). Electrolyzer installations in the United States. Available online at: https://www.hydrogen.energy.gov/docs/hydrogenprogramlibraries/pdfs/23003-electrolyzer-installations-united-states.pdf.
Arrigoni, A., and Bravo Diaz, L. (2022). Hydrogen emissions from a hydrogen economy and their potential global warming impact: summary report of the clean hydrogen joint undertaking expert workshop on the environmental impacts of hydrogen. Luxembourg: Publications Office of the European Union. Available online at: https://data.europa.eu/doi/10.2760/065589 (Accessed: 20 May 2025).
Barrett, M., and Cassarino, T. G. (2021). Heating with steam methane reformed hydrogen. Review. doi:10.21203/rs.3.rs-638496/v1
Benitto, J. J., Akash, K., Vijaya, J. J., Humayun, M., and Bououdina, M. (2025). State-of-the-Art hydrogen gas sensors: from fundamentals to applications. J. Electron. Mater. 54 (2), 879–909. doi:10.1007/s11664-024-11604-w
California Energy Commission (2024). Zero emission vehicle and infrastructure statistics - collection. Available online at: https://www.energy.ca.gov/data-reports/energy-almanac/zero-emission-vehicle-and-infrastructure-statistics-collection.
Cardella, U., Decker, L., and Klein, H. (2017). ‘Roadmap to economically viable hydrogen liquefaction’, Int. J. Hydrogen Energy 42, 13329, 13338. doi:10.1016/j.ijhydene.2017.01.068
Chauhan, P. S., and Bhattacharya, S. (2019). Hydrogen gas sensing methods, materials, and approach to achieve parts per billion level detection: a review. Int. J. Hydrogen Energy 44 (47), 26076–26099. doi:10.1016/j.ijhydene.2019.08.052
Chen, J., Benson, S. M., Hennessy, N., and Bracci, J. (2022). Zero emission transit bus technology analysis. AC Transit. Available online at: https://hydrogen.stanford.edu/publications/ac-transits-zero-emission-transit-bus-technology-analysis-volume-3.
Clark, N. N., McKain, D. L., Johnson, D. R., Wayne, W. S., Li, H., Akkerman, V., et al. (2017). Pump-to-Wheels methane emissions from the heavy-duty transportation sector. Environ. Sci. and Technol. 51 (2), 968–976. doi:10.1021/acs.est.5b06059
Connelly, E., Elgowainy, A., and Ruth, M. (2019). DOE hydrogen and fuel cells program record. Available online at: https://www.hydrogen.energy.gov/docs/hydrogenprogramlibraries/pdfs/19002-hydrogen-market-domestic-global.pdf?Status=Master.
ConocoPhillips (2015). Value chain methane loss update review of publicly available studies. Available online at: http://static.conocophillips.com/files/resources/methanestudies112015.pdf.
Cooper, J., Dubey, L., Bakkaloglu, S., and Hawkes, A. (2022). Hydrogen emissions from the hydrogen value chain-emissions profile and impact to global warming. Sci. Total Environ. 830, 154624. doi:10.1016/j.scitotenv.2022.154624
Crotogino, F., Donadei, S., Bünger, U., and Landinger, H. (2010). “Large-scale hydrogen underground storage for securing future energy supplies,” in Proceedings of the 18th world hydrogen energy conference 2010 - WHEC 2010, parallel sessions book 4: storage systems/policy perspectives, initiatives and Co-operations. Jülich: Forschungszentrum, IEF-3 (Schriften des Forschungszentrums Jülich Reihe Energie & Umwelt).
Derwent, R. G. (2018). Hydrogen for heating: atmospheric impacts - a literature review. Department for Business, Energy and Industrial Strategy. Available online at: https://assets.publishing.service.gov.uk/media/65aabac882fee900106f5fa8/hydrogen-atmospheric-impact-report.pdf.
Derwent, R., Simmonds, P., O'Doherty, S., Manning, A., Collins, W., and Stevenson, D. (2006). Global environmental impacts of the hydrogen economy. Int. J. Nucl. Hydrogen Prod. Appl. 1 (1), 57. doi:10.1504/IJNHPA.2006.009869
Derwent, R. G., Stevenson, D. S., Utembe, S. R., Jenkin, M. E., Khan, A. H., and Shallcross, D. E. (2020). Global modelling studies of hydrogen and its isotopomers using STOCHEM-CRI: likely radiative forcing consequences of a future hydrogen economy. Int. J. Hydrogen Energy 45 (15), 9211–9221. doi:10.1016/j.ijhydene.2020.01.125
EPA (2024a). AP–42 volume 1 introduction. Available online at: https://www.epa.gov/air-emissions-factors-and-quantification/ap-42-compilation-air-emissions-factors-stationary-sources.
EPA (2024b). Inventory of U.S. greenhouse gas emissions and sinks 1990-2022 2022. [Annual Report]. Available online at: https://www.epa.gov/ghgemissions/inventory-us-greenhouse-gas-emissions-and-sinks.
EPA GHGRP (2023). Greenhouse gas reporting program 2022 (GHGRP) subpart P – hydrogen production. Available online at: https://www.epa.gov/ghgreporting/data-sets.
Esquivel-Elizondo, S., Hormaza Mejia, A., Sun, T., Shrestha, E., Hamburg, S. P., and Ocko, I. B. (2023). Wide range in estimates of hydrogen emissions from infrastructure. Front. Energy Res. 11, 1207208. doi:10.3389/fenrg.2023.1207208
Fan, Z. (2022). Hydrogen leakage: a potential risk for the hydrogen economy [commentary]. Columbia University. Available online at: https://www.energypolicy.columbia.edu/sites/default/files/file-uploads/HydrogenLeakageRegulations_CGEP_Commentary_070722_0.pdf.
Field, R. A., and Derwent, R. G. (2021). Global warming consequences of replacing natural gas with hydrogen in the domestic energy sectors of future low-carbon economies in the United Kingdom and the United States of America. Int. J. Hydrogen Energy 46 (58), 30190–30203. doi:10.1016/j.ijhydene.2021.06.120
Fischer, M. L., Chan, W. R., Delp, W., Jeong, S., Rapp, V., and Zhu, Z. (2018). An estimate of natural gas methane emissions from California homes. Environ. Sci. and Technol. 52 (17), 10205–10213. doi:10.1021/acs.est.8b03217
Frazer-Nash Consultancy (2022). Fugitive hydrogen emissions in a future hydrogen economy. Available online at: https://assets.publishing.service.gov.uk/.
Genovese, M., Blekhman, D., Dray, M., and Fragiacomo, P. (2020). Hydrogen losses in fueling station operation. J. Clean. Prod. 248, 119266. doi:10.1016/j.jclepro.2019.119266
GPC (2014). Global protocol for community-scale greenhouse gas emission inventories. Available online at: https://ghgprotocol.org/ghg-protocol-cities.
GRI/EPA (1996). Methane emissions from the natural gas industry. Available online at: https://www.epa.gov/ghgemissions/natural-gas-and-petroleum-systems-ghg-inventory-additional-information-1990-2021-ghg.
H2 Live (2024). Toyota mirai. Available online at: https://h2.live/en/fuelcell-cars/toyota-mirai/.
Halicka, K. (2020). Technology selection using the TOPSIS method. Foresight STI Gov. 14 (1), 85–96. doi:10.17323/2500-2597.2020.1.85.96
Hao, D., Wang, X., Zhang, Y., Wang, R., Chen, G., and Li, J. (2020). Experimental study on hydrogen leakage and emission of fuel cell vehicles in confined spaces. Automot. Innov. 3 (2), 111–122. doi:10.1007/s42154-020-00096-z
Harrison, K., and Peters, M. (2013). ‘Renewable electrolysis integrated system development and testing’.
Hauglustaine, D., Paulot, F., Collins, W., Derwent, R., Sand, M., and Boucher, O. (2022). Climate benefit of a future hydrogen economy. Commun. Earth and Environ. 3 (1), 295. doi:10.1038/s43247-022-00626-z
Hormaza Mejia, N. A., and Brouwer, J. (2018). “Gaseous fuel leakage from natural gas infrastructure,” in Volume 6A: energy. ASME 2018 international mechanical engineering congress and exposition (Pittsburgh, Pennsylvania, USA: American Society of Mechanical Engineers), V06AT08A069. doi:10.1115/IMECE2018-88271
Hwang, C.-L., and Yoon, K. (1981). Multiple attribute decision making. Berlin, Heidelberg: Springer Berlin Heidelberg (Lecture Notes in Economics and Mathematical Systems). doi:10.1007/978-3-642-48318-9
Hyundai (2024). Xcient fuel cell truck. Available online at: https://ecv.hyundai.com/.
International Energy Agency (2021). Global hydrogen review 2021. Available online at: https://www.iea.org/reports/global-hydrogen-review-2021.
International Energy Agency (2024). Global hydrogen review 2024. Available online at: https://www.iea.org/reports/global-hydrogen-review-2024.
IPCC (2024). 2006 IPCC guidelines for national greenhouse gas inventories. Available online at: https://www.ipcc-nggip.iges.or.jp/public/2006gl/.
Joseck, F., Nguyen, T., Klahr, B., and Talapatra, A. (2016). DOE hydrogen and fuel cells program record: current U.S. hydrogen production. Department of Energy. Available online at: https://www.hydrogen.energy.gov/docs/hydrogenprogramlibraries/pdfs/16015_current_us_h2_production.pdf?Status=Master.
Jozi, S. A., and Majd, N. M. (2014). Health, safety, and environmental risk assessment of steel production complex in central Iran using TOPSIS. Environ. Monit. Assess. 186 (10), 6969–6983. doi:10.1007/s10661-014-3903-6
Karakilcik, H., and Karakilcik, M. (2020). ‘Underground large-scale hydrogen storage’, in T. S. Uyar (ed.) Accelerating the transition to a 100% renewable energy era. Cham: Springer International Publishing (Lecture Notes in Energy), pp. 375–392. doi:10.1007/978-3-030-40738-4_17
Kumar, R., Jagadish, , and Ray, A. (2014). Selection of material for optimal design using multi-criteria decision making. Procedia Mater. Sci. 6, 590–596. doi:10.1016/j.mspro.2014.07.073
Lamb, B. K., Edburg, S. L., Ferrara, T. W., Howard, T., Harrison, M. R., Kolb, C. E., et al. (2015). Direct measurements show decreasing methane emissions from natural gas local distribution systems in the United States. Environ. Sci. and Technol. 49 (8), 5161–5169. doi:10.1021/es505116p
Liu, Y. Y., Li, Z., Liang, Y., Tang, T., Zhuang, J. H., Zhang, W. J., et al. (2024). Recent advances in nanomaterial-enabled chemiresistive hydrogen sensors. Chem. Commun. 60 (98), 14497–14520. doi:10.1039/D4CC05430J
Marchese, A. J., Vaughn, T. L., Zimmerle, D. J., Martinez, D. M., Williams, L. L., Robinson, A. L., et al. (2015). Methane emissions from United States natural gas gathering and processing. Environ. Sci. and Technol. 49 (17), 10718–10727. doi:10.1021/acs.est.5b02275
Miocic, J., Heinemann, N., Edlmann, K., Scafidi, J., Molaei, F., and Alcalde, J. (2023). Underground hydrogen storage: a review. Geol. Soc. Lond. Spec. Publ. 528 (1), 73–86. doi:10.1144/SP528-2022-88
Mitchell, A. L., Tkacik, D. S., Roscioli, J. R., Herndon, S. C., Yacovitch, T. I., Martinez, D. M., et al. (2015). Measurements of methane emissions from natural gas gathering facilities and processing plants: measurement results. Environ. Sci. and Technol. 49 (5), 3219–3227. doi:10.1021/es5052809
Mohammadfam, I., and Zarei, E. (2015). Safety risk modeling and major accidents analysis of hydrogen and natural gas releases: a comprehensive risk analysis framework. Int. J. Hydrogen Energy 40 (39), 13653–13663. doi:10.1016/j.ijhydene.2015.07.117
Momeni, A., Albertson, J. D., Herndon, S., Daube, C., Nelson, D., Roscioli, J. R., et al. (2025). Quantification of hydrogen emission rates using downwind plume characterization techniques. Environ. Sci. and Technol. 59 (12), 6016–6024. doi:10.1021/acs.est.4c13616
Najjar, Y. S. (2019). ‘Hydrogen leakage sensing and control: (review): (Review)’, Biomed. J. Sci. and Tech. Res. 21(5). doi:10.26717/BJSTR.2019.21.003670
National Renewable Energy Laboratory (2022). Hydrogen 101: frequently asked questions about hydrogen for decarbonization. Available online at: https://www.nrel.gov/docs/fy22osti/82554.pdf.
New Flyer (2024a). Xcelsior charge H2 fuel cell-electric and zero-emission. Available online at: https://www.newflyer.com/site-content/uploads/sites/2/2021/01/Xccelsior-CHARGE-H2-Brochure_2021.pdf.
New Flyer (2024b). Xcelsior charge H2 fuel cell-electric and zero-emission. Available online at: https://www.newflyer.com/site-content/uploads/sites/2/2021/01/Xccelsior-CHARGE-H2-Brochure_2021.pdf.
Ocko, I. B., and Hamburg, S. P. (2022). Climate consequences of hydrogen leakage. Radiation/Atmospheric Model. Data Analysis/Troposphere/Physics Phys. Prop. Process. doi:10.5194/acp-2022-91
Panfilov, M. (2016). “Underground and pipeline hydrogen storage,” in Compendium of hydrogen energy (Elsevier), 91–115. doi:10.1016/B978-1-78242-362-1.00004-3
Paulot, F., Paynter, D., Naik, V., Malyshev, S., Menzel, R., and Horowitz, L. W. (2021). Global modeling of hydrogen using GFDL-AM4.1: sensitivity of soil removal and radiative forcing. Int. J. Hydrogen Energy 46 (24), 13446–13460. doi:10.1016/j.ijhydene.2021.01.088
Pearman, D. (2021). “Safety compliance verification of fuel cell electric vehicle exhaust,” in ICHS 2021: international conference on hydrogen safety. Available online at: https://research-hub.nrel.gov/en/publications/safety-compliance-verification-of-fuel-cell-electric-vehicle-exha (Accessed May 22, 2025).
Penev, M., Zuboy, J., and Hunter, C. (2019). Economic analysis of a high-pressure urban pipeline concept (HyLine) for delivering hydrogen to retail fueling stations. Transp. Res. Part D Transp. Environ. 77, 92–105. doi:10.1016/j.trd.2019.10.005
PHMSA (2024). Pipeline mileage and facilities. Available online at: https://www.phmsa.dot.gov/data-and-statistics/pipeline/pipeline-mileage-and-facilities.
Pranda, P., and de Reals, G. (2023). “Hydrogen release: a supply chain overview,” in The 2023 hydrogen and fuel cell seminar.
Pritchard, P. J., and Mitchell, J. W. (2015). Fox and McDonald’s introduction to fluid mechanics. 9th edition.
Qiu, Y., Yang, H., Tong, L., and Wang, L. (2021). Research progress of cryogenic materials for storage and transportation of liquid hydrogen. Metals 11 (7), 1101. doi:10.3390/met11071101
Ramaiyan, K., Tsui, L. k., Brosha, E. L., Kreller, C., Stetter, J. R., Russ, T., et al. (2023). Recent developments in sensor technologies for enabling the hydrogen economy. ECS Sensors Plus 2 (4), 045601. doi:10.1149/2754-2726/ad0736
Roueff, E., Abgrall, H., Czachorowski, P., Pachucki, K., Puchalski, M., and Komasa, J. (2019). The full infrared spectrum of molecular hydrogen. Astronomy and Astrophysics 630, A58. doi:10.1051/0004-6361/201936249
Ruiz Maraggi, L. M., and Moscardelli, L. G. (2024). Hydrogen storage potential of salt domes in the gulf Coast of the United States. J. Energy Storage 82, 110585. doi:10.1016/j.est.2024.110585
Shyjith, K., Ilangkumaran, M., and Kumanan, S. (2008). Multi-criteria decision-making approach to evaluate optimum maintenance strategy in textile industry. J. Qual. Maintenance Eng. 14 (4), 375–386. doi:10.1108/13552510810909975
Spouge, J. (2005). New generic leak frequencies for process equipment. Process Saf. Prog. 24 (4), 249–257. doi:10.1002/PRS.10100
Swager, T. M., Pioch, T. N., Feng, H., Bergman, H. M., Luo, S. X. L., and Valenza, J. J. (2024). Critical sensing modalities for hydrogen: technical needs and status of the field to support a changing energy landscape. ACS Sensors 9 (5), 2205–2227. doi:10.1021/acssensors.4c00251
Tarkowski, R., and Uliasz-Misiak, B. (2022). Towards underground hydrogen storage: a review of barriers. Renew. Sustain. Energy Rev. 162, 112451. doi:10.1016/j.rser.2022.112451
The White House (2023). Biden-harris administration announces regional clean hydrogen hubs to drive clean manufacturing and jobs. Available online at: https://www.whitehouse.gov/briefing-room/statements-releases/2023/10/13/biden-harris-administration-announces-regional-clean-hydrogen-hubs-to-drive-clean-manufacturing-and-jobs/.
United Nations (2025). Ensure access to affordable, reliable, sustainable and modern energy for all. Available online at: https://sdgs.un.org/goals/goal7.
US DOE (2018). Fact of the month may 2018: 10 million metric tons of hydrogen produced annually. Available online at: https://www.energy.gov/sites/prod/files/2020/07/f76/USDOE_FE_Hydrogen_Strategy_July2020.pdf.
US DOE (2020). Hydrogen strategy enabling a low-carbon economy. Available online at: https://www.energy.gov/sites/prod/files/2020/07/f76/USDOE_FE_Hydrogen_Strategy_July2020.pdf.
US DOE (2023). Hydrogen fueling stations. Available online at: https://afdc.energy.gov/fuels/hydrogen-stations.
U.S. Energy Information Administration (2024). U.S. refiners and chemical manufacturers lead hydrogen production and consumption. Available online at: https://www.eia.gov/todayinenergy/detail.php?id=61763.
U.S. Energy Information Agency (2025). Annual energy outlook 2025. Available online at: https://www.eia.gov/outlooks/aeo/
Valenti, G. (2016). “2 - hydrogen liquefaction and liquid hydrogen storage,” in Compendium of hydrogen energy. Editors R. B. Gupta, A. Basile, and T. N. Veziroğlu. Compendium of Hydrogen Energy. Woodhead Publishing (Woodhead Publishing Series in Energy), 27–51. doi:10.1016/B978-1-78242-362-1.00002-X
Westra, I. M., Scheeren, H. A., Stroo, F. T., van Heuven, S. M. A. C., Kers, B. A. M., Peters, W., et al. (2024). First detection of industrial hydrogen emissions using high precision Mobile measurements in ambient air. Sci. Rep. 14 (1), 24147. doi:10.1038/s41598-024-76373-2
Xia, X., Zhou, H., Zhang, Y., and Jiang, H. (2019). Innovative steam methane reforming for coproducing CO-free hydrogen and syngas in proton conducting membrane reactor. AIChE J. 65 (11), e16740. doi:10.1002/aic.16740
Yin, L., and Ju, Y. (2020). Review on the design and optimization of hydrogen liquefaction processes. Front. Energy 14 (03), 530–544. doi:10.1007/s11708-019-0657-4
Zeng, S., and Xiao, Y. (2016). TOPSIS method for intuitionistic fuzzy multiple-criteria decision making and its application to investment selection. Kybernetes Int. J. Syst. Cybern. 45 (02), 282–296. doi:10.1108/K-04-2015-0093
Zhu, S., Shi, X., Yang, C., Li, Y., Li, H., Yang, K., et al. (2023). Hydrogen loss of salt cavern hydrogen storage. Renew. Energy 218, 119267. doi:10.1016/j.renene.2023.119267
Zimmerle, D. J., Williams, L. L., Vaughn, T. L., Quinn, C., Subramanian, R., Duggan, G. P., et al. (2015). Methane emissions from the natural gas transmission and storage system in the United States. Environ. Sci. Technol. 49 (15), 9374–9383. doi:10.1021/acs.est.5b01669
Zimmerle, D., Bennett, K., Vaughn, T., Luck, B., Lauderdale, T., Keen, K., et al. (2019). Characterization of methane emissions from gathering compressor stations. Available online at: https://mountainscholar.org/handle/10217/195489.
Zivar, D., Kumar, S., and Foroozesh, J. (2021). Underground hydrogen storage: a comprehensive review. Int. J. Hydrogen Energy 46 (45), 23436–23462. doi:10.1016/j.ijhydene.2020.08.138
Nomenclature
Chemistry compound
CO2 Carbon dioxide
H2 Hydrogen
H2O Water
N2 Nitrogen
O2 Oxygen
Symbol
Units
J Joule
K Kelvin
kg Kilogram
km Kilometer
mol Mole
MPa/day Megapascal per day
kPa Kilopascal
MT Metric Tons (equivalent to kg)
MTA Metric Tons per Year
MTD Metric Tons per Day
MMTA Million Metric Tons per Year
MW Megawatts
yr Year
nm3 Normal Cubic Meter
Keywords: hydrogen emissions, hydrogen emissions inventory, hydrogen supply chain, hydrogen production, hydrogen economy
Citation: Duroha JC, Malmquist K, Vad N, Dilsaver P, Malotte C, Matthews H, Ordonez D, Lariviere N, Harrison M and Marchese AJ (2025) A review and inventory of U.S. hydrogen emissions for production, distribution and storage. Front. Energy Res. 13:1650479. doi: 10.3389/fenrg.2025.1650479
Received: 19 June 2025; Accepted: 13 October 2025;
Published: 05 November 2025.
Edited by:
Hailin Li, West Virginia University, United StatesReviewed by:
Najem A. Al-Rubaiey, University of Technology, IraqChanel Handoko, Faculty of Medicine Universitas Sebelas Maret, Indonesia
Copyright © 2025 Duroha, Malmquist, Vad, Dilsaver, Malotte, Matthews, Ordonez, Lariviere, Harrison and Marchese. This is an open-access article distributed under the terms of the Creative Commons Attribution License (CC BY). The use, distribution or reproduction in other forums is permitted, provided the original author(s) and the copyright owner(s) are credited and that the original publication in this journal is cited, in accordance with accepted academic practice. No use, distribution or reproduction is permitted which does not comply with these terms.
*Correspondence: Anthony J. Marchese, bWFyY2hlc2VAdXJpLmVkdQ==