 Lavanya Arubolu
 Ravindra Kollu
 Ramalinga Raju Manyala
- Electrical and Electronics Engineering, University College of Engineering Kakinada, Jawaharlal Nehru Technological University Kakinada, Kakinada, India
In recent years, the world’s energy needs have increased significantly. In order to meet this demand and mitigate the environmental issues brought on by the use of conventional power plants, numerous studies were offered to develop renewable energy sources (RES) as green energy distributed generators. This study uses probability distribution functions to simulate the fluctuating nature of RES and load. A novel approach to minimize Power Loss, Total Harmonic Distortion, and Cost is proposed which employs Pareto front-based Multi Objective Backtracking Search Algorithm (PMBSA) to optimally distribute RES and Power Filters in an Unbalanced Distribution System (UDS). The proposed approach takes into account load growth and multiple non-linear loads in addition to linear loads while optimally allocating RES, Passive power filters (PPFs) and Active power filters (APFs) in UDS. The results of simultaneous placement of RES and PPFs are compared with simultaneous placement of RES and APFs by testing on a 123-bus UDS to demonstrate which combination performs better in reducing THD along with other objectives. Automatic Voltage Regulators (AVRs) and Shunt Capacitor Banks (SCBs) are also installed in UDS in the event of voltage limit violations. Furthermore, results comparison is carried out with results obtained using Non-dominated Sorting Genetic Algorithm (NSGA-II), Multi-Objective Particle Swarm Optimization (MOPSO) and Weighted Sum technique (WSA) to demonstrate the effectiveness of the proposed approach employing PMBSA in improving UDS performance.
1 Introduction
The substantial rise in electrical energy consumption in recent years has prompted distribution system operators to provide the required power through proper network use and design. As a result, adding DG units to distribution systems is one of the primary ways to supply loads for customers. Utilizing Renewable Energy Sources (RES) like solar and wind has been a popular choice among DG technologies because of their environmental benefits (El-Khattam and Salama, 2004; Bayod-Rújula, 2009). Optimal allocation of RES in DS is indeed a complex mathematical problem because it involves multiple objectives optimization subject to bus voltage, feeder capacity, and RES penetration constraints, considering the varying nature of loads, generation, load growth aspects, and the large scale of DS. Also, there are non-linear relations between the system variables, prompting a need to use evolutionary algorithms for solving the optimal RES allocation problem. Numerous studies are investigating the optimal placement of Distributed Generators (DGs) in the Distribution System (DS) using techniques such as Pareto-based multi-objectives using the Strength Pareto Evolutionary Algorithm (Ramsami and Ah King, 2019), PMBSA (Arubolu et al., 2024), MOPSO (Ba-swaimi et al., 2025), weighted multi-objective optimization using the Exponential Distribution Optimizer (EDO) and White Shark Optimizer (WSO) (Nassar et al., 2025), and customized GA (Maghami et al., 2025). Multi-objective Ant Lion Optimizer (Kalita et al., 2024) and the Multi-objective Moth Swarm Algorithm (Sharifi et al., 2021) are recently developed novel algorithms which can be used for RES allocation in DS. Due to nonlinear loads and inverter-based RES, harmonic problems are becoming increasingly common in DS. The harmonics these devices produce distort AC voltage and current (Wagner et al., 1993). Harmonic Power Flow (HPF) calculation methods are very important for distribution system analysis and design since they aid in determining the degree of harmonic distortion (Marti et al., 1991). Electric distribution systems commonly use power filters to lessen harmonic impacts. Power filters compensate for reactive power, raise the system power factor, lower harmonics, and decrease power losses (Ko et al., 2009; Chou et al., 2000; Chen, 2003). A DS’s performance in the presence of harmonics and unbalanced circumstances was demonstrated using an additional transient’s program (Manjure and Senior, 2002). For each bus in DS with various non-linear loads, the THD of voltage is calculated using a decoupled method in (Ulinuha et al., 2007). A multi-objective harmonic filter placement strategy based on weighted sum (Mahlalela et al., 2015) is employed in a balanced DS using a genetic algorithm (GA). Small balanced DS were used to test the proposed approach, with the loads being taken to be constant power loads alone. An overview of the evolution of APF technology is provided in (Salam et al., 2006). Additionally, the paper examines various reference signal estimate methods, which are essential to the APF. The issues of harmonic distortion and how they affect electric power quality are briefly discussed. In order to enhance the harmonic condition, voltage profile, and reduce network losses of DS, a modified Particle Swarm Optimization (PSO) technique is described in (Rezapour et al., 2024) for the simultaneous optimal allocation of capacitors and APFs. In (Jannesar et al., 2019) a GA and Monte Carlo simulation-based approach for optimal probabilistic placement and scaling of single-tuned PPFs is introduced. An evaluation of the suggested approach was conducted on an Iranian 383-bus LV unbalanced radial DS. It should be mentioned that since the modeling approach in this paper is based on measurement, harmonic interactions between nonlinear loads and PV systems have not been taken into account; thus, it is worthy to address this issue in future studies. In (Karadeniz et al., 2023) Photovoltaic-based DG units (PVDGUs) and passive harmonic filters are placed optimally in an IEEE 33-bus system to maximize hosting capacity while minimizing the bus voltages’ RMS variation and overall harmonic distortion. In (Lakum and Mahajan, 2021) adaptive grey wolf optimization algorithm is used to optimally place PVDGUs and APFs in a balanced DS to maximize cost saving. In (Karadeniz et al., 2023; Lakum and Mahajan, 2021) the authors didn’t consider varying nature of PVDGUs and load. Although load demand increases in practice, the results of earlier research did not take into consideration the growth of load for various types of loads, which is a crucial factor to consider when solving RES allocation problem. A case study on how to appropriately size and position RES in a DS to fulfil constraints and reduce overall system costs is given by (HassanzadehFard and Jalilian, 2018). The suggested method was tested on a balanced 31-bus DS.
The conclusions drawn from the literature review are summed up as.
• Majority of earlier studies optimized RES allocation considering linear loads (Arubolu et al., 2024; Biswas et al., 2019; Ramsami and Ah King, 2019; Nassar et al., 2025; Maghami et al., 2025; Ba-swaimi et al., 2025) while only few studies took nonlinear loads into consideration (Karadeniz et al., 2023; HassanzadehFard and Jalilian, 2018). RES allocation results in THD violation due to the harmonic spectrum of inverter-based DG and nonlinear loads. Hence, there is a need to place RES and power filters simultaneously for reducing THD. In earlier studies, while accounting for non-linear nature of loads during UDS planning, researchers have concentrated either on optimal allocation of power filters (Ko et al., 2009; Chou et al., 2000; Mahlalela et al., 2015; Salam et al., 2006; Rezapour et al., 2024) or optimal allocation of power filters in the presence of RES (Jannesar et al., 2019; Lakum and Mahajan, 2021). For a dependable and cost-effective system operation, both of them must be installed at the same time, albeit this has not yet been evaluated for analysis.
• Because of increasing load demand, system planner has to account for load growth factor also while solving RES allocation problem in URDS with nonlinear loads. There is a lack of literature on the simultaneous consideration of the load growth factor along with varying nature of both generation and load (HassanzadehFard and Jalilian, 2018; Arubolu et al., 2024).
• Due to load growth and the installation of RES in UDS, some buses may encounter voltage limit violations. This specific problem had not been addressed in earlier research.
• Numerous studies have been published that use various techniques to optimize a single-objective function in order to find the ideal size and location of RES (Biswas et al., 2019) or power filters (Chou et al., 2000; Salam et al., 2006; Karadeniz et al., 2023; Lakum and Mahajan, 2021). Some works also employed weighted sum based multi-objective strategy to improve DS performance (Ramsami and Ah King, 2019; Ko et al., 2009; Mahlalela et al., 2015; Nassar et al., 2025; Maghami et al., 2025), but this may not result in optimal RES allocation because the solution relies on the weights provided to the individual objective functions. The Pareto front-based, non-dominated sorting algorithms (Arubolu et al., 2024; Ba-swaimi et al., 2025) may help get better optimal solutions since they are independent of weight selection. To tackle the simultaneous optimal placement problem of RES and power filters; however, no one used the superior pareto-based multi-objective technique.
This work’s primary objectives, which are covered in detail below, are to address the issues described above.
• A new approach is proposed that employs PMBSA to determine the optimal size and placement of RES and power filters in UDS. RES units that rely on inverters create harmonics that negatively impact the system’s performance. The harmonic spectrum of inverter-based DG units is also taken into consideration along with non-linear loads in this work. When allocating RES, the varying nature of both generation and load is taken into consideration using Probability Distribution Functions (PDFs). This study examines load growth for the system’s available loads in order to satisfy demand, and it suggests a practical solution that expands the size of RES at their original sites.
• The results of optimal RES and passive power filter planning are compared to RES and active power filter planning in a DS to ascertain which combination improved DS performance better. The results are also contrasted with those of the traditional MOPSO and NSGA-II.
• During placement of RES and power filters in UDS, due to load growth, there could be voltage limit violations (V > 1.05 p.u. and V < 0.95 p.u.) problems. This study finds the best place for the AVR/SCB to overcome those problems.
There are eight sections further in this study apart from the introduction. Section 2 discusses RES modelling, whereas Section 3 explains power filters design. Section 4 discusses how load growth affects the performance of the DS. In Section 5, the problem formulation process is explained. The overview of PMBSA and its application to the optimal allocation studies are explained in Section 6. The PMBSA, NSGA-II and WSA results are discussed in Section 7, and the conclusion is given in Section 8.
2 Resource analysis for renewable energy
RES in this study includes wind and photovoltaic. Generation sources and loads need to be precisely described in order for RES to be designed and distributed in UDS efficiently. Probabilistic models are used in this work for the design of RES. This section provides a basic understanding of the modelling of the RES system.
2.1 Solar energy PV system modelling
The Weibull PDF is employed to characterize the stochastic behaviour of solar irradiance because, unlike other PDFs, it matched the irradiance data at the chosen location satisfactorily. For each time period ‘t,’ the Weibull distribution for solar irradiance
By splitting the continuous PDF into several states, the solar PV output power in each time segment is calculated. For a particular time interval “t” or hour, the average output power of the solar PV array (Patibandla et al., 2021) is provided by Equation 2.
The likelihood of solar irradiance for a specific nth condition throughout any given period of time is provided by Equation 3.
2.2 System modeling for wind power
The random behaviour of wind speed over a certain time period is represented by the Weibull PDF since it offers a good fit for the wind speed distribution. Wind speed wtbs (m/s) in any time ‘t’ has a Weibull PDF given by Equation 4.
Wind turbines’ (WT) average power output over a specified time period ‘t’ is given by Equation 5 (Patibandla et al., 2021).
For every given time frame “t” or hour, the likelihood of the wind speed is provided by Equation 6.
2.3 Load modeling
A normal probability distribution function is used to describe the random behaviour of the load. Equation 7 provides the PDF for load demand for any period ‘t’.
For a time segment “t,” the hourly average load demand is provided by Equation 8 (Patibandla et al., 2021)
In a given time period “t” the probability of load demand is given by Equation 9
3 Power filters
Power filters are instruments used to remove undesirable components from electrical power systems. Power filters are categorized into passive power filters and active power filters.
3.1 Passive power filters
Reactors and capacitors arranged in resonant circuit architecture and adjusted to the frequency of the power harmonic order that needs to be removed make up a passive filter. When designing a passive filter, the following steps are followed.
Step 1: Use Inverter based DG harmonic spectrum data and harmonic spectrum data of nonlinear loads to run HPF and identify the most dominant frequency components.
Step 2: Choose the filter type, tuned frequencies of passive filters, and the number of frequencies to be attenuated. Determine the specifications of passive filter unit and assign a specific amount of reactive power that it is supposed to provide which is reactive power demand (
The inductance (
Where, H is number of dominant harmonic frequencies to be attenuated, the quality factor (
Step 3: If the passive filter units’ resonant frequencies are close to the present harmonic frequencies generated by the non-linear load, adjust the tuned frequency and adjust the parameters using Equations 10, 11. This prevents the supply system and passive filter from resonating in parallel.
Step 4: After installing the filters, run the HPF to determine the harmonic distortion of the bus voltages.
3.2 Active power filters
The basic idea behind APF is to use power electronics technologies to produce specific current components that cancel out the harmonic currents caused by the nonlinear load. Using sensors, the APF detects harmonic distortion in the power system. The APF generates a compensating current that is equal in size and opposite in phase to the harmonic distortion. APF injects a compensating current into the power system, removing harmonic distortion and creating a sinusoidal, clean waveform (Rezapour et al., 2024). Use Inverter based DG harmonic spectrum data and harmonic spectrum data of nonlinear loads to run HPF to find RMS value of current to be injected by APF’s. Using the Equation 12, the RMS value of an APF’s injection current is determined:
4 Distribution system effects of growing loads
Distribution systems naturally experience load growth, but planning engineers face a great deal of difficulty in making the system adapt to load growth without affecting service quality. Installing a new substation or increasing the capacity of an existing substation will boost the DS capacity to handle the yearly increases in demand. Although it is very costly to install a new substation, adding RES units closer to the heavy load areas can increase the capacity of the current substation. Using the Equation 13, the effect of the annual increase on the system’s reactive power (
Initially connected load (
5 Problem formulation
As daily electricity use increases and also the usage of nonlinear loads is increasing, existing DS are unable to meet the demand while satisfying THD constraints. Power filters need to be used to reduce distortion due to nonlinear loads and deployment of RES is needed to meet the demand. This study optimizes the integration of RES and power filters into UDS to reduce power loss, THD, and cost.
5.1 Total real power loss (TPL)
One goal of adding RES to the grid is to decrease the overall power loss. Power loss (TPL) includes losses due to fundamental current and harmonic currents (Mahlalela et al., 2015; Satish et al., 2021). The TPL mathematical formula is given by Equation 14.
5.2 Total harmonic distortion (THD)
THD measures the extent to which a voltage or current waveform deviates from its ideal sinusoidal shape. THD measures the unwanted harmonics that are present in the waveforms of voltage or current (Satish et al., 2021). The THD mathematical formula is given by Equation 15.
5.3 Total cost (TC)
The annualized total cost includes grid sales and purchase, wind generator costs, and PV system costs (Ahmadi et al., 2021). The objective function can be expressed as
PPFs and APFs are used to reduce prominent harmonics when THD violation occurs. The Total Cost function will include CPPF (Jannesar et al., 2019) and CAPF (Rezapour et al., 2024).
Shunt capacitors and AVR are used to reduce voltage violations. The function for total cost includes these. AVR modelling with modified tap locations was taken from (Arubolu et al., 2024). The AVR cost is calculated using the current rating data (Szuvovivski et al., 2012), while the cost of the switching capacitor is derived from (Selim et al., 2019).
The set of lines with AVR attached is denoted by n.
Where
Where c might be PV (Solar)/Wind Turbine (Wind)/AVR/APF/PPF/Capacitor (ca), and the interest rate ir of 10% is assumed.
5.4 Limitations
Objective functions TC, TPL, and THD are minimized under specific constraints outlined in Equations 24–29.
5.5 Formulation with multiple objectives
The multi-objective optimization problem can be written as Equation 30 if the conflicting objective functions are
Where F is the main objective and, in this work,
A Pareto-front-based multiple-objective optimization approach is used to find non-dominated solution set. RES installation, RES along with power filter installation, considering multiple conflicting objectives, are complex computational optimization problems that require a computationally strong algorithm like PMBSA to determine the ideal size and location of RES and power filters.
6 Optimizing the distribution of RES and power filters with the use of the pareto multi-objective back track search algorithm
The RES and power filter allocation problem is being addressed by multi-objective optimization algorithm PMBSA (Arubolu et al., 2024), which is a modified version of BSA technique that can solve single-objective optimization problems. The structure of PMBSA is much simpler than that of the other multi-objective optimization algorithms, and it has a single control parameter, which makes it a suitable approach to solve even multimodal optimization problems. Unlike many evolutionary approaches, PMBSA does not suffer from premature convergence or high computation time, nor is its performance overly sensitive to its control parameter. PMBSA efficiently explores the search domain by using crossover and mutation operators. These operators are entirely distinct from those employed by evolutionary programming and genetic algorithms, among other evolutionary techniques. Another benefit of PMBSA is its memory, which establishes the search direction depending on earlier generations. The steps for using PMBSA to find Pareto optimum solutions (Arubolu et al., 2024; Brigatto et al., 2011) are provided in the Appendix section.
6.1 Flowchart for using PMBSA to achieve the best possible allocation
The suggested approach accounts for the fluctuating characteristics of wind speed, load demand, and irradiance for RES modelling while distributing RES in a UDS. Figure 1 illustrates the procedures for using PMBSA to solve the optimal allocation of RES and power filters problem. Wind speed and irradiance data were collected at Gangadevipalli, a small village in Thondur mandal, Cuddapah district, Andhra Pradesh state, India (Onefivenine, 2025). Wind and solar data for 3 years were obtained from the website http://niwe.res.in of the National Institute of Wind Energy. The hourly load demand is taken from a typical a residential neighbourhood close to Gangadevipalli. The four seasons of a year are separated into the following categories: monsoon (July to September), post-monsoon (October to November), summer (March to June), and winter (December to February). There are 96 segments taken into consideration in this study because each season is treated as a single, typical day with 24 hourly sections.
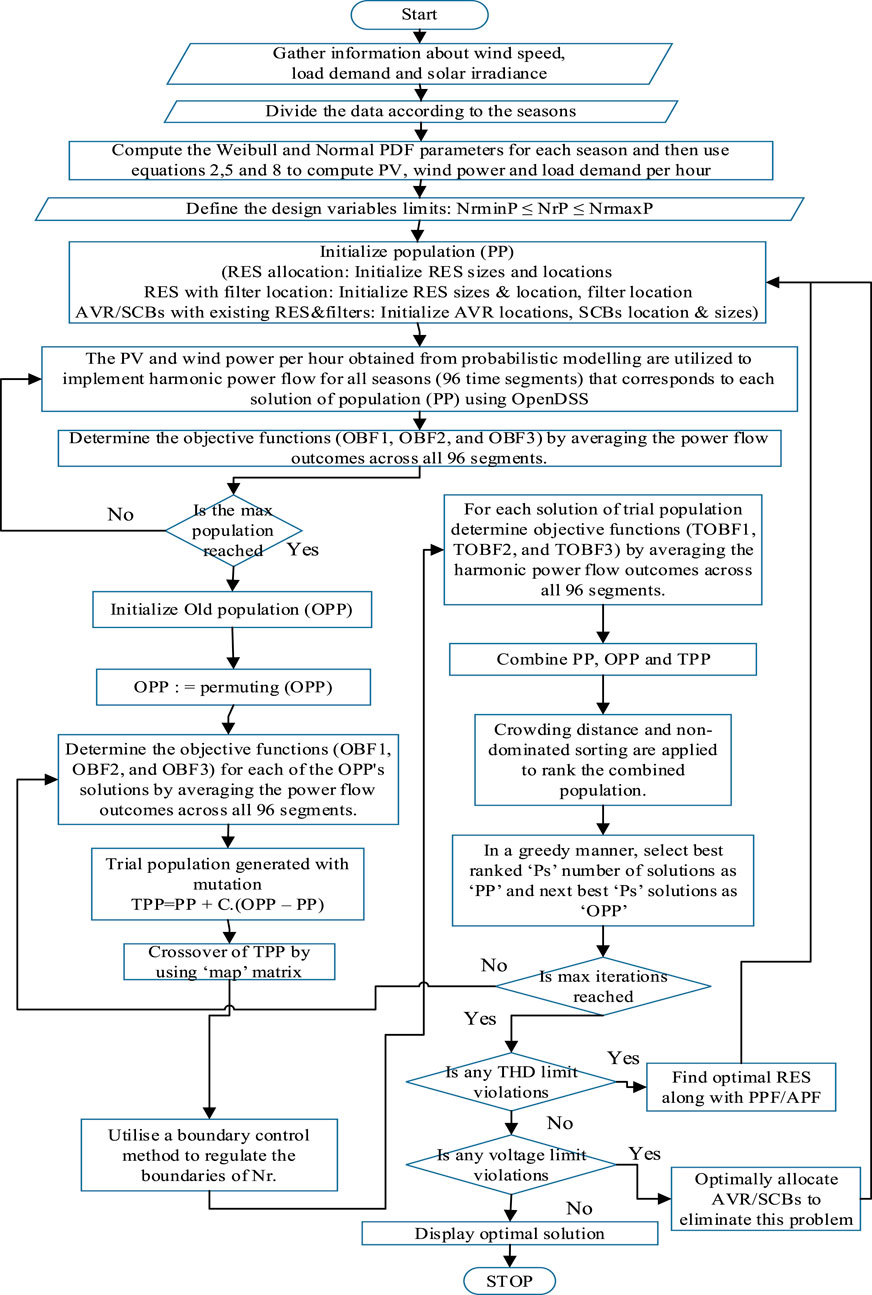
Figure 1. PMBSA application flow chart.
7 Results and discussion
The proposed approach makes use of the OpenDSS and MATLAB software and is implemented in MATLAB 2017a running on a 2.9 GHz core i3 processor. Wind speed, solar irradiation, and load demand data are the inputs for estimating RES generation and load demand. The optimal placement and size of RES in a UDS are determined by taking into account the load growth, non-linear and linear load types, and the varying nature of both generation and load. This is accomplished by the use of the efficient PMBSA algorithm, while reducing THD, cost, and losses in the presence of load growth. The PMBSA algorithm settings used in this study were population size (PPS = 50) and itrmax = 200. The cost of energy supplied to the grid and purchased is estimated to be 0.077 USD/kWh (Arubolu et al., 2024). 2.7 m/s, 25 m/s, and 11 m/s are the cut-in, cut-out, and rated wind speeds of the wind turbine generator used in this work, respectively (Premono et al., 2017). 300Wp is the rated capacity of a solar PV panel (Arubolu et al., 2024). The cost information for wind turbines and solar PV is sourced from (Ahmadi et al., 2021), and it is based on an analysis of the US market. Also, cost details of all components used in this study are included in Supplementary Table A1. Equations 16–23 and these data are used to compute the annualized total cost. The cost is then divided by 8,760 to get the cost per hour.
The IEEE 123-bus test system (Distribution test feeders, 2010) is used to evaluate the performance of the proposed approach. The harmonic spectrum of the RES-based DGs with inverters is extracted from (HassanzadehFard and Jalilian, 2018), while the harmonic source data for the IEEE 123-bus system is acquired from (Ulinuha et al., 2007). RES penetration is limited to 70% of the system’s active power consumption. The power factor of RES is assumed to be 0.85 in this work. This study examines two cases to evaluate RES’s performance. Case I (C-I): DS without RES (Base case) and Case II (C-II): Optimal allocation of wind and solar RES in DS.
The objective function’s values are calculated and regarded as base case outcomes when RES is not included in the system, as in case I. Case II enhances the DS’s performance by reducing TPL, THD, and TC with the integration of wind and PV sources into UDS, whose ideal sizes and locations are acquired using PMBSA. RES penetration lowers overall costs and power losses, which improves DS behaviour, according to results presented in Table 1. The RES’s harmonic injection has led to an increase in harmonic distortion. However, the loss and cost reduction that are seen may eventually diminish as the system load increases over time. Thus, studying the impact of load growth on system performance is crucial. Table 1 shows the findings of this study’s additional analysis of the impact of load growth on RES system performance.
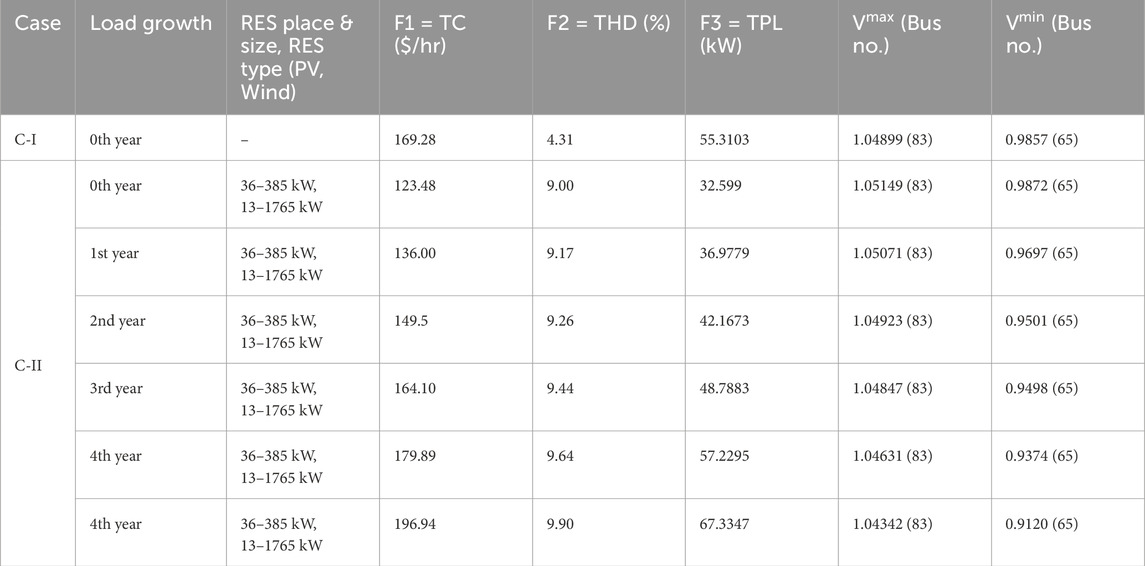
Table 1. IEEE 123-bus performance without RES, with RES, and RES with load growth.
Table 2 shows that the objective function values increase from the first to the fifth year as the load increases over a 5-year period while maintaining the same RES size and location. Hence, this study focused on adjusting RES annually in relation to load variance in order to improve the DS’s performance under load growth. Three scenarios are outlined for C-II, which are listed below, in order to determine the best approach to be taken for RES integration:
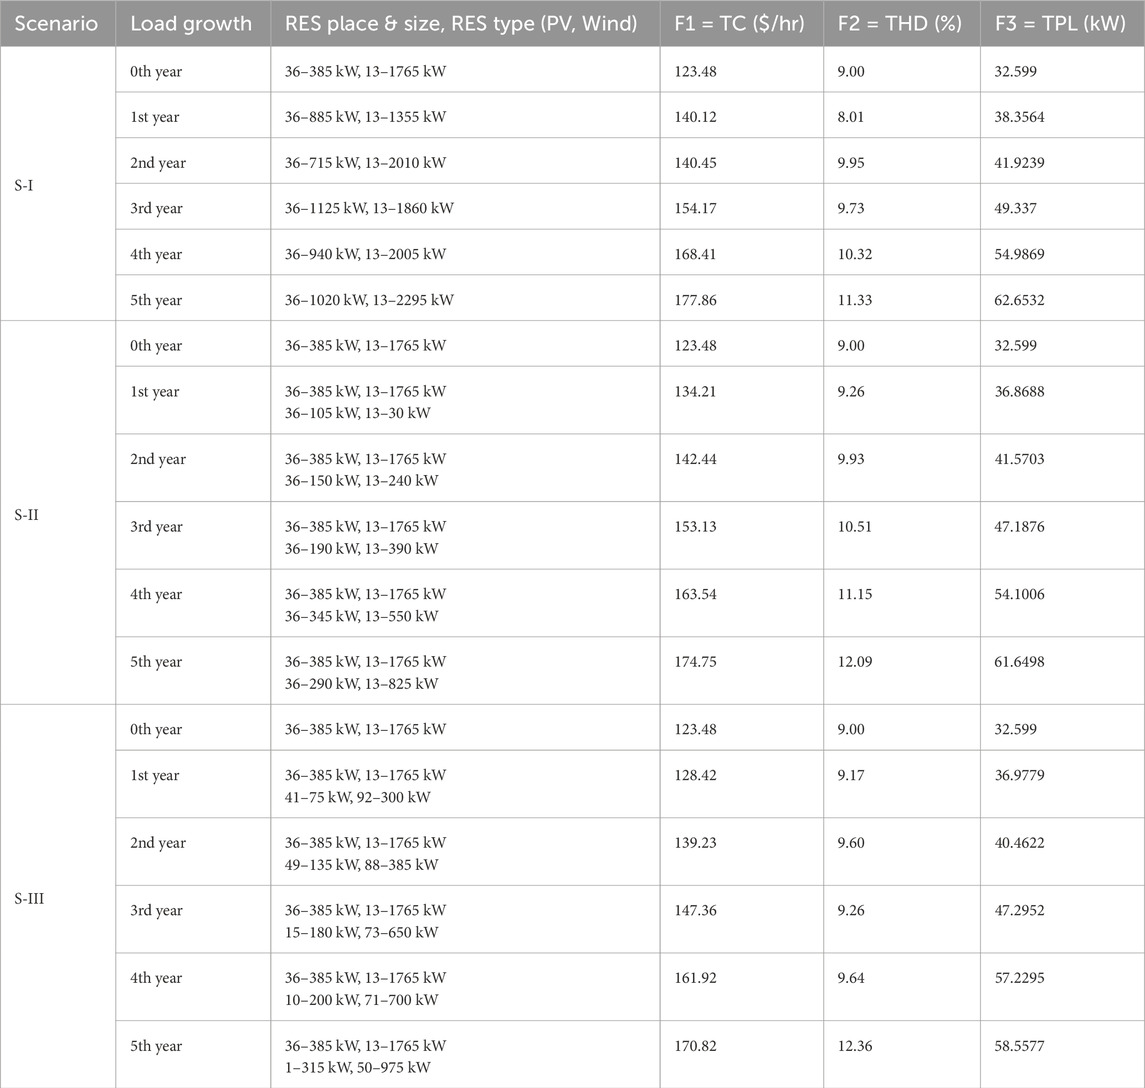
Table 2. IEEE 123-bus system’s optimal RES allocation for S-I, S-II and S-III under load growth.
Scenario I(S-I): Wind and solar energy resources are distributed in the UDS, with RES sites being fixed as decided in the base (0th) year, but RES sizes optimized annually.
Scenario II(S-II): Distribution of wind and solar energy resources in UDS, with RES sites being fixed as decided in the base (0th) year, but requiring a further increase in RES size beyond that determined in the base year to meet demand growth.
Scenario III(S-III): In UDS, optimal solar and wind energy resource sizes and locations are found considering the base (0th) year’s load demand. The optimal site for additional RES size is determined to accommodate load growth.
To illustrate the effectiveness of the previously suggested scenarios for optimal RES allocation under load growth conditions, the values of the objective function for each year are shown in Table 2. From a loss and cost reduction perspective, S-III is found to perform better than S-I and S-II. The RES size may decrease or increase as the load increases. This adjustment is made annually in S-I. This plan may turn out to be very costly and unfeasible because it asks for shrinking the size 1 year and then enhancing it the following, or vice versa. Even though S-III yields superior benefits, it is not logistically viable to move the additional RES sizes annually to different locations in accordance with load growth. Since S-II is a more realistic strategy that permits an expansion of RES size at the original RES sites, it was the subject of this study for further analysis.
It is observed that THD value exceeds the system’s maximum allowable limit. The fifth, seventh, and eleventh harmonic voltage levels are the most prevalent at all buses, according to the HPF results for S-II in the base year. Dominant voltage harmonics that have been normalized with respect to fundamental voltage are shown in Figure 2a for bus 40 of IEEE 123-bus system where there is large non-linear load. Therefore, in addition to RES, power filters such as PPFs and APFs are utilized in this study to reduce harmonic distortion while satisfying other objectives. As described in Section 3.1, filter parameters are computed to attenuate these prominent harmonics. The optimal RES, PPF sizes, and locations, along with objective function values obtained by PMBSA are shown in Table 3.
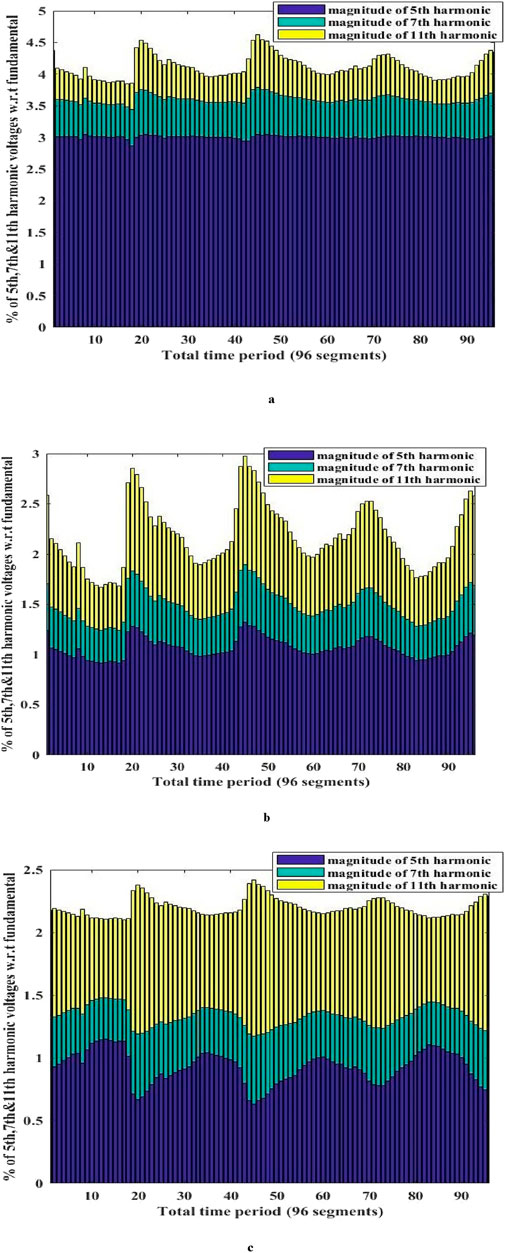
Figure 2. (a) Plot of dominant voltage harmonics with respect to fundamental in the IEEE 123-bus system at bus 40 without Power filters in base year. (b) Plot of dominant voltage harmonics with respect to fundamental in the IEEE 123-bus system at bus 40 with PPF in base year. (c) Plot of dominant voltage harmonics with respect to fundamental in the IEEE 123 bus system at bus 40 with APF in base year.
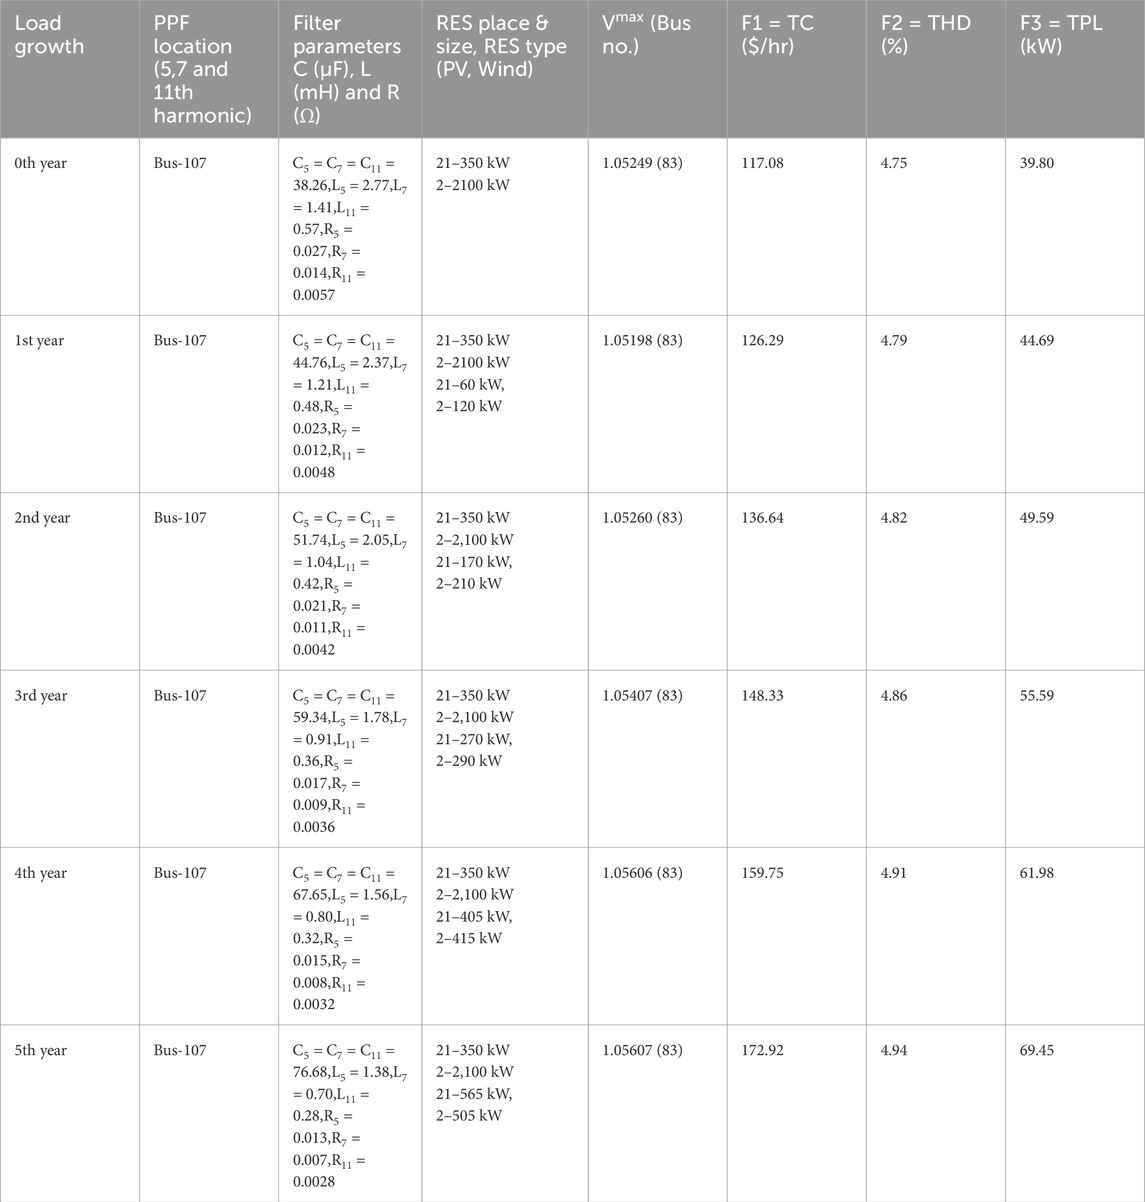
Table 3. IEEE 123-bus system’s optimal RES and PPF allocation for S-II.
Normalized dominant harmonic voltages after installing PPFs are shown in Figure 2b, which illustrate the extent to which PPFs reduce harmonic distortion. The findings in Table 3 show that the simultaneous placement of RES and PPF can lower objective function values while meeting THD constraints. However, the THD value obtained in the fifth year was 4.94%, which is very close to the upper allowable limit. The THD value might be higher than 5% in the following years. Therefore, the authors of this work investigated the possibility of placing APFs in addition to RES in order to see if DS performance might be improved over that of placing PPFs with RES. As described in Section 4.2, the injection current of APFs is computed. Table 4 displays the best RES sizes and locations, APF locations found using PMBSA. Figure 2c displays the normalized dominant harmonic voltages after installing APFs. Figure comparison shows that harmonic reduction is more noticeable with APF than PPF.
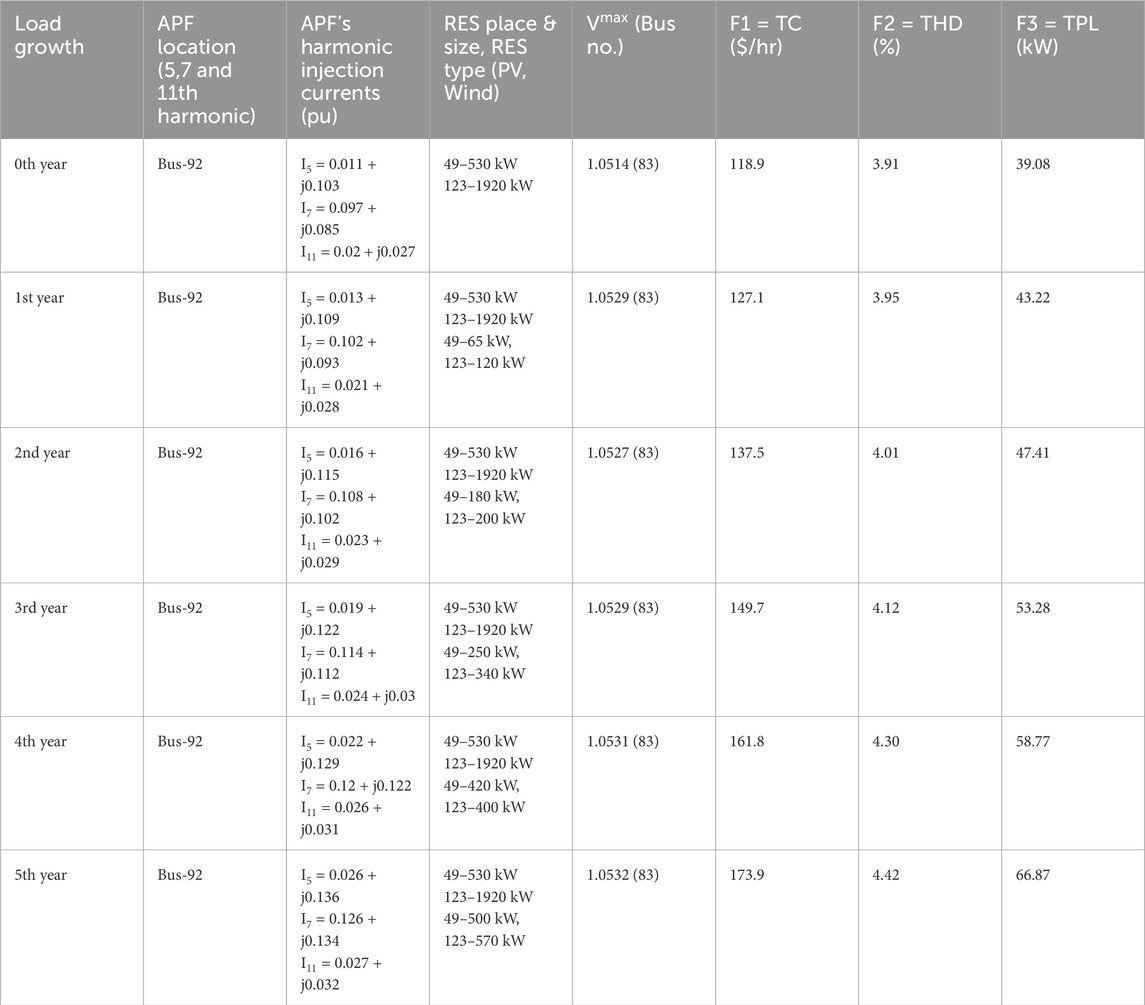
Table 4. IEEE 123-bus system’s optimal RES and APF allocation for S-II.
Comparing the results of Scenario II in Table 2 with Tables 3, 4 makes it clear that the system’s power losses are lower and its harmonic distortion is higher than permitted limits when power filters are not present. However, THD decreases when power filters are included in the system, although power loss somewhat rises as RES sizes and placements are altered to meet THD restrictions (Tan et al., 2017). The THD comparison plot utilizes the base year and 5th year outcomes for S-II with PPF and APF, along with data for C-I and C-II, as illustrated in Figure 3. The comparative figure indicates that APF can more effectively reduce THD and voltage limit violations in addition to other objectives.
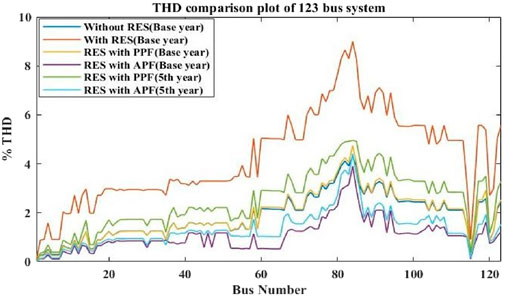
Figure 3. THD comparison plot of 123-Bus system.
According to the results presented in Tables 3, 4, the best distribution of RES and power filters enhances DS performance by reducing power losses, total cost, and THD. Nonetheless, the power flow results show that the test system violates the voltage limit. In the IEEE 123-bus system, bus 83 consistently exhibits over voltage limit violations. In order to maintain bus voltages within permissible limits, AVRs are utilized in DS in conjunction with the existing RES and power filters. A new node, designated, <node number RG > will be created with the addition of AVR.
Purpose of AVR placement is to control voltage and maintain the system voltage within permitted bounds; however, this placement results in a lower lagging power factor condition (Arubolu et al., 2024), which may cause the THD value to rise. In this situation, it is required to install both AVRs and SCBs in together to reduce the THD and maintain the voltage within permitted bounds. When RES and PPFs are placed simultaneously, there are more voltage violations; therefore, AVRs alone are insufficient to limit violations and enhance other objectives due to low lagging power factor. For this reason, AVRs and SCBs are placed together to limit violations whose results are presented in Table 5. Table 6 presents the results of adding AVRs to a system that already has RES and APFs. Since there are fewer voltage limit violations due to the superior harmonic mitigation capabilities of APF, only AVRs are employed to solve this issue.
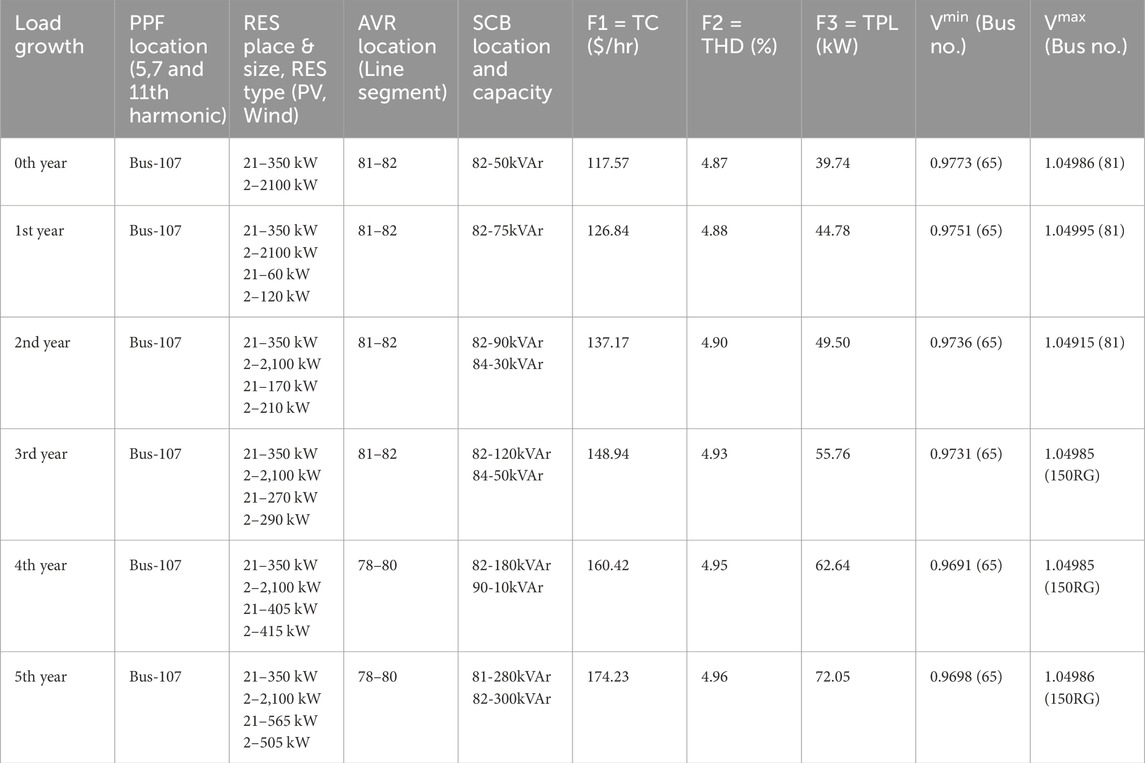
Table 5. IEEE 123-bus system’s optimal distribution of RES, PPF, and AVR/SCB for S-II.
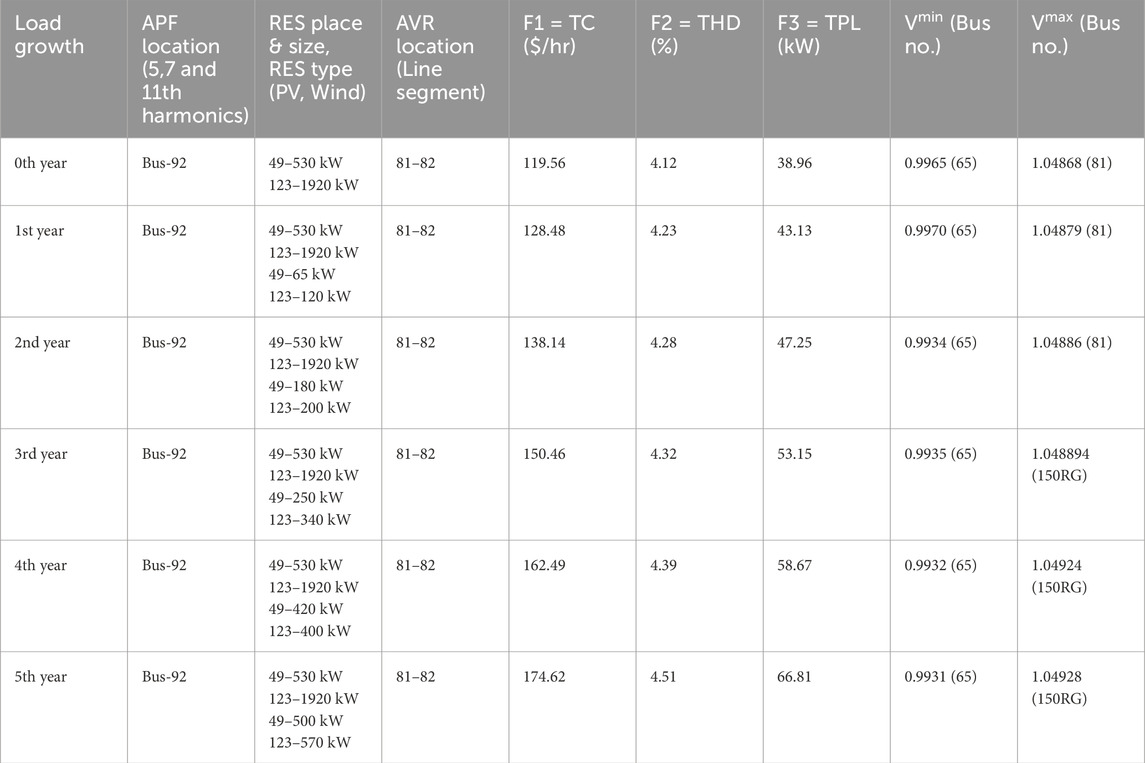
Table 6. IEEE 123-bus system’s optimal distribution of RES, APF, and AVR for S-II.
Sensitivity tests with 5% and 10% yearly load growth are done to highlight the robustness of the proposed approach in improving DS performance, and the respective tabulated results are included in Supplementary Appendix SB. These results presented in Supplementary Tables A3, A4 indicate that THD increases due to load growth, and there will be voltage limit violations apart from increased cost and losses. To address these issues, the proposed approach of optimal RES and APF allocation is done, whose results are presented in Supplementary Tables A5, A6. When the load growth is 10%, even after optimal RES and APF allocation, there are still some voltage violations, and to address that, AVRs are also placed. And the respective results are presented in Supplementary Table A7, based on which it can be concluded that the proposed approach works even when the system load growth rates are high.
7.1 Comparison of proposed PMBSA with MOPSO and NSGA-II
PMBSA’s performance is evaluated in comparison to those of the well-known NSGA-II and MOPSO. The results of a comparison of the simultaneous deployment of AVRs, RES, and APFs utilizing PMBSA, NSGA-II, and MOPSO are shown in Supplementary Table A2. The findings suggest that using PMBSA rather than NSGA-II and MOPSO improves DS performance. Comparison metrics such as the spacing metric (SP-metric) and the convergence meter (C-metric) (Arubolu et al., 2024) are used in this work to evaluate the quality of Pareto-front solutions produced by multi-objective optimization algorithms.
According to the authors’ thorough sensitivity testing, all of the algorithms in this study have a population size (P) of 50, a maximum number of iterations of 200, and each algorithm is run 50 times. Mix rate of 1.0 is chosen for PMBSA. NSGA-II’s mutation and crossover probabilities are set at 0.35 and 0.875, respectively. MOPSO’s inertia weight (W), personal best weight (c1) and leader weight (c2) are set as 0.4, 2.1 and 1.9 respectively.
The mean C-metric values for the IEEE 123-bus system under scenario II for the fifth year are shown in Table 7. With C(NSGA-II, PMBSA) of 0.39, NSGA-II dominates 39% of PMBSA solutions, and with C (MOPSO, PMBSA) of 0.625, MOPSO dominates 62.5% of PMBSA solutions. The C(PMBSA, NSGA-II) of 0.61 indicates that the average PMBSA dominance of NSGA-II solutions is 61%, while the C(PMBSA, NSGA-II) of 0.7667 indicates that the average PMBSA dominance of MOPSO solutions is 76.67%. It is suggested that PMBSA is more capable of identifying better solutions. Computation times of PMBSA, NSGA-II, and MOPSO are contrasted in Table 7. PMBSA takes less computing time than NSGA-II and MOPSO. The table’s mean SP-metric values indicate that PMBSA’s metric value is lower than NSGA-II and MOPSO. A lower SP-metric value indicates that the solutions are distributed more uniformly.
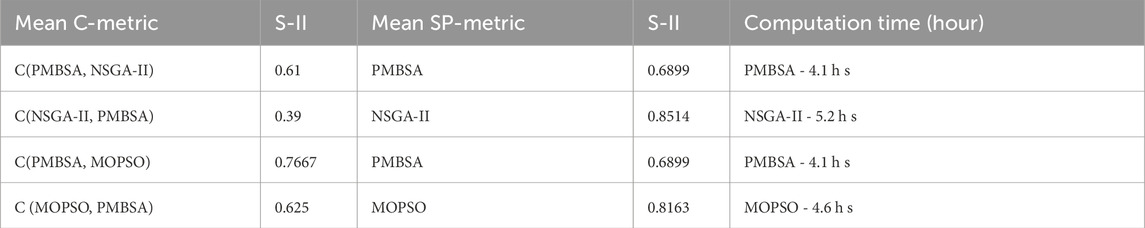
Table 7. C-metric, SP-metric, and computation time comparison for PMBSA versus NSGA-II and MOPSO.
Table 8 displays the mean, variance, and Standard Deviations (SD) of the findings obtained by applying the suggested PMBSA to solve optimal RES and APF allocation problem. The outcomes are contrasted with those derived from NSGA-II and MOPSO algorithms. Bar graphs showing the variance and standard deviation of the objective functions obtained using the three algorithms are presented in Figure 4. From the results, it is evident that the variance and SD of the PMBSA are significantly lower than those of the NSGA-II and MOPSO algorithms, confirming the convergence ability of PMBSA for better results.
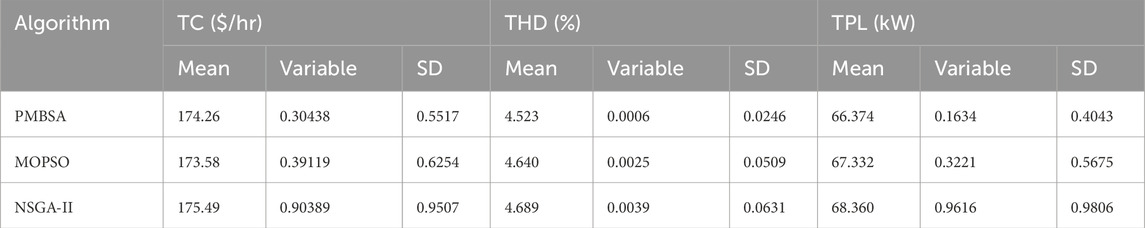
Table 8. Comparison of various algorithms for objective functions, including mean, variance and standard deviation.
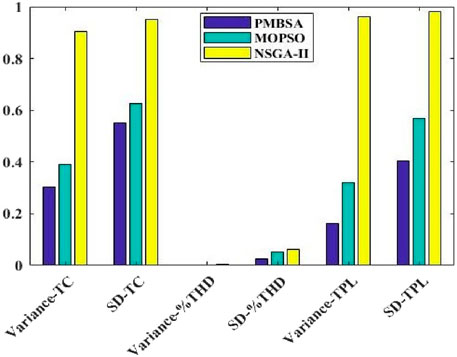
Figure 4. Variance and standard deviation bar graphs for the optimal RES and APF distribution.
7.2 Comparison between pareto-front based proposed approach and WSA
WSA (Ramsami and Ah King, 2019; Ko et al., 2009; Mahlalela et al., 2015) is a conventional method for reducing a multi-objective optimization problem to a single-objective problem. This is accomplished by applying weights to each objective function. WSA mathematical formula is given by Equation 31.
With weighting coefficients
RES, PPFs/APFs, AVR, and SCBs are allotted in this study using WSA in order to minimize objective functions and mitigate fifth, seventh, and eleventh harmonic components in a 123-bus system. The findings of the proposed approach employing PMBSA are shown in Tables 9, 10, along with a comparison to WSA for the IEEE 123-bus system.
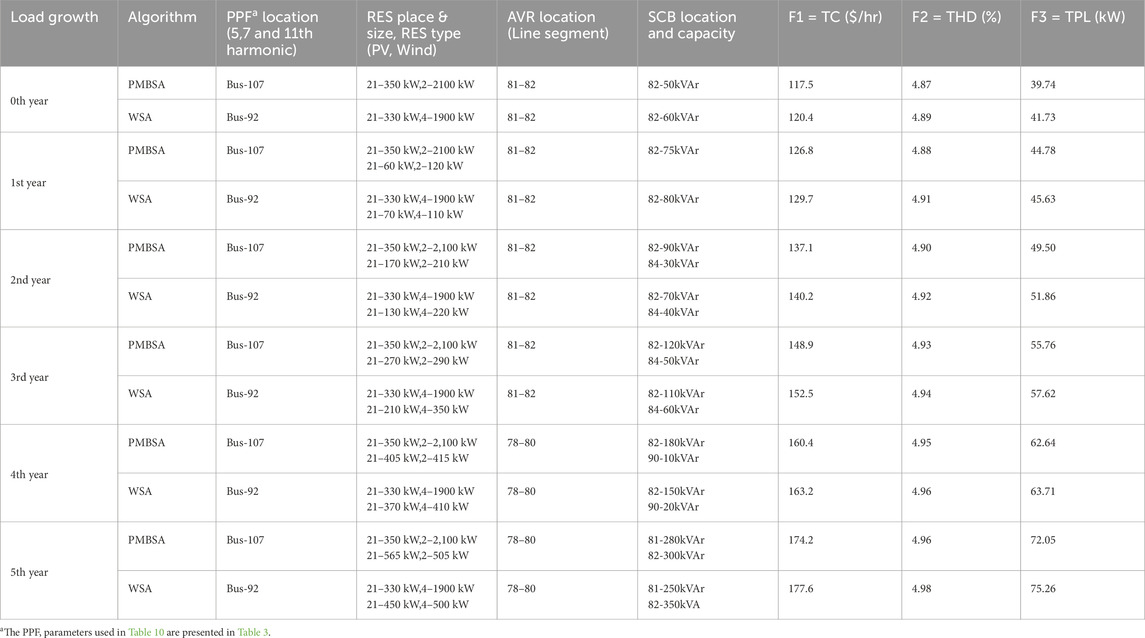
Table 9. Comparison of the proposed approach with WSA for the optimal RES, PPF, AVR, and SCB allocation in the S-II case for the IEEE 123-bus system.
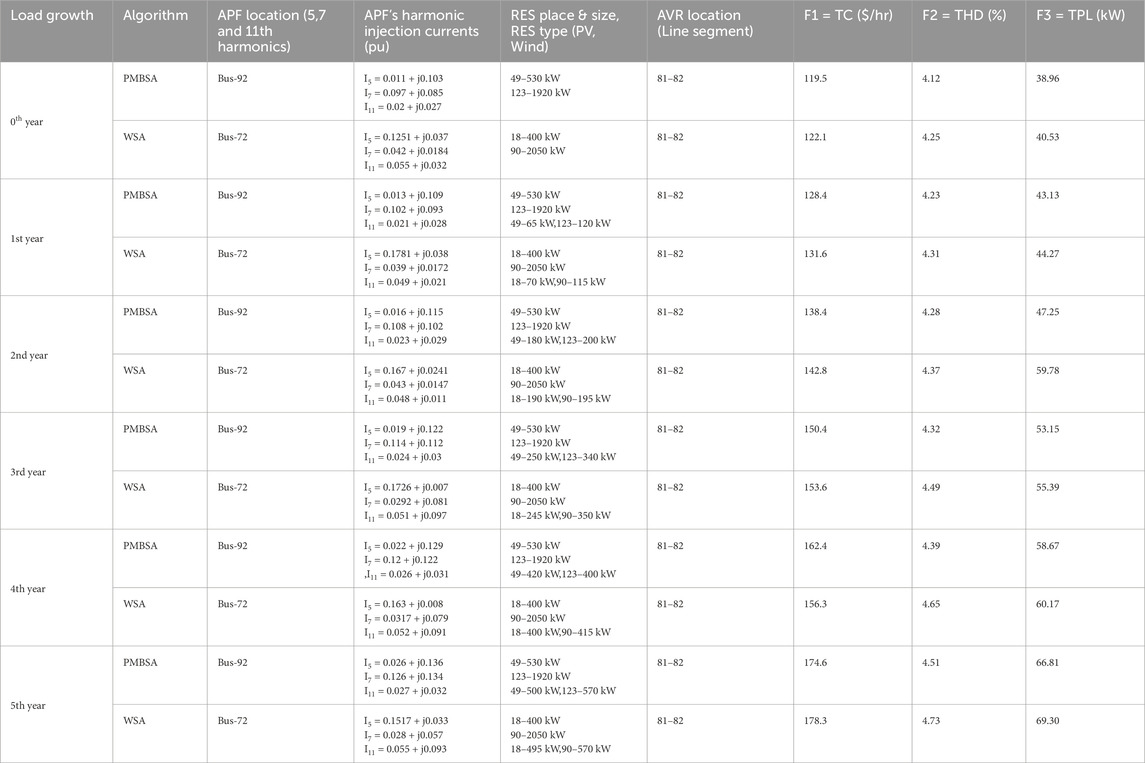
Table 10. Comparison of the proposed approach with WSA for the optimal RES, APF and AVR allocation in the S-II case for the IEEE 123-bus system.
Table 9, 10 display the results of the proposed approach as well as WSA for comparison purposes in case of the IEEE 123-bus system. When comparing the proposed approach with WSA for the optimal distribution of RES, PPF/APF, AVR, and SCB, the results indicate a decrease in system TPL, THD, and TC. The proposed approach outperforms WSA in terms of optimal allocation for improved DS performance.
7.3 Sensitivity analysis
The suggested method’s performance is influenced by the control parameter, which needs to be adjusted correctly for optimal outcomes. For sensitivity analysis, the mixrate is set to values between 0 and 1, with steps of 0.20. The mixrate is the only variable that is altered; the population size and maximum iteration values remain constant. Finding the ideal control parameter is done through sensitivity analysis. The optimization problem is executed 30 times for the specified population size and maximum iteration value, and the statistical indices of the best outcomes from each trial, such as the minimum, average, and maximum values, are noted. The objective functions’ statistical indices for various mixrate levels are displayed in Table 11. The results indicate that PMBSA offers superior optimal solutions when the mixrate value is equal to 1.
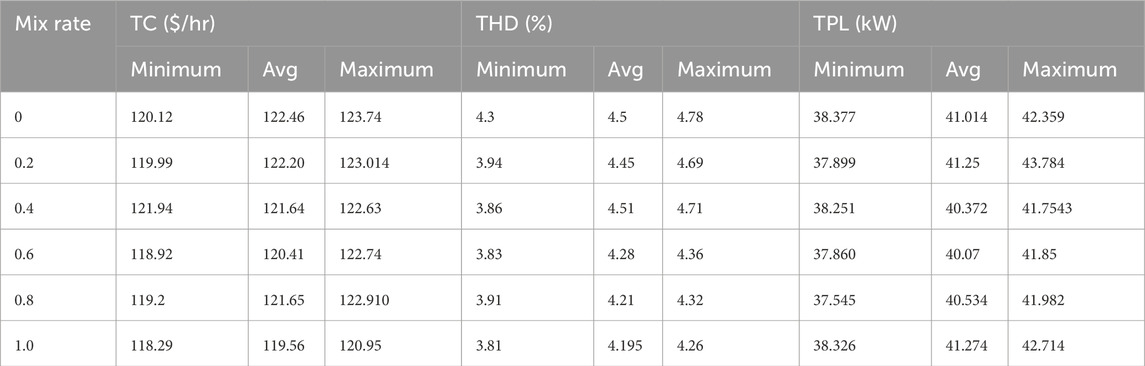
Table 11. The optimal allocation of RES, APF, and AVR for the IEEE 123-bus system in the S-II scenario is based on 30 trials with varying mix rate values.
8 Conclusion
In order to optimize the distribution of RES and power filters in an unbalanced distribution system (UDS), a novel approach is put forth that uses the Pareto front-based Multi Objective Backtracking Search Algorithm (PMBSA) to reduce Power Loss, Total Harmonic Distortion, and Cost. To ensure dependable performance, the distribution system planning process took into account both linear and non-linear load types, in addition to the varying nature of the PV and wind generating outputs, and harmonics injected by inverter-based RES. Additionally, for each type of available load, the load growth of the distribution system was considered. When the distribution system’s yearly demand increased, THD, TPL, and TC increased as well. At the same time, several buses’ voltage dropped to levels below the permitted limit. In order to enhance system performance, the proposed approach optimally increased the RES sizes to accommodate growing load demands. However, THD violations were observed, and to mitigate this issue, APF and PPFs are employed in conjunction with RES. It has been found that APF placement outperformed PPF in reducing THD, loss, and voltage limit violations. The enhanced UDS performance was demonstrated by testing the proposed approach, which combines OpenDSS and MATLAB co-simulation, on the IEEE 123-bus system. The findings show that, in comparison to the base case, i.e., without any RES, TC and TPL decreased by 27.05% and 41.06%, respectively, but THD increased by 108.8% when RES is optimally placed in the 123-bus UDS. Whereas, when RES and APF are deployed in DS, TC, THD, and TPL decreased by 29.76%, 9.28%, and 29.35%, respectively. By carefully positioning the AVR/SCBs, the proposed approach also solved the problem of voltage limit violation. The results show how well the proposed approach enhances DS performance when compared to NSGA-II, MOPSO, and WSA.
Data availability statement
The original contributions presented in the study are included in the article/Supplementary Material, further inquiries can be directed to the corresponding author.
Author contributions
LA: Conceptualization, Data curation, Formal Analysis, Investigation, Methodology, Resources, Software, Validation, Writing – original draft. RK: Conceptualization, Formal Analysis, Methodology, Project administration, Supervision, Writing – review and editing, Validation. RM: Conceptualization, Formal Analysis, Project administration, Supervision, Writing – review and editing.
Funding
The author(s) declare that no financial support was received for the research and/or publication of this article.
Conflict of interest
The authors declare that the research was conducted in the absence of any commercial or financial relationships that could be construed as a potential conflict of interest.
Generative AI statement
The author(s) declare that no Generative AI was used in the creation of this manuscript.
Any alternative text (alt text) provided alongside figures in this article has been generated by Frontiers with the support of artificial intelligence and reasonable efforts have been made to ensure accuracy, including review by the authors wherever possible. If you identify any issues, please contact us.
Publisher’s note
All claims expressed in this article are solely those of the authors and do not necessarily represent those of their affiliated organizations, or those of the publisher, the editors and the reviewers. Any product that may be evaluated in this article, or claim that may be made by its manufacturer, is not guaranteed or endorsed by the publisher.
Supplementary material
The Supplementary Material for this article can be found online at: https://www.frontiersin.org/articles/10.3389/fenrg.2025.1664533/full#supplementary-material
References
Ahmadi, B., Ceylan, O., and Ozdemir, A. (2021). A multi-objective optimization evaluation framework for integration of distributed energy resources. J. Energy Storage 41, 103005. doi:10.1016/j.est.2021.103005
Arubolu, L., Kollu, R., and Manyala, R. R. (2024). A multi-objective approach for optimal placement of renewable energy sources, voltage regulators and capacitors in radial unbalanced distribution systems. Electr. Eng. 106, 6797–6814. doi:10.1007/s00202-024-02388-7
Ba-swaimi, S., Verayiah, R., Ramachandaramurthy, V. K., Alahmad, A. K., and Padmanaban, S. (2025). Optimal planning of renewable distributed generators and battery energy storage systems in reconfigurable distribution systems with demand response program to enhance renewable energy penetration. Results Eng. 25, 104304. doi:10.1016/j.rineng.2025.104304
Bayod-Rújula, A. A. (2009). Future development of the electricity systems with distributed generation. Energy 34 (3), 377–383. doi:10.1016/j.energy.2008.12.008
Biswas, S., Goswami, S. K., and Bhattacharya, D. (2019). Optimal placement of distributed generation in an unbalanced radial distribution system considering load variation. In: 2019 IEEE Region 10 Symposium (TENSYMP); 2019 June 07-09; Kolkata, India: IEEE. p. 173–178. doi:10.1109/TENSYMP46218.2019.8971226
Brigatto, G. A., Carmargo, C. C. B., and Sica, E. T. (2011). Multiobjective optimization of distributed generation portfolio insertion strategies. In: 2010 IEEE/PES Transmission and Distribution Conference and Exposition: Latin America (T&D-LA); 2010 November 08-10; Sao Paulo, Brazil: IEEE. p. 622–628. doi:10.1109/TDC-LA.2010.5762947
Chen, Y. M. (2003). Passive filter design using genetic algorithms. In: IEEE Transactions on Industrial Electronics: IEEE. Vol. 50. p. 202–207. doi:10.1109/TIE.2002.807664
Chou, C.-J., Lio, C.-W., Lee, J.-Y., and Lee, K.-D. (2000). Optimal planning of large passive-harmonic-filters set at high voltage level. In: IEEE Transactions on Power Systems: IEEE..
Das, D. (2004). Maximum loading and cost of energy loss of radial distribution feeders. Int. J. Electr. Power Energy Syst. 26 (4), 307–314. doi:10.1016/j.ijepes.2003.09.002
Distribution Test Feeders (2010). IEEE distribution system analysis subcommittee. Available online at: https://ewh.ieee.org/soc/pes/dsacom/testfeeders.html.
El-Khattam, W., and Salama, M. M. A. (2004). Distributed generation technologies, definitions and benefits. Electr. Power Syst. Res. 71 (2), 119–128. doi:10.1016/j.epsr.2004.01.006
HassanzadehFard, H., and Jalilian, A. (2018). Optimal sizing and location of renewable energy based DG units in distribution systems considering load growth. Int. J. Electr. Power Energy Syst. 101, 356–370. doi:10.1016/j.ijepes.2018.03.038
Jannesar, M. R., Sedighi, A., Savaghebi, M., Anvari-Moghaddam, A., and Guerrero, J. M. (2019). Optimal probabilistic planning of passive harmonic filters in distribution networks with high penetration of photovoltaic generation. Int. J. Electr. Power Energy Syst. 110, 332–348. doi:10.1016/j.ijepes.2019.03.025
Kalita, K., Pandya, S. B., Čep, R., Jangir, P., and Abualigah, L. (2024). Many-objective ant lion optimizer (MaOALO): a new many-objective optimizer with its engineering applications. Heliyon 10 (12), e32911. doi:10.1016/j.heliyon.2024.e32911
Karadeniz, A., Balci, M. E., and Hocaoglu, M. H. (2023). Improvement of PV unit hosting capacity and voltage profile in distorted radial distribution systems via optimal sizing and placement of passive filters. Electr. Eng. 105 (4), 2185–2198. doi:10.1007/s00202-023-01800-y
Ko, C. N., Chang, Y. P., and Wu, C. J. (2009). A PSO method with nonlinear time-varying evolution for optimal design of harmonic filters. IEEE Trans. Power Syst. 24 (1), 437–444. doi:10.1109/TPWRS.2008.2004845
Lakum, A., and Mahajan, V. (2021). A novel approach for optimal placement and sizing of active power filters in radial distribution system with nonlinear distributed generation using adaptive grey wolf optimizer. Eng. Sci. Technol. Int. J. 24 (4), 911–924. doi:10.1016/j.jestch.2021.01.011
Maghami, M. R., Yaghoubi, E., Mohamed, M., Yaghoubi, E., Jahromi, M. Z., and Fei, T. K. (2025). Multi-objective optimization of unbalanced power distribution systems: a comprehensive approach to address uncertainties and enhance performance. Energy Convers. Manag. X, 101087. doi:10.1016/j.ecmx.2025.101087
Mahlalela, J., Lopez, J. A., and Lu, C.-N. (2015). Optimum placement and sizing of harmonic filters in distribution systems. In: National Sun Yat-sen University; Taiwan. Available online at: https://www.researchgate.net/publication/343318213.
Manjure, D. P., and Senior, E. B. M. (2002). Impact of unbalance on power system harmonics. In: 10th International Conference on Harmonics and Quality of Power. Proceedings (Cat. No.02EX630); 2002 October 06-09; Rio de Janeiro, Brazil: IEEE Xplore. doi:10.1109/ICHQP.2002.1221454
Marti, J. R., Xu, W., and Dommel, H. W. (1991). A multiphase harmonic load flow solution technique. In: IEEE Transactions on Power Systems: IEEE. Vol. 6 (1), 174–182.
Nassar, S. M., Saleh, A. A., Eisa, A. A., Abdallah, E. M., and Nassar, I. A. (2025). Optimal allocation of renewable energy resources in distribution systems using meta-heuristic algorithms. Results Eng. 25, 104276. doi:10.1016/j.rineng.2025.104276
Onefivenine (2025). Gangadevipalli location details. Available online at: https://www.onefivenine.com/india/villages/Cuddapah/Thondur/Gangadevi-Palli.
Patibandla, A., Kollu, R., Rayapudi, S. R., and Manyala, R. R. (2021). A multi-objective approach for the optimal design of a standalone hybrid renewable energy system. Int. J. Energy Res. 45 (12), 18121–18148. doi:10.1002/er.6957
Premono, B. S., Tjahjana, D. D. D. P., and Hadi, S. (2017). Wind energy potential assessment to estimate performance of selected wind turbine in northern coastal region of semarang-indonesia. AIP Conf. Proc. 1788. doi:10.1063/1.4968279
Ramsami, P., and Ah King, R. T. F. (2019). Multi-objective optimisation of distributed generation units in unbalanced distribution systems. Lect. Notes Electr. Eng. 561, 70–81. doi:10.1007/978-3-030-18240-3_7
Rezapour, H., Fathnia, F., Fiuzy, M., Falaghi, H., and Lopes, A. M. (2024). Enhancing power quality and loss optimization in distorted distribution networks utilizing capacitors and active power filters: a simultaneous approach. Int. J. Electr. Power Energy Syst. 155, 109590. doi:10.1016/j.ijepes.2023.109590
Salam, Z., Jusoh, A., and Cheng, T. P. (2006). Harmonics mitigation using active power filter: a technological review Malaysia: Universiti Technologi Malaysia. Available online at: https://www.researchgate.net/publication/41057887.
Satish, R., Vaisakh, K., Abdelaziz, A. Y., and El-Shahat, A. (2021). A novel three-phase harmonic power flow algorithm for unbalanced radial distribution networks with the presence of d-statcom devices. Electron. 10 (21), 2663. doi:10.3390/electronics10212663
Selim, A., Kamel, S., and Jurado, F. (2019). Power losses and energy cost minimization using shunt capacitors installation in distribution systems. In: 2019 10th International Renewable Energy Congress (IREC); 2019 March 26-28; Sousse, Tunisia: IEEE Xplore. p. 1–6. doi:10.1109/IREC.2019.8754607
Sharifi, M. R., Akbarifard, S., Qaderi, K., and Madadi, M. R. (2021). A new optimization algorithm to solve multi-objective problems. Sci. Rep. 11 (1), 20326. doi:10.1038/s41598-021-99617-x
Szuvovivski, I., Fernandes, T. S. P., and Aoki, A. R. (2012). Simultaneous allocation of capacitors and voltage regulators at distribution networks using genetic algorithms and optimal power flow. Int. J. Electr. Power Energy Syst. 40 (1), 62–69. doi:10.1016/j.ijepes.2012.02.006
Tan, Y., Cao, Y., Li, Y., Lee, K. Y., Jiang, L., and Li, S. (2017). Optimal day-ahead operation considering power quality for active distribution networks. IEEE Trans. Automation Sci. Eng. 14 (2), 425–436. doi:10.1109/TASE.2016.2629477
Ulinuha, A., Masoum, M. A. S., and Islam, S. M. (2007). Harmonic power flow calculations for a large power system with multiple nonlinear loads using decoupled approach. Australas. Univ. Power Eng. Conf., 1–6. doi:10.1109/AUPEC.2007.4548132
Wagner, V. E., Balda, J. C., Griffitki, D. C., Mceachern, A., Barnes, T. M., Hartmann, D. P., et al. (1993). Effects of harmonics on equipment. IEEE Trans. Power Deliv. 8 (Issue 2), 672–680. doi:10.1109/61.216874
Glossary
KSt,CSt Space and Scale parameters
SIrrnt, SIrrn-1t, SIrrn+1t Solar irradiance for the tth time interval in the nth, (n-1)th, and (n+1)th states
wtbsnt, wtbsn-1t, wtbsn+1t Wind speed for the tth time interval in the nth, (n-1)th, and (n+1)th states
lddkt, lddk-1t, lddk+1t Load demand for the tth time interval in the kth, (k-1)th, and (k+1)th states
NPV, NWI, Nlds Number of solar irradiance states, wind speed states, and load states
Ppvon PV array output power at average irradiance
Pwton Wind turbine output power with an average wind speed
z Load demand in kth time interval
µ Mean
σ SD
σ2 Variance of normal distribution
Nbno Number of feeders
Plabc Power loss of phases a, b and c
h0 hmax Minimum and maximum harmonic order
(THD)j Total harmonic distortion at bus j
CSolar, CWind Total cost of PV units and Wind units ($/hr)
Cgrsc, Cgrpc Cost of power sold to and power purchased from the grid ($/kWh)
NSolar Number of solar PV units
NWind Number of wind turbines
IC Marginal installation cost ($/kW or $/kWh)
OM Annual operational and maintenance marginal cost ($/Kw-hr or $/kWh-yr)
τ Estimated life time in years
Cτ Capital recovery factor
CPPF, CAPF Cost of PPFs and APFs ($/hr)
NAPFs Number of APFs
Cfix, Cvar Fixed and variable costs related to the APFs
Cfixc Fixed cost of the capacitor
CC,CR,CI PPFs capacitor, inductor, and resistance costs
Ppl Power loss of PPF
Qcn, Qln Rms values of reactive powers of capacitance and inductance
CCca Cost of capacitor ($/hr)
CVR AVR installation cost ($/hr)
v Total number of installed capacitors
Qre Reactive power that each capacitor injects
VBN Bus voltage
TPRES Power injected by RES
T
PP Initial population
OPP Old population
TPP Trial population
Nr rth design variable of a solution
k, l Random numbers
Keywords: renewable energy sources, total power loss, total cost, total harmonic distortion, load growth, passive power filters, active power filters, distributed generators
Citation: Arubolu L, Kollu R and Manyala RR (2025) Optimal allocation of renewable energy sources and power filters in unbalanced distribution systems with nonlinear loads under load growth condition. Front. Energy Res. 13:1664533. doi: 10.3389/fenrg.2025.1664533
Received: 12 July 2025; Accepted: 29 September 2025;
Published: 27 October 2025.
Edited by:
Rui Long, Huazhong University of Science and Technology, ChinaReviewed by:
Mohammed Asim, Integral University, IndiaSanjiv Kumar Jain, Medi-Caps University, India
Copyright © 2025 Arubolu, Kollu and Manyala. This is an open-access article distributed under the terms of the Creative Commons Attribution License (CC BY). The use, distribution or reproduction in other forums is permitted, provided the original author(s) and the copyright owner(s) are credited and that the original publication in this journal is cited, in accordance with accepted academic practice. No use, distribution or reproduction is permitted which does not comply with these terms.
*Correspondence: Ravindra Kollu, cmF2aWtvbGx1QGpudHVjZWsuYWMuaW4=