 Yanbo Tao
 Yixun Xue
 Yuan Du
 Xinyue Chang
- The College of Electrical and Power Engineering (Key Laboratory of Cleaner Intelligent Control on Coal and Electricity, Ministry of Education, Energy Internet Key Laboratory of Shanxi Province) Taiyuan University of Technology, Taiyuan, China
Introduction: The accelerated development of renewable energy sources has confronted substantial challenges, primarily attributable to their intermittency and uncertainty. Consequently, the integration of green electricity has become a pressing concern. Hydrogen production from water electrolyzer has emerged as a key method for promoting local wind and solar energy consumption. However, extant studies tend to neglect the value of hydrogen as a chemical feedstock and rely on simplified linear models to describe the characteristics of electro-hydrogen coupling devices. This has resulted in discrepancies between optimization decisions and actual operational performance.
Methods: To address this gap, the present paper employs a nonlinear semi-empirical model with a focus on electrolyzer and fuel cell. It describes the energy conversion between electricity and hydrogen more accurately based on electrochemical mechanisms. On this basis, considering the dual value of hydrogen energy as both “energy carrier” and “chemical raw material”, the operation optimization model of electric-hydrogen coupling system for chemical parks is established. Furthermore, a convexification method for coupling device constraints is proposed to enhance solution efficiency.
Results and Discussion: The findings of the study demonstrate that the semi-empirical model provides a more accurate representation of actual equipment performance, thereby preventing deviations between real-world operation and outcomes derived from optimization. Furthermore, the collaborative optimization strategy that accounts for hydrogen’s dual value has been shown to significantly improve the system’s economic benefits.
1 Introduction
With the depletion of fossil fuels and the intensification of global climate change, large-scale development and utilization of renewable energy has become the core pathway for energy transformation (Li J. et al., 2021). Under the global Paris Agreement targets of achieving net-zero emissions by 2050, renewable energy development has been accelerating rapidly. However, existing power system flexibility resources cannot meet the consumption demand for large-scale renewable energy, leading to frequent wind and solar curtailment phenomena.
Electric-hydrogen coupling systems convert renewable energy into hydrogen through electrolysis, leveraging hydrogen’s temporal and spatial transferability to achieve large-capacity, long-cycle energy storage (Nikolaidis and Poullikkas, 2017). This approach has been recognized as a key method for solving wind and solar curtailment problems and achieving cross-temporal optimization of renewable energy allocation (Risco-Bravo et al., 2024). Meanwhile, as important nodes in the energy internet, electric-hydrogen coupling systems are also effective modes for promoting multi-energy flow synergistic interaction and improving comprehensive system efficiency (Sun et al., 2024). Global low-emissions hydrogen production reached less than 1 Mt in 2023, with the sector growing rapidly as installed electrolyzer capacity reached 1.4 GW by the end of 2023 and is expected to reach 5 GW by 2024 (IEA, 2024), demonstrating increasingly tight coupling between electricity and hydrogen.
Against this background, researchers have conducted extensive studies on wind-solar hydrogen production synergy (Gu et al., 2023), hydrogen flexible energy storage (Li et al., 2025; Su et al., 2023), and electric-hydrogen multi-energy integration (Li Q. et al., 2021; Wang et al., 2023; Qiu et al., 2023). Gu et al. (2023) developed a photovoltaic-based energy system coupled with energy storage to achieve all-day stable PEM electrolytic hydrogen production, demonstrating effective mitigation of solar intermittency through battery-assisted operation. Su et al. (2023) proposed a capacity configuration optimization method for green hydrogen generation driven by solar-wind hybrid power, using NSGA-III algorithm to optimize system capacity configuration with comprehensive performance criteria of economy, environment and energy efficiency, achieving remarkable performance with abandoned energy power rate reduced to 3.32%. Li Q. et al. (2021) established coordinated control strategies for electric-hydrogen hybrid energy storage in multi-microgrids, proposing a super-twisting algorithm-based control method to achieve optimal power distribution among photovoltaic panels, batteries, fuel cells, and electrolyzers. Wang et al. (2023) integrated the heat generation characteristics of alkaline electrolyzers and hydrogen fuel cells to construct a hydrogen system heat recovery operation model. Qiu et al. (2023) addressed the uncertainties of renewable energy generation and electricity prices through a two-stage distributionally robust optimization approach, establishing a coordinated scheduling model for integrated energy systems with electricity-hydrogen hybrid energy storage that considers both day-ahead deterministic planning and intraday robust rescheduling under high-order uncertainties. However, these studies only focus on hydrogen’s terminal energy carrier attributes on the hydrogen side, failing to incorporate hydrogen’s chemical feedstock potential into research. Globally, a significant portion of hydrogen is used as raw material for synthetic ammonia or synthetic methanol production, forming numerous and widely distributed chemical parks. These chemical parks are not only important consumption terminals for hydrogen, but their production process load flexibility can also interact with the power grid. With process improvements, chemical production processes using hydrogen as feedstock have acquired good load regulation flexibility, becoming another effective mode for electric-hydrogen coupling systems to solve wind and solar curtailment problems and improve comprehensive system efficiency (Glenk and Reichelstein, 2019).
Taking green hydrogen synthetic ammonia as an example, Denmark’s Topsoe company’s DynAMMO flexible synthetic ammonia process improves reaction equipment and optimizes control processes based on the Haber-Bosch method (Fahr et al., 2023), capable of operating at minimum 5% of rated capacity under low load regulation, with bidirectional response rates >3%/minute (Mbatha, et al., 2024; Topsoe, 2023). Italy’s Casale company’s solution can achieve rapid load regulation within approximately 30 min in the range of 10%–100% (Kong et al., 2024). These flexible technologies have been validated in multiple actual projects. The world’s first green ammonia plant of its kind, built through cooperation between Topsoe and Denmark’s Skovgaard Energy, has begun production with an annual output of 5,000 tons of green ammonia (Topsoe, 2024). The company is also collaborating with China’s Mintal Hydrogen to develop a 390,000 tons/year dynamic renewable ammonia plant in Baotou, expected to begin production in 2025 (Julian, 2024). Existing research has not fully exploited this production capacity regulation potential.
For example, although Li et al. (2023) includes synthetic ammonia loads, its model only treats chemical production processes as static loads, unable to fully utilize the schedulability of chemical hydrogen loads to smooth system fluctuations and reduce energy costs, thereby limiting the optimization space for overall system economic benefits.
Whether hydrogen serves as fuel or chemical feedstock, its coupling with the power system relies on the operational characteristics of core equipment such as electrolyzers and fuel cells. Therefore, precise modeling of electric-hydrogen coupling equipment is the foundation for achieving accurate system synergistic optimization. The operational characteristics of core coupling equipment such as electrolyzers and fuel cells are determined by complex electrochemical processes, with their voltage-current relationships exhibiting strong non-convex nonlinear characteristics. Directly using original semi-empirical physical models as constraints would form non-convex nonlinear programming problems (Yang et al., 2024) with high solution difficulty, making it difficult for planning solvers like Ipopt to obtain effective solutions. Existing modeling methods for electrolyzers and fuel cells consistently face the trade-off between “accuracy and solution efficiency.”
In electrolyzer modeling, Wu et al. (2020) uses fixed efficiency to characterize the electric-hydrogen conversion process of electrolyzers; Li et al. (2023) performs linear approximation of equipment nonlinearity around the electrolyzer’s operating point. Such linear models are simple in form and convenient for integration into optimization frameworks, but have large errors. Under certain operating conditions, electrolysis efficiency errors can reach 10%–20% (Persson et al., 2020; Xia et al., 2023). Xu and Deng (2025) and Akram and Kienberger (2024) use piecewise linearization methods to approximate nonlinear constraints, but require one-hot encoding to select piecewise intervals, inevitably introducing large numbers of 0–1 variables, making models strongly non-convex and prone to local optima. Biswas et al. (2023) uses artificial neural networks to capture electrolyzer working characteristics, but neural network-based models have poor interpretability and “black box” characteristics, unable to be constructed as constraint forms suitable for electric-hydrogen collaborative scheduling problems.
Research on simplified fuel cell modeling is relatively limited. Zhou et al. (2022), Vandenberghe et al. (2025) and other electric-hydrogen coupling system optimization problems assume fuel cells maintain fixed hydrogen-electricity conversion efficiency throughout the entire operating range, which has accuracy deficiencies. Chavan (2021) and Zhang et al. (2023) use polynomial fitting or operating point expansion methods to establish simplified models, whose expression coefficients lack actual physical significance and cannot reflect the intrinsic electrochemical mechanisms of fuel cells. Therefore, there is an urgent need to develop a coupling equipment modeling and optimization method that can accurately represent complex nonlinear physical characteristics of equipment while efficiently embedding into optimization frameworks and ensuring reliable solutions.
In response to these problems, this paper proposes to conduct collaborative optimization research on electric-hydrogen coupling systems considering refined modeling of coupling equipment. Based on semi-empirical formulas from the electrochemical field, nonlinear models of electrolyzers and fuel cells are established, with convexification processing to balance accuracy and optimization solution efficiency. Meanwhile, the revenue evaluation of green hydrogen production is extended to the chemical industry, establishing a collaborative optimization model considering hydrogen’s dual value as both “energy carrier” and “chemical feedstock.” The research results can provide theoretical support for engineering implementation of electric-hydrogen coupling systems in chemical parks, helping achieve renewable energy consumption and global net-zero emissions goals.
2 Electric-hydrogen coupling system architecture in chemical parks
This paper focuses on electric-hydrogen coupling systems in chemical parks as the research object. As shown in Figure 1, the park can be divided into three main areas: the power supply area, hydrogen production area, and chemical production area. The power supply area is equipped with wind turbines, photovoltaic panels, and electrical energy storage devices, and is connected to the main grid through substations. The hydrogen production area is configured with electrolyzers, hydrogen storage tanks, and fuel cells. The chemical production area encompasses synthetic ammonia/methanol production lines. The power supply area, hydrogen production area, and chemical production area are interconnected through power transmission lines and hydrogen transport pipelines, achieving efficient synergy of electricity, hydrogen, and ammonia/methanol through the integration of wind-solar power generation, electrolytic hydrogen production, and chemical synthesis.
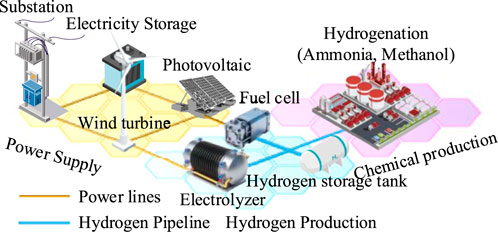
Figure 1. Architecture of electric-hydrogen coupling system in chemical park.
According to the response characteristics of chemical equipment to electricity price signals and renewable energy output, electric-hydrogen coupling systems in chemical parks can adopt different operating modes. In the fixed capacity operation mode, chemical equipment such as synthetic ammonia and methanol plants operate stably according to preset capacity, with relatively fixed hydrogen demand. This mode has clear production schedules and simple operation, but cannot exploit the flexibility value of hydrogen loads. The system’s optimization dependence is mainly reflected in electrolytic hydrogen production and energy storage scheduling.
In the flexible scheduling operation mode, chemical equipment can dynamically adjust capacity within technical constraint ranges, optimizing hydrogen consumption timing according to electricity price signals and renewable energy output. This mode fully utilizes modern flexible chemical technology and can comprehensively leverage hydrogen’s dual value as both energy carrier and chemical feedstock.
3 Electric-hydrogen coupling system model
3.1 Coupling equipment model
Electrolyzers and fuel cells are important coupling equipment in electric-hydrogen coupling systems, serving as the key components for realizing electric-hydrogen-electric energy conversion. This paper starts from electrochemical principles and introduces empirical formulas from the electrochemical field such as the Tafel equation and Faraday’s law (Antoniou et al., 2021), establishing semi-empirical models that consider the influence of key parameters such as voltage efficiency and Faraday efficiency to accurately characterize the nonlinear conversion relationship between electricity and hydrogen in electrolysis and its reverse process.
Proton exchange membrane electrolyzer (PEMEL) is an electrolysis technology that has matured in recent years, with strong capability to follow renewable energy generation that has strong randomness and volatility (Buttler and Spliethoff, 2018). It can follow input power variations to produce hydrogen at varying rates without energy storage facilities to smooth power fluctuations, autonomously suppressing power fluctuations from renewable energy sources (Firtina-Ertis et al., 2020).
The structure and working principle of PEMEL are shown in Figure 2a, with its reaction principle based on electrochemical processes (O’hayre et al., 2016). The proton exchange membrane allows H+ ions to pass through while blocking electrons and gases, creating an efficient ionic conduction environment. When powered, water oxidation occurs at the anode, generating oxygen and H+; H+ migrates through the proton exchange membrane to the cathode, where it gains electrons and is reduced to hydrogen gas.
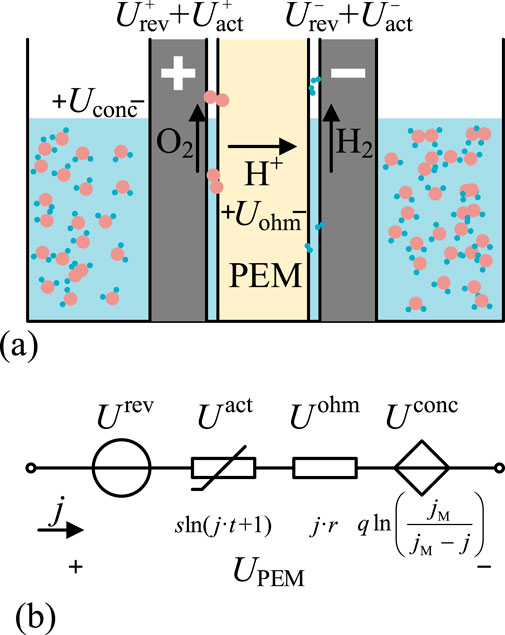
Figure 2. Structure and principle of PEMEL. (a) PEM Operating Principles. (b) PEM Equivalent Circuit.
The theoretical minimum voltage required for water decomposition in the PEMEL reaction system is called the reversible electromotive force
The concentration voltage
where q is a temperature-dependent constant; jM is the limiting current density; jPEM is the actual input current density.
The activation polarization voltage
The total voltage
Since PEMEL requires rectification of AC power input from the grid before it can be applied to the electrolysis process, the rectification efficiency
where
Faraday’s law states that the amount of electrolysis reaction products is proportional to the input charge quantity. Therefore, the hydrogen gas flow rate
where
Additionally, due to the presence of bypass current, not all current input to PEMEL can be invested in the electrolysis reaction. The ratio of current actually participating in the reaction to input current is called Faraday efficiency
where the coefficients
Fuel cells (FC) perform the reverse reaction of electrolyzers, and both have similar physical models. The relationship between hydrogen gas flow rate
The output voltage
where
Substituting the variables and coefficients changed to corresponding symbols for fuel cells from Equations 1–3 into Equation 9, we have:
where
3.2 Renewable energy generation model
The park utilizes wind turbines and photovoltaic panels as renewable energy sources. As shown in Equations 11, 12, the actual output of wind turbines and photovoltaic panels is constrained by their predicted maximum output to avoid over-generation.
where
The curtailment of renewable energy is quantified by Equation 13, which reflects the difference between predicted and actual output.
3.3 Energy storage system model
Electrochemical energy storage devices, represented by lithium-ion batteries, satisfy the continuity equation for energy
where
The hydrogen storage tank satisfies the continuity equation for hydrogen inventory
where
All energy storage devices must satisfy corresponding upper and lower limit constraints for both storage capacity and flow rates.
3.4 Hydrogen load model
Ammonia synthesis and methanol synthesis represent the two most important hydrogen consumption pathways. The Haber-Bosch process and the “one-step method” for methanol production are currently the mainstream preparation methods for ammonia and methanol, respectively, achieving hydrogen conversion rates of 97% and 95%. The electrical energy and hydrogen gas consumed in the production processes are:
where the hydrogen-to-ammonia mass conversion efficiency is
Within the adjustable range of flexible synthesis processes, the fluctuations in mass and energy conversion efficiency between hydrogen and products can be neglected.
3.5 Electric-hydrogen coupling network model
The microgrid serves as the backbone network of the chemical park’s electric-hydrogen coupling system, responsible for power transmission and distribution. The model must consider nodal power balance constraints and line capacity constraints. For node i, let
where
The power flow on each branch l must satisfy its transmission capacity limits:
where
Similar to the electrical network, the mathematical model of the hydrogen network primarily includes nodal flow balance equations and pipeline transport equations. For node j in the hydrogen pipeline network, with the set of connected pipelines
where
The magnitude and direction of hydrogen flow in pipeline g connecting nodes i and j are determined by the nodal pressures
where
Additionally, the transport flow rate of each hydrogen pipeline g must satisfy its design pressure and flow limitations:
where
4 Electric-hydrogen coordination optimization model
In electric-hydrogen coordination scheduling, the objective is typically to minimize the total operating cost while satisfying the safe operation constraints of electrical and hydrogen networks (Equations 18, 21 and 22), the characteristics of electrolytic hydrogen production (Equation 6) and fuel cell power generation (Equation 10), hydrogen storage (Equation 15), electrical storage (Equation 14), ammonia/methanol production (Equation 16), and their respective power and flow rate variation constraints for safe operation.
4.1 Objective function
The operating cost of the electric-hydrogen coupling system includes the cost of purchasing electricity from the main grid
where:
λ(t): Electricity price in period t, USD/MWh
μ: Hydrogen purchase price, USD/kg
σ: Renewable curtailment penalty coefficient, USD/MWh
ρ: Slack penalty coefficient, USD/MWh2
πMeOH: Methanol price, USD/kg
4.2 Equipment constraint convexification
Key components of the electric-hydrogen coupling system, such as electrolyzers and fuel cells, exhibit significant non-convex characteristics in their original physical models, making them difficult to solve directly as optimization constraints. Therefore, convexification should be applied in the electric-hydrogen coordination optimization model.
The behavior of PEMEL is characterized by Equations 4–7. Both the input electrical energy
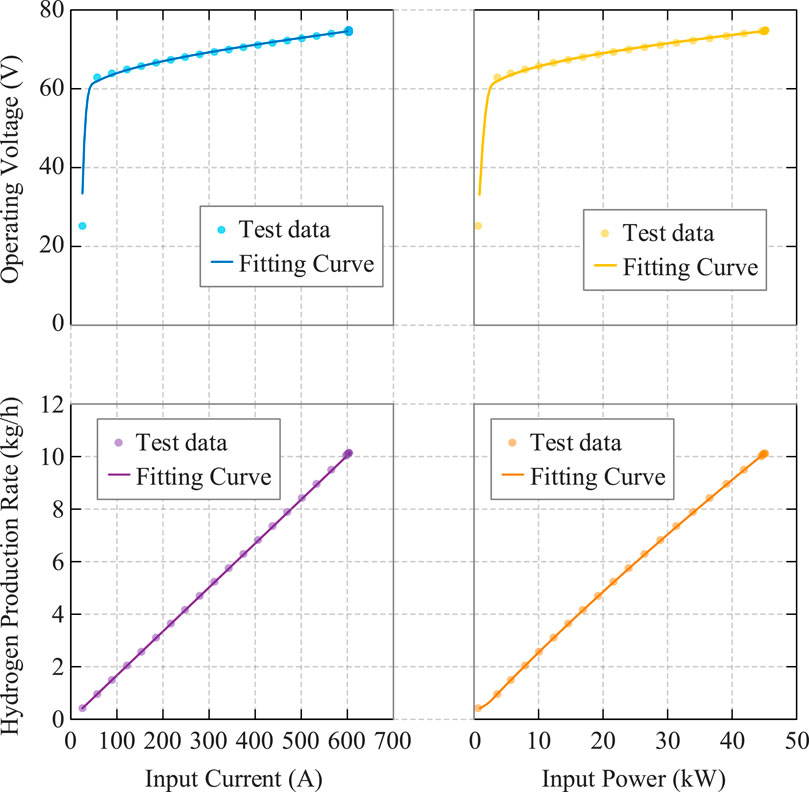
Figure 3. PEMEL performance characteristics and model fitting comparison.
Due to the complex form of Equation 24 and the inclusion of empirical formulas without strict physical meaning, obtaining an analytical expression for
Using fitting parameters for PEMEL under typical operating conditions (temperature 65 °C, current density 0.15–3.3 A/cm2), substituting into the parametric Equation 24 yields the partial curves shown in Figure 3 for lower current densities.
If following the approach of literature using fixed efficiency to fit the
where
For the expression
Table 1 provides a comprehensive comparison of different electrolyzer modeling approaches in terms of computational complexity and problem characteristics. The parametric equation model, while most accurate in representing the underlying electrochemical processes, results in a nonlinear programming (NLP) problem that is computationally intractable for large-scale optimization. The constant efficiency model offers the simplest linear programming (LP) formulation but sacrifices accuracy significantly.
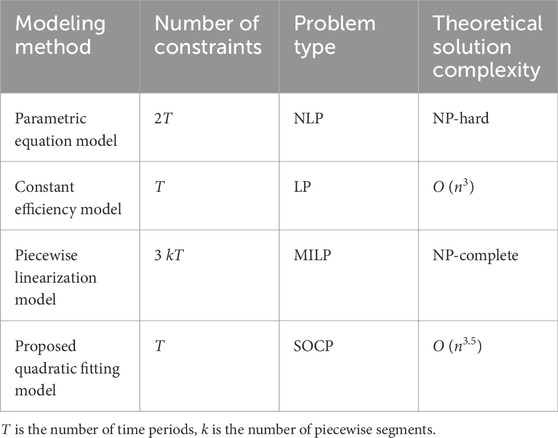
Table 1. Comparison of electrolyzer modeling approaches.
Piecewise linearization methods achieve better accuracy than constant efficiency models but introduce binary variables that result in mixed-integer linear programming (MILP) problems. These approaches require 3 kT constraints (where k is the number of segments), making them computationally expensive and prone to local optima due to their NP-complete nature.
The proposed quadratic fitting model strikes an optimal balance between accuracy and computational efficiency. It maintains the same number of constraints (T) as the constant efficiency model while formulating the problem as a second-order cone programming (SOCP) problem, which can be solved efficiently with polynomial-time complexity O (n3·5). This approach preserves the convex nature of the optimization problem while capturing the essential nonlinear characteristics of electrolyzer operation, making it suitable for practical implementation in large-scale electric-hydrogen coupling systems.
Observing
where:
The quadratic approximation in Equation 26 is derived from first principles using Taylor expansions of the logarithmic terms in the electrochemical model. The detailed mathematical derivation and validity analysis are provided in Supplementary Appendix SA.
The quadratic approximation parameters require periodic recalibration to maintain model accuracy as equipment characteristics evolve over extended operation periods. Recent electrolyzer performance degradation studies have provided comprehensive data on the degradation mechanisms affecting the core parameters underlying our quadratic model. Phan et al. (2024) conducted a 144-h degradation analysis of PEM electrolyzers with different membrane thicknesses under constant current density of 3.0 A/cm2, demonstrating that the thinnest membrane (NR212) suffered from severe ohmic degradation attributed to pinhole formation and resulting decrease in electrical conductivity of the iridium catalyst layer due to reduction of iridium oxide catalyst. More extensive industrial-scale studies indicate that PEM electrolyzers typically experience operational lifetimes of approximately 40,000 h compared to 90,000 h for alkaline electrolyzers, primarily due to the fragile nature of polymer membranes and the inherently acidic environment created by H+ ions (Thunder Said Energy, 2023).
The degradation mechanisms primarily affect membrane conductivity, catalyst activity, and internal resistance—parameters that directly influence our derived coefficients k1 and k2 in the quadratic approximation. Schwieters et al. (2023) investigated membrane failure mechanisms due to hydrogen crossover in catalyst-coated PFSA membranes, revealing that membrane degradation accelerates at higher temperatures (80 °C vs. 60 °C) through the formation of hydrogen peroxide and radical species that cause membrane thinning and pinhole formation. Large-scale industrial studies have documented even more substantial degradation rates, with Wang et al. (2024) and comprehensive reviews by Alia et al. (2024) showing that 70% of initial iridium catalyst can be lost after 4,500 h of operation under industrially relevant conditions (1.8 A cm-2, ∼30 bar pressure), with the dissolved iridium migrating through the membrane and re-depositing as metallic particles.
Modern electrolyzer systems incorporate sophisticated monitoring capabilities that facilitate parameter updating protocols. Contemporary cell voltage monitoring (CVM) systems enable real-time surveillance of individual cell performance within electrolyzer stacks, allowing detection of performance anomalies and enabling predictive maintenance strategies (Smart Testsolutions, 2023). These systems provide continuous monitoring of voltage, current, and temperature parameters while offering high electrical isolation and long-term stability without requiring recalibration of the monitoring equipment itself. The computational requirements for parameter recalibration involve solving constrained nonlinear regression problems with the fitted coefficients, typically completing within minutes on standard industrial computing hardware. The optimization framework itself requires no structural modifications—only coefficient updates—making the recalibration process relatively straightforward from an implementation perspective. While recalibration involves operational costs, maintaining model accuracy prevents optimization errors that could result in efficiency losses exceeding the maintenance investment, providing clear economic justification for regular updating protocols.
Within the typical operating condition range, quadratic fitting achieves residuals close to 5–10 segment piecewise linear fitting and is significantly better than overall linear fitting under fixed efficiency assumptions.
The non-convexity of the FC model stems from activation polarization voltage
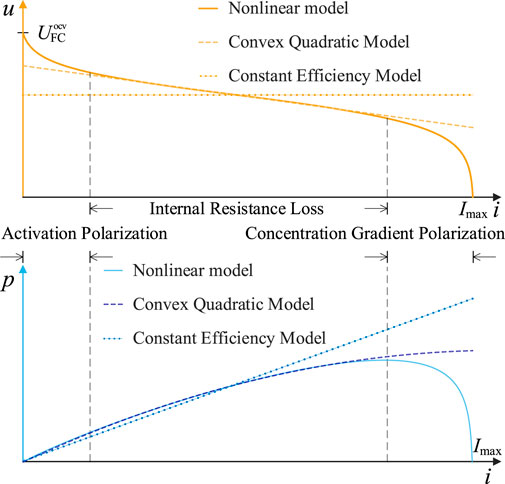
Figure 4. Fuel cell voltage-current and power characteristics.
The nonlinear relationships in Figure 4 curves are more pronounced than those in Figure 5. Fixed efficiency models cannot accurately reflect FC’s dynamic efficiency characteristics varying with operating conditions, resulting in significant errors at most power points. However, within FC’s main operating range, the nonlinear effects of activation polarization voltage
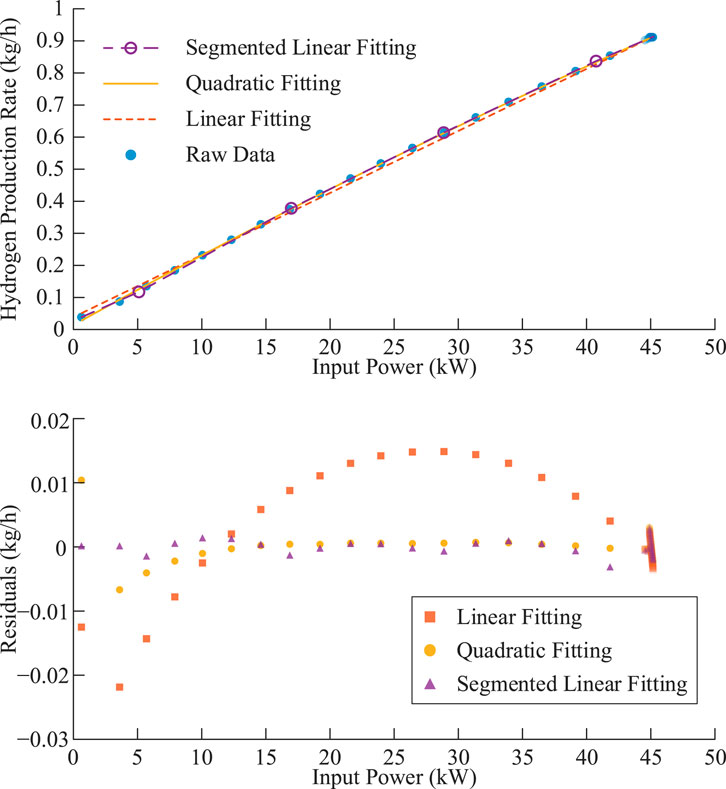
Figure 5. Model accuracy comparison for PEMEL hydrogen production prediction.
This constraint is also a convex quadratic constraint.
To assess the accuracy of the proposed convexification approach, we employ benchmark validation against the original nonlinear semi-empirical model. The validation process involves: (1) obtaining optimization results using simplified models (constant efficiency, quadratic fitting, or piecewise linearization); (2) substituting these optimization decisions back into the original nonlinear constraints (Equations 4–7 for PEMEL and Equation 10 for fuel cells) to perform benchmark calculations; (3) comparing predicted values from simplified models with benchmark calculations to quantify modeling accuracy.
4.3 Energy storage constraint discretization
Differential equations (Equations 14 and 15) provide continuous-time storage state changes for energy storage devices. In optimization models, these must be converted to discrete-time models suitable for numerical solution.
Using forward Euler method to discretize both equations, resulting in the discrete-time models for battery energy storage and hydrogen tank inventory shown in Equations 28, 29, respectively:
4.4 Coupling network constraint convexification
Hydrogen network pipeline flow constraint (Equation 20) is relaxed using second-order cone relaxation, with the relaxed form given in Equation 30:
where the squared pressure difference
4.5 Optimization models for different operation modes
This paper establishes optimization models for both fixed capacity and flexible scheduling operation modes. In fixed capacity operation mode, chemical plants operate at predetermined capacity levels without responding to electricity price fluctuations and renewable energy output changes. Ammonia and methanol production are fixed as specified in Equation 32:
The corresponding optimization problem for the fixed capacity operation mode is formulated in Equation 33:
The flexible scheduling operation mode fully utilizes the advantages of flexible chemical technology, allowing chemical plants to dynamically adjust capacity within technical constraints. Ammonia and methanol production satisfy inequality constraints in Equation 34:
The corresponding optimization problem for the flexible scheduling operation mode is given in Equation 35:
5 Case study analysis
To verify the effectiveness of the proposed electric-hydrogen coupling system coordination optimization model, this study designs multi-dimensional comparative case studies for simulation analysis. Since optimization problems constructed using non-convex nonlinear electrolyzer parametric equation models and fuel cell models cannot be directly solved, this paper compares four cases: constant efficiency, quadratic fitting, 5-segment piecewise linearization, and 20-segment piecewise linearization models. The results from 20 linear segments are approximately regarded as the accurate results of the nonlinear model to evaluate the accuracy and applicability of different modeling methods.
The case study is based on a typical chemical park test system that integrates wind and solar power generation, electrolytic hydrogen production, and chemical production functional modules. The system includes centralized photovoltaic power stations, wind farms, electrolyzers, hydrogen storage facilities, ammonia synthesis plants, and methanol synthesis plants as hydrogen-consuming enterprises. The topological connection of these components is shown in Figure 6. The optimization period is 24 h with 1-h time steps, using time-of-use electricity pricing with a peak-valley price difference of 0.13 USD/kWh. The case study is developed using Python 3.8 and solved using the Gurobi 11.0.3 solver. The computational performance analysis is conducted on a standard computing platform (12th Gen Intel® Core™ i7-12700H) to evaluate the practical scalability of the proposed optimization framework.
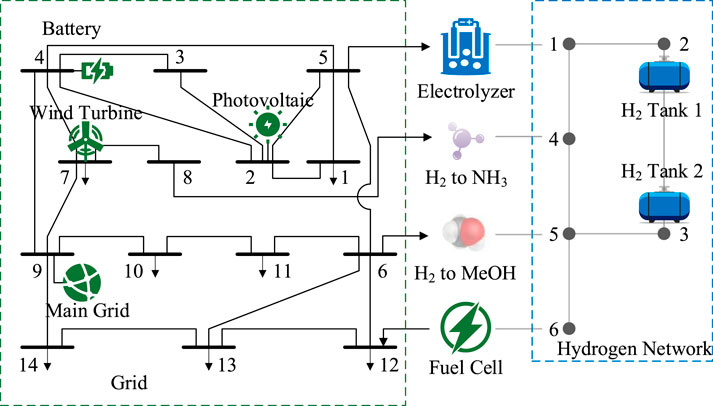
Figure 6. Topology of the electric-hydrogen coupling system in chemical park.
Photovoltaic power stations, wind farms, and fixed electrical loads use typical daily data. The maximum output and total load curves are shown in Figure 7.
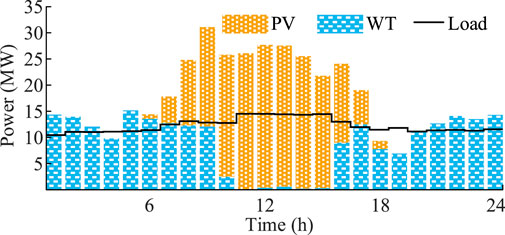
Figure 7. Renewable energy output and load profiles in chemical park.
5.1 Equipment refined modeling accuracy verification
Under the same production strategy, using quadratic fitting models in the case study yields optimization results close to piecewise linear models, indicating that quadratic fitting models are equivalent to piecewise linear models in equipment modeling accuracy and sufficient to reflect actual equipment operating characteristics.
To evaluate model accuracy, we employ a benchmark validation approach: optimization decisions from each simplified model are substituted into the original nonlinear semi-empirical model for benchmark calculation. In fixed capacity mode, the quadratic fitting model predicts total hydrogen production of 3,118.76 kg, while the benchmark calculation yields 3,100.16 kg, with an error of 0.6%. In flexible scheduling mode, quadratic fitting predictions and benchmark calculations yield hydrogen production of 3,478.66 kg and 3,510.25 kg respectively, (Table 2) with a relative error of 0.9%, both demonstrating high accuracy.
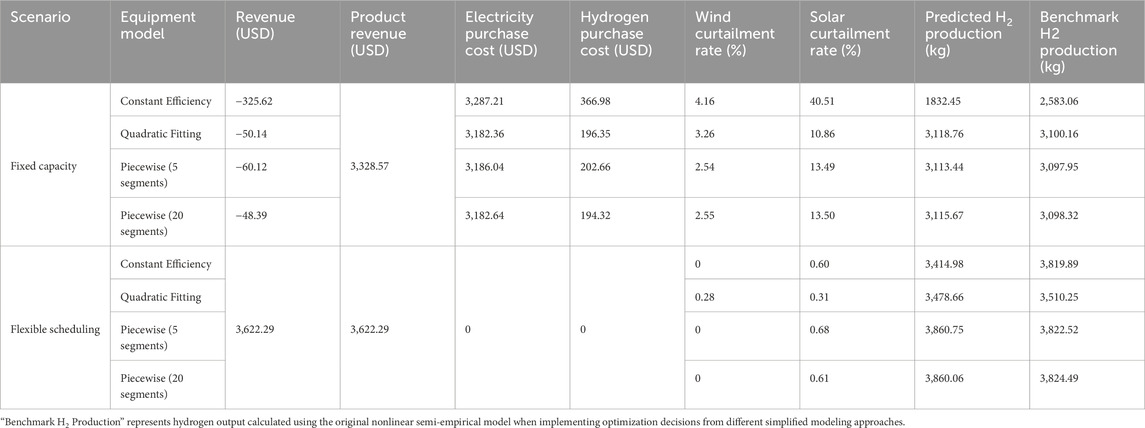
Table 2. Comparative performance analysis of equipment modeling approaches under fixed capacity and flexible scheduling operation modes.
However, constant efficiency models exhibit poor accuracy when validated against benchmark calculations. In fixed capacity mode, constant efficiency model predictions show significant deviations from benchmark results, with errors exceeding 29%. Such substantial discrepancies would severely affect optimization decision reliability if implemented in actual operations.
5.2 Computational performance analysis
The computational efficiency of different modeling approaches demonstrates significant variations in solve times and memory consumption. Table 3 presents comprehensive performance metrics across fixed capacity and flexible scheduling scenarios.
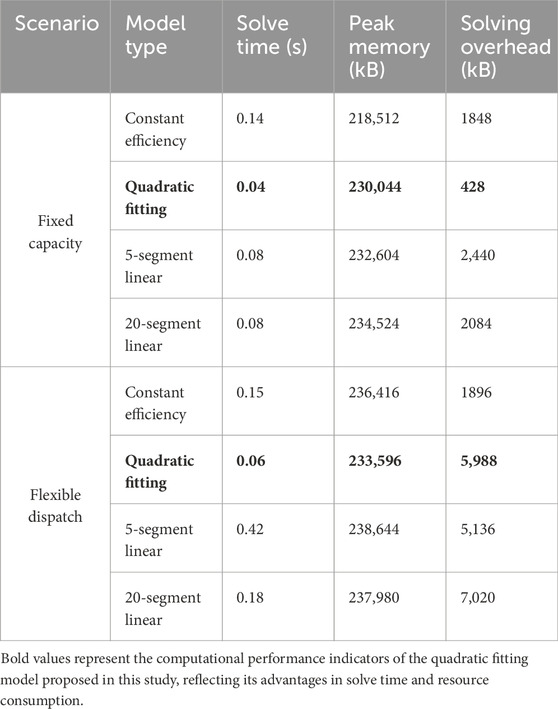
Table 3. Computational performance comparison across modeling approaches.
Beyond accuracy considerations, computational efficiency analysis reveals significant performance advantages of the quadratic fitting approach. Solution times of 0.04–0.06 s represent substantial improvements over piecewise methods, particularly in flexible scheduling scenarios where 5-segment linearization requires 0.42 seconds—seven times slower than the quadratic approach.
5.3 Economic benefits of flexible scheduling strategy
Optimization results demonstrate that flexible scheduling strategies have significant revenue advantages over fixed capacity strategies. Fixed capacity strategies show slight losses, while flexible scheduling strategies achieve daily average revenue of 3,622 USD.
The shift in energy cost structure explains the substantial revenue differences observed between operating modes. Fixed capacity operations incur considerable external energy procurement costs - daily electricity purchases reach approximately 3,186 USD while hydrogen procurement adds another 286 USD. In contrast, flexible scheduling enables the system to achieve energy independence by strategically timing production activities, thereby eliminating these external procurement expenses.
The renewable energy utilization patterns further illustrate this advantage. Fixed capacity operations result in wind curtailment of roughly 4% and solar curtailment exceeding 10%, indicating underutilized renewable resources. Flexible scheduling demonstrates markedly improved performance, with both wind and solar curtailment dropping below 1%. This enhanced energy capture not only minimizes waste but also increases electrolyzer operational efficiency and strengthens the park’s hydrogen autonomy, ultimately driving improved profitability.
6 Conclusion
This paper addresses electric-hydrogen coupling systems in chemical parks and proposes a coordination optimization method based on refined equipment modeling. It employs nonlinear models consistent with actual physical characteristics of equipment to more accurately describe electrolyzer and fuel cell characteristics, ensures optimization problem solution efficiency through convexification and linearization techniques, and introduces product price marginal effects to evaluate the economics of hydrogen chemical products. The study reaches the following conclusions.
1. Refined equipment modeling with adaptive parameter maintenance is of significant importance. Traditional constant efficiency models cannot account for equipment efficiency variations across different power levels, resulting in often infeasible optimal solutions. Adopting quadratic function fitting of nonlinear models can reflect actual equipment operating characteristics across broader power ranges, avoiding deviations between actual operation and optimization decisions. However, maintaining model accuracy requires periodic parameter updates based on operational data to account for equipment degradation mechanisms such as membrane thinning, catalyst dissolution, and internal resistance changes documented in recent industrial studies.
2. Flexible scheduling of chemical capacity can promote chemical production. Compared to fixed chemical capacity, flexible capacity scheduling can significantly improve economic benefits and enhance wind and solar utilization rates.
Data availability statement
The original contributions presented in the study are included in the article/Supplementary Material, further inquiries can be directed to the corresponding author.
Author contributions
YT: Conceptualization, Data curation, Visualization, Writing – original draft, Writing – review and editing. YX: Data curation, Funding acquisition, Methodology, Writing – review and editing. YD: Investigation, Validation, Writing – review and editing. PF: Formal Analysis, Writing – review and editing. XC: Investigation, Writing – review and editing.
Funding
The author(s) declare that financial support was received for the research and/or publication of this article. This project is supported by State Key Laboratory of Power System Operation and Control (Grant No. SKLD24KM10).
Acknowledgments
The authors acknowledge the support provided by Taiyuan University of Technology, the Key Laboratory of Cleaner Intelligent Control on Coal and Electricity, and the Shanxi Key Laboratory of Integrated Energy System. We also thank the reviewers for their valuable comments and suggestions that helped improve the quality of this manuscript.
Conflict of interest
The authors declare that the research was conducted in the absence of any commercial or financial relationships that could be construed as a potential conflict of interest.
Generative AI Statement
The author(s) declare that no Generative AI was used in the creation of this manuscript.
Any alternative text (alt text) provided alongside figures in this article has been generated by Frontiers with the support of artificial intelligence and reasonable efforts have been made to ensure accuracy, including review by the authors wherever possible. If you identify any issues, please contact us.
Publisher’s note
All claims expressed in this article are solely those of the authors and do not necessarily represent those of their affiliated organizations, or those of the publisher, the editors and the reviewers. Any product that may be evaluated in this article, or claim that may be made by its manufacturer, is not guaranteed or endorsed by the publisher.
Supplementary material
The Supplementary Material for this article can be found online at: https://www.frontiersin.org/articles/10.3389/fenrg.2025.1695588/full#supplementary-material
References
Akram, N., and Kienberger, T. (2024). A combined investment and operational optimization approach for power-to-methanol plants. Energies 17 (23), 5937. doi:10.3390/en17235937
Alia, S. M., Pivovar, B. S., and Yan, Y. (2024). Proton exchange membrane (PEM) water electrolysis: cell-level considerations for gigawatt-scale deployment. Chem. Rev. 125. doi:10.1021/acs.chemrev.3c00904
Antoniou, A., Celis, C., and Berastain, A. (2021). A mathematical model to predict alkaline electrolyzer performance based on basic physical principles and previous models reported in literature. ASME Int. Mech. Eng. Congr. Expo. 85642, V08BT08A021. doi:10.1115/IMECE2021-68815
Biswas, M., Wilberforce, T., and Biswas, M. A. (2023). Prediction of transient hydrogen flow of proton exchange membrane electrolyzer using artificial neural network. Hydrogen 4 (3), 542–555. doi:10.3390/hydrogen4030035
Buttler, A., and Spliethoff, H. (2018). Current status of water electrolysis for energy storage, grid balancing and sector coupling via power-to-gas and power-to-liquids: a review. Renew. Sust. Energy Rev. 82, 2440–2454. doi:10.1016/j.rser.2017.09.003
Chavan, S. L. (2021). Polynomial and transfer function models for multi input single output (MISO) PEM fuel cell by system identification methodology. Int. J. Eng. Res. Appl. 1, 4623–4628. doi:10.1080/01430750.2021.1915866
Fahr, S., Schiedeck, M., Schwarzhuber, J., Bail, A., Halmschlager, D., Hofmann, P., et al. (2023). Design and thermodynamic analysis of a large-scale ammonia reactor for increased load flexibility. Chem. Eng. J. 471, 144612. doi:10.1016/j.cej.2023.144612
Firtina-Ertis, I., Acar, C., and Erturk, E. (2020). Optimal sizing design of an isolated stand-alone hybrid wind-hydrogen system for a zero-energy house. Appl. Energy 274, 115244. doi:10.1016/j.apenergy.2020.115244
Ghaedi, M., Andersen, P. Ø., and Gholami, R. (2023). Hydrogen diffusion into caprock: a semi-analytical solution and a hydrogen loss criterion. J. Energy Storage 64, 107134. doi:10.1016/j.est.2023.107134
Glenk, G., and Reichelstein, S. (2019). Economics of converting renewable power to hydrogen. Nat. Energy 4, 216–222. doi:10.1038/s41560-019-0326-1
Gu, X., Ying, Z., Zheng, X., Dou, B., and Cui, G. (2023). Photovoltaic-based energy system coupled with energy storage for all-day stable PEM electrolytic hydrogen production. Energy 209, 53–62. doi:10.1016/j.renene.2023.03.135
Haimerl, F., Kumar, S., Heere, M., Noack, J., and Antonyuk, S. (2024). Electrochemical impedance spectroscopy of PEM fuel cells at low hydrogen partial pressures: efficient cell tests for mass production. Ind. Chem. Mater 2, 132–140. doi:10.1039/D3IM00075C
He, W., Lin, J., Wang, B., Tian, S., and Karimi, K. J. (2012). Overall concentration polarization and limiting current density of fuel cells with nanostructured electrodes. Nano Energy 1, 828–832. doi:10.1016/j.nanoen.2012.06.003
Julian, A. (2024). Topsoe: dynamic renewable ammonia production in China. Ashburn, VA: Ammonia Energy Association. Available online at: https://ammoniaenergy.org/articles/topsoe-dynamic-renewable-ammonia-production-in-china/(Accessed October 30, 2024).
Kong, B., Zhang, Q., and Daoutidis, P. (2024). Nonlinear model predictive control of flexible ammonia production. Control Eng. Pract. 148, 105946. doi:10.1016/j.conengprac.2024.105946
Li J., J., Chen, S., Wu, Y., Wang, Q., Liu, X., Qi, L., et al. (2021). How to make better use of intermittent and variable energy? A review of wind and photovoltaic power consumption in China. Renew. Sust. Energy Rev. 137, 110626. doi:10.1016/j.rser.2020.110626
Li Q., Q., Li, R., Pu, Y., Li, S., Sun, C., and Chen, W. (2021). Coordinated control of electric-hydrogen hybrid energy storage for multi-microgrid with fuel cell/electrolyzer/PV/battery. J. Energy Storage 42, 103110. doi:10.1016/j.est.2021.103110
Li, H., Xue, Y., Dai, T., Sun, H., and Wang, B. (2023). Collaborative optimal dispatch of electricity–hydrogen coupling system in chemical industry park considering hydrogen load response. Adv. Eng. Sci. 55, 93–100. doi:10.15961/j.jsuese.202200939
Li, C., Peng, T., Guo, D., Xu, D., Zhou, Z., and Piao, Z. (2025). Capacity configuration of green hydrogen energy storage system for wind farm group based on correction condition generated adversarial network. In: Ninth International Conference on Energy System, Electricity and Power (ESEP 2024); Tianjin, China: SPIE. p. 179–214. doi:10.1117/12.3060872
Mbatha, S., Cui, X., Panah, P. G., Thomas, S., Parkhomenko, K., Roger, A., et al. (2024). Comparative evaluation of the power-to-methanol process configurations and assessment of process flexibility. Energy Adv. 3, 2245–2270. doi:10.1039/D4YA00433G
Nikolaidis, P., and Poullikkas, A. (2017). A comparative overview of hydrogen production processes. Renew. Sust. Energy Rev. 67, 597–611. doi:10.1016/j.rser.2016.09.044
O'hayre, R., Cha, S. W., Colella, W., and Prinz, F. B. (2016). Fuel cell fundamentals. Hoboken, New Jersey: John Wiley and Sons.
Persson, M., Mignard, D., and Hogg, D. (2020). Insights on performance and an improved model for full scale electrolysers based on plant data for design and operation of hydrogen production. Int. J. Hydrogen Energy 45, 31396–31409. doi:10.1016/j.ijhydene.2020.08.255
Phan, T. T., Kim, S. K., Islam, J., Kim, M. J., and Lee, J. H. (2024). Degradation analysis of polymer electrolyte membrane water electrolyzer with different membrane thicknesses. Int. J. Hydrogen Energy 49, 875–885. doi:10.1016/j.ijhydene.2023.09.274
Qiu, Y., Li, Q., Ai, Y., Tang, X., Zhang, L., Huang, W., et al. (2023). Two-stage distributionally robust optimization-based coordinated scheduling of integrated energy system with electricity-hydrogen hybrid energy storage. Prot. Control Mod. Power Syst. 8, 33. doi:10.1186/s41601-023-00308-8
Risco-Bravo, A., Varela, C., Bartels, J., and Zondervan, E. (2024). From green hydrogen to electricity: a review on recent advances, challenges, and opportunities on power-to-hydrogen-to-power systems. Renew. Sust. Energy Rev. 189, 113930. doi:10.1016/j.rser.2023.113930
Sánchez, M., Amores, E., Abad, D., Rodríguez, L., and Clemente-Jul, C. (2018). Semi-empirical model and experimental validation for the performance evaluation of a 15 kW alkaline water electrolyzer. Int. J. Hydrogen Energy 43, 20332–20345. doi:10.1016/j.ijhydene.2018.09.029
Schwieters, T., Lickert, T., Metz, S., Hermesmann, M., Müller, T. E., and Stolten, D. (2023). Analysis of PEM water electrolyzer failure due to induced hydrogen crossover in catalyst-coated PFSA membranes. Membranes 13 (3), 348. doi:10.3390/membranes13030348
Shinagawa, T., Garcia-Esparza, A. T., and Takanabe, K. (2015). Insight on Tafel slopes from a microkinetic analysis of aqueous electrocatalysis for energy conversion. Sci. Rep. 5, 13801. doi:10.1038/srep13801
Smart Testsolutions (2023). Learn how to reduce electrolyser downtime. Stuttgart, Germany: Smart Testsolutions. Available online at: https://hydrogen-central.com/learn-how-to-reduce-electrolyser-downtime/(Accessed October 31, 2023).
Su, W., Zheng, W., Li, Q., Yu, Z., Han, Y., and Bai, Z. (2023). Capacity configuration optimization for green hydrogen generation driven by solar-wind hybrid power based on comprehensive performance criteria. Front. Energy Res. 11, 1256463. doi:10.3389/fenrg.2023.1256463
Sun, H., Guo, Q., Shen, X., Wang, B., Zhang, B., and Luo, Z. (2024). Energy internet: redefinition and categories. Energy Internet 1, 3–8. doi:10.1049/ein2.12008
Thunder Said Energy (2023). Green hydrogen: alkaline versus PEM electrolyser? Glastonbury, Connecticut: Thunder Said Energy. Available online at: https://thundersaidenergy.com/2023/01/17/green-hydrogen-alkaline-versus-pem-electrolysers/ (Accessed January 27, 2023).
Topsoe (2023). Topsoe signs first Australian green ammonia contract with Allied Green Ammonia. Denmark, Europe: Topsoe. Available online at: https://www.topsoe.com/press-releases/topsoe-signs-first-australian-green-ammonia-contract-with-allied-green-ammonia (Accessed November 4, 2023).
Topsoe (2024). World's first of its kind green ammonia plant inaugurated by Skovgaard Energy, Vestas, Topsoe. Denmark, Europe: Topsoe. Available online at: https://www.topsoe.com/press-releases/worlds-first-of-its-kind-green-ammonia-plant-inaugurated-by-skovgaard-energy-vestas-and-topsoe (Accessed August 26, 2024).
Vandenberghe, R., Humbert, G., Cai, H., Koirala, B. P., Sansavini, G., and Heer, P. (2025). Optimal sizing and operation of hydrogen generation sites accounting for waste heat recovery. Appl. Energy 380, 125004. doi:10.1016/j.apenergy.2024.125004
Wang, J., Pan, Z., Ge, H., Zhao, H., Xia, T., and Wang, B. (2023). Economic dispatch of integrated electricity–heat–hydrogen system considering hydrogen production by water electrolysis. Electron. 12, 4166. doi:10.3390/electronics12194166
Wang, Y., Wang, H., Dong, X., Do, Y., He, W., Zhao, Y., et al. (2024). Catalyst layer structure properties on hydrogen fuel generation performance of proton exchange membrane water electrolyzers. Fuel 364, 131040. doi:10.1016/j.fuel.2024.131040
Wu, X., Li, H., Wang, X., and Zhao, W. (2020). Cooperative operation for wind turbines and hydrogen fueling stations with on-site hydrogen production. IEEE Trans. Sustain. Energy 11, 2775–2789. doi:10.1109/TSTE.2020.2975609
Xia, Y., Cheng, H., He, H., Yang, J., Zheng, S., and Xu, T. (2023). Efficiency and consistency enhancement for alkaline electrolyzers driven by renewable energy sources. Commun. Eng. 2, 22. doi:10.1038/s44172-023-00070-7
Xu, Y., and Deng, Z. (2025). Bi-level planning of microgrid considering seasonal hydrogen storage and efficiency degradation of electrolyzer. IEEE Trans. Ind. Appl. 61 (1), 1385–1398. doi:10.1109/TIA.2024.3522458
Yang, L., Sun, X., Cao, X., Wang, B., and Zhang, H. (2024). Joint chance-constrained coordinated scheduling for electricity-heat coupled systems considering hydrogen storage. Energy Internet 1, 99–111. doi:10.1049/ein2.12007
Zhang, L., Dai, W., Zhao, B., Wang, Z., Liu, J., Zhou, X., et al. (2023). Multi-time-scale economic scheduling method for electro-hydrogen integrated energy system based on day-ahead long-time-scale and intra-day MPC hierarchical rolling optimization. Front. Energy Res. 11, 1132005. doi:10.3389/fenrg.2023.1132005
Keywords: renewable energy, water electrolysis, model convexification, electricity-hydrogencoupling system, hydrogen utilization
Citation: Tao Y, Xue Y, Du Y, Fan P and Chang X (2025) Optimization of electric-hydrogen coupling system in chemical park considering refined modelling of coupling equipment. Front. Energy Res. 13:1695588. doi: 10.3389/fenrg.2025.1695588
Received: 30 August 2025; Accepted: 15 September 2025;
Published: 27 October 2025.
Edited by:
Lun Yang, Xi’an Jiaotong University, ChinaCopyright © 2025 Tao, Xue, Du, Fan and Chang. This is an open-access article distributed under the terms of the Creative Commons Attribution License (CC BY). The use, distribution or reproduction in other forums is permitted, provided the original author(s) and the copyright owner(s) are credited and that the original publication in this journal is cited, in accordance with accepted academic practice. No use, distribution or reproduction is permitted which does not comply with these terms.
*Correspondence: Yixun Xue, eHVleWl4dW5AdHl1dC5lZHUuY24=