 Edward Jones
 Balwant Singh
- Department of Environmental Sciences, Faculty of Agriculture and Environment, The University of Sydney, Sydney, NSW, Australia
Organo-mineral interactions are important for the cycling and preservation of organic carbon (OC) in soils. To understand the role of soil mineral surfaces in organo-mineral interactions, we used a sequential density fractionation procedure to isolate <1.6, 1.6–1.8, 1.8–2.0, 2.0–2.2, 2.2–2.6, and >2.6 g cm−3 density fractions from topsoils (0–10 cm) of contrasting mineralogies. These soils were under natural vegetation of four major Australian soil types - Chromosol, Ferrosol, Sodosol, and Vertosol. The soils and their organic matter (OM) contents were found to be partitioned in four distinct pools: (i) particulate organic matter <1.6 g cm−3; (ii) phyllosilicate dominant 1.8–2.2 g cm−3; (iii) quartz and feldspar dominant >2.6 g cm−3; and (iv) Fe oxides dominant >2.0 g cm−3 (in the Ferrosol). X-ray photoelectron spectroscopy was used to investigate organic C and N bonding environments associated within each density fraction. Mineral pools were shown to be enriched in distinct organic functional groups: phyllosilicate dominant fractions were enriched with oxidized OC species (C-O, C=O, O=C-O) and protonated amide forms; quartz and feldspar dominated fractions were enriched in aliphatic C and protonated amide forms; Fe oxides dominant fractions had the greatest proportions of oxidized OC species and were low in protonated amide forms. The enrichment of different C species was related to the interaction of functional groups with the mineral surfaces. These results demonstrate the potential of mineral surfaces in influencing the chemical composition of OM bound in surfaces reactions and subsequently the stability of OM in organo-mineral interactions.
Introduction
Soil organic matter (SOM) describes a diverse continuum of organic compounds with highly variable composition, as well as different inherent stabilities and turnover rates (Kölbl and Kögel-Knabner, 2004). It has been shown that the stability of organic matter (OM) in soils can be enhanced by the formation of various organo-mineral associations between domains of SOM particles and the surfaces of soil minerals (Baldock and Skjemstad, 2000; Kaiser and Guggenberger, 2003; Kögel-Knabner et al., 2008). This increased stability is hypothesized to be gained from the protection of OM from mineralizing agents, thus increasing C mean residence time, up to millennial time periods (Baldock and Skjemstad, 2000). The amount of OM stabilized by soil minerals is known to be influenced by the mineral size, surface functional groups, specific surface area, and porosity of the minerals involved (Anderson, 1988; Mayer, 1994; Baldock and Skjemstad, 2000; Kaiser and Guggenberger, 2000). However, there remains a lack of understanding between mineralogy and chemistry of mineral associated SOM and the stabilizing mechanisms involved in the protection of SOM in-situ (von Lützow et al., 2006; Kögel-Knabner et al., 2008). Improved knowledge of these relationships is essential to developing management strategies in order to increase the quantity and stability of OM in soils. To model the turnover dynamics of SOC under changing climatic conditions or land management practices, the factors influencing organo-mineral formation, surface coverage, and organic C loading need to be parameterized. This research is of vital importance in Australia, a land with inherently low soil organic carbon (SOC) levels.
The chemical composition of SOM is largely driven by the quality of OM inputs, the stage of decomposition, soil management practices and the level of physical and chemical protection provided by soil minerals (Baldock and Skjemstad, 2000). However, the biotic and/or abiotic processes and modifications involved in transforming particulate OM into a material deposited on the surface of a soil mineral remains unclear. The process of unraveling this mystery is made difficult by the variety and structural complexity of the mineral and organic species involved, as well as the simultaneous operation of a range of bonding mechanisms (Kögel-Knabner et al., 2008). Sequential density fractionation (SDF) is a procedure that can minimize these complications by isolating distinct pools of SOM allowing the structure and function of organic molecules to be modeled (Christensen, 1992). When applying SDF fractions <1.60 or <1.85 g cm−3 contain mostly particulate OM forms, while OM found in higher densities is associated in some way with the mineral phase. The use of SDF has highlighted the importance of organo-mineral associations in controlling C turnover dynamics with up to >90 % of total OM found associated with mineral phases in soils and sediments (Mayer, 1994; Basile-Doelsch et al., 2007).
Sequential density fractionation has also shown that in general C and N contents, and C:N ratios of fractions decrease with increasing particle densities, while δ13C ratios and C turnover times increase (e.g., Baisden et al., 2002; Sollins et al., 2006). Decreased C:N ratios indicate increasing proportions of well-decomposed, microbial processed OM with increasing fraction density (Baldock et al., 1992; Golchin et al., 1994). Meanwhile, enrichment in δ13C of soil samples may be attributed to disproportionate retention of δ13C rich organic species or a result of continued microbial processing, a phenomenon that is well documented though not yet fully understood (Gleixner et al., 1993; Fernandez et al., 2003). These observations have led to the development of a layered mode of organo-mineral interactions on aluminosilicate minerals, with higher densities isolating organo-mineral associations with thinner deposits of OM that reveal microbial processed, proteinaceous substances at the mineral surface (Sollins et al., 2006). Sollins et al. (2009) observed an enrichment in δ13C within the density range of ~1.8–2.6 g cm−3 of four soils with contrasting mineralogies; however, above this density increases in C:N may be observed as well as decreases in both δ13C ratios and lignin phenol oxidation. This trend also coincides with shift in mineralogy, from phyllosilicates to primary minerals and Fe oxides, indicating that mineral surfaces may be driving these differences in OM composition. However, because the density of organo-mineral particles is determined by both the amount of OM associated with the particle as well the density of the sorbent mineral, it is difficult to discern to what extent mineral properties play in these relationships and to what extent these observations can be attributed to a reduction in the thickness of associated OM.
X-ray photoelectron spectroscopy (XPS) is able to quantitatively investigate the surface composition of materials (~10 nm) and is thus useful in investigating the composition of OM bound to mineral surfaces. The technique has been used, with or without Ar surface etching, to identify that OM is accumulated primarily on the surfaces of soil particles and that enrichment at mineral surfaces can reach levels up to 1000 times that found for bulk soil samples (Amelung et al., 2002; Gerin et al., 2003). Lombardi et al. (2006) used XPS analysis of chemically treated kaolinite clay deposits to identify that OM, probably humin, was strongly bound to the surface of the mineral. Meanwhile, Mikutta et al. (2009) provided evidence for mineral influence on both the quantity and composition of associated OM when investigating the formation of organo-mineral associations over a mineralogical timescale (0.3–4100 kyr) on Hawaiian Island soils derived from basaltic tephra. This study found that mineralogical development from low specific surface area primary minerals to high specific surface area and poorly crystalline minerals was accompanied with a large increase in mineral associated OM and an increase in lignin phenols over carbohydrates. Further mineralogical development to secondary Fe and Al (hydr)oxides and kaolin minerals then saw a relative decrease in associated OM and a depletion in lignin and carbohydrates when compared to particulate OM. These results remain cryptic without given further context and investigation in other environments and there remains a need to expand the knowledge on the effect of mineralogy on associated OM especially in Australian soils that possess a very different mineralogy and climatic conditions to those studied.
In this study we hypothesize that mineral properties have the potential to determine not only the content but also the composition of associated OM in major Australian soil groups. To investigate this we used XPS analysis of sequential density fractionated soils to identify: (i) if OM pools in different soil density fractions show discrete chemical composition; and (ii) if the chemical composition of OM in different soil density fractions varies with the mineral composition of soils.
Materials and Methods
Site Selection and Sample Collection
Four soil types, known to possess a diverse range of clay minerals, were selected for the study. All selected soil sites were situated in the state of New South Wales, Australia (Table 1). The sites were under native or naturalized vegetation and had never been cultivated for agricultural purposes, thus they provided a good representation of undisturbed native conditions for investigating organo-mineral associations. Bulk samples were taken from the topsoil (0–10 cm) at each of the four sites. Samples were air-dried and ground to obtain <2 mm for laboratory analyses.
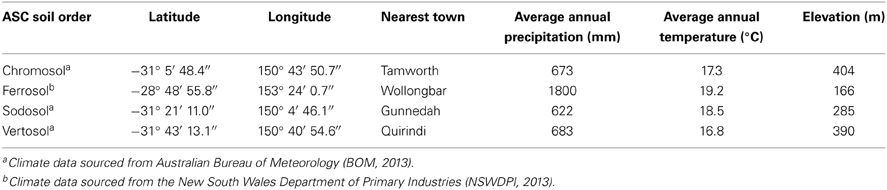
Table 1. Location, elevation and climatic data of the four sites used in the study.
General Characterization of Bulk Soils
Routine soil procedures were used to determine pH (1:5 H2O), electrical conductivity (1:5 H2O), cation exchange capacity (ammonium-acetate at pH 7) and exchangeable cations (Rayment and Higginson, 1992). Particle size analysis was performed using the pipette method (Gee and Bauder, 1986). Total C and N in the soils were determined by dry combustion method using a Vario Max CNS analyzer (Elementar Analysensysteme GmbH, Hanau, Germany).
Speciation of Fe (as well as Mn, Al, and Si) was determined by three methods. Total free Fe oxides were quantified using the dithionite-citrate-bicarbonate (DCB) method (Mehra and Jackson, 1960); poorly crystalline Fe and Al species were extracted by the acid ammonium oxalate (pH = 3.0) in the dark (Schwertmann, 1964); and organically bound Fe was estimated using the Na-pyrophosphate (pH = 10.0) extractable Fe procedure (McKeague, 1967). Alkali dissolution with 0.5 M NaOH was used to investigate the presence of poorly ordered aluminosilicate species in soils (Hashimoto and Jackson, 1960). The soil extracts were analyzed for Fe, Al, Mn, and Si using a Varian 720-ES inductively coupled plasma optical atomic emission spectrometer.
Mineralogical Analysis
Semi-quantitative mineralogical analysis of sand (2000–20 μm), silt (20–2 μm) and clay (<2 μm) sized particles was performed using X-ray diffraction (XRD) following the isolation of these particle size fractions using a sedimentation method based on Stoke's Law (Gee and Bauder, 1986). The size and density fraction samples were ground to a fine powder and randomly oriented samples were analyzed using monochromatic CuKα radiation at 30 kV and 28.5 mA (GBC MMA diffractometer). The samples were scanned from 4 to 65° 2θ at a speed of 1° 2θ min−1 and using a step size of 0.01° 2θ. Oriented samples from the clay fraction was also analyzed after various pre-treatments (i.e., Mg-saturated, Mg-saturated and ethylene glycol solvated, K-saturated and K-saturated and heated to 550°C) for the identification of phyllosilicate species (Brown and Brindley, 1980).
Sequential Density Fractionation
Soils were isolated into <1.6, 1.6–1.8, 1.8–2.0, 2.0–2.2, 2.2–2.6, and >2.6 g cm−3 fractions using the procedure adopted from Sollins et al. (2006, 2009). The density fractions were decided based on the clay mineral analysis of bulk soils to isolate SOM associated with various suites of soil minerals. Briefly, 25 g of air-dry soil was added to a 250 ml polycarbonate centrifuge bottle with 125 ml of 1.6 g cm−3 sodium polytungstate (SPT) solution. The centrifuge tube was shaken vigorously by hand to ensure the soil was well wetted with SPT solution and then shaken for 3 h on a horizontal shaker (300 rpm). The tubes were then centrifuged at 970g using a Spintron 175 for 30 min. Floating material (<1.6 g cm−3 fraction) was then aspirated under suction. SPT was recovered by filtering the aspirated liquid through a 0.7 μm glass fiber filter, readjusted to the target density and returned to the centrifuge tube. The tube was again shaken for a further 1 h and centrifuged. Following the second aspiration of floating material the density of the supernatant was recorded using a 20 ml pipette (all densities fell within ±0.05 g cm−3 of the target density). The supernatant was aspirated down to the pellet and filtered through a 0.7 μm glass fiber filter to recover the floating fraction. The two recovered soil fractions were rinsed on a 0.7 μm glass fiber filter multiple times with RO water to remove residual SPT to the point where the filtrate had an EC <50 μ S cm−1. The two yielded fractions were then dried at 60°C to obtain the <1.6 g cm−3 fraction. 125 ml of SPT solution of the next target density was then added to the centrifuge tube and the process repeated. The process was repeated for all fractions with the exception that removal of residual SPT in clay rich fractions was achieved by repeated washing with RO water in the centrifuge tubes as filtration became unviable. All recovered fractions were hand ground to a fine powder for further analyses.
Total C and N and δ13C
Density fractions were analyzed for total C, total N and δ13C by isotope ratio mass spectrometry (Delta V Thermo Finnigan). The δ13C values were measured against standards of beet sucrose, cane sucrose, IVA soil and BW algae and the analytical precision of the δ13C analysis was <0.1%.
X-ray Photoelectron Spectroscopy (XPS)
Photoelectron spectra were recorded on finely ground density fractions using an X-ray photoelectron spectrometer (ESCALAB250Xi) at the University of New South Wales. Samples were excited using monochromatic AlKα radiation (1486.68 eV) with a 90° photoelectron take off angle and vacuum conditions remaining below 9.1 × 10⁻⁴ mbar throughout the analysis. A 500 μm spot was analyzed with pass energies of 100 eV for survey scans and 20 eV for regions scans over C1s and N1s spectral lines. Atomic quantification was achieved by a process of linear background subtraction and fitting lines with a set of Gaussian curves with conversion of intensities to atomic concentrations through sensitivity factors (Moulder et al., 1992). Carbon peaks at 285.0, 286.5, 288.0, and 289.5 eV were assigned to aromatic and aliphatic functional groups (C-C/C-H), alcoholic and phenolic (C-O), carbonyl of amide/carboxylic (C=O) and carboxylate (O=C-O) bonding environments, respectively (Proctor and Sherwood, 1982). Nitrogen peaks at 400.9 and 402.5 eV were assigned to amine/amide (C-N) and protonated amine (C-N+), respectively (Abe and Watanabe, 2004).
Statistical Analysis
Analysis of variance was used to investigate significant differences between OC (g g−1), N content (g g−1), C:N ratio and δ13C across density fractions of a soil and corresponding density fractions of different soils. Data were log transformed where appropriate to achieve normality. Tukey's HSD was used for multiple comparison of mean values of three replicates for statistically significant results at p < 0.05. Linear regression was used to investigate the relationship of Fe concentration (% w/w) as determined by XPS and the relative concentration of O=C-O moieties for all density fractions of all soils.
Results and Discussion
General Characterization of Bulk Soils
The clay fraction of the four soils showed contrasting mineral compositions (Figure 1). The clay fraction of the Chromosol was dominated by illite with lesser amount of kaolinite, and the opposite trend was seen in the Sodosol with the dominance of kaolinite and illite being present in smaller amount (Figures 1A,C). The Vertosol clay fraction was dominated by smectite with illite and kaolinite being the accessory minerals (Figure 1D). In the Ferrosol, only kaolinite was identified in the oriented clay samples (Figure 1B), the random powder of the clay fraction also showed the presence of hematite, goethite and gibbsite (XRD pattern not shown). The silt and sand sized fractions were characterized by increasing proportions of primary minerals (quartz, feldspars and/or Fe bearing minerals) with reduced levels of phyllosilicates. Traces of phyllosilicates were still identifiable in all sand sized fractions except for the Sodosol. Small amounts of hematite were also identified in the sand and silt sized fractions of the Vertosol (data not shown). The Ferrosol was found to have the highest total C content of 6.11%, while the other three soils had very similar C levels that ranged from 1.82 to 2.06% (Table 2). As all of the soils investigated had acidic pH (≤6.5; Table 2), the total C thus represented OC in these soils. The Vertosol exhibited the highest CEC (403 mmolc kg−1), which is consistent with the dominance of smectite in the clay fraction of this soil. The Chromosol had the second highest CEC (183 mmolc kg−1) in accordance with its illite dominated clay fraction. Conversely the Sodosol had an extremely low CEC of 6.5 mmolc kg−1, which is in agreement with a texture comprising of 91% sand sized particles and kaolinite dominated clay fraction of the soil. Although the Ferrosol had high clay content, this was composed of variable charge minerals that conveyed a low CEC (64 mmolc kg−1) under the acidic conditions of the soil. The high organic carbon content has probably contributed most of the CEC in the Ferrosol.
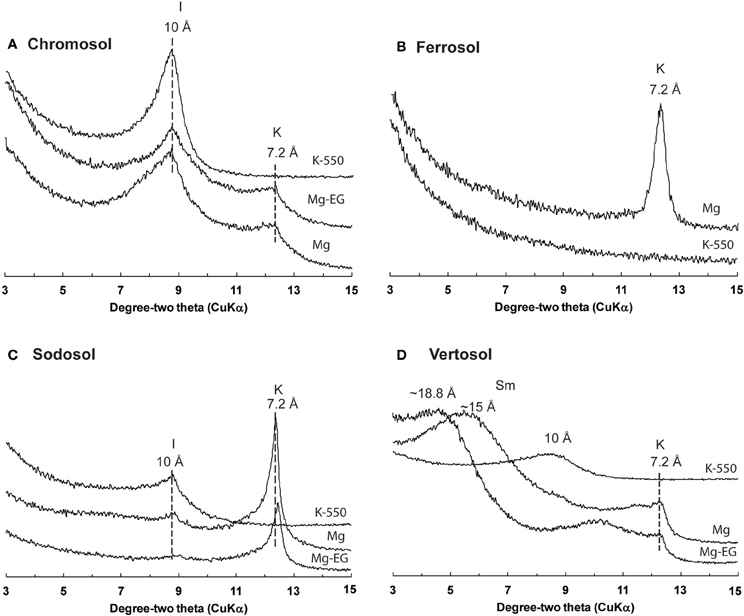
Figure 1. XRD analysis of the clay (<2 μm) fraction of bulk soil samples: (A) Chromosol, (B) Ferrosol, (C) Sodosol, and (D) Vertosol. XRD spectra from 3 to 15 degree-two theta (CuKα) after appropriate pre-treatments (K-550, potassium saturated and heated to 550°C; Mg, magnesium saturated; Mg-EG, magnesium ethylene glycol saturated) are displayed to demonstrate the presence of various phyllosilicate species within each soil; I, illite; K, kaolinite; Sm, smectite.
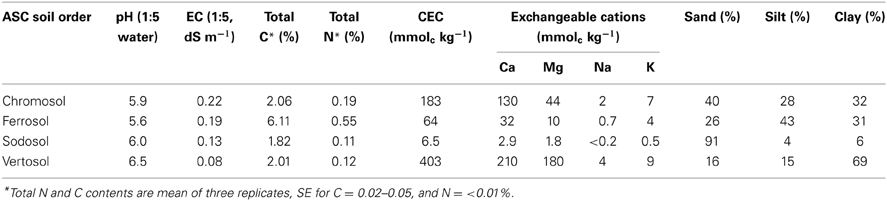
Table 2. Properties of bulk soil samples (< 2 mm) used in this study.
Extractable cation analyses showed that the Ferrosol had the highest amount of free Fe and Al oxides, with Fe accounting for approximately 15.0% of the total soil mass (Table 3). The Sodosol had the lowest concentration of all soils with only 0.3% Fe. The Vertosol had the highest concentration of oxalate extractable Fe, Mn and Si, which was up to half of that extracted using DCB suggesting a relatively high proportion of these elements exist in amorphous or poorly crystalline forms. In contrast, the Ferrosol had a small (4.0% of the DCB) proportion of oxalate extractable Fe, indicating the presence of mainly crystalline form of Fe (hematite and goethite) in the soil, as confirmed by XRD analysis. The ratio of oxalate: DCB Fe in the Chromosol and Sodosol was 0.15 and 0.27, respectively. Pyrophosphate extractable elements were also the highest in the Ferrosol indicating a relatively large amount of organically bound Fe (0.9%) and Al (0.4%) compared to the other soils. Alkali dissolution with NaOH gave very low Si and Al yields (data not presented) indicating negligible amounts of poorly crystalline aluminosilicates in these soils.
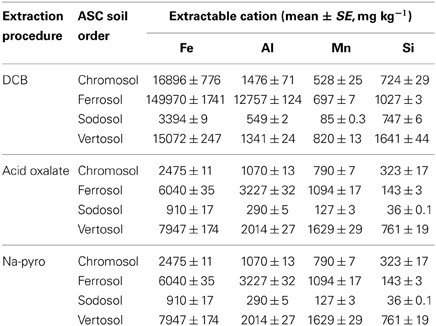
Table 3. Mean (n = 3) values and standard errors (mg kg−1) of iron, aluminium, manganese, and silicon extracted from bulk soil samples (<2 mm) using dithionite-citrate-bicarbonate (DCB), acid oxalate and sodium pyrophosphate (Na-pyro) extraction procedures.
Mineralogy of the Density Fractions
The inherent diversity of minerals, varying content of associated OM, micro-aggregation of minerals and coatings of phyllosilicates on primary mineral crystals or particulate OM species inhibits complete isolation of individual mineral species. For example, quartz was identified, at least in trace quantities, in all density fractions of all soil samples (Table 4). Nevertheless, suites of soil minerals were found to be enriched in certain fractions as expected from their densities.
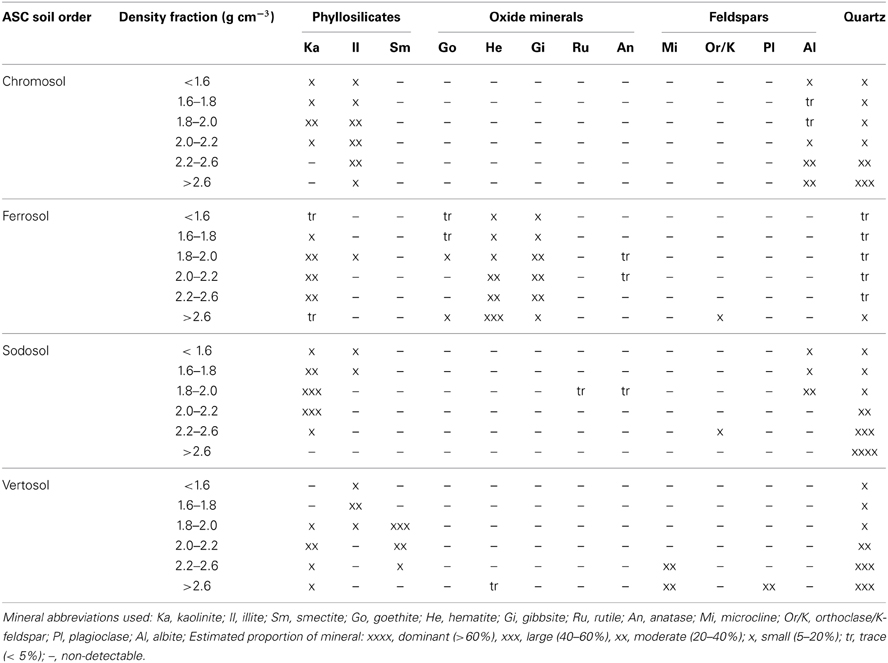
Table 4. Semi-quantitative X-ray diffraction mineralogical analysis of the six density fractions of the four soils.
The lightest two fractions (<1.6 and 1.6–1.8 g cm−3) of all soils were dominated by organic matter and/or other amorphous material, visual observation identified large proportions of fresh or slightly decomposed plant debris as well as significant quantities of charcoal (Table 4). Varying quantities of mineral species were also identified in the <1.8 g cm−3 fractions, which could be due to mineral coatings on particulate OM surfaces or entrainment of mineral species during density fractionation.
The proportion of minerals then increased with increasing fraction density. The pattern of mineral isolation in fractions of the Chromosol, Sodosol and Vertosol density fractions were found to be similar and distinct to the mineralogy identified for the Ferrosol as expected from the preliminary mineralogical analysis. For the Chromosol, Sodosol and Vertosol, the mineralogy of the 1.8–2.0 and 2.0–2.2 g cm−3 density fractions were dominated by phyllosilicates with some inclusions from quartz and feldspars. The mineralogy of the 2.2–2.6 g cm−3 in these soils was generally dominated by quartz and feldspar except for the Chromosol where illite was present in about the same proportion. The increased proportion of illite in the 2.2–2.6 g cm−3 fraction of the Chromosol is likely due the higher specific gravity, 2.6–2.9 of illite than smectite (2.0–3.0 g cm−3) and kaolinite (2.65 g cm−3) (Lide, 2007) and the larger crystal size of illite in this soil compared to phyllosilicate minerals in the Sodosol and Vertosol. The heaviest fraction (>2.6 g cm−3) of the Chromosol, Sodosol and Vertosol was dominated by quartz and feldspars with only traces of hematite identified in the Vertosol (Table 4).
In contrast, hematite, goethite and gibbsite were identified in all fractions of the Ferrosol. Some contributions of kaolinite were identified in the 1.8–2.0, 2.0–2.2 and 2.2–2.6 g cm−3 fractions, however, all heavier fractions (>2.0 g cm−3) were dominated by hematite along with gibbsite and goethite with only traces of quartz identified.
C and N Concentrations and C/N Ratio of the Density Fractions
Mass spectrometry results showed that total C and N contents in the density fractions decreased significantly with increasing density in the soils with phyllosilicates dominated clay fractions (i.e., Chromosol, Sodosol and Vertosol), except for increased total C in the 1.6–1.8 g cm−3 (cf. <1.6 g cm−3) in the Chromosol and increased total N content in the 1.8–2.0 g cm−3 (cf. 1.6–1.8 g cm−3) in the Vertosol (Figures 2A,B; Table 5). The OC content of the phyllosilicate dominant 1.8–2.0 g cm−3 fraction was not statistically significant between the three soils even though the content and proportion of phyllosilicate minerals did vary. However, in the smectite rich, 2.0–2.2 g cm−3 fraction of the Vertosol both C and N were significantly lower than the corresponding fractions in the Chromosol and Sodosol, which were dominated by illite and kaolinite. The difference in the total C and N contents in the 2.0–2.2 g cm−3 fraction of the three phyllosilicates dominated soils (i.e., Chromosol, Sodosol and Vertosol) could be attributed to the fraction of the soil recovered in this density fraction. In the Vertosol (4.4%) a substantially greater soil mass was recovered than the Chromosol (1.1%) and the Sodosol (0.5%), hence significantly lower C and N contents (i.e., dilution effect) than the other two soils. The trend in total C and N contents in the density fractions was reinforced by the X-ray photoelectron spectroscopy analysis, which also showed the mass percentage of C and N decreased with increasing density (Figures 3A,B). The decrease was most substantial from <1.6 g cm−3 fraction to the 1.6–1.8 g cm−3 fraction, and then it decreased steadily in the subsequent heavier density fractions, with few exceptions. These results are in accordance with previous studies covering a wide range of mineralogy and climatic conditions (e.g., Sollins et al., 2009; Plante et al., 2010; Bonnard et al., 2012) and are intuitive as the association of OM acts to reduce net organo-mineral particle density meaning that fractions with a higher OM content are generally lighter. The Ferrosol had similar C and N concentrations in the first two fractions as compared to the other soils, but significantly higher total C and N contents in the fractions heavier than 1.8 g cm−3.
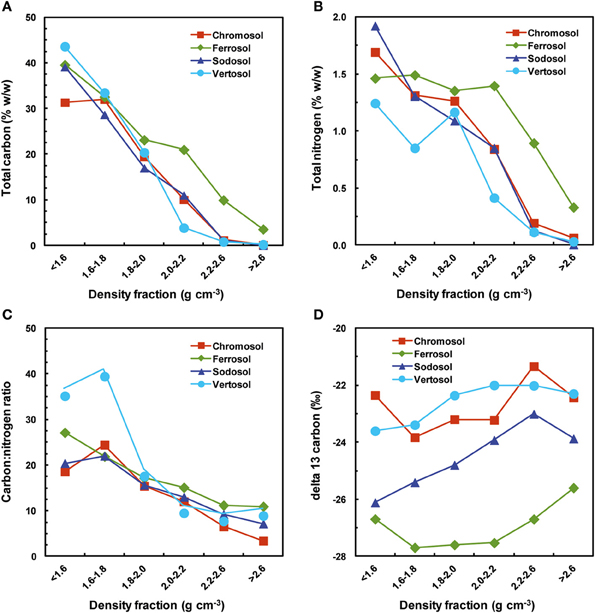
Figure 2. Total carbon, total nitrogen, carbon:nitrogen ratio and δ13C ratio of the four soils obtained from mass spectrometry. (A) Total carbon (% g g−1); (B) total nitrogen (% g g−1); (C) carbon:nitrogen ratio; (D) δ13C ratio (‰). The δ13C (‰) of bulk soils topsoil were found as follows: Chromosol = −22.4; Ferrosol = −26.2; Sodosol = −25.3; Vertosol = −22.3.
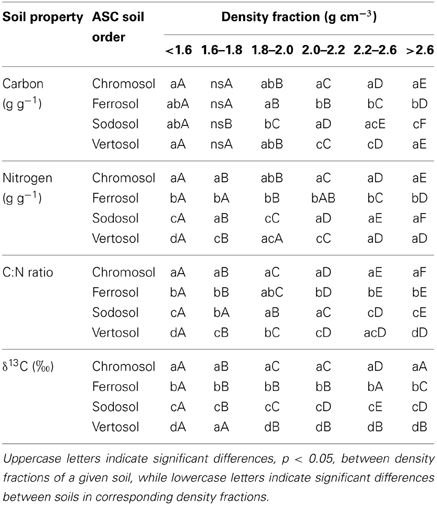
Table 5. Statistical analysis between the differences in mean values of carbon and nitrogen contents, C:N ratios and δ13C ratios between different soils and density fractions.
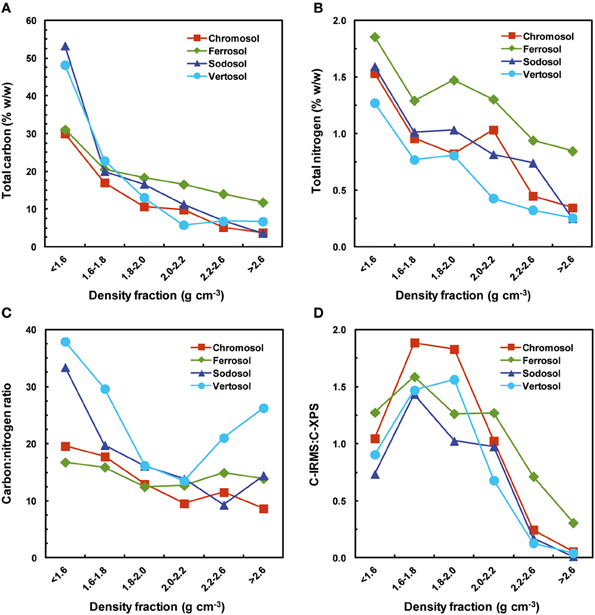
Figure 3. Total carbon, total nitrogen, carbon:nitrogen ratio of the four soils obtained from XPS analysis, including a comparison of the carbon:nitrogen ration obtained by mass spectrometry. (A) Total carbon (% g g−1); (B) total nitrogen (% g g−1); (C) carbon:nitrogen ratio; (D) C:N obtained by mass spectrometry: C:N obtained by XPS.
The C:N ratio also decreased with increasing density fractions with few, yet notable exceptions (Figure 2C). The increase in C:N ratio to the 1.6–1.8 g cm−3 fraction was attributed to charcoal observed in this fraction, although the high porosity of charcoal gives it a low specific gravity, the skeletal density of produced chars have been shown to have maximum densities of up to 2.0–2.1 g cm−3 (Brown et al., 2006). The C:N increase in the Vertosol for the heaviest fraction was intriguing, although it has been observed in other studies (Sollins et al., 2009; Throop et al., 2013). The presence of hematite and the high Fe content of this fraction as observed by XPS (Table 6) suggest a role of Fe oxides in this observation, which is reinforced by the fact that the C:N ratio converges toward that of the Ferrosol. Similarly, in a study by Sollins et al. (2009) two soils displayed similar trend with a shift in mineralogy from phyllosilicate dominated (chlorite, vermiculite, kaolinite) lighter fractions to inclusions of hematite or other Fe bearing primary minerals in the fractions.
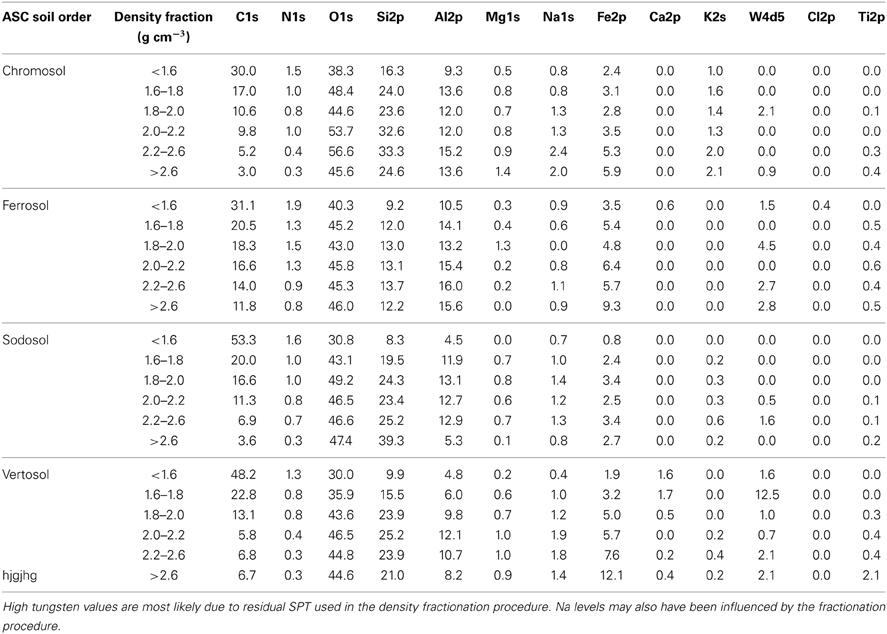
Table 6. Surface elemental composition of the six density fractions of the four soils obtained from the survey scans of X-ray photoelectron spectra (% w/w).
δ13C of Density Fractions
All soils showed a progressive increase in δ13C ratios across between the 1.6–1.8 g cm−3 fraction up to the 2.2–2.6 g cm−3 (Figure 2D) reflecting many other studies (Basile-Doelsch et al., 2009; Sollins et al., 2009; Throop et al., 2013). Following this the Chromosol, Sodosol and Vertosol showed a decline to the heaviest fraction (>2.6 g cm−3) while the δ13C of the Ferrosol showed a substantial increase in the heaviest fraction (Figure 2D).
Soil Mass, Total C and N Distribution Across the Density Fractions
Total C and N was calculated as the product of C or N content of the fractions and the total mass yielded for each fraction. The distribution of total C and N in the density fractions showed similar trends in the soils with a phyllosilicate dominated clay fraction, i.e., Chromosol, Sodosol, Vertosol (Figures 4A,C,D). For these soils the first density fraction (<1.6 g cm−3) contained either a local or absolute maximum value for the proportion of total soil C. The proportion of total C then decreased immediately in the 1.6–1.8 g cm−3 fraction before rising toward another local or absolute maximum value in the phyllosilicate dominated fractions (1.8–2.0 or 2.0–2.2 g cm−3). The proportion of total C then fell sharply in the heaviest fraction (>2.6 g cm−3). The heaviest fraction contained very little of the total C even though it often accounted for a large proportion of the soil mass (e.g., 84% for the Sodosol). In sharp contrast to other soils, the total C in the Ferrosol was found to be concentrated in the two heaviest fractions (>2.2 g cm−3) dominated by Fe oxides (Figure 4B). The proportions of soil mass, total C and total N were found to be 98, 85, and 85%, respectively in the heaviest two fractions (>2.2 g cm−3) of the Ferrosol compared to average values of 72, 18, and 36%, respectively for the corresponding fractions in the other three soils. The proportion of total N in the density fractions of the four soils followed a trend similar to total C except the occurrence of substantially higher total N content in the 2.2–2.6 g cm−3 fraction of the Chromosol and in the 2.0–2.2 and 2.2–2.6 g cm−3 fractions of the Vertosol.
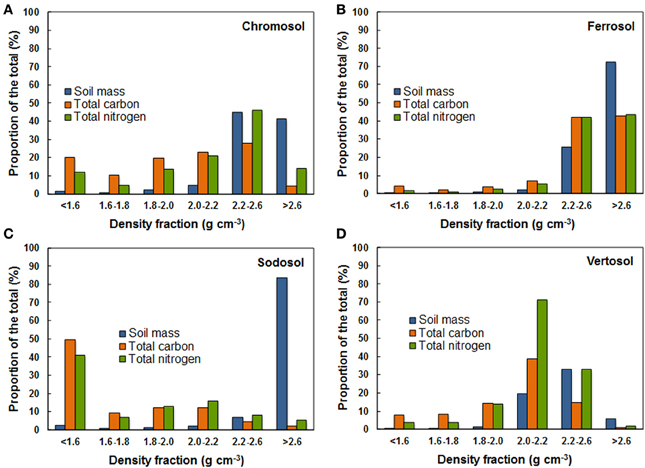
Figure 4. Proportion of soil mass, total carbon, and total nitrogen distributed in density fraction of the four soils. (A) Chromosol—recovery of soil mass, total carbon, and total nitrogen = 94.8, 105.0, and 110.9%; (B) ferrosol—recovery of soil mass, total carbon, and total nitrogen = 102.2, 102.1, and 95.8%; (C) sodosol—recovery of soil mass, total carbon, and total nitrogen = 96.8, 89.5, and 89.6%; (D) vertosol—recovery of soil mass, total carbon, and total nitrogen = 60.9, 84.2, and 127.5%. High yields of nitrogen observed by the Chromosol and Vertosol are likely due to adsorption of nitrogen from the sodium-polytungstate solution by smectite and illite during sequential density fractionation. Low mass and carbon yields may be attributable to the small size of smectite particles most likely lost during the washing process.
XPS Composition of the Soil Density Fractions
XPS derived data show that mass percentage of mineral structural components such as O, Si, Al, Fe, Mg, Na, and K increased with the increasing density of fractions (Table 6). The majority of this increase generally occurred in the 1.8–2.0 g cm−3 density fraction after which concentrations plateaued or continued to increase slowly with few exceptions. Conversely, C and N concentrations were found to decrease with increasing density. The C:N ratio decreased with increasing density up to 2.0–2.2 g cm−3 fraction for all soils, and after this it remained similar or increased substantially in the heaviest fraction of Vertosol and Sodosol (Figure 3C). XPS elemental data are consistent with the XRD mineralogical analysis, for example, high contents of K in the Chromosol signifying the presence of illite and albite in the soil; the highest level of Si was identified in the >2.6 g cm−3 fraction of the Sodosol which is primarily quartz; very high levels of Fe in the Vertosol in the >2.6 g cm−3 fraction reaffirming the presence of hematite observed in the XRD analysis. The presence of Fe in all samples suggests that Fe was intimately associated with OM whether in crystalline (Ferrosol) or amorphous forms (other soils).
For the soils with phyllosilicate dominated clay fraction (Sodosol, Chromosol, and Vertosol), the proportion of aliphatic to total C decreased with increasing density reaching to a minimum value in the 2.0–2.2 g cm−3 fraction before rising again in the quartz and other primary mineral dominated fractions (Table 7). Conversely, the proportions of C-O and C=O moieties were seen to increase in the phyllosilicate dominated fractions, reaching maximum values in the 2.0–2.2 g cm−3 fraction before decreasing in the >2.6 g cm−3 fraction, where levels were smaller than those observed in the POM fractions. The proportion of carboxylic compounds were also elevated in the phyllosilicate dominated fractions, however no clear trend was seen in the >2.6 g cm−3 fraction. However, a strong positive relationship was observed between the log-transformed values of Fe (Table 6) and the proportion of O=C-O functional group (Table 7) in all density fractions of all soils (p < 0.001, R2 = 0.556) (Figure 5).
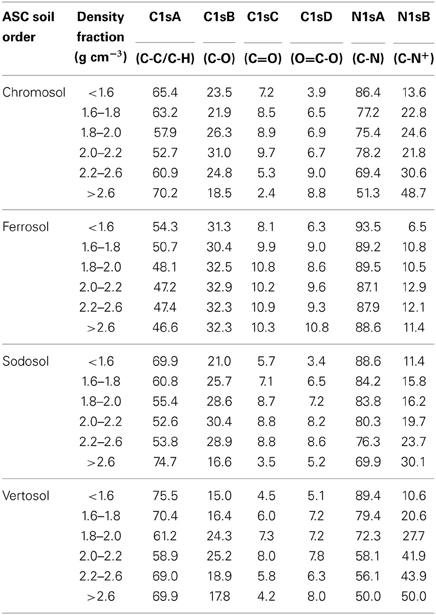
Table 7. The relative atomic concentrations of different C and N bonding environments of the six density fractions of the four soils determined by deconvoluted XPS spectra.
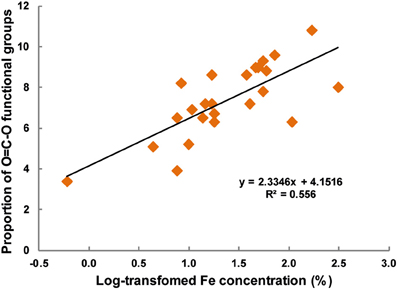
Figure 5. The relationship between log transformed Fe concentration (% w/w) and the proportion of O=C-O functional groups derived from the XPS analysis of various density fractions of the four soils.
The proportions of quaternary bonded protonated amide form of N increased with increasing fraction density for all soils with a complementary decrease in amide/amine N forms (Table 7). The Vertosol showed greater increases in the proportion of protonated amide form in the 2.0–2.2 g cm−3 fraction in comparison to the Chromosol and Sodosol.
A comparison of the C contents determined using mass spectrometry and XPS shows that XPS derived C content is lower in lighter fractions (1.6–1.8 and 1.8–2.0 g cm−3) and higher in heavier fractions (2.2–2.6 and > 2.6 g cm−3) than the bulk C analysis in the corresponding fractions obtained by mass spectrometry (Figure 3D). Although, the samples were finely ground for the XPS analysis, these results reflect the nature of XPS as a surface technique, probing ~10 nm of the surface layer; the variability in the C data suggest possible existence of OM in the micropores in lighter fractions (<2.0 g cm−3) and variable or incomplete coating of larger crystal size of minerals by OM in heavier fractions (>2.2 g cm−3). A similar result was also obtained for N (data not presented).
Variation in the proportions of organic structures across the density fractions was less pronounced in the Ferrosol as compared to the other soils (Table 7). The proportion of aliphatic to oxidized C groups was much smaller in the Ferrosol compared to the other three soils across all density fractions and there was no increase in the proportion of aliphatic C in the >2.6 g cm−3 fraction as observed for the other three soils. The proportion of C-O moieties was constant across all density fractions, and the proportion of C=O moieties was also constant across Fe oxides dominant fractions (>2.0 g cm−3). Only the proportion of O=C-O was found to increase with increasing density in the Fe oxides dominated fractions. The Ferrosol also showed the highest proportion of amide/amine N to protonated amide forms in all fractions and did not display the strong decreasing trend as observed in the other soils (Table 7).
General Discussion
Bonding Environments of Organic Species within Density Fractions in Relation to Mineral Surface Properties
All fractions yielded heterogeneous C and N bonding environments, representing diverse assemblies of organic compounds. However, clear enrichment or depletion in particular organic functional groups were observed across density fractions and soil types. The composition of OM was found to be associated with (i) phyllosilicates, (ii) quartz and feldspars, and (iii) Fe oxides, and how they may be influenced by mineral surface properties are discussed below with focus on bonding mechanisms, including: ligand exchange, H-bonding, polyvalent cation bridges, direct electrostatic attraction and weak interactions.
Phyllosilicate dominated fractions
The chemical composition of OC associated in the phyllosilicate dominated fractions was characterized by the highest proportions of oxidized C species (C-O, C=O, O=C-O) of all fractions and an increase in protonated amide forms relative to the particulate organic matter (Table 7). These results reflect those of Sollins et al. (2009), who found that OM associated with phyllosilicate fractions had an increased oxidation state as determined using alkaline cupric-oxide oxidation. The enrichment of O-C and O=C-O moieties provides support for the importance of ligand exchange reactions and/or H-bonding in these fractions. Ligand exchange reactions produce a strong bond between singly coordinate hydroxyl groups at the edges of phyllosilicates, and carboxyl and phenolic groups of the OM (von Lützow et al., 2006; Kögel-Knabner et al., 2008). While the delocalization of electrons produced by the presence of O in O-C and O=C-O, as well as C=O moieties, may also encourage H-bonding processes with the mineral surface (von Lützow et al., 2006). Mortland (1986) suggested that the basal O planes of expansible minerals, such as smectite, are weaker electron donors and subsequently these minerals would form weaker H-bonds with the oxidized OM species. Our study provided evidence for this as the proportions of oxidized C species were lower in smectite rich fractions of the Vertosol compared to the Chromosol and Sodosol, however the increases in oxidized C species were similar to the other soils when compared relative to POM and could be indicative of differences in OM inputs. Thus it remains difficult to elucidate to what extent each of the bonding mechanisms play in stabilizing OM at the mineral surface, however both appear to be important. Another bonding mechanism proposed for expansible minerals is polyvalent cation bridges (Kleber et al., 2007). In these reactions negatively charged organic functional groups, such as disassociated carboxyls and hydroxyls, form bonds with delocalized charges on phyllosilicates through intermediary polyvalent cations that act to neutralize the repulsive force between the two entities. We suggest that polyvalent cation bridging plays a minor role in OM stabilization in these soils as the kaolinite rich fraction of the Sodosol, which has the lowest potential to form these bonds due its low CEC, has the highest proportion of O=C-O and O-C moieties compared to the corresponding fractions in the Chromosol and Vertosol. Conversely the increase in protonated amide forms, especially in the 2.0–2.2 g cm−3 fraction of the Vertosol, indicates that stabilization by direct ionic attraction between positively charged OM species and delocalized negative charges at the mineral surface may be important, especially in the bonding of N rich proteinaceous species at the mineral surface.
Quartz and feldspar dominated fractions
The OM associated with quartz and feldspar dominated fractions (>2.6 g cm−3) was characterized by the highest proportions of aliphatic C and protonated amide N for all densities (Table 7). This increase in the proportion of aliphatic C was mirrored by a strong decrease in C-O and C=O functional groups, however, the proportion of carboxylic groups in oxidized C species varied between the soils; a strong increase was shown for the Vertosol, a slight decrease for the Chromosol and a strong decrease was seen for the Sodosol. Quartz and feldspar surfaces are typified by low specific surface areas, low surface reactivity and consist of some unsatisfied siloxane bonds. These surfaces generally have a lower potential to protect SOM as compared to phyllosilicate surfaces; however, coating with Fe oxides or phyllosilicate species may increase their surface chemistry and adsorption capacity, which present difficulties in the interpretation of results. Many other studies have demonstrated a strong correlation between quartz and feldspar minerals and aliphatic C, for example, aliphatic C was found to be enriched in bulk samples of coarse textured soils (Capriel et al., 1995) as well as the fine-fraction of coarse-textured soils (Galantini et al., 2004; Mao et al., 2007); and that the relative proportions of mineral associated aliphatic C was increased significantly with increasing sand content of soils (Jindaluang et al., 2013). The high C content of aliphatic species in this fraction could explain the increase in C:N observed in the Vertosol by mass spectrometry, while the high concentration of aliphatic C and O=C-O moieties we observed in these fractions reinforce the importance of lipids and ligand bonded waxes in this fraction, with lipids apparently more important in the Sodosol which showed reduced proportions of the O=C-O group. Thus we conclude that the bonding of OM to quartz and feldspar surfaces in these soils appears to be characterized by H-bonding of non-ionic lipids and polysaccharides and ligand bonding of waxes with the small amount of unsatisfied siloxane bonds. However, the increase in protonated amide forms and low C:N ratios seen in the two soils with purer quartz and feldspar surfaces suggest that electrostatic attraction of proteinaceous species to unsatisfied siloxane bonds is also important.
Fe oxides dominated fractions
Iron oxides dominant fractions (>2.0 g cm−3) in the Ferrosol are characterized by higher proportion of oxidized C bonding environments as well as a higher proportion of amide/amine N to protonated amide species compared to corresponding densities in other soils (Table 7). These findings are consistent with the observations that Fe oxides exhibit a strong affinity for highly oxidized, lignin derived organic species (Kaiser et al., 1997; Mikutta et al., 2007). The low observed levels of protonated amide species compared to non-Fe oxides soils are intuitive as Fe/Al oxides carry a net positive charge at the existing soil pH, thus protonated amide forms would be repelled by the mineral surfaces. We suggest that the association of SOM with mineral surfaces is occurring primarily through ligand exchange reactions in these fractions. In these reactions negatively charged organic domains, such as hydrolyzed carboxylic acids or phenolic compounds, form strong monodentate and bidentate covalent bonds with unsatisfied hydroxyl groups of Fe or Al oxides (Sollins et al., 1996). We suggest carboxyl groups are relatively more important in this interaction as the proportion of O=C-O moieties was seen to increase with density, while C=O moieties remained relatively stable. We believe that this finding is justified as carboxylic acids have a lower pKa compared to phenols (e.g., pKa of methoxyacetic acid is 3.54 compared to pKa of 9.65 of methoxyphenol) and are thus more likely to disassociate in the acidic conditions of these soils to provide the anionic form necessary for ligand bond formation (Essington, 2004).
The role of Fe in organo-mineral formation may also be seen in the other three soils with a positive correlation observed between Fe concentration and O=C-O moieties across all fractions of all soils (Figure 5). The effect of Fe coatings on other soils minerals may be seen in the >2.6 g cm−3 fraction of the Vertosol, which is dominated by quartz and feldspars but contains traces of hematite and other amorphous Fe forms (Tables 4, 6). We observed that this fraction behaves more like the corresponding fraction in the Ferrosol, compared to the Chromosol or Sodosol, in three ways. Firstly the proportion of carboxylic functional groups is seen to increase, secondly the decrease in δ13C was not as well pronounced, thirdly the C:N ratio as measured by mass spectrometry converges toward that of the Ferrosol. We thus suggest that even small amounts of Fe can have significant influence on the composition of associated OM.
Mineral Control Over C Content and Total C within Density Fractions
The analysis uncovered general decreases in C and N contents across successively dense fractions. The Ferrosol was found to store significantly (p < 0.05) higher C and N concentrations in heavier density fractions (>2.0 g cm−3) compared to the other soils, reinforcing the greater OM adsorption capacity of Fe oxides compared to phyllosilicates (Kahle et al., 2004; Kaiser et al., 1997), with hematite and goethite possessing large and reactive surface areas and sorption capacities of up to 110–140 mg OC per g oxide (Tipping, 1981; Kaiser and Guggenberger, 2007). Another interesting result was the lower C content in the smectite-rich 2.0–2.2 g cm−3 fraction of the Vertosol compared to the Chromosol and Sodosol, as laboratory experiments have shown that OC is adsorbed faster and in greater quantities to smectite compared to other phyllosilicates (Varadachari et al., 1995; Dontsova and Bigham, 2005), and studies have shown lower mineralization rates when dissolved OM is incubated with smectite minerals compared to illite and significantly lower when compared to kaolinite (Saidy et al., 2012). However, investigations of OC and mineralogy in situ suggest that smectite rich soils do not hold more OC compared to soils containing other phyllosilicates, including Ferrosols (Dalal and Mayer, 1986; Wattel-Koekkoek et al., 2001; Krull and Skjemstad, 2003; Wattel-Koekkoek and Buurman, 2004). In our study, a substantially greater proportion of soil mass was recovered in the 2.0–2.2 g cm−3 fraction of the Vertosol (i.e., lower C loading) compared to the Chromosol and the Sodosol, hence the variable C (and N) contents in the density fraction of these soils cannot be attributed to the adsorption capacity of the clay minerals.
When considering the total C stored in each fraction large variations were seen between the soils, which appeared to be influenced by mineral size, surface area and mineral type (Figures 4A–D). For instance the Sodosol, which is comprised primarily of sand sized quartz particles and has little reactive surface area, stored 65.6% of total recovered C in the POM fraction (<1.8 g cm−3) (Figure 4C). Meanwhile, the Vertosol and the Chromosol stored large proportions, 63.8 and 66.8% respectively, of total recovered C in the phyllosilicate dominated fractions (Figures 4A,D), with the Ferrosol having 83.2% of total C recovered in the two heaviest fractions (>2.2 g cm−3) (Figure 4B). This demonstrates that the soils have different inherent capacities to form organo-mineral associations. Jindaluang et al. (2013) demonstrated that, within soil groups, the amount of mineral associated C and N in the 1.85–2.60 g cm−3 fractions was significantly increased with increasing clay content. Our results reflect this relationship, with the proportion of total C held in phyllosilicate dominated fractions of the soils correlated to total clay content independent of phyllosilicate type: i.e., Vertosol > Chromosol > Sodosol. The presence of most of the OC in the free POM form in the Sodosol offers a contrast to other studies that have found that OM is primarily associated with mineral phases in soils and sediments (Mayer, 1994; Basile-Doelsch et al., 2007).
Mineral Control Over SOM Stability within Density Fractions and Management Implications
The different levels of mineral associated OM in each soil will confer different levels of OM stability under disturbances, e.g., cultivation or increased atmospheric temperatures, which may disrupt soil aggregates and increase turnover OM rates in soils (Six et al., 2002; Chivenge et al., 2007). von Lützow et al. (2006) described the <1.8 g cm−3 fraction as an active SOM pool due to its high turnover rates. X-ray photoelectron spectroscopy spectra support this idea showing that C in these fractions is enriched in aliphatic C, which is less stable than aromatic bonded C and more easily metabolized by decomposing agents (Demyan et al., 2012) (Table 7). The fact that most of the Sodosol's C is stored in this relatively less stable due to its reduced capacity to form organo-mineral interactions may explain why the Sodosol contains 20% less C compared to the Chromosol and Vertosol (Table 2), even though it receives similar rainfall (Table 1). Meanwhile the ligand exchange reactions between oxidized C species and the surface of Fe oxides are known as the strongest organo-mineral interactions, with incubation studies show that OM sorbed to Fe oxides are resistant to desorption by chemical reagents (Kaiser and Guggenberger, 2007; Mikutta et al., 2007). This suggests that SOM in the Ferrosol, which is predominately associated with mineral fractions, may be the most chemically stable of all soils, a theory that has grounding in another study reporting a much longer turnover time of SOM in clayey Oxisols (400–700 years) than coarse textured Ultisols (~300 years) and Spodosols (<100 years) in the Brazilian Amazon (Telles et al., 2003). The mineralogical composition of the Oxisol was similar to the Ferrosol used in our study, with a mixture of kaolinite, sesquioxides, and quartz. Organic matter associated with mineral surfaces may limit C losses during agricultural production as demonstrated by a study of paired sites, under natural conditions versus continuous cultivation, showed that the relative proportions of OM associated with the 2.1–2.4 g cm−3 fractions increased from 21 to 32%, and from 6 to 16% at the two sites studied (Plante et al., 2010). Thus the potential of organo-mineral interactions to protect SOM over long time scales and under cultivation reinforces the need for further research to improve our understanding of the complex factors driving formation of organo-mineral interactions.
Supporting Evidence for the Layered Mode of OM Accumulation on Mineral Surfaces (Sollins et al., 2006, 2009)
Our trends in C, N, C:N ratios and δ13C over phyllisilicate fractions closely resemble those of previous studies and give weight to the argument of a layered mode of OM accumulation (Sollins et al., 2006, 2009). A similar trend was observed across successively dense Fe oxide dominated fractions in the Ferrosol, indicating a similar effect in these soils. Further, evidence provided by the XPS analysis in our study provides further evidence for the model. When investigating the ratio of C concentration observed from mass spectrometry (which measure total C in a sample) compared to those of XPS (a surface only technique, ~10 nm) we observed that the XPS technique increasingly over-estimated C content with successively dense mineral fractions (>1.8 g cm−3) (Figure 3D). This indicates that decreases in C observed with increasing density of fractions are derived from a greater proportion from decreases in the thickness of the OM deposit as compared to reductions in the coverage area of OM deposits. Another interpretation of this observation may be due to increased mineral size at higher densities increasing the amount of C observed by XPS, however we believe that our process of hand grinding all samples to a fine powder would have reduced this effect.
Our analysis also identified some other trends not fully covered by the layered mode including the decrease in δ13C observed in each of the >2.6 cm−3 fractions for the Chromosol, Sodosol, and Vertosol, as well as the increase in C:N ratio observed in the same fraction for some soils. It is difficult to elucidate whether the observed decreases in δ13C ratios is a reflection of a reduced level of microbial processing of this OM prior to attachment or a different source material of the attached OM. However, as this change also coincides with a shift in mineralogy from phyllosilicate to quartz and feldspars species there appears to be an underlying effect of the associated minerals behind this observation. The influence of mineral surfaces on microbial communities within the soil environment offers a possible explanation, as fungal colonies are known to be concentrated in the sand sized fractions which account for the majority of the >2.6 g cm−3 fraction, while bacteria predominate in the clay and silt sized fractions (Sessitsch et al., 2001). Furthermore, Sylvia et al. (2005) identified higher C:N ratios for fungal tissues, ~10:1, compared to bacteria, ~4:1, which could explain the increase in C:N ration observed in the >2.6 g cm−3 fraction of the Vertosol. As much of the OM associated with mineral surfaces has been processed by micro-organisms, further investigation is warranted into the complex interactions between minerals and micro-organisms in the formation of organo-mineral associations.
Conclusion
A distinct chemical fingerprint of SOM was isolated in the density fractions of soils displaying similar mineralogies. The sequential density fractionation procedure was thus found effective in isolating functional pools of discrete mineralogy and OM composition. The relative enrichment or depletion of C and N functional groups was controlled by mineral surface properties with the chemical composition of OM becoming enriched in domains that are able to most effectively associate with mineral surfaces. For example Fe oxides were enriched in O=C-O moieties that are able to form strong ligand bonds with hydroxyls groups at the mineral surface; meanwhile phyllosilicate minerals were enriched in O-C, O=O, and O=C-O forms, which are able to associate via ligand bonding to singly coordinated hydroxyls at crystal edges and/or induce H-bonding across basal O planes of the minerals. Differences in OM composition were also seen between different phyllosilicate species, for example smectite dominated fractions were enriched in protonated amide forms that may form electrostatic bonds with delocalized surface charges of the mineral. This study provides insight into the interactions between mineral surfaces and SOM, and how mineral surfaces may influence not only the content but also the composition of associated OM. This knowledge is useful in modeling SOM dynamics and C flows between labile and stable pools when attempting to optimize SOM levels.
Conflict of Interest Statement
The authors declare that the research was conducted in the absence of any commercial or financial relationships that could be construed as a potential conflict of interest.
Acknowledgments
The authors would like to thank Mr. Jim Harris, Mr. Philip Pearson, Mr. Noel Ticehurst and Dr. Lukas Van Zwieten for their assistance in soil sampling; Drs. Bill Gong and Claudia Keitel for XPS and IRMS analysis, respectively; and Ms Lorie Watson for providing various laboratory equipment.
References
Abe, T., and Watanabe, A. (2004). X-ray photoelectron spectroscopy of nitrogen functional groups in soil humic acids. Soil Sci. 169, 35–43. doi: 10.1097/01.ss.0000112016.97541.28
Amelung, W., Kaiser, K., Kammerer, G., and Sauer, G. (2002). Organic carbon at soil particle surfaces—evidence from x-ray photoelectron spectroscopy and surface abrasion. Soil Sci. Soc. Am. J. 66, 1526–1530. doi: 10.2136/sssaj2002.1526
Anderson, D. W. (1988). The effect of parent material and soil development on nutrient cycling in temperate ecosystems. Biogeochemistry 5, 71–97. doi: 10.1007/BF02180318
Baisden, W. T., Amundson, R., Cook, A. C., and Brenner, D. L. (2002). Turnover and storage of C and N in five density fractions from California annual grassland surface soils. Global Biogeochem. Cycles 16, 1117. doi: 10.1029/2001GB001822
Baldock, J. A., Oades, J. M., Waters, A. G., Peng, X., Vassallo, A. M., and Wilson, M. A. (1992). Aspects of the chemical structure of soil organic materials as revealed by solid-state13C NMR spectroscopy. Biogeochemistry 16, 1–42. doi: 10.1007/BF00024251
Baldock, J., and Skjemstad, J. (2000). Role of the soil matrix and minerals in protecting natural organic materials against biological attack. Org. Geochem. 31, 697–710. doi: 10.1016/S0146-6380(00)00049-8
Basile-Doelsch, I., Amundson, R., Stone, W. E. E., Borschneck, D., Bottero, J. Y., Moustier, S., et al. (2007). Mineral control of carbon pools in a volcanic soil horizon. Geoderma 137, 477–489. doi: 10.1016/j.geoderma.2006.10.006
Basile-Doelsch, I., Brun, T., Borschneck, D., Masion, A., Marol, C., and Balesdent, J. (2009). Effect of landuse on organic matter stabilized in organomineral complexes: a study combining density fractionation, mineralogy and δ 13C. Geoderma 151, 77–86. doi: 10.1016/j.geoderma.2009.03.008
Bonnard, P., Basile-Doelsch, I., Balesdent, J., Masion, A., Borschneck, D., and Arrouays, D. (2012). Organic matter content and features related to associated mineral fractions in an acid, loamy soil. Eur. J. Soil Sci. 63, 625–636. doi: 10.1111/j.1365-2389.2012.01485.x
Brown, G., and Brindley, G. W. (1980). “X-ray identification procedures for clay mineral identification,” in Crystal Structures of Clay Minerals and Their X-Ray Identification, eds G. W. Brindley and G. Brown (London: Mineralogical Society), 305–359.
Brown, R. A., Kercher, A. K., Nguyen, T. H., Nagle, D. C., and Ball, W. P. (2006). Production and characterization of synthetic wood chars for use as surrogates for natural sorbents. Org. Geochem. 37, 321–333. doi: 10.1016/j.orggeochem.2005.10.008
Bureau of Meteorology. (2013). Climate and past weather. Available online at: http://www.bom.gov.au/climate/.
Capriel, P., Beck, T., Borchert, H., Gronholz, J., and Zachmann, G. (1995). Hydrophobicity of the organic matter in arable soils. Soil Biol. Biochem. 27, 1453–1458. doi: 10.1016/0038-0717(95)00068-P
Chivenge, P. P., Murwira, H. K., Giller, K. E., Mapfumo, P., and Six, J. (2007). Long-term impact of reduced tillage and residue management on soil carbon stabilization: implications for conservation agriculture on contrasting soil. Soil Tillage Res. 94, 328–337. doi: 10.1016/j.still.2006.08.006
Christensen, B. (1992). Physical fractionation of soil and organic matter in primary particle size and density separates. Adv. Soil Sci. 20, 1–90. doi: 10.1007/978-1-4612-2930-8_1
Dalal, R. C., and Mayer, R. J. (1986). Long term trends in fertility of soils under continuous cultivation and cereal cropping in southern Queensland. II. Total organic carbon and its rate of loss from the soil profile. Aust. J. Soil Res. 24, 281–292. doi: 10.1071/SR9860281
Demyan, M. S., Rasche, F., Schulz, E., Breulmann, M., Müller, T., and Cadisch, G. (2012). Use of specific peaks obtained by diffuse reflectance fourier transform mid-infrared spectroscopy to study the composition of organic matter in a Haplic Chernozem. Eur. J. Soil Sci. 63, 189–199. doi: 10.1111/j.1365-2389.2011.01420.x
Dontsova, K. M., and Bigham, J. M. (2005). Anionic polysaccharide sorption by clay minerals. Soil Sci. Soc. Am. J. 69, 1026–1035. doi: 10.2136/sssaj2004.0203
Essington, M. E. (2004). Soil and Water Chemistry: An Integrative Approach. Boca Raton, FL: CRC press.
Fernandez, I., Mahieu, N., and Cadisch, G. (2003). Carbon isotopic fractionation during decomposition of plant materials of different quality. Global Biogeochem. Cycles 17, 1075.
Galantini, J. A., Senesi, N., Brunetti, G., and Rosell, R. (2004). Influence of texture on organic matter distribution and quality and nitrogen and sulphur status in semiarid Pampean grassland soils of Argentina. Geoderma 123, 143–152. doi: 10.1016/j.geoderma.2004.02.008
Gee, G. W., and Bauder, J. W. (1986). “Particle-size analysis,” in Methods of Soil Analysis: Part 1. Physical and Mineralogical Methods II, ed A. Klute (Madison: Soil Science Society of America), 383–411.
Gerin, P. A., Genet, M. J., Herbillon, A. J., and Delvaux, B. (2003). Surface analysis of soil material by X-ray photoelectron spectroscopy. Eur. J. Soil Sci. 54, 589–604. doi: 10.1046/j.1365-2389.2003.00537.x
Gleixner, G., Danier, H. J., Werner, R. A., and Schmidt, H. L. (1993). Correlations between the 13C content of primary and secondary plant products in different cell compartments and that in decomposing basidiomycetes. Plant Physiol. 102, 1287–1290. doi: 10.1104/pp.102.4.1287
Golchin, A., Oades, J., Skjemstad, J., and Clarke, P. (1994). Study of free and occluded particulate organic matter in soils by solid state 13 C Cp/MAS NMR spectroscopy and scanning electron microscopy. Aust. J. Soil Res. 32, 285–309. doi: 10.1071/SR9940285
Hashimoto, M. L., and Jackson, I. (1960). Rapid dissolution of allophane and kaolinite after dehydration. Clays Clay Miner. 7, 102–113. doi: 10.1346/CCMN.1958.0070104
Jindaluang, W., Kheoruenromne, I., Suddhiprakarn, A., Singh, B. P., and Singh, B. (2013). Influence of soil texture and mineralogy on organic matter content and composition in physically separated fractions soils of Thailand. Geoderma 195, 207–219. doi: 10.1016/j.geoderma.2012.12.003
Kahle, M., Kleber, M., and Jahn, R. (2004). Retention of dissolved organic matter by phyllosilicate and soil clay fractions in relation to mineral properties. Org. Geochem. 35, 269–276. doi: 10.1016/j.orggeochem.2003.11.008
Kaiser, K., and Guggenberger, G. (2000). The role of DOM sorption to mineral surfaces in the preservation of organic matter in soils. Org. Geochem. 31, 711–725. doi: 10.1016/S0146-6380(00)00046-2
Kaiser, K., and Guggenberger, G. (2003). Mineral surfaces and soil organic matter. Eur. J. Soil Sci. 54, 219–236. doi: 10.1046/j.1365-2389.2003.00544.x
Kaiser, K., and Guggenberger, G. (2007). Sorptive stabilization of organic matter by microporous goethite: sorption into small pores vs. surface complexation. Eur. J. Soil Sci. 58, 45–59. doi: 10.1111/j.1365-2389.2006.00799.x
Kaiser, K., Guggenberger, G., Haumaier, L., and Zech, W. (1997). Dissolved organic matter sorption on subsoil and minerals studied by 13C-NMR and DRIFT spectroscopy. Eur. J. Soil Sci. 48, 301–310. doi: 10.1111/j.1365-2389.1997.tb00550.x
Kleber, M., Sollins, P., and Sutton, R. (2007). A conceptual model of organo-mineral interactions in soils: self-assembly of organic molecular fragments into zonal structures on mineral surfaces. Biogeochemistry 85, 9–24. doi: 10.1007/s10533-007-9103-5
Kögel-Knabner, I., Guggenberger, G., Kleber, M., Kandeler, E., Kalbitz, K., Scheu, S., et al. (2008). Organo-mineral associations in temperate soils: integrating biology, mineralogy, and organic matter chemistry. J. Plant Nutr. Soil Sci. 171, 61–82. doi: 10.1002/jpln.200700048
Kölbl, A., and Kögel-Knabner, I. (2004). Content and composition of free and occluded particulate organic matter in a differently textured arable Cambisol as revealed by solid-state13C NMR spectroscopy. J. Plant Nutr. Soil Sci. 167, 45–53. doi: 10.1002/jpln.200321185
Krull, E. S., and Skjemstad, J. O. (2003). δ 13C and δ 15N profiles in 14C-dated Oxisol and Vertisols as a function of soil chemistry and mineralogy. Geoderma 112, 1–29. doi: 10.1016/S0016-7061(02)00291-4
Lombardi, K. C., Mangrich, A. S., Wypych, F., Rodrigues-Filho, U. P., Guimarães, J. L., and Schreiner, W. H. (2006). Sequestered carbon on clay mineral probed by electron paramagnetic resonance and X-ray photoelectron spectroscopy. J. Colloid Interface Sci. 295, 135–140. doi: 10.1016/j.jcis.2005.08.015
Mao, J., Fang, X., Schmidt-Rohr, K., Carmo, A. M., Hundal, L. S., and Thompson, M. L. (2007). Molecular-scale heterogeneity of humic acid in particle-size fractions of two Iowa soils. Geoderma 140, 17–29. doi: 10.1016/j.geoderma.2007.03.014
Mayer, L. M. (1994). Relationships between mineral surfaces and organic carbon concentrations in soils and sediments. Chem. Geol. 114, 347–363. doi: 10.1016/0009-2541(94)90063-9
McKeague, J. A. (1967). An evaluation of 0.1 M pyrophosphate and pyrophosphate – dithionite in comparison with oxalate as extractants of the accumulation products in podzols and some other soils. Can. J. Soil Sci. 47, 95–99. doi: 10.4141/cjss67-017
Mehra, O. P., and Jackson, M. L. (1960). Iron oxide removal from soils and clays by a dithionite-citrate system buffered with sodium bicarbonate. Clays Clay Miner. 7, 317–327. doi: 10.1346/ccmn.1958.0070122
Mikutta, R., Mikutta, C., Kalbitz, K., Scheel, T., Kaiser, K., and Jahn, R. (2007). Biodegradation of forest floor organic matter bound to minerals via different binding mechanisms. Geochim. Cosmochim. Acta 71, 2569–2590. doi: 10.1016/j.gca.2007.03.002
Mikutta, R., Schaumann, G. E., Gildemeister, D., Bonneville, S., Kramer, M. G., Chorover, J., et al. (2009). Biogeochemistry of mineral–organic associations across a long-term mineralogical soil gradient (0.3–4100kyr), Hawaiian Islands. Geochim. Cosmochim. Acta 73, 2034–2060. doi: 10.1016/j.gca.2008.12.028
Mortland, M. (1986). “Mechanisms of adsorption of nonhumic organic species by clays,” in Interactions of Soil Minerals with Natural Organics and Microbes, eds P. M. Huang and M. Schnitzer (Madison: Soil Science Society of America), 59–76.
Moulder, J. F., Stickle, W. F., Sobol, P. E., and Bomben, K. D. (1992). Handbook of X-ray Photoelectron Spectroscopy. Stanford, CA: Perin-Elmer.
New South Wales Department of Primary Industries. (2013). Climate at the wollongbar primary industries institute. Available online at: http://www.dpi.nsw.gov.au/research/centres/wollongbar/climate.
Plante, A. F., Virto, I., and Malhi, S. S. (2010). Pedogenic, mineralogical and land-use controls on organic carbon stabilization in two contrasting soils. Can. J. Soil Sci. 90, 15–26. doi: 10.4141/CJSS09052
Proctor, A., and Sherwood, P. (1982). X-ray photoelectron spectroscopic studies of carbon fiber surface. Surf. Interface Anal. 4, 212–219. doi: 10.1002/sia.740040508
Rayment, G. E., and Higginson, F. R. (1992). Australian Laboratory Handbook for Soil and Water Chemical Methods. Melbourne, VIC: Inkata.
Saidy, A. R., Smernik, R. J., Baldock, J. A., Kaiser, K., Sanderman, J., and Macdonald, L. M. (2012). Effects of clay mineralogy and hydrous iron oxides on labile organic carbon stabilisation. Geoderma 173, 104–110. doi: 10.1016/j.geoderma.2011.12.030
Schwertmann, U. (1964). The differentiation of iron oxides in soils by a photochemical extraction with acid ammonium oxalate. Z. Pflanz. Bodenkunde 105, 194–202. doi: 10.1002/jpln.3591050303
Sessitsch, A., Weilharter, A., Gerzabek, M. H., Kirchmann, H., and Kandeler, E. (2001). Microbial population structures in soil particle size fractions of a long-term fertilizer field experiment. Appl. Environ. Microbiol. 67, 4215–4224. doi: 10.1128/AEM.67.9.4215-4224.2001
Six, J., Conant, R. T., Paul, E. A., and Paustian, K. (2002). Stabilization mechanisms of soil organic matter: implications for C-saturation of soils. Plant Soil 241, 155–176. doi: 10.1023/A:1016125726789
Sollins, P., Homann, P., and Caldwell, B. A. (1996). Stabilization and destabilization of soil organic matter: mechanisms and controls. Geoderma 74, 65–105. doi: 10.1016/S0016-7061(96)00036-5
Sollins, P., Kramer, M. G., Swanston, C., Lajtha, K., Filley, T., Aufdenkampe, A. K., et al. (2009). Sequential density fractionation across soils of contrasting mineralogy: evidence for both microbial- and mineral-controlled soil organic matter stabilization. Biogeochemistry 96, 209–231. doi: 10.1007/s10533-009-9359-z
Sollins, P., Swanston, C., Kleber, M., Filley, T., Kramer, M., Crow, S., et al. (2006). Organic C and N stabilization in a forest soil: evidence from sequential density fractionation. Soil Biol. Biochem. 38, 3313–3324. doi: 10.1016/j.soilbio.2006.04.014
Sylvia, D., Fuhrmannm, J. J., Hartel, P., and Zuberer, D. A. (2005). Principles and Applications of Soil Microbiology. New Jersey, NJ: Pearson Prentice Hall.
Telles, E. C. C., Camargo, P. B., Martinelli, L. A., Trumbore, S. E., Costa, E. S., Santos, J., et al. (2003). Influence of soil texture on carbon dynamics and storage potential in tropical forest soils of Amazonia. Global Biogeochem. Cycles 17, 1040. doi: 10.1029/2002GB001953
Throop, H. L., Lajtha, K., and Kramer, M. (2013). Density fractionation and 13C reveal changes in soil carbon following woody encroachment in a desert ecosystem. Biogeochemistry 112, 409–422. doi: 10.1007/s10533-012-9735-y
Tipping, E. (1981). The adsorption of aquatic humic substances by iron oxides. Geochim. Cosmochim. Acta 45, 191–199. doi: 10.1016/0016-7037(81)90162-9
Varadachari, C., Mondal, A. H., and Ghosh, K. (1995). The influence of crystal edges on clay-humus complexation. Soil Sci. 159, 185–190. doi: 10.1097/00010694-199515930-00005
von Lützow, M., Kogel-Knabner, I., Ekschmitt, K., Matzner, E., Guggenberger, G., Marschner, B., et al. (2006). Stabilization of organic matter in temperate soils: mechanisms and their relevance under different soil conditions - a review. Eur. J. Soil Sci. 57, 426–445. doi: 10.1111/j.1365-2389.2006.00809.x
Wattel-Koekkoek, E. J. W., and Buurman, P. (2004). Mean residence time of kaolinite and smectite-bound organic matter in Mozambiquan Soils. Soil Sci. Soc. Am. J. 68, 154–161. doi: 10.2136/sssaj2004.1540
Keywords: sequential density fractionation, X-ray photoelectron spectroscopy, organic matter composition, mineralogy, clay minerals, soil organic matter
Citation: Jones E and Singh B (2014) Organo-mineral interactions in contrasting soils under natural vegetation. Front. Environ. Sci. 2:2. doi: 10.3389/fenvs.2014.00002
Received: 12 December 2013; Paper pending published: 03 January 2014;
Accepted: 12 January 2014; Published online: 05 February 2014.
Edited by:
Xinhua Peng, Chinese Academy of Sciences, ChinaReviewed by:
Nabeel K. Niazi, University of Agriculture Faisalabad, PakistanGeertje J. Pronk, Technische Universität München, Germany
Copyright © 2014 Jones and Singh. This is an open-access article distributed under the terms of the Creative Commons Attribution License (CC BY). The use, distribution or reproduction in other forums is permitted, provided the original author(s) or licensor are credited and that the original publication in this journal is cited, in accordance with accepted academic practice. No use, distribution or reproduction is permitted which does not comply with these terms.
*Correspondence: Balwant Singh, Department of Environmental Sciences, Faculty of Agriculture and Environment, The University of Sydney, 1 Central Ave., Australian Technology Park, Eveleigh, NSW 2015, Australia e-mail:YmFsd2FudC5zaW5naEBzeWRuZXkuZWR1LmF1