 Manoeli Lupatini1,2
 Afnan K. A. Suleiman1
 Rodrigo J. S. Jacques1
 Zaida I. Antoniolli1
 Adão de Siqueira Ferreira3
 Eiko E. Kuramae2
 Luiz F. W. Roesch4*
- 1Departamento de Solos, Universidade Federal de Santa Maria, Santa Maria, Brazil
- 2Department of Microbial Ecology, Netherlands Institute of Ecology (NIOO-KNAW), Wageningen, Netherlands
- 3Instituto de Ciências Agrárias, Universidade Federal de Uberlândia, Uberlândia, Brazil
- 4Universidade Federal do Pampa, São Gabriel, Brazil
Microbes have a central role in soil global biogeochemical process, yet specific microbe–microbe relationships are largely unknown. Analytical approaches as network analysis may shed new lights in understanding of microbial ecology and environmental microbiology. We investigated the soil bacterial community interactions through cultivation-independent methods in several land uses common in two Brazilian biomes. Using correlation network analysis we identified bacterial genera that presented important microbial associations within the soil community. The associations revealed non-randomly structured microbial communities and clusters of operational taxonomic units (OTUs) that reflected relevant bacterial relationships. Possible keystone genera were found in each soil. Irrespective of the biome or land use studied only a small portion of OTUs showed positive or negative interaction with other members of the soil bacterial community. The more interactive genera were also more abundant however, within those genera, the abundance was not related to taxon importance as measured by the Betweenness Centrality (BC). Most of the soil bacterial genera were important to the overall connectance of the network, whereas only few genera play a key role as connectors, mainly belonged to phyla Proteobacteria and Actinobacteria. Finally it was observed that each land use presented a different set of keystone genera and that no keystone genus presented a generalized distribution. Taking into account that species interactions could be more important to soil processes than species richness and abundance, especially in complex ecosystems, this approach might represent a step forward in microbial ecology beyond the conventional studies of microbial richness and abundance.
Introduction
Understanding the interaction among different taxa within a soil microbial community and their responses to environmental changes is a central goal in microbial ecology and very important to better explore the complexity of soil processes. Soil microbial ecologists have borrowed several complex ecological theories from macroecology, including competitive strategies (Prosser et al., 2007) and biogeography (Griffiths et al., 2011). Most of the statistical techniques adapted to microbial systems have been used to test these theories however; they are only focused on single properties of the microbial communities. The studies have been focused on microbial alpha and/or beta diversity to answer fundamental ecological questions (e.g., to understand how different soil management types affect the bacterial community diversity and composition). On the other hand, interactions among associated taxon could contribute more to ecosystem processes and functions than species diversity in soil environmental processes (Zhou et al., 2011).
Within a microbial community, interactions can be visualized as ecological networks, in which interactive taxa are linked together, either directly or indirectly through intermediate species. The study of networked systems has received great attention in the last years, especially in the mathematical and social sciences, mainly as result of the increasing availability to obtain and analyse large datasets. These methods have been applied to the study of various biological contexts including healthy microbiota in human microbiome (Duran-Pinedo et al., 2011; Faust and Raes, 2012), cancer (Choi et al., 2005), food webs (Estrada, 2007), marine microbial community (Steele et al., 2011), and recently this technique have been used to better understand soil microbial processes by examining complex interactions among microbes (Prasad et al., 2011; Roesch et al., 2012). The use of network analysis in microbial ecology has the potential for exploring inter-taxa correlations allowing an integrated understanding of soil microbial community structure and the ecological rules. This approach can truly be applied to large soil microbial datasets offering new insights into the microbial community structure and the ecological rules guiding community assembly (Barberán et al., 2012).
The networks analysis could be essential to explain several fundamental questions still unclear about microbial ecological theories. A good example is related to presence or not of keystone species. The concept of keystone species was introduced in microbial ecology and to date the identification of keystone taxa or populations is a critical issue in soil microbial ecology given the extreme complexity, high diversity, and uncultivated status of the large portion of community (Zhou et al., 2011). Keystones are important to maintain the function of the microbial community and their extinction might lead to community fragmentation (Martín González et al., 2010). Another important issue that network analysis could explain is the importance of the abundance of taxa for supporting the structure and function of the soil microbial community. So far, most of literature studies have focused the attention on dominant species is soil ecosystems (Campbell and Kirchman, 2013). However, low abundant taxa should participate significantly in ecosystem functioning despite their low abundance and therefore some of them may be considered as keystones (Rafrafi et al., 2013).
In order to gain understanding on the organization of a complex microbial communities, here we used correlation network analysis to study soil microbial organization. Specifically we addressed the following questions: (i) Is it possible to detect keystone bacterial taxa in soils? (ii) If yes, are the keystone taxa exclusive to each land use or they are the same in most land uses? (iii) Are the most abundant taxa more important to connect distincts operational taxonomic units (OTUs) and maintain the structure of microbial interactions in soil? To answer those questions we performed a large-scale pyrosequencing-based analysis of the 16S rRNA gene on replicate samples from two biomes in Brazil and implemented microbial ecological network analysis to examine how the microbial community members interact with each other and which members are important to support the microbial community structure in the land uses studied. Our central objective was to characterize and to understand ecological networks pattern in soil microbial communities based on high-throughput sequencing data.
Materials and Methods
Sampling Sites and Sample Collection
To analyse the soil bacterial community interactions, soil samples were collected within two biomes in Brazil: one site was located within the Pampa biome which covers an area shared by Brazil, Argentina, and Uruguay in the southern of South America and is characterized by typical vegetation of native grassland, with sparse shrub and tree formations (Overbeck et al., 2007). The soils from this biome came from two sites. At site A, soil samples were collected in areas with four different land uses: natural pasture (30° 00′ 38.2″ S and 54° 50′ 17.4″ W)—currently used for grazing of cattle; native forest (30° 00′ 39.7″ S and 54° 50′ 05.6″ W)—used only for preservation of wildlife; soybean field (30° 00′ 40.3″ S and 54° 50′ 13.2″ W)—cultivated under no-tillage system on oat straw; 9-years-old Acacia tree plantation (Acacia mearnsii Willd.) (30° 00′ 27.5″ S and 54° 50′ 10.2″ W) (for more details about areas and sampling see Lupatini et al., 2013—Raw sequences were submitted to the NCBI Sequence Read Archive under the study number SRP013204, experiment number SRX255448). At site B, soil samples were collected from a natural forest (30° 24′ 09.3″ S and 53° 52′ 59.1″ W) and 8-years-old pasture (30° 24′ 08.9″ S and 50° 53′ 05.9″ W) used for grazing of cattle (for more details about areas and sampling see sequences were submitted to the NCBI Sequence Read Archive under the study number SRP013204, experiment number SRX148308). Composite samples (four sub-samples per sampling point) were collected during the spring of 2010 by taking 5 cm diameter, 0–5 cm depth cores. Equal masses of sub-samples removed from cores were pooled and mixed. Four biological repetitions were taken per each land use. DNA was isolated from at least 1 g of soil using the PowerSoil® DNA Isolation Kit (MO BIO Laboratories Inc., Carlsbad, CA, USA), according to the manufacturer's instructions.
The second sampling site was located within the Brazilian Savanna biome, also known as Cerrado. The Cerrado is a representative biome in central Brazil and the second largest biome in species diversity of South America. It is characterized by high diversity of plants with over 10,000 species (nearly half are endemic) and different vegetation types including forest formations, savannas, and grasslands (Oliveira and Marquis, 2002). The soil sampling at Cerrado biome was carried out in a natural forest (19° 20′ 41″ S and 48° 00′ 58″ W); 20-years-old pasture used for grassing (19° 20′ 42″ S and 48° 05′ 22″ W); 15-years-old sugarcane field (19° 20′ 43″ S and 48° 05′ 49″ W); and Pinus plantation (19° 04′ 39″ S and 48° 10′ 19″ W) (for more details about areas and sampling see Rampelotto et al., 2013—Raw sequences were submitted to the NCBI Sequence Read Archive under the study number SRP017965, experiment number SRX217724). Each soil sample was taken as a cut out measuring 30 × 20 × 5 cm (L × W × D). Four subsamples were collected randomly within this cut out and were passed through a 3.35-mm sieve. Genomic DNA was extracted from 250 mg of soil sample using Soil DNA Isolation Kit (Norgen, Canada) as described by the manufacturer.
16S rRNA Gene Amplification and Pyrosequencing
The 16S rRNA gene fragments were sequenced using 454 GS FLX Titanium (Lib-L) chemistry for unidirectional sequencing of the amplicon libraries. Barcoded primers allow for combining amplicons of multiple samples into one amplicon library and, furthermore, enable the computational separation of the samples after the sequencing run. Independent PCR reactions were performed for each soil sample to amplify the V1-V2 region (311 nucleotides) with the primers 27F and 338R. The primers were attached to the GS FLX Titanium Adaptor A-Key (5′-CCATCTCATCCCTGCGTGTCTCCGACTCAG-3′) and Adaptor B-Key (5′-CCTATCCCCTGTGTGCCTTGGCAGTCTCAG-3′) sequences, modified for use with GS FLX Titanium Em PCR Kits (Lib-L) and a two-base linker sequence was inserted between the 454 adapter and the 16S rRNA primers to reduce any effect the composite primer might have on PCR efficiency. PCR reactions were carried out in triplicate with the GoTaq PCR core system (Promega, Madison, WI, USA). The mixtures contained 5 μl of 10× PCR buffer, 200 mM dNTPs, 100 mM of each primer, 2.5 U of Taq polymerase, and approximately 100 ng of DNA template in a final volume of 50 μl. The PCR conditions were 94°C for 2 min, 30 cycles of 94°C for 45 s; 55°C for 45 s; and 72°C for 1 min extension; followed by 72°C for 6 min. The PCR products were purified and combined in equimolar ratios with the quantitative DNA binding method (SequalPrep Kit, Invitrogen, Carlsbad, CA, USA) to create a DNA pool for pyrosequencing on a Roche GS-FLX 454 automated pyrosequencer (Roche Applied Science, Branford, CT, USA).
Sequence Processing and Network Analysis
The raw sequences were processed using Mothur v.1.30.2 (Schloss et al., 2009). Briefly, the multiplexed reads were filtered for quality and assigned to corresponding soil samples. The filtering criteria removed any sequence, which the longest homopolymer was greater than 8 nucleotides, contained ambiguous base call, had more than one mismatch to the barcode sequence, had more than two mismatches to the primer sequence and were smaller than 200 bases in length. In addition the sequences were trimmed by using a moving window that was 50 bases long and average quality score higher than 30. The dataset was simplified by obtaining a non-redundant set of sequences that were further aligned against the SILVA reference alignment (http://www.arb-silva.de/). To maximize the number of sequences that overlap over the longest span, the sequence that started after the position that 85% of the sequences did, or ended before the position that 85% of the sequences did, were removed from the alignment. The alignment was then trimmed since we need they overlap in the same alignment space. Finally, to reduce sequencing noise a pre-clustering step was applied (Huse et al., 2010) and the chimeric sequences were checked by chimera.slayer script in Mothur v.1.30.2. The command lines with the parameters used here are available in the Supplementary Material.
For network analysis, the OTUs were grouped at genus and only those genera with more than five sequences were considered in the following analysis. The choice for genus aimed to generate consistent OTUs with high abundances for subsequent analyses based on correlations. This approach also circumvents the potential taxonomic misclassifications due to sequencing bias. Since the networks comprised a set of share taxa within a soil, the bacterial genera represented by zero sequences in a sample were excluded from data analysis. The pipeline used for developing this study is presented in the Supplementary Material.
Associations between the microbial communities were examined by calculating all possible Pearson rank correlations between bacterial genera using the Otu.association script from Mothur v.1.30.2. A valid interaction event was considered to be a robust correlation if the Pearson correlation coefficient (p) was either equal or greater than 0.9 or −0.9 and statistically significant (p-value equal or smaller than 0.05—calculated as the proportion of the r-values generated from randomized data that are larger than the Pearson correlation coefficient that was calculated from the original data). The cutoff correlation of 0.9 or −0.9 was chosen to increase the confidence for strong bacterial interactions. To describe the topology of the resulting networks, a set of measures (average clustering coefficient, average path length, and modularity) were calculated (Newman, 2006). The network structure was explored and visualized with the interactive platform gephi (Bastian et al., 2009) using directed network (where edges have direction) and the Fruchterman–Reingold layout.
To determine whether our webs were not random networks and really represented the actual bacterial interactions in soil, we compared random networks of equal size (same number of nodes and edges) to the networks obtained by this study. One thousand random networks were calculated by the Erdös–Rényi model [G(n,m)] using an script wrote in R (available on the Supplementary Material). From each random network, values of average clustering coefficient, average path length and modularity were calculated. The proportion of those values that were larger than the values calculated based on the original data were computed to get a p-value for the null hypothesis that the networks were obtained at random. This approach is based on using a fixed number of links to connect randomly chosen nodes and serves as point of reference against which our real biological networks might be compared (Vick-Majors et al., 2014). To measure the relative importance (how influential a taxon is within a network) of each taxon within the network we calculated two measures of centrality: Betweenness Centrality (BC) (Martín González et al., 2010; Vick-Majors et al., 2014) and Closeness Centrality (CC) (Freeman, 1979). BC counts the fraction of shortest paths going through a given bacterial taxon to another. The BC of a taxon in a network reflects the importance of control that the taxon exerts over the interactions of other taxons in the network (Martín González et al., 2010; Vick-Majors et al., 2014). CC denotes the proximity of a node to all other nodes in the network quantifying how many steps away genus i is from all others in the web (Freeman, 1979). Taxa with high CC are likely to have a pronounced effect on microbial community because it can rapidly affect other species in a community (Martín González et al., 2010). Finally, to identify possible patterns between taxon abundance vs. CC or BC we use dispersion graphs to describe the relationship between these pair of variables.
Results
The number of high-quality sequences obtained after sequence processing in each sample and the sequence coverage are presented in Table 1. An average of 12,164 sequences (≥200 bases and ≥30 quality score) were obtained per sample. The smallest sequence coverage at the genus level was 94% however most of the samples presented a sequence coverage of 99%. The coverage indicated that the number of sequences obtained from each soil sample was sufficient to reveal most of the taxonomic units indicating that the samples were well represented by the number of sequences obtained and that we could perform the following OTU-based analysis.
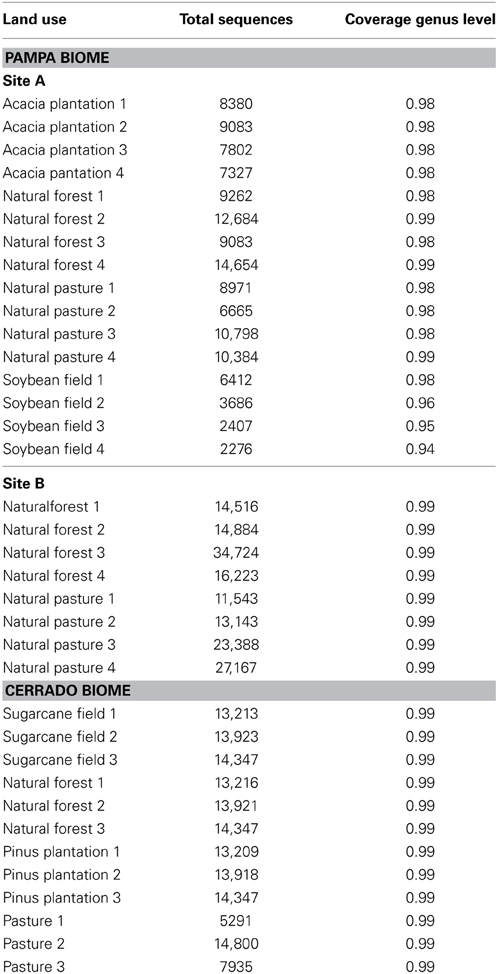
Table 1. Total number of high-quality sequences and sequencing coverage for taxonomic genus level in land uses in Pampa and Cerrado biomes.
The second step in data analysis was to verify whether the networks obtained were non-random networks. In order to test it, we compared our networks with 1000 randomly generated networks (Erdös–Rényi model; Erdös and Rényi, 1959) using the values of observed average clustering coefficient, average path length and modularity from each of our networks (Table 2). The p-values for average clustering coefficient, modularity, and path length were 0.001. This indicated that our webs were more organized than would be expected by a random network with identical size of nodes and edges and showed that our networks were non-random. Once established that we obtained adequate sequencing coverage and non-random networks we further explored the positive and negative interactions between co-occurrent bacterial taxons.
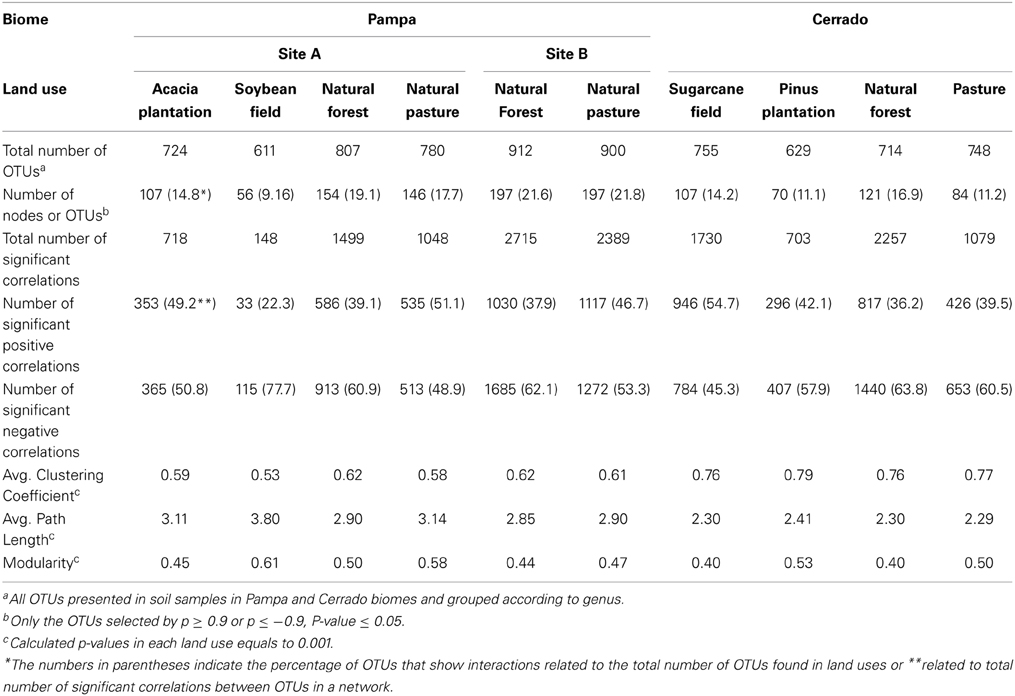
Table 2. Global network statistics for microbial association networks from land uses in Pampa and Cerrado biome.
Based on the global network statistics presented in Table 2 and irrespective of the biome or land use studied only a small portion of OTUs (9.16 to 21.8%) showed positive or negative interaction with other members of the soil bacterial community. Those interactive OTUs were the most abundant ones making up about 68 to 92% of the total number of taxonomic units found in the soils tested. The proportion of positive correlations was variable according to the land use and ranged from 22.3% (soybean field from Pampa biome) to 54.7% (sugarcane field from Cerrado). In average, the number of negative correlations was higher than the number of positive correlations in most land uses tested (Table 2).
Based on the high BC score few possible keystone taxa were detected (Figures 1A–5A and Supplementary Table S1). The OTUs considered keystone species (depicted as nodes with larger sizes in the network) mainly belonged to different genus of the phylum Proteobacteria and Actinobacteria, the main bacterial phyla found in soils. Taxonomic units belonging to Chloroflexi, Bacteroidetes, and Firmicutes were also characterized as keystone taxa. These keystone taxa were not the same between or within biomes and appeared to be unique to each sampling location. The five keystone genus selected by the greatest value of BC from each of the soil sites are presented on Table 3. Based on the CC ranking, a larger number of OTUs were identified as highly important (high CC) for connectance of the microbial network since the values of CC did not present a high variation among the OTUs. No keystone genera were detected by this measurement denoting similar proximity of all genera within the network (Figures 1B–5B and Supplementary Material).
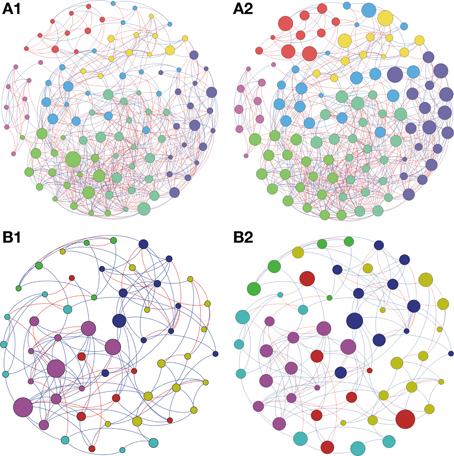
Figure 1. Network interactions of soil bacterial genus found in Acacia plantation (A1, A2) and in the Soybean plantation (B1, B2) from site A on Pampa biome. A connection stands for a strong Pearson's correlation (p ≥ 0.9 and P-value ≤ 0.05). Each circle (usually called node) represents a bacterial genus and the sizes of the circles are proportional to the value of betweenness centrality in (A1) and (B1). In (A2) and (B2) the sizes of the circles are proportional to value of closeness centrality. Lines connecting two bacterial genera represent the interactions between them. Blue lines represent the positive significant correlations and red lines represent a negative significant correlation. The colors of the circles represent the bacterial modules. For clarity, the OTU's identity was omitted. Detailed networks containing the identity of each node can be observed in the Supplementary Figures S1–S5 and Supplementary Table S1.
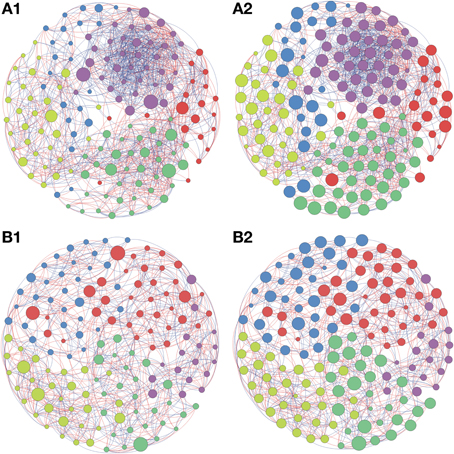
Figure 2. Network interactions of soil bacterial genus found in the Natural forest (A1, A2) and in the Natural pasture (B1, B2) from site A on Pampa biome. A connection stands for a strong Pearson's correlation (p ≥ 0.9 and P-value ≤ 0.05). Each circle (usually called node) represents a bacterial genus and the sizes of the circles are proportional to the value of betweenness centrality in (A1) and (B1). In (A2) and (B2) the sizes of the circles are proportional to value of closeness centrality. Lines connecting two bacterial genera represent the interactions between them. Blue lines represent the positive significant correlations and red lines represent a negative significant correlation. The colors of the circles represent the bacterial modules. For clarity, the OTU's identity was omitted. Detailed networks containing the identity of each node can be observed in the Supplementary Figures S1–S5 and Supplementary Table S1.
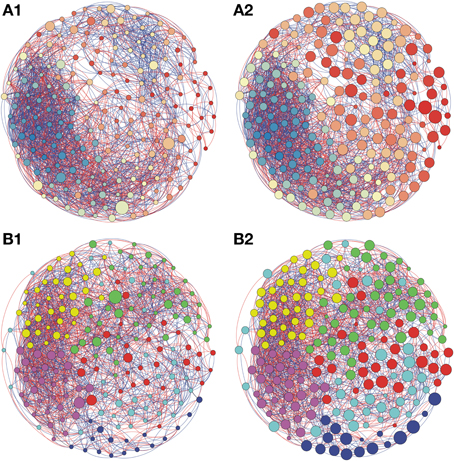
Figure 3. Network interactions of soil bacterial genus found in Natural forest (A1, A2) and in the Natural pasture (B1, B2) from site B, on Pampa biome. A connection stands for a strong Pearson's correlation (p ≥ 0.9 and P-value ≤ 0.05). Each circle (usually called node) represents a bacterial genus and the sizes of the circles are proportional to the value of betweenness centrality in (A1) and (B1). In (A2) and (B2) the sizes of the circles are proportional to value of closeness centrality. Lines connecting two bacterial genera represent the interactions between them. Blue lines represent the positive significant correlations and red lines represent a negative significant correlation. The colors of the circles represent the bacterial modules. For clarity, the OTU's identity was omitted. Detailed networks containing the identity of each node can be observed in the Supplementary Figures S1–S5 and Supplementary Table S1.
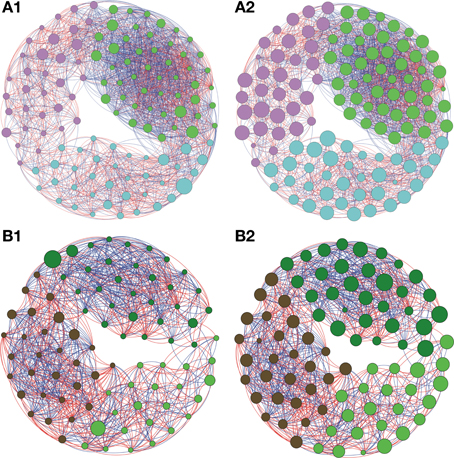
Figure 4. Network interactions of soil bacterial genus found in Natural forest (A1, A2) and in the Pasture (B1, B2) on Cerrado biome. A connection stands for a strong Pearson's correlation (p ≥ 0.9 and P-value ≤ 0.05). Each circle (usually called node) represents a bacterial genus and the sizes of the circles are proportional to the value of betweenness centrality in (A1) and (B1). In (A2) and (B2) the sizes of the circles are proportional to value of closeness centrality. Lines connecting two bacterial genera represent the interactions between them. Blue lines represent the positive significant correlations and red lines represent a negative significant correlation. The colors of the circles represent the bacterial modules. For clarity, the OTU's identity was omitted. Detailed networks containing the identity of each node can be observed in the Supplementary Figures S1–S5 and Supplementary Table S1.
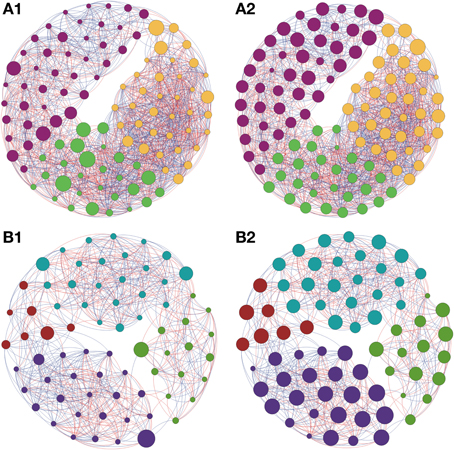
Figure 5. Network interactions of soil bacterial genus found in Sugarcane (A1, A2) and in the Pinus plantation (B1, B2) on Cerrado biome. A connection stands for a strong Pearson's correlation (p ≥ 0.9 and P-value ≤ 0.05). Each circle (usually called node) represents a bacterial genus and the sizes of the circles are proportional to the value of betweenness centrality in (A1) and (B1). In (A2) and (B2) the sizes of the circles are proportional to value of closeness centrality. Lines connecting two bacterial genera represent the interactions between them. Blue lines represent the positive significant correlations and red lines represent a negative significant correlation. The colors of the circles represent the bacterial modules. For clarity, the OTU's identity was omitted. Detailed networks containing the identity of each node can be observed in the Supplementary Figures S1–S5 and Supplementary Table S1.
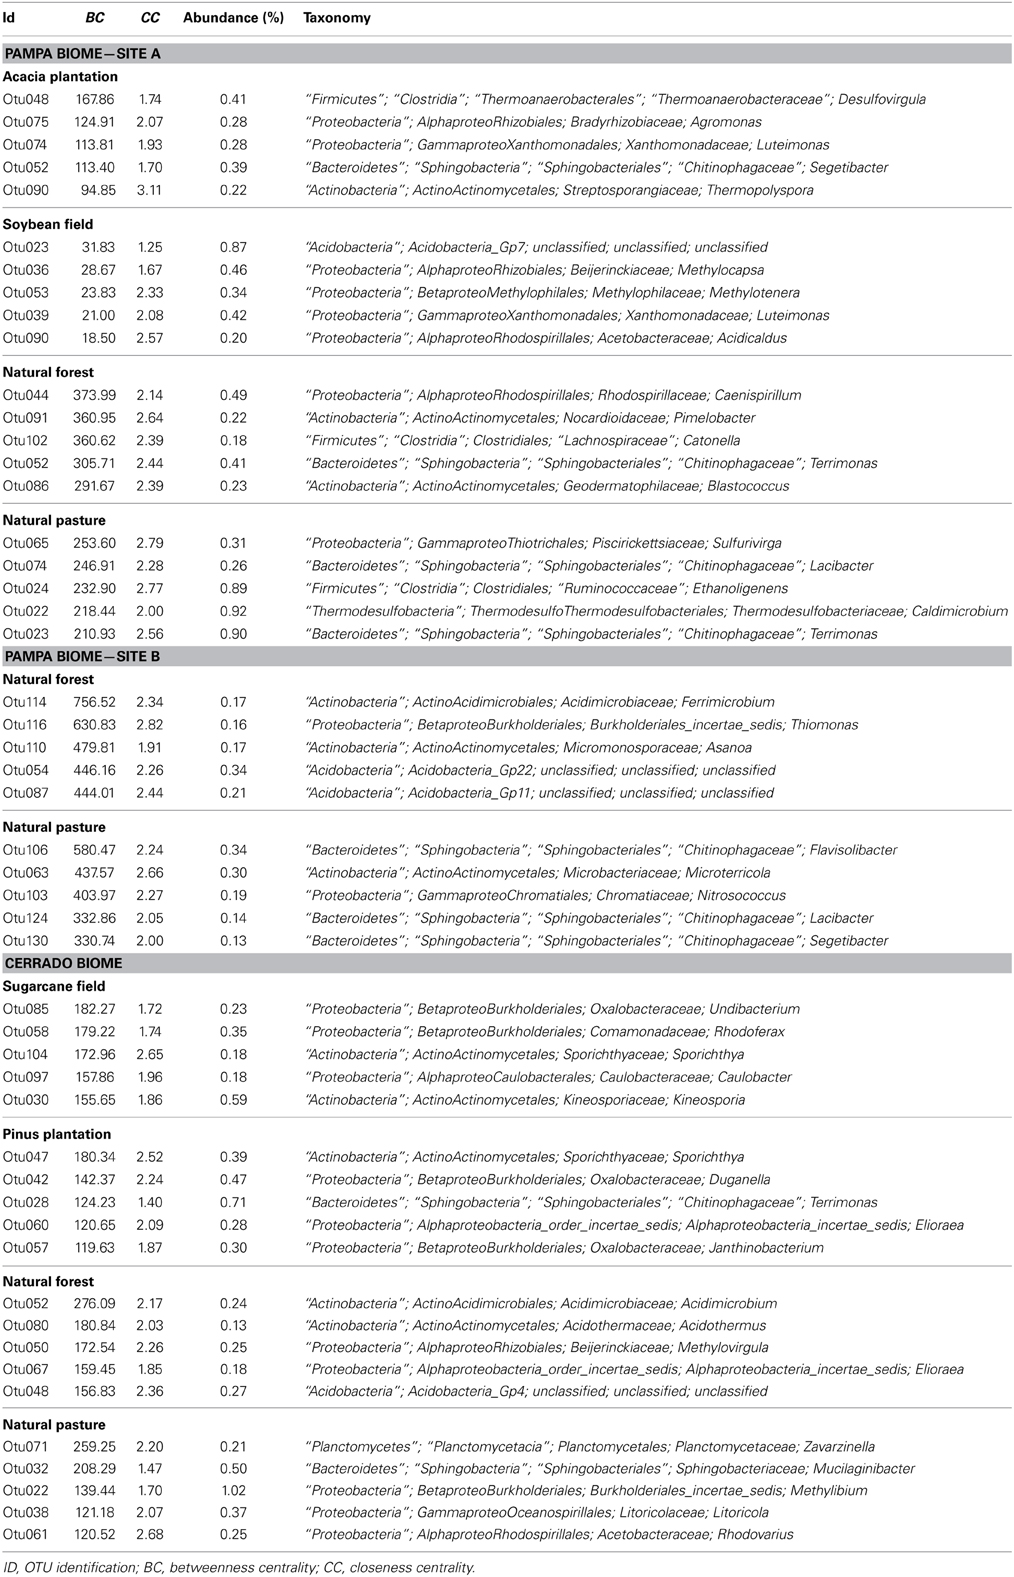
Table 3. The five genera selected by the greatest values of Betweenness Centrality (BC) found in each of the sampling sites.
Studies in soil microbial ecology suggest that abundant microorganisms might have high impact on microbial structure and function. To understand how taxon abundance and the centrality measures are related, a dispersion graph with the relative abundance of all OTUs vs. the values of betweenness and closeness was constructed (Figure 6). Despite the abundance of genera seems to be an important parameter that define the interactions between taxonomic members of the soil bacterial community, the diagrams indicates that there is no strength relation between taxon abundance and centrality measures. However, it's possible to note that few abundant taxa presented a slightly tendency to have high values of CC (Figure 6B).
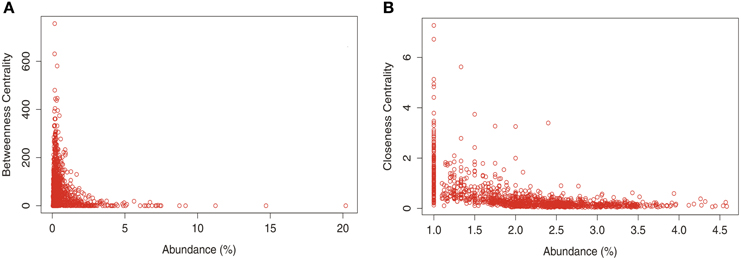
Figure 6. Relationship between taxon relative abundance data from the total number of OTUs at genus level found in different land uses in Pampa and Cerrado biome and betwenees (A) and closeness (B) centrality.
Discussion
In this study, we focused on microbial community associations within two ecologically important biomes in Brazil. We collected soil samples from a set of biological replicates, allowing us to detect patterns on ecological interaction using network analyses, which describe who is present and who affects whom positively or negatively. Positive correlations between microbial populations suggest the occurrence of a mutualistic interaction while negative correlations might suggest the presence of competition for hosts or predation relationship between microorganisms (Steele et al., 2011). Those interactions are strongly attached to important to soil process. For instance, a mutualistic relationship between ammonia-oxidizing bacteria (AOB) and nitrite-oxidizing bacteria (NOB) is essential to the stability of soil nitrification process, a key reaction of the global nitrogen cycle (Graham et al., 2007). On the other hand, species of Myxobacteria are a group of micropredator bacteria metabolically active in the soil ecosystems that play a key role in the turnover of carbon (Lueders et al., 2006). Neutral interactions can not be interpreted with this network-based approach.
Every approach presents positive and negative aspects. Before following the discussion, it is appropriated to consider some limitations of this work in order to better interpret the results: (i) unlike other studies, only correlations with r ≥ ±0.9 (p ≤ 0.05) were used to generate the networks. According to Taylor (1990) the correlation coefficient (a linear association between two variables) is an abstract measure and not given to a direct precise interpretation. Low values of r does not explain or account for significant variation in the value of the dependent variable (y). Conservative cutoffs increase the confidence for detecting only strong interactions. Less stringent cutoffs decrease the reliability of the results; (ii) PCR-based and massive sequencing techniques introduce biases related to primer mismatches, insertion/deletion (indels) sequencing errors, and chimeric PCR artifacts which can affect the interpretations of microbial community structure and diversity (Pinto and Raskin, 2012); (iii) the copy number of the 16S rRNA gene varies greatly per bacterial genome (from one in many species up to 15 in some bacteria) and these differences induce to errors in relative abundance measurements (Klappenbach et al., 2001); (iv) the proportion of inactive bacterial cells from soils ranged from 61 to 96% (Lennon and Jones, 2011). Inactive or dormant members of the microbial community might persist in DNA samples potentially masking the active constituents of the community. This could explain why a large amount of taxons found in different land uses did not present interactions with other member of the community; (v) the network analysis is considered an OTU-based approach since it relies on detection of correlation between taxonomic unities. According to Lemos et al. (2011), in order to apply such an approach, a large sampling intensity (coverage ≥ 90%) is needed to get reliable results. Datasets with low number of sequences are likely to present a low sequence coverage that in turn will make it more unlikely to found OTUs correlation; (vi) finally, another drawback related to microbial network construction is the faulty prediction of a relationship between two taxa since interspecies interactions might be affected by third-party organisms in prokaryotic ecosystems (Haruta et al., 2009). Within this study, we attempted to overcome these biases as much as possible. Although those biases may not be neglected, considering the high levels of robustness and resolution of our methodology, the low variation among replicates from each land use and the quality of the results, we believe these biases were minimized and our findings are consistent.
Linking the structure of microbial communities to soil ecosystem has been a challenge in ecology. The extent, specificity, and stability of microbial associations are difficult to assess systematically in the environment (Chaffron et al., 2010) however, co-occurrence network analysis (primarily based on statistically significant tests of correlation) were successfully applied to at least partially solve this problem (Barberán et al., 2012; Faust et al., 2012; Friedman and Alm, 2012; Gilbert et al., 2012; Rodriguez-Lanetty et al., 2013). According to Faust and Raes (2012), after abundance data have been obtained, it is possible to predict microbial relationships under the premise that strongly non-random distribution patterns are mostly due to ecological reasons. Studies on ecosystem function are traditionally limited to measurements of changes in species diversity and composition limiting our ability to link the structure of communities to the function of natural ecosystems (Philippot et al., 2013; Rudolf and Rasmussen, 2013). An important benefit of networks to study microbial ecology is the ability to understand which organisms are most important in maintaining the structure and interactions of microbial communities in soils. Due to the choice of a linear model (Pearson correlation) to describe how the taxa of a soil microbial community interact with each other, the network analysis allows only the detection of positive and/or negative interactions. While we acknowledge that not all correlations between bacterial genera found in this study might be valid, empirical evidence that correlated microbial species might actually been interactive were already demonstrated. Duran-Pinedo et al. (2011) provided an important evidence of accuracy and usefulness of this kind of analysis by isolating a not-yet-cultivated organism based on the network analysis results. The authors showed that network analysis could facilitated the cultivation of a previously uncultivated organism (Tannerella sp. OT286) and proved that certain species that did not grow in artificial media alone could form colonies in the presence of other microorganisms. Due to the limitations of this approach, here we adopted the term “theoretical” network association to express the positive and/or negative interaction between soil microbial genera (for an extensive revision about the difficulties and pitfalls about the use of network inference to assess microbial interactions see Faust and Raes, 2012). The application of theoretical network modeling to real microbial ecological network provide insight into the complex organization levels of microbes and identify key microbial populations or key functional genes in soil ecosystem. Using theoretical network model, based on random matrix theory (RMT) approach to delineate the network interactions, it was identified that the structure of the networks under typical and elevated CO2 levels was substantially different in terms of network topology, node overlap, module preservation, and network hubs, suggesting that the network interactions among different phylogenetic groups/populations were markedly changed (Zhou et al., 2011).
In this study we attempted to answer three fundamental questions: (i) Is it possible to detect keystone bacterial taxa in soils? (ii) If yes, are the keystone taxa exclusive to each land use or they are the same in most land uses? (iii) Are the most abundant taxa more important to connect distincts OTUs and maintain the structure of microbial interactions in soil? Many approaches attempted to detect different aspects of network topology and thus provide different information for better understanding how the microbial communities are arranged in the soil. The effective center (or centers) of a network, also called “hubs” might represent keystones species as predicted from network theory (Montoya et al., 2006) however, the network structure is very complex and there is no unifying approach for identifying such hubs. A number of studies have been performed using the degree centrality to identify hubs in networks but we decided to use BC and CC because the degree is a local quantity which does not inform about the importance of a node in the network (Barthélemy, 2004). Our analysis of centrality illustrates that most of soil bacterial taxons are important to the overall connectance of the network (presented high CC), whereas only few taxons play a key role as connectors (presented high BC). Eiler et al. (2012) also detected numerous phylogenetic groups with high number of associations, which may represent groups with particular strong interdependencies. They suggested that in a highly complex environment, like soil, there may be hundreds of such keystones species. The keystone species in soil environment play an exceptionally important role in determining the structure and function of ecosystems. Rudolf and Rasmussen (2013) showed that differences in food network structure were significantly correlated with changes in all ecosystem processes.
The most widely used definition for keystone species is one “whose impact on its community or ecosystem is large, and disproportionately large relative to its abundance” (Power et al., 1996). According to our network analysis, only a fraction of the total number of OTUs presented either positive or negative interactions (Table 2) however, the more interactive taxa were also found in more abundance within the soil samples. On the other hand, the interactive taxa did not presented any relationship with the two measures of centrality applied in this study (see Figure 6). Recently, Campbell and Kirchman (2013) and Zhang et al. (2013) suggested that abundant and easily detectable organisms might have a high impact on microbial structure, function, and nutrient cycling. Our network analysis corroborated such findings however, the role of less-abundant organisms is not easily understood and might not be neglected. Less abundant members from soil microbial community contributed to biogeochemical process as important sulfate reducers in a long-term experimental peatland field site (Pester et al., 2010). In addition, these rare or only less abundant microorganisms might act as keystone species in complex soil bacterial communities and could serve as a reservoir of genetic and functional diversity and/or buffer ecosystems against species loss or environmental change (Brown et al., 2009). Finally, it was observed that each land use presented a different set of keystone genera and that no keystone genera presented a generalized distribution.
In this study, we investigated the inter-taxa associations in complex microbial soil ecosystems applying systems biology principles. Such approach is essential to explain the persistence of microbial species in a constantly changing ecosystems, and the tolerance of current ecosystems to natural gains and losses of species as well as their vulnerability to unnaturally inflated extinction rates (Montoya et al., 2006). Species interactions could be more important to soil processes than species richness and abundance, especially in complex ecosystems. The visualization of microbial networks allowed us to detect microbial hubs, which are key microbes or microbial behaviors that let us comprehend the complex microbial systems in which they are found. Ultimately, such network models will be able to predict the outcome of community alterations and the effects of perturbations. Although exploring such ecological networks is essential to our better understanding of microbial ecology, more investigations are needed to circumvent important methodological limitations such as prediction of a relationship between two genera through inference of correlations. The technique will benefit from the incorporation of a less simplistic model that take into account not only the relationship between two microbial genera but also the effect of third-party microorganisms in the system and random processes. In addition, the network approach could be used to text the microbial assemblage theories, neutral and niche theories. This approach proves to be valuable to practical community-level conservation biology and represents a step forward in microbial ecology beyond the conventional studies of microbial richness and abundance.
Conflict of Interest Statement
The authors declare that the research was conducted in the absence of any commercial or financial relationships that could be construed as a potential conflict of interest.
Acknowledgments
The authors acknowledge the National Council for Scientific and Technological Development (CNPq—Brazil) and the Coordination for the Improvement of Higher Education Personnel (CAPES—Brazil) for their financial support. This work was supported by the Fundação de Amparo à Pesquisa do Estado do Rio Grande do Sul (FAPERGS process no. 1012030) and by the National Council for Scientific and Technological Development (CNPq—Brazil process no. 476762/2010-30 and 479133/2012-3). Publication number 5593 of Netherlands Institute of Ecology (NIOO-KNAW).
Supplementary Material
The Supplementary Material for this article can be found online at: http://www.frontiersin.org/journal/10.3389/fenvs.2014.00010/abstract
References
Barberán, A., Bates, S. T., Casamayor, E. O., and Fierer, N. (2012). Using network analysis to explore co-occurrence patterns in soil microbial communities. ISME J. 6, 343–351. doi: 10.1038/ismej.2011.119
Barthélemy, M. (2004). Betweenness centrality in large complex networks. Eur. Phys. J. B 38, 163–168. doi: 10.1140/epjb/e2004-00111-4
Bastian, M., Heymann, S., and Jacomy, M. (2009). “Gephi: an open source software for exploring and manipulating networks,” in International AAAI Conference on Weblogs and Social Media (San Jose, CA).
Brown, M. V., Philip, G. K., Bunge, J. A., Smith, M. C., Bissett, A., Lauro, F. M., et al. (2009). Microbial community structure in the North Pacific ocean. ISME J. 3, 1374–1386. doi: 10.1038/ismej.2009.86
Campbell, B. J., and Kirchman, D. L. (2013). Bacterial diversity, community structure and potential growth rates along an estuarine salinity gradient. ISME J. 7, 210–220. doi: 10.1038/ismej.2012.93
Chaffron, S., Rehrauer, H., Pernthaler, J., and von Mering, C. (2010). A global network of coexisting microbes from environmental and whole-genome sequence data. Genome Res. 20, 947–959. doi: 10.1101/gr.104521.109
Choi, J. K., Yu, U. S., Yoo, O. J., and Kim, S. (2005). Differential coexpression analysis using microarray data and its application to human cancer. Bioinformatics 21, 4348–4355. doi: 10.1093/bioinformatics/bti722
Duran-Pinedo, A. E., Paster, B., Teles, R., and Frias-Lopez, J. (2011). Correlation network analysis applied to complex biofilm communities. PLoS ONE 6:e28438. doi: 10.1371/journal.pone.0028438
Eiler, A., Heinrich, F., and Bertilsson, S. (2012). Coherent dynamics and association networks among lake bacterioplankton taxa. ISME J. 6, 330–342. doi: 10.1038/ismej.2011.113
Estrada, E. (2007). Characterization of topological keystone species local, global and “meso-scale” centralities in food webs. Ecol. Complex. 4, 48–57. doi: 10.1016/j.ecocom.2007.02.018
Faust, K., and Raes, J. (2012). Microbial interactions: from networks to models. Nat. Rev. Microbiol. 10, 538–550. doi: 10.1038/nrmicro2832
Faust, K., Sathirapongsasuti, J. F., Izard, J., Segata, N., Gevers, D., Raes, J., et al. (2012). Microbial co-occurrence relationships in the human microbiome. PLoS Comput. Biol. 8:e1002606. doi: 10.1371/journal.pcbi.1002606
Freeman, L. C. (1979). Centrality in social networks, conceptual clarification. Soc. Netw. 1, 215–239. doi: 10.1016/0378-8733(78)90021-7
Friedman, J., and Alm, E. J. (2012). Inferring correlation networks from genomic survey data. PLoS Comput. Biol. 8:e1002687. doi: 10.1371/journal.pcbi.1002687
Gilbert, J. A., Steele, J. A., Caporaso, J. G., Steinbrück, L., Reeder, J., Temperton, B., et al. (2012). Defining seasonal marine microbial community dynamics. ISME J. 6, 298–308. doi: 10.1038/ismej.2011.107
Graham, D. W., Knapp, C. W., Van Vleck, E. S., Bloor, K., Lane, T. B., and Graham, C. E. (2007). Experimental demonstration of chaotic instability in biological nitrification. ISME J. 1, 385–393. doi: 10.1038/ismej.2007.45
Griffiths, R. I., Thomson, B. C., James, P., Bell, T., Bailey, M., and Whiteley, A. S. (2011). The bacterial biogeography of British soils. Environ. Microbiol. 13, 1642–1654. doi: 10.1111/j.1462-2920.2011.02480.x
Haruta, S., Kato, S., Yamamoto, K., and Igarashi, Y. (2009). Intertwined interspecies relationships: approaches to untangle the microbial network. Environ. Microbiol. 11, 2963–2969. doi: 10.1111/j.1462-2920.2009.01956.x
Huse, S. M., Welch, D. M., Morrison, H. G., and Sogin, M. L. (2010). Ironing out the wrinkles in the rare biosphere through improved OTU clustering. Environ. Microbiol. 12, 1889–1898. doi: 10.1111/j.1462-2920.2010.02193.x
Klappenbach, J. A., Saxman, P. R., Cole, J. R., and Schmidt, T. M. (2001). rrndb: the Ribosomal RNA Operon Copy Number Database. Nucl. Acids Res. 29, 181–184. doi: 10.1093/nar/29.1.181
Lemos, L. N., Fulthorpe, R. R., Triplett, E. W., and Roesch, L. F. W. (2011). Rethinking microbial diversity analysis in the high throughput sequencing era. J. Microbiol. Methods 86, 42–51. doi: 10.1016/j.mimet.2011.03.014
Lennon, J. T., and Jones, S. E. (2011). Microbial seed banks: the ecological and evolutionary implications of dormancy. Nat. Rev. Microbiol. 9, 119–130. doi: 10.1038/nrmicro2504
Lueders, T., Kindler, R., Miltner, A., Friedrich, M. W., and Kaestner, M. (2006). Identification of bacterial micropredators distinctively active in a soil microbial food web. Appl. Environ. Microbiol. 72, 5342–5348. doi: 10.1128/AEM.00400-06
Lupatini, M., Suleiman, A. K. A., Jacques, R. J. S., Antoniolli, Z. I., Kuramae, E. E., Camargo, F. A. D., et al. (2013). Soil-Borne bacterial structure and diversity does not reflect community activity in Pampa biome. PLoS ONE 8:e76465. doi: 10.1371/journal.pone.0076465
Martín González, A. M., Dalsgaard, B., and Olesen, J. M. (2010). Centrality measures and the importance of generalist species in pollination networks. Ecol. Complex. 7, 36–43. doi: 10.1016/j.ecocom.2009.03.008
Montoya, J. M., Pimm, S. L., and Sole, R. V. (2006). Ecological networks and their fragility. Nature 442, 259–264. doi: 10.1038/nature04927
Newman, M. E. J. (2006). Modularity and community structure in networks. Proc. Natl. Acad. Sci. U.S.A. 103, 8577–8582. doi: 10.1073/pnas.0601602103
Oliveira, P. S., and Marquis, R. J. (2002). Cerrados of Brazil: Ecology and Natural History of a Neotropical Savanna. New York, NY: Columbia Press.
Overbeck, G. E., Mueller, S. C., Fidelis, A., Pfadenhauer, J., Pillar, V. D., Blanco, C. C., et al. (2007). Brazil's neglected biome: the South Brazilian Campos. Perspect. Plant Ecol. Evol. Syst. 9, 101–116. doi: 10.1016/j.ppees.2007.07.005
Pester, M., Bittner, N., Deevong, P., Wagner, M., and Loy, A. (2010). A “rare biosphere” microorganism contributes to sulfate reduction in a peatland. ISME J. 4, 1591–1602. doi: 10.1038/ismej.2010.75
Philippot, L., Spor, A., Henault, C., Bru, D., Bizouard, F., Jones, C. M., et al. (2013). Loss in microbial diversity affects nitrogen cycling in soil. ISME J. 7, 1609–1619. doi: 10.1038/ismej.2013.34
Pinto, A. J., and Raskin, L. (2012). PCR biases distort bacterial and archaeal community structure in pyrosequencing datasets. PLoS ONE 7:e43093. doi: 10.1371/journal.pone.0043093
Power, M. E., Tilman, D., Estes, J. A., Menge, B. A., Bond, W. J., Mills, L. S., et al. (1996). Challenges in the quest for keystones. Bioscience 46, 609–620. doi: 10.2307/1312990
Prasad, S., Manasa, P., Buddhi, S., Singh, S. M., and Shivaji, S. (2011). Antagonistic interaction networks among bacteria from a cold soil environment. FEMS Microbiol. Ecol. 78, 376–385. doi: 10.1111/j.1574-6941.2011.01171.x
Prosser, J. I., Bohannan, B. J. M., Curtis, T. P., Ellis, R. J., Firestone, M. K., Freckleton, R. P., et al. (2007). The role of ecological theory in microbial ecology. Nat. Rev. Microbiol. 5, 384–392. doi: 10.1038/nrmicro1643
Rafrafi, Y., Trably, E., Hamelin, J., Latrille, E., Meynial-Salles, I., Benomar, S., et al. (2013). Sub-dominant bacteria as keystone species in microbial communities producing biohydrogen. Int. J. Hydrogen Energ. 38, 4975–4985. doi: 10.1016/j.ijhydene.2013.02.008
Rampelotto, P. H., Ferreira, A. D. S., Muller Barboza, A. D., and Wurdig Roesch, L. F. (2013). Changes in diversity, abundance, and structure of soil bacterial communities in Brazilian savanna under different land use systems. Microb. Ecol. 66, 593–607. doi: 10.1007/s00248-013-0235-y
Rodriguez-Lanetty, M., Granados-Cifuentes, C., Barberan, A., Bellantuono, A. J., and Bastidas, C. (2013). Ecological inferences from a deep screening of the Complex Bacterial Consortia associated with the coral, Porites astreoides. Mol. Ecol. 22, 4349–4362. doi: 10.1111/mec.12392
Roesch, L. F. W., Fulthorpe, R. R., Pereira, A. B., Pereira, C. K., Lemos, L. N., Barbosa, A. D., et al. (2012). Soil bacterial community abundance and diversity in ice-free areas of Keller peninsula, antarctica. Appl. Soil Ecol. 61, 7–15. doi: 10.1016/j.apsoil.2012.04.009
Rudolf, V. H., and Rasmussen, N. L. (2013). Population structure determines functional differences among species and ecosystem processes. Nat. Commun. 4, 1–7. doi: 10.1038/ncomms3318
Schloss, P. D., Westcott, S. L., Ryabin, T., Hall, J. R., Hartmann, M., Hollister, E. B., et al. (2009). Introducing mothur: open-source, platform-independent, community-supported software for describing and comparing microbial communities. Appl. Environ. Microbiol. 75, 7537–7541. doi: 10.1128/AEM.01541-09
Steele, J. A., Countway, P. D., Xia, L., Vigil, P. D., Beman, J. M., Kim, D. Y., et al. (2011). Marine bacterial, archaeal and protistan association networks reveal ecological linkages. ISME J. 5, 1414–1425. doi: 10.1038/ismej.2011.24
Suleiman, A. K. A., Lupatini, M., Boldo, J. T., Pereira, M. G., and Wurdig Roesch, L. F. (2013). Shifts in soil bacterial community after eight years of land-use change. Syst. Appl. Microbiol. 36, 137–144. doi: 10.1016/j.syapm.2012.10.007
Taylor, R. (1990). Interpretation of the correlation-coefficient - a basic review. J. Diagn. Med. Sonogr. 6, 35–39. doi: 10.1177/875647939000600106
Vick-Majors, T. J., Priscu, J. C. A, and Amaral-Zettler, L. (2014). Modular community structure suggests metabolic plasticity during the transition to polar night in ice-covered Antarctic lakes. ISME J. 8, 778–789. doi: 10.1038/ismej.2013.190
Zhang, X., Liu, W., Schloter, M., Zhang, G., Chen, Q., Huang, J., et al. (2013). Response of the abundance of key soil microbial nitrogen-cycling genes to multi-factorial global changes. PLoS ONE 8:e76500. doi: 10.1371/journal.pone.0076500
Keywords: network analysis, community ecology, keystone species, soil microbial interactions, high-throughput sequencing
Citation: Lupatini M, Suleiman AKA, Jacques RJS, Antoniolli ZI, de Siqueira Ferreira A, Kuramae EE and Roesch LFW (2014) Network topology reveals high connectance levels and few key microbial genera within soils. Front. Environ. Sci. 2:10. doi: 10.3389/fenvs.2014.00010
Received: 31 January 2014; Accepted: 18 April 2014;
Published online: 08 May 2014.
Edited by:
Christophe Darnault, Clemson University, USAReviewed by:
Tancredi Caruso, Queen's University of Belfast, UKUlisses Nunes Da Rocha, Vrije Universiteit Amsterdam, Netherlands
Zhili He, University of Oklahoma, USA
Aidan M. Keith, Centre for Ecology and Hydrology, UK
Copyright © 2014 Lupatini, Suleiman, Jacques, Antoniolli, de Siqueira Ferreira, Kuramae and Roesch. This is an open-access article distributed under the terms of the Creative Commons Attribution License (CC BY). The use, distribution or reproduction in other forums is permitted, provided the original author(s) or licensor are credited and that the original publication in this journal is cited, in accordance with accepted academic practice. No use, distribution or reproduction is permitted which does not comply with these terms.
*Correspondence: Luiz F. W. Roesch, Centro Interdisciplinar de Pesquisas em Biotecnologia (CIP-Biotec), Universidade Federal do Pampa, Avenida Antonio Trilha, 1847, São Gabriel, RS 97300-000, Brazil e-mail:bHVpenJvZXNjaEB1bmlwYW1wYS5lZHUuYnI=