 Ioannis Palogos
 Panagiota Babatsouli
 Costas Costa
 Nicolas Kalogerakis
- 1School of Environmental Engineering, Technical University of Crete, Chania, Greece
- 2Department of Environmental Science and Technology, Cyprus University of Technology, Limassol, Cyprus
A dynamic model was developed to simulate the behavior of the biological processes taking place in a membrane bioreactor (MBR) pilot plant treating industrial wastewater at the Heraklion Industrial Park including the cake development on the membrane surface. The modified extended CES-ASM3 model has been used. Hydrolysis rates of the soluble microbial products have been added. Membrane fouling was taken into account and trans membrane pressure (TMP) was modeled and compared to experimental data. Simulation results are presented for the operation period between February 2012 and May 2013 and the prediction ability of the model is shown through the computation of the mean relative error of each measured state variable. Overall, the model estimates match the experimental data satisfactorily, as they follow similar trends while for all input variables their mean value was used as a constant input in the simulations. The operation of the MBR was conducted at three different sludge retention times.
Introduction
Nowadays Membrane Bioreactor (MBR) technology is widely used for industrial and domestic wastewater treatment. MBR reactor is an activated sludge process (ASP) that uses membranes for wastewater filtration, it can achieve complete solids removal, high organic and nutrients removal at a small bioreactor volume. MBR is becoming the technology of choice due to these favorable characteristics. However, in contrast to their advantages, MBRs have a main drawback, membrane bio-fouling, which can cause many problems during their operation.
For the simulation of an ASP process, Activated Sludge Models ASM1, ASM2, ASM2d, and ASM3 have been developed by Henze et al. (2000). ASM1 is widely used for conventional ASP processes. ASM3 is a modification of ASM1 model that can describe the ASP process with higher accuracy. ASM2 and ASM2d simulate the biological processes including the phosphorus removal (Henze et al., 2000; Bournazou et al., 2011). ASM3 model is selected as it can model realistically the ASP systems and despite its sensitivity on several operational parameters it can be a promising mathematical tool for the study of aerobic biological processes like the MBR systems (Saroj et al., 2008; Sperandio and Espinoza, 2008).
Several studies, based on classic or modified ASM models, have been published simulating MBR performance. Jang et al. (2006) developed a model simulating the kinetics of production and degradation for the extracellular polymeric substances (EPS) simultaneously with soluble microbial products (SMPs) in MBR under steady-state conditions, according to a theory suggested by Laspidou and Rittmann (2002). The aim of their study was the prediction of membrane fouling potential, using the Membrane fouling index (MFI) at steady state operating conditions. Saroj et al. (2008) used a modified ASM3 model to simulate the dynamic behavior of EPS production, which is considered as a fouling factor. Janus and Ulanicki (2010) developed a combined ASM3-LR model in order to predict the formation and degradation of all microbial products in an MBR at various conditions under steady state operation. Janus (2014) developed an integrated ASM1 model version for MBR systems. This study was focused on the effect of microbial products on membrane fouling and the de-nitrification process in comparison to other models. The trans-membrane pressure was solely compared with the experimental measurements. Tian et al. (2011) studied the development of an ASM-SMP model. They took into consideration the hydrolysis of SMPs, whereas they excluded EPS kinetics. Chen et al. (2012) investigated the biological process in MBR that is based on an extended ASM3 combined with SMPs formation and hydrolysis rates. This work tried to quantify the uncertainty of model parameters at different SRTs using sensitivity analysis; however, the results were not compared to experimental measurements. Insel et al. (2011) investigated a modified ASM model simulating the simultaneous nitrification and de-nitrification (SNdN) taking place in an MBR. They focused on the limitations of oxygen mass transfer.
In this work the dynamic behavior of all biological processes except phosphorous removal occurring in an MBR unit treating high COD influents is simulated. In particular, simultaneous formation and degradation processes for EPS and SMP have been added to the ASM3 model according to Janus and Ulanicki (2010), Tian et al. (2011), and Chen et al. (2012). Additionally, the effect of the activated sludge on oxygen mass transfer limitations was taken into consideration (Insel et al., 2011). The solids cake build up on the membranes' surface was also simulated and the membrane-fouling phenomenon, in terms of changes in the observed trans-membrane pressure (TMP) was investigated. The model estimates are compared to experimental data obtained from February 2012 to May 2013.
Materials and Methods
Description of the Model Processes
Two additional processes, describing the hydrolysis of SMPs that includes the utilization-associated products (UAP) and biomass associated products (BAP) have been added to the CES-ASM3 model according to Chen et al. (2012) as well as the build-up of solids cake on the membrane surface. It is also assumed that the kinetic parameters that govern the mass transfer of dissolved oxygen and affect biomass growth kinetics, depend on activated sludge concentration (Insel et al., 2011). The state variable describing the alkalinity is excluded, as it can be assumed that it is not limiting substrate for microbial growth (Bournazou et al., 2011).
The model has sixteen state variables, which are divided into three groups. The first group includes all the soluble components, whereas the second one consists of the particulate material components. The last group has a single variable describing cake's thickness. All state variables with their symbols are presented in Table 1.
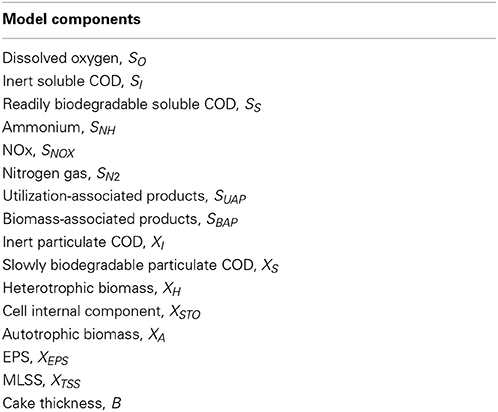
Table 1. Model state variables.
Sixteen processes describe the model structure. The first thirteen processes have been described in classic ASM3 model (processes from p1 to p13 presented in Table 2) (Henze et al., 2000). The aerobic and anoxic Storage processes for the SMP and the hydrolysis reaction for EPS were introduced by Janus and Ulanicki (2010), and are described by the processes p2b, p2c, p3b, p3c, and p13, presented in Table 2. Two additional expressions for the hydrolysis of UAP and BAP have been added (Chen et al., 2012) and are described by the processes p14, p15. In the nitrification process (p10) the effect of wall attached autotrophic biomass on growth-kinetics taken into account (Dokianakis et al., 2006). The dynamic behavior of cake growth on the membranes surface is based on classic cake filtration theory.
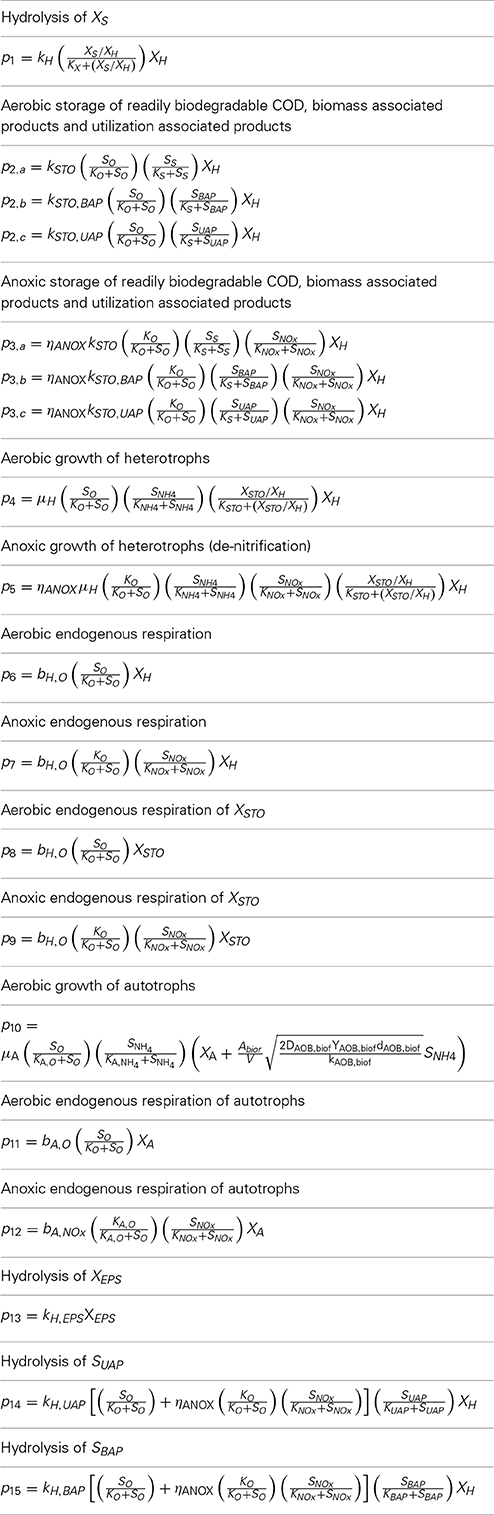
Table 2. Mathematical expression of the model processes.
Sludge Retention Time (SRT) is adjusted to 15, 20, and 30 days by regular intermittent sludge removal. The model predicts MLVSS, MLSS, soluble COD, NH4, NOx and microbial products (SMP and EPS) concentrations as well as cake development. As soluble COD, which passes through the membrane, is considered the sum of the readily biodegradable COD (SS) and inert soluble COD (SI). The total autotrophic (XA), heterotrophic (XH) microorganisms and the slowly biodegradable particulate COD (XS) express the MLVSS concentration in the MBR. MLSS concentration is expressed by the XTSS state variable. The NOx include the NO3-N and NO2-N (SNOX). SMPs compound is considered the soluble EPS, where the XEPS concentration expresses the particulate EPS concentration.
In comparison with other studies the saturation values, regarding to SOtransfer, KO and KA,O are not constants and they depend on activated sludge concentration. According to the approach of Insel et al. (2011) the values of these parameters are given by the equations below:
Description of the Dynamic Model
A system of 16 ordinary differential equations (ODEs), describing partial mass balances of the MBR unit, have been used to simulate the overall behavior of the system. The general differential equation form that describes the soluble concentrations included in the first group of the model's state variables is:
where
D = dilution rate, d−1
Sj,in = concentration of soluble variable j in the influent stream, mg L−1
fSj = fraction of Sj with molecular weight below membrane cutoff molecular weight
Sj = concentration of soluble variable j in the effluent stream, mg L−1
The term, Rj, expresses the sum of all reaction rates for the jth state variable and is given by the equation:
where
νij = are the stoichiometric coefficients for state variable j and model process i as shown in the stoichiometric matrix in Table 3 except the stoichiometric coefficients for SO, SNH4 and XTSS which are provided in Table 4.
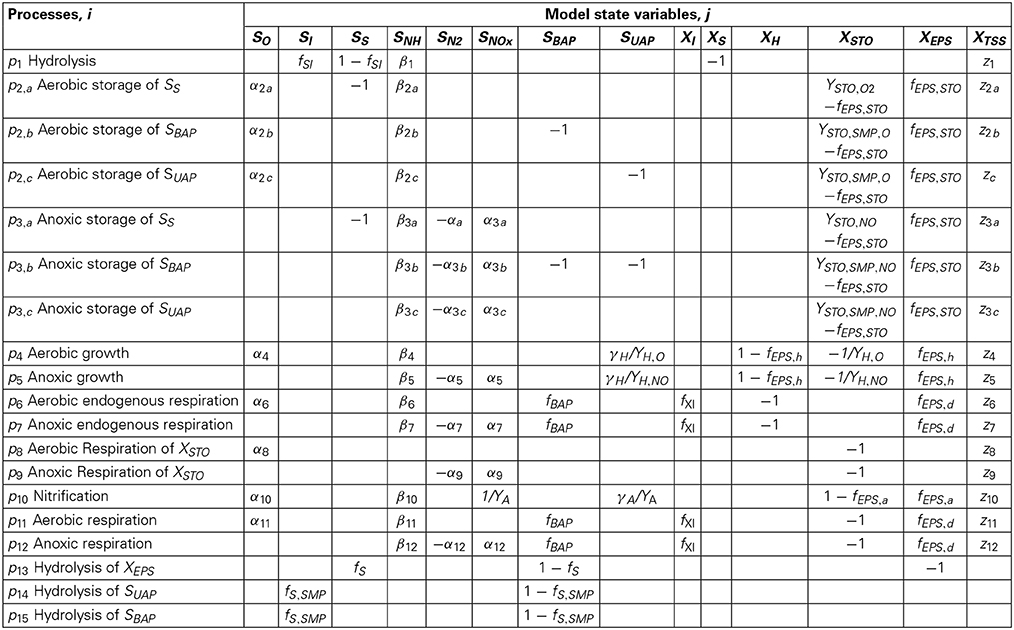
Table 3. Stoichiometric matrix includes all the stoichiometric coefficients (νij).
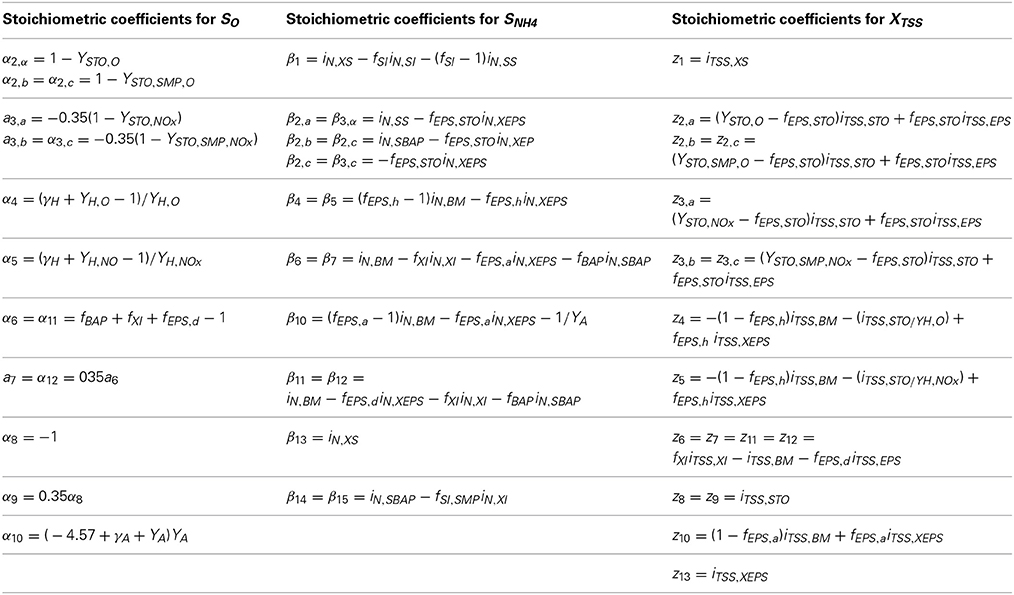
Table 4. Stoichiometric coefficients for SO, SNH4 and XTSS which are presented in Table 3.
pi = model process i as described in Table 2
For example, the reaction rate for readily biodegradable soluble COD (SS) is:
The compounds SO, SS, SNH and SNOx are assumed to be diffused through the cake's layer. Thus, a term expressing the diffusion, for each of these concentrations in the cake, is added. Diffusion rate is follows the Fick's law by:
where
JSj = the flux, mg L−1d−1
As = the total membranes surface, mm2 mm−3
Dj = effective diffusivity of Substrate j in cake, mm2 d−1
The ODE expression for SS, SNH, and SNOx is given by the following equation:
The ODE expression for dissolved oxygen concentration is:
where
KLa = Dissolved oxygen mass transfer coefficient, d−1
SO,sat = Saturated dissolved oxygen concentration, mg L−1
The general ODE describing dynamic behavior of particulate state variables is given by the following equation:
The term Rj, is given by the Equation (4), for j = 9, 10,…, 15.
Cake build up is calculated from the solids deposition on the membrane surface. The mathematical expression relating the flux to the transmembrane pressure is derived from Darcy's law as expressed in the following equation (Lee et al., 2002; Koo et al., 2013).
where
J = the permeate flux through the membrane surface m/d−1 and is considered to be constant (J = Q/A)
ΔP = is the transmembrane pressure, kPa
η = the viscosity of filtrate solution, kPa d−1
rc = is the cake resistance due to the particles deposition, m−1
rm = is the membrane resistance including pore blocking, m−1
The cake resistance is given by the following equation.
where
a = the specific cake resistance, m kg−1
B = the cake thickness, B, mm
dc = the cake density, kg m−1
The membrane resistance is continuously increasing due to pore blocking and it is estimated by the following equation (Mondal and De, 2010)
where
J = the permeate flux (constant at all times), m d−1
rm0 = membrane resistance without pore blocking, m−1
k = pore blocking constant, m−1
t = time of membrane of operation, d
The pore-blocking constant is a parameter, which depends on the concentration of soluble EPS (SMP). For simplicity, in this study, the following relationship for the pore-blocking constant is used.
where, k0 and SMP0 are reference values obtained from the operation of the MBR at SRT = 30 days. Under this assumption, only one parameter, k0, was estimated for the model and was used at all SRTs.
The total cake thickness development is given by
where
kb = the cake removal rate due to bubbling action of the air, d−1
MBR Characteristics and Operating Conditions
The nominal wastewater flow rate in the MBR was 10 m3/d; the bioreactor's volume was about 7 m3, and membranes' surface was 20 m2. The characteristics of the wastewater at the inlet are shown in Table 5. Although the input COD varied with time, the mean value of 2000 mg/L was used for the total dissolved COD.
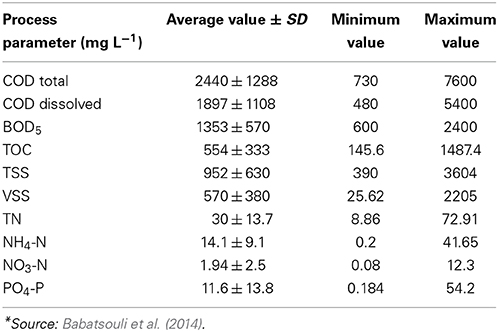
Table 5. Influent wastewater composition*.
The values of all biochemical kinetic constants and stoichiometric parameters used are in the range of values reported in the literature. Some parameters were slightly adjusted in order to simulate more realistically the biological processes. All the calibrated parameters values are presented in Table 6.
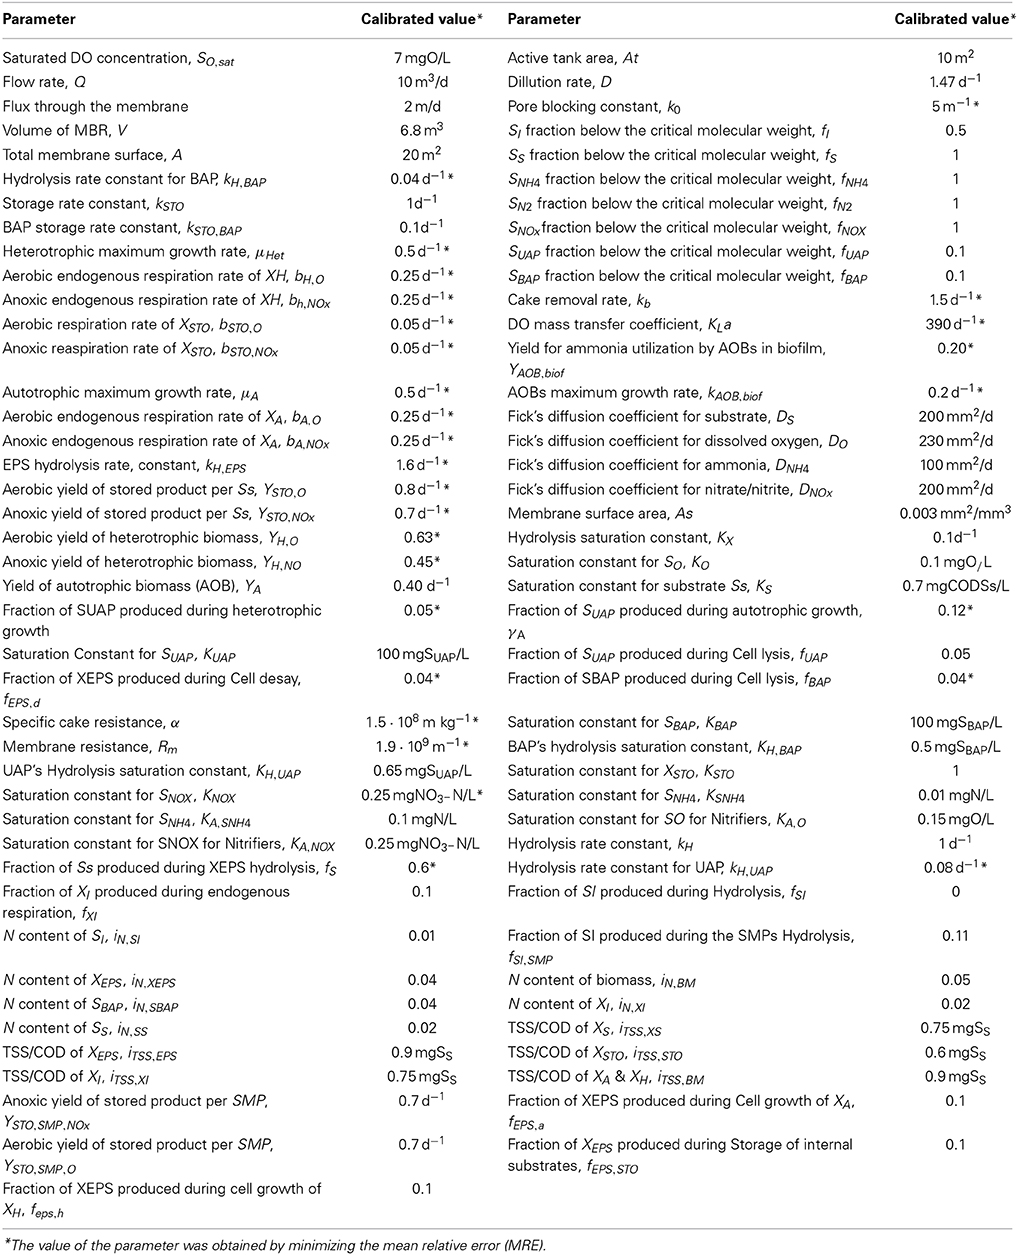
Table 6. Model parameter values.
Experimental Methods
The influent industrial wastewater and permeate were sampled once a week and analyzed for total and volatile suspended solids (TSS and VSS), total and dissolved COD, BOD, TOC, N-NH4, N-NO3, TN, P-PO4. All these analyses were performed according to standard methods and details are provided by Babatsouli et al. (2014).
The mixed liquor from bioreactor (biomass) was sampled weekly for determination of total and volatile suspended solids according to Standard methods. Dissolved oxygen concentration (DO), pH, temperature, and reactor levels are continuously recorded.
Extracellular Polymeric substances (EPS) were obtained with an extraction method using a Cation Exchange Resin (CER) Dowex 20–50 mesh in the sodium form. The sludge and the CER were stirred for 16 h at 900 rpm and the amount of CER used was 70 g CER/g VSS. Sludge was firstly centrifuged at 5000 g for 15 min at 4°C, in order to separate the supernatant EPS (or soluble microbial products- SMP) from the solid where the bound EPS were to be subsequently extracted. Both EPS and SMP were analyzed in terms of proteins, carbohydrates, and humic acids.
The carbohydrates content in EPS was measured by the Anthrone method (Gaudy, 1962) with glucose as the standard. The protein and humic content in EPS were measured by the modified Lowry method (Frolund et al., 1996) using bovine Serum Albumin and Humic acid as the respective standards.
Calibration of the Model
The values of all biochemical kinetic constants and stoichiometric parameters used are in the range of values reported in the literature. Some parameters were slightly adjusted in order to simulate more realistically the biological processes. All the calibrated parameters values are presented in Table 6.
Results and Discussion
The estimated state variables by the calibrated dynamic model were compared to the experimental data obtained from the pilot MBR unit. Figures 1–7 show respectively the observed measurements for COD in the effluent, MLSS, MLVSS, SNOx, EPS and SMPs in the bioreactor and ammonium in the effluent. The estimated state variables are shown at SRTs of 15, 20, and 30 days. For estimation of the overall accuracy of the model, the mean relative error (MRE) of all measured state variables was used, namely,
where
N = number of measurements taken over time (tj, j = 1, …,N)
Ny = number of measured state variables
yi(tj) = model prediction of variable yi (i = 1, …,Ny) at time tj
(tj) = measured value of variable yi (i = 1, …,Ny) at time tj
The calibration of the adjustable model parameters (indicated by a * in Table 6) was performed by minimizing the value of MRE. The parameter estimation was based on a sequential approach for estimating parameters in models described by sets of ordinary differential equations (Kalogerakis, 2002). On the other hand, in order to quantify the performance of the model with respect to a particular variable, the mean relative error of each state variable, MREi, i = 1, …, Ny, was also computed by
Figure 1 exhibits the COD influent (orange dots), COD effluent (blue diamond signs) and COD predicted concentrations (continuous red line). The model matches sufficiently well the COD removal although as COD in the influent stream a constant value of 2500 mg/L was used. The COD of the outlet stream, simulation line follows the inert COD behavior, because it is the fraction of soluble COD with the bigger concentration. The MRE is estimated to 3.15, 1.07, and 0.19 at the SRTs of 15, 20, and 30 days. The prediction ability decreases at shorter SRTs.
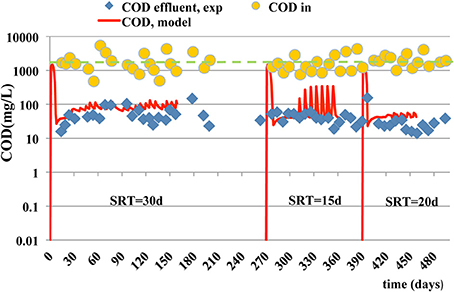
Figure 1. Experimental data and model simulation results for influent (- - - -) and effluent (____) COD concentrations.
Similar trends are observed for MLSS and MLVSS concentrations (Figures 2, 3) where the model predictions are accurate enough. The mean relative error of the model for MLSS and MLVSS is 0.29 and 0.32 respectively, at SRT of 15 days. If SRT increases, the model accuracy for the MLSS and biomass is improved. The MRE for MLSS is 0.22 at SRT of 20 days and 0.11 at the SRT of 30 days. The respective error for MLVSS is 0.25 and 0.11. Only the MLVSS, at the SRT of 15 days, is not in good agreement with the measurements. Chen et al. (2012) suggested that the SRT impacts on microbial growth and death rate parameters and contributes to the uncertainty of their estimation. The parameters associated with kinetics of the biomass, which are difficult to be estimated at each SRT and hence, they were kept the same for all SRTs. The de-nitrification process simulations as shown in Figure 4 exhibit a better match to experimental data as the SRT increases. The MRE for NOx is 23.94 at the SRT of 15 days, 1.40 at SRT of 20 days and 0.54 at the SRT of 30 days. It should be noted that the experimental measurements for NOX do not include measurements of NO2 (only NO3 was measured) and hence, the differences between data should be smaller than the model estimates.
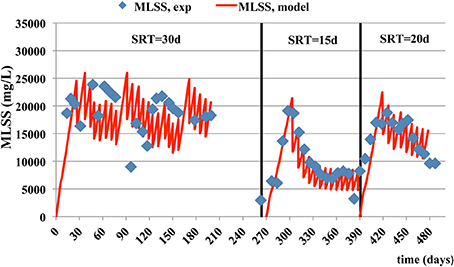
Figure 2. Experimental data and model simulation results for mixed liquor suspended solids (MLSS).
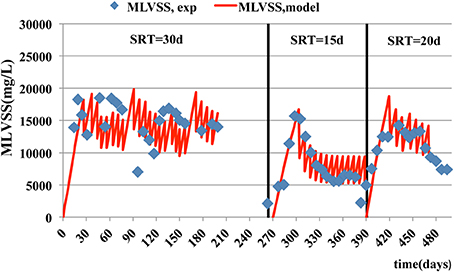
Figure 3. Experimental data and model simulation results the total biomass concentration (MLVSS).
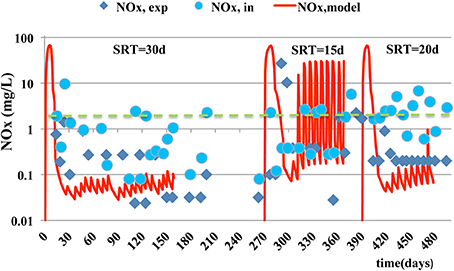
Figure 4. Experimental measurements and model estimations of NO3-N and NO2-N (SNOX) in the effluent (___). Influent concentration is also shown (- - - -).
In case of particulate microbial products, the accuracy of model prediction decreases as the SRT becomes smaller. The best predictions for SMPs and EPS are at the SRT of 30 days with a corresponding estimated mean relative error of 2.54 and 0.13 respectively (Figures 5, 6). The simulation results, for the SMPs, are similar to those reported by Chen et al. (2012), where a slight decrease of SMPs occurs when SRT increases and then the SMPs concentration increases with SRT increase. Additionally, as it was mentioned by Tian et al. (2011), the hydrolysis rates of SMPs characterized by uncertainty due to the SRT changes. In the case of ammonium removal, the model fits adequately the nitrification process (Figure 7).
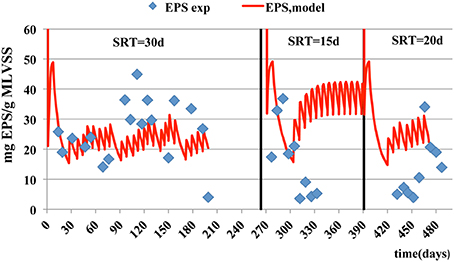
Figure 5. Experimental data and model estimations of particulate EPS concentration per mass of MLVSS.
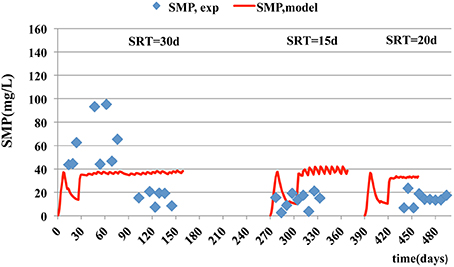
Figure 6. Experimental data and model estimations of soluble EPS (SMP) concentration.
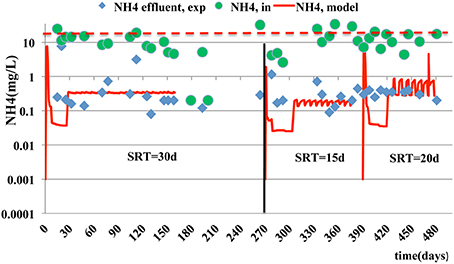
Figure 7. Experimental measurements and model estimations for NH4 effluent (___). NH4 influent concentration is also shown (- - - -).
In case of fouling phenomenon prediction ability, as the cake layer on the membrane was not measured, the transmembrane pressure in the MBR simulated and compared with the respective measured TMPs (Figure 8). As it shown, in Figure 8, the modeled TMP describes the operating conditions in MBR accurately, especially at the SRT of 30 days, where the mean relative error is 0.13. However, in two other SRTs fails to match adequately the experimental data. This occurs due to inadequate prediction of SMPs as mentioned earlier. In comparison to a previous study by Janus (2014), this model had a relative good TMP prediction ability at different SRTs.
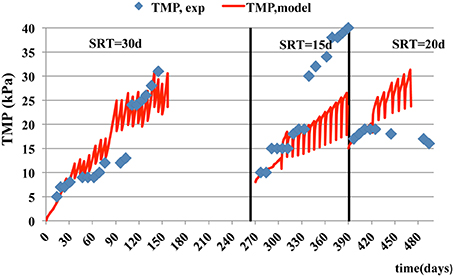
Figure 8. Experimental data and model estimations of trans-membrane pressure vs. time at three different SRTs.
Overall, model predictions of the state variables follow a similar trend to the observed measurements over time, except the case of de-nitrification process and ammonium removal, where the effect of regular sludge removal on the dynamics of the system is significant. In particular, the MRE of all measured state variables is 4.40, 1.16, and 0.57 at an SRT of 15, 20, and 30 days respectively. The mean estimated error, at the SRT of 15 days is due to an inadequate prediction of de-nitrification process at these operating conditions.
Conclusions
The developed MBR model can simulate with sufficient accuracy the general behavior of the MBR unit, characterized by a high COD wastewater input with significant fluctuations, for activated sludge, biomass, COD and ammonia effluents concentrations and the membrane fouling potential at the range of SRTs between 1 and 30 days. It fails to predict the production of microbial products, except the case of SRT of 20 days for the SMPs and the SRT of 30 days for the EPS. Examining the simulation results for TMP and SMP production, SMPs appear to be the main factor for fouling. However, as also pointed out in several previous studies (Ahn et al., 2006; Janus and Ulanicki, 2010; Chen et al., 2012), the model predictions are very sensitive to changes in the kinetic and stoichiometric parameters; and hence, their values match be carefully chosen. Furthermore, some processes such as the production and degradation of EPS and SMPs seem to be affected by changes in sludge retention time and hence, they could impact on prediction ability of the model (Chen et al., 2012). The mathematical descriptions of the SMP kinetics need to be improved in order to describe more realistically the mechanisms of their production and degradation. The model succeeds in simulating satisfactorily the dynamic behavior of transmembrane pressure at different operating conditions.
Conflict of Interest Statement
The authors declare that the research was conducted in the absence of any commercial or financial relationships that could be construed as a potential conflict of interest.
Acknowledgments
The installation and operation of the MBR pilot unit was funded by the Cyprus Research Promotion Foundation's Framework Programme 2009–2010 project No. 0609 BIE/09. This research has also co-financed by the European Union (European Social Fund—ESF) and Greek national funds through the Operational Program “Education and Lifelong Learning” of the National Strategic Reference Framework (NSRF)—Research Funding Program: Heracleitus II. Investing in knowledge society through the European Social Fund.
References
Ahn, Y. T., Choi, Y. K., Jeong, H. S., Chae, S. R., and Shin, H. S. (2006). Modeling of extracellular polymeric substances and microbial products production in a submerged membrane bioreactor at various SRTs. Water Sci. Technol. 53, 209–216. doi: 10.2166/wst.2006.330
Babatsouli, P., Palogos, I., Mihalodimitraki, E., Costa, C., and Kalogerakis, N. (2014). Evaluation of a MBR pilot treating industrial wastewater with a high COD/N ratio. J. Chem. Technol. Biotechnol. doi: 10.1002/jctb.4364. [Epub ahead of print].
Bournazou, M. N. C., Arellano-Garcia, H., Wozny, G., Lyberatos, G., and Kravaris, C. (2011). ASM3 extended for two-step nitrification-denitrification: a model reduction for sequencing batch reactors. J. Chem. Technol. Biotechnol. 87, 887–896. doi: 10.1002/jctb.3694
Chen, L., Tian, Y., Cao, C., Zhang, S., and Zhang, S. (2012). Sensitivity and uncertainty analyses of an extended ASM3-SMP model describing membrane bioreactor operation. J. Memb. Sci. 389, 99–109. doi: 10.1016/j.memsci.2011.10.020
Dokianakis, N. S., Kornaros, M., and Lyberatos, G. (2006). Effect of wall growth on the kinetic modelling of Nitrite oxidation in a CSTR. Biotechol. Bioeng. 93, 718–726. doi: 10.1002/bit.20758
Frolund, B., Palmgrem, R., Keiding, K., and Nielsen, P. H. (1996). Extraction of extracellular polymers from activated sludge using a cation exchange resin. Water Res. 30, 1749–1758. doi: 10.1016/0043-1354(95)00323-1
Gaudy, A. F. (1962). Colorimetric determination of protein and carbohydrate. Ind. Water Wastes 7, 17–22.
Henze, M., Cujer, W., Mino, T., and van Loosdrecht, M. C. M. (2000). Activated Sludge Models: ASM1, ASM2, ASM2d and ASM3. London: IWA Publishing.
Insel, G., Hocaoglu, S. M., Cokgor, E. U., and Orhon, D. (2011). Modelling the effect of biomass induced oxygen transfer limitations on the nitrogen removal performance of membrane bioreactor. J. Memb. Sci. 368, 54–63. doi: 10.1016/j.memsci.2010.11.003
Jang, N., Ren, X., Cho, J., and Kim, I. S. (2006). Steady-state of bio-fouling potentials with respect to the biological kinetics in the submerged membrane bioreactor (SMBR). J. Memb. Sci. 284, 352–360. doi: 10.1016/j.memsci.2006.08.001
Janus, T. (2014). Integrated mathematical model of a MBR reactor including biopolymer kinetics and membrane fouling. Proc. Eng. 70, 882–891. doi: 10.1016/j.proeng.2014.02.098
Janus, T., and Ulanicki, B. (2010). Modelling SMP and EPs formation and degradation kinetics with an extended ASM3 model. Desalination 261, 117–125. doi: 10.1016/j.desal.2010.05.021
Kalogerakis, N. (2002). “A sequential approach to nonlinear regression of ill-conditioned multi-parameter ODE Models,” in Recent Developments in Optimization and Optimal Control in Chemical Engineering, ed R. Luus (Kerala: Research Signpost), 19–35.
Koo, C. H., Ren, X., Mohammad, A., Suja, F., and Talib, M. Z. M. (2013). Setting-up of modified fouling index (MFI) and cross-flow sampler-modified fouling index (CFS-MFI) measurement devices for NO/RO fouling. J. Memb. Sci. 435, 165–175. doi: 10.1016/j.memsci.2013.02.027
Laspidou, C. S., and Rittmann, B. E. (2002). A unified theory for extracellular polymeric substances, soluble microbial products, and active and inert biomass. Water Resour. 36, 2711–2720. doi: 10.1016/S0043-1354(01)00413-4
Lee, Y., Cho, J., Seo, Y., Lee, J. W., and Ahn, K. H. (2002). Modelling of submerged bioreactor process for wastewater treatment. Desalination 146, 451–457. doi: 10.1016/S0011-9164(02)00543-X
Mondal, S., and De, S. (2010). A fouling model for steady state cross flow membrane filtration considering sequential intermediate pore blocking and cake filtration. Seperat. Purif. Technol. 75, 222–228. doi: 10.1016/j.seppur.2010.07.016
Saroj, D. P., Guglielmi, G., Chiarani, D., and Andreottola, G. (2008). Modeling and simulation of membrane bioreactors by incorporating simultaneous storage and growth concept: an especial attention to fouling while modeling the biological process. Desalination 221, 475–482. doi: 10.1016/j.desal.2007.01.108
Sperandio, M., and Espinoza, M. C. (2008). Modeling an aerobic submerged membrane bioreactor with ASM models on a large range of sludge retention time. Desalalination 231, 82–90. doi: 10.1016/j.desal.2007.11.040
Keywords: Activated Sludge Models, CES-ASM3 model, membrane bioreactor, membrane fouling, trans membrane pressure
Citation: Palogos I, Babatsouli P, Costa C and Kalogerakis N (2014) Computer simulation of a submerged membrane bioreactor treating high COD industrial wastewater. Front. Environ. Sci. 2:30. doi: 10.3389/fenvs.2014.00030
Received: 29 April 2014; Accepted: 24 June 2014;
Published online: 16 July 2014.
Edited by:
Pattanathu K. S. M Rahman, Teesside University, UKReviewed by:
Nastaein Qamaruz Zaman, Universiti Sains Malaysia, MalaysiaCY Yin, Teesside University, UK
Copyright © 2014 Palogos, Babatsouli, Costa and Kalogerakis. This is an open-access article distributed under the terms of the Creative Commons Attribution License (CC BY). The use, distribution or reproduction in other forums is permitted, provided the original author(s) or licensor are credited and that the original publication in this journal is cited, in accordance with accepted academic practice. No use, distribution or reproduction is permitted which does not comply with these terms.
*Correspondence: Nicolas Kalogerakis, School of Environmental Engineering, Technical University of Crete, Polytechneioupolis, Chania 73100, Greece e-mail:bmljb2xhcy5rYWxvZ2VyYWtpc0BlbnZlbmcudHVjLmdy