 Makiko Nakata
 Itaru Sano
 Sonoyo Mukai
- 1Kinki University, Higashi-Osaka, Japan
- 2Kyoto College of Graduate Studies for Informatics, Kyoto, Japan
Increasing emission of anthropogenic particles is causing heavy air pollution. This work intends to analyze the air pollution in Osaka. PM is usually used as an indicator of air quality, because high PM concentrations can degrade air quality. Osaka is the second largest metropolitan region of Japan and its air is significantly polluted by anthropogenic particles emitted from vehicles and industry. In this study, seasonal variation of air pollutants in Osaka is investigated using ground observations such as PM sampling, AERONET photometry, and numerical model simulation. Results indicate that PM concentrations are high during spring and summer because of yellow dust events and photochemical reactions, respectively. In addition, the impact of anthropogenic PM around Osaka is significant in summer.
Introduction
It is known that the distribution of atmospheric particles (aerosols) in Asia is complicated by both natural factors and human activity, and that air pollution has become severe in recent years (Lee and Kim, 2010). Air pollution has become a serious problem in megacities. In particular, fine particles called PM2.5, whose diameter is 2.5 μm or less, are problematic. Particulate matter (PM) pollution, characterized by high PM2.5 level readings, causes a spike in the mortality rate of patients suffering from heart and lung diseases because these fine particles penetrate deeper into the lungs than coarser inhalable particles, and more severely affect human health. Anthropogenic sources of PM2.5 include automobiles, factories, coal-burning power plants, and domestic heaters. Recently, problems associated with the levels of PM2.5 have increased, raising health concerns in Japan and neighboring countries in Asia (Ueda et al., 2012). Aerosols not only cause air pollution but also affect the Earth's radiation balance through scattering and absorbing solar and thermal radiation and by promoting chemical reactions in the atmosphere, thus altering its composition (Takemura et al., 2005). It is therefore important to study aerosols for their influence on environment, climate, and health.
Our observation site is located in eastern Osaka, shown in Figure 1. Osaka city is at the center of the second largest metropolitan area of Japan. The greater Osaka metropolitan area covers 7,800 square kilometers within a radius of 50–60 km from the center of Osaka. The population exceeds 10 million, making it one of the world's biggest metropolitan areas. The area is known for its manufacturing technologies operated by small- and medium-sized enterprises. This area rarely experiences clear air conditions with a limited number of small particles, and often suffers high levels of pollution from particles emitted from diesel vehicles and industrial activities (Nakata et al., 2011, 2013). Furthermore, pollutants carried by winds from continental China add to the atmospheric pollution.
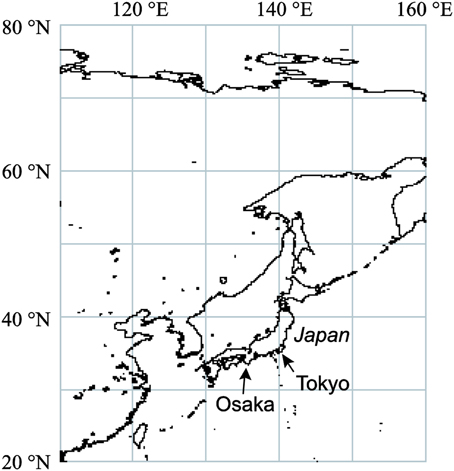
Figure 1. Geographical position of ground observation site (NASA/AERONET Osaka site:34.65°N, 135.59°E).
This study corresponds with the properties of air pollutants in Asia (Kahn et al., 2004). Our research group has been engaged in aerosol retrieval based on satellite data (Mukai, 1990; Mukai et al., 1992), ground measurements (Sano et al., 2003), and numerical model simulations (Mukai et al., 2008). PM levels in Osaka are monitored using a PM sampler (SPM-613D, Kimoto Electric, Japan) (Mukai et al., 2005), installed at the aerosol robotics network (AERONET) site on the roof of a building at Kinki University, Osaka. Worldwide, National Aeronautics and Space Administration (NASA)/AERONET data are primarily available as ground-based sun-photometric products that provide measurements of the aerosol optical thickness (AOT) and the Ångström exponent (α) (Holben et al., 1998). Furthermore, at the same site, a light detection and ranging (LIDAR) instrument, which is part of the national institute for environmental studies (NIES)/LIDAR network (Shimizu et al., 2004), has been set up. In this study, we investigate seasonal variation of air pollutants and the causes of variation based on the complex utilization of various instruments and simulations. In addition, air pollution characteristics are considered from different perspectives.
Methods
This study takes advantage of the simultaneous observations made at Osaka's Kinki University campus (Figure 1). In 2002, an AERONET station was set up at the University for measuring solar radiation. In 2004, a PM sampler was also installed at the same AERONET site on the roof of a building 50 m above sea level.
Worldwide NASA/AERONET data are mostly available as ground-based sun-photometric products. The data supplied by the AERONET instrument (Cimel) are analyzed with a standard AERONET processing system to generate AOT values. AOT is an important aerosol parameter that can be derived from the transmittance measured by direct sun photometry. The resolution of AOT is better than 0.01 at all observation wavelengths and the obtained data are cloud screened before aerosol retrieval (Smirnov et al., 2000). AOT is an important aerosol parameter that can be derived from the transmittance measured by direct sun photometry. The resolution of AOT is better than 0.01 at all observation wavelengths and the obtained data are cloud screened before aerosol retrieval (Smirnov et al., 2000). AOT, the basic parameter for describing atmospheric aerosols, indicates the degree of opacity, and hence, the atmospheric concentration of aerosol particles. The Ångström exponent (α) is derived from the spectral AOT, as in Equation (1), where λ represents the wavelength.
where λ1 and λ2 represent 440 and 870 nm, respectively.
The α values are closely related to the aerosol size distribution. Small α values indicate the presence of large particles, while large values indicate small particles. In general, α values ranging from ~0 to 1.0 indicate large particles such as sea salt aerosols and soil dusts, whereas values of 1.0 < α < ~2.5 indicate sulfate particles and those associated with biomass burning (Eck et al., 1999; O'Neill et al., 2003). Other aerosol properties such as size distribution and refractive index are also derived from the AERONET data (Dubovik and King, 2000).
PM particles have been collected by SPM-613D at the Osaka/AERONET site (Mukai et al., 2007). The SPM-613D sampler collects suspended PM on a Teflon-filter and measures the weight of the particles by the absorbance of beta rays. The PM sampler provides information separately about the concentrations of PM2.5, PM10, and optical black carbon particles, because it can separately determine the contributions of fine particles (PM2.5) and coarse particles (PMC) to give the difference between PM10 and PM2.5 concentration levels (i.e., PMC = PM10 − PM2.5). PMC is generally a better indicator of dust events than PM2.5 because soil dust particles are typically large. The SPM-613D sampler measures PM concentrations every hour. The data is eliminated if the PM10 concentration is smaller than that of PM2.5. After data screening, the daily and monthly PM concentrations were calculated.
To investigate the transportation of PM2.5, we used the three-dimensional aerosol-transport-radiation model SPRINTARS (Takemura et al., 2000, 2002, 2005, 2009) driven by the general circulation model of the Atmosphere Ocean Research Institute (AORI)/NIES/Frontier Research Center for Global Change (FRCGC) in Japan (K-1 Model Developers, 2004). The horizontal and vertical resolutions of the triangular truncation are set at T42 (approximately 2.8° latitude by 2.8° longitude) and 20 layers, respectively. The model considers carbonaceous, sulfate, dust, and sea-salt aerosols, and aerosol transport processes, including emission, advection, diffusion, wet deposition, dry deposition, and gravitational settling. Emission inventory data on fossil fuel consumption, fuel wood consumption, and forest fires are used as inputs for the carbonaceous and sulfate aerosols.
Results
Photometry and PM Sampling
Figure 2 presents the monthly averages of AOT at the AERONET Osaka site over 4 years from November 14, 2009, to June 30, 2012. The AOT data are derived from the AERONET Version 2 Level 2 database. Note that extremely high AOT data are manually checked for cloud contamination by using a whole-sky camera, working simultaneously with AERONET measurements. The solid line with filled circles and the line with open circles in Figure 2 present AOT values at wavelengths of 500 and 675 nm, respectively. The dashed line represents the Ångström exponent (α) defined in Eq. (1). The following results are inferred from these graphs with respect to the monthly averages of aerosol properties (AOT andα).
1. AOT values at a wavelength of 500 nm are higher than those at 675 nm.
2. AOT values are high in spring and summer.
3. AOT peaks in May at both wavelengths.
4. α is larger than 1.0 through the year.
5. α is the largest (~1.58) in July, and the lowest (~1.10) in May.
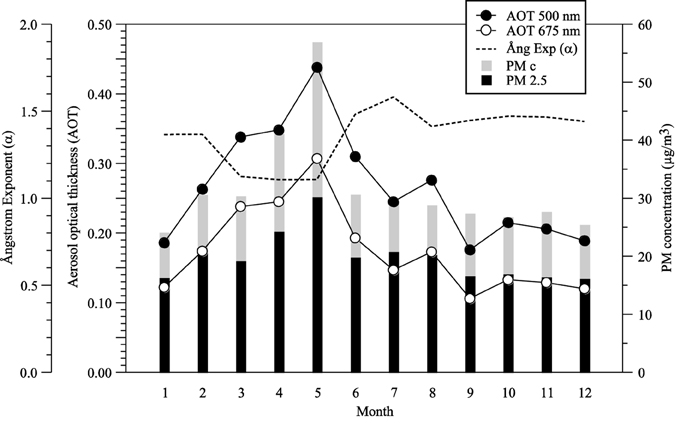
Figure 2. Ground measurements at NASA/AERONET Osaka site (refer to Figure 1). Values are monthly mean from November 14th in 2009 to June 30th in 2012. PM data are simultaneously matching up in an hour to AOT observation.
Since Figure 2 presents the monthly mean values, α is neither very large nor very small. But occasionally it is greater than 2.0 or less than 1.0. These cases indicate the severe air pollution events with very small or large aerosols.
The black and gray bar charts in Figure 2 represent monthly mean fine (PM2.5) and coarse (PMC) particle concentrations, respectively, collected with the SPM-613D sampler. It is noted that these PM values are matched up to the AERONET data acquisition time; i.e., PM data with the SPM-613D are selected to be used simultaneously with the AERONET photometry. We can draw the results from ground measurements (Figure 2) at the Osaka site as follows:
1. The monthly change of PM concentrations shows a similar behavior to that of AOT.
2. PM2.5 concentrations and AOT are somewhat low during the monsoon in June.
3. The atmosphere is relatively clear in autumn.
4. The annual average value of PM2.5 at Osaka is ~20 μg/m3. This suggests that clear air conditions are rare around Osaka. According to Japan's environmental standards of air quality, the daily average and the annual average concentrations of PM2.5 should be 35 and 15 μg/m3, respectively.
5. PM data are characterized by a high concentration of coarse particles (PMC) in spring and a high concentration of fine particles (PM2.5) in summer.
6. The highest values of both AOT and PM in May suggest the transportation of yellow dust from China. It is known that yellow dust storms may contain high concentrations of fine particles because dust particle size decreases as the particles are transported via westerly winds over long distances. Accordingly, PM2.5 concentration levels correspond with those of both anthropogenic and natural aerosols (Mukai et al., 2004).
7. In winter, the monthly mean PM2.5 concentrations are not very high, although high PM2.5 concentrations are occasionally observed.
In general, automobiles and factories using fossil fuels are the main sources of PM2.5 throughout the year. During winter, coal-burning power plants and domestic heat-appliance usage increase the amounts of fuel consumed. China's Ministry of Environment Protection has reported that up to 25% of the country was covered by a thick fog during the winter of 2012/2013. Since seasonal winds can carry air pollutants from China to Japan, the northwest winds that dominate during winter and spring in Japan must bring increased levels of pollution over the country. The yellow dust transportation in spring represents item six in the list above (Littmann, 1991). However, the PM concentrations being low in winter seems as shown in item seven above seem at odds with the strong westerly wind in this season. These conflicting points are considered in detail in the next section by using numerical model simulation on a global scale.
We conclude that two cases of air pollution events are clearly detected from the ground measurements at Osaka presented in Figure 2: (1) the yellow dust event in spring due to the highest AOT, low value of α and the largest values of both PM2.5 and PMC, and (2) the photochemical event in summer, as indicated by the high values of AOT, α, and PM2.5.
Air Pollution Events
Figure 3 shows that the frequency of the daily average PM2.5 concentration is higher than 35 μg/m3, which represents the daily average value of PM2.5 in air conforms to the environmental quality standards of Japan. For reference, the annual average standard value of PM2.5 is 15 μg/m3. The long-term objective (annual average) and the short-term objective (daily average) are established from the viewpoint of epidemiology and statistics, respectively. Both objectives are used to determine the status on the progress of achieving environmental quality standards. The annual average is estimated from the sum of valid hourly PM2.5 data for 1 year, divided by time. The daily average is defined as the top 2% of all daily means for 1 year and the value is compared to the daily environmental quality standard for PM2.5 (35 μg/m3). This does not mean that if on a particular day, the PM2.5 concentration is higher than 35 μg/m3, then it should be considered as an unachieved environmental quality standard. In fact in Osaka, the number of days with PM2.5 concentration higher than 35 μg/m3 is about 20. Such number of days was highest in May, followed by in August.
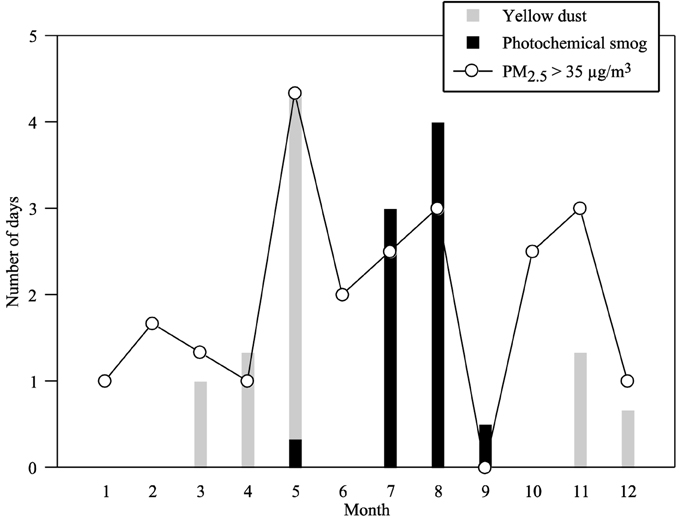
Figure 3. Number of days that photochemical smog (denoted by black bar charts) and yellow dust (by gray bar chart) events are observed in Osaka prefecture and daily average PM2.5 concentrations (represented by the solid lines with open circles) at the Osaka site are higher than 35 μg/m3. Values are monthly mean from November 14th in 2009 to June 30th in 2012 same as Figure 2.
The bar graphs in Figure 3 show the number of days that photochemical smog and yellow dust events are observed in the Osaka prefecture. Photochemical smog advisories are issued from prefectural and city governments when oxidant concentrations exceed 0.12 ppm and suitable weather conditions exist for photochemical reactions. The number of photochemical smog advisories used by the Osaka Prefecture government to determine the smog amount. In summer, more sulfate aerosols are produced by active photochemical reactions (Hara et al., 2011). Hence, the frequent occurrence of high concentrations of aerosols from July to August is most likely caused by photochemical reactions. High PM2.5 concentrations were observed at our site when smog advisories were issued for the Osaka Prefecture.
The number of yellow dust events is reported by the Japan meteorological agency. The observed yellow dust events are likely to contribute to the seasonal variations in coarse particle concentrations. The air and ground conditions are suitable for dust events in spring because of the strong surface winds and dry land conditions. On the other hand, in summer, winds weaken and the lands moisten. Dust events can also occur during autumn in Asia, and dust has occasionally been observed during this season in Japan. Particle properties such as amount, size, shape, and composition change in the Osaka area during dust events. A field emission scanning electron microscope (SEM) equipped with an energy-dispersive X-ray analyzer (EDX) is an effective instrument for observing surface microstructures and analyzing the chemical composition of materials such as metals, powders, and biological specimens. An SEM/EDX was used to analyze the PM from the PM sampler. The SEM/EDX can detect elements from a sample, using the X-rays emanating from the surface of the sample to provide the mass concentration of each component. The elemental compositions were determined by SEM/EDX analysis on a day with a dust event. On a day without a dust event, the PM10 ratio of silicon was approximately 0.3. It is clear that silicon, which is possibly derived from soil particles, was the dominant PM10 constituent on the day with a dust event. Since the size of dust particles decreases during long-range transport, PM2.5 concentrations during the dust event were high. Furthermore, fine anthropogenic particles can be transported to Japan along with dust particles (Mukai et al., 2004). Consequently, PM2.5 concentrations often increase during dust events.
We can summarize the following results about air pollutant events at Osaka site as, based on from Figure 3:
1. The frequency of photochemical smog is high from July to August.
2. Yellow dust events occur with greater frequency in spring, with the most frequent events observed in Osaka occurring in May. These events are also observed during the late autumn in Osaka.
3. High concentrations of PM2.5 in spring and summer must be affected by yellow dust and photochemical smog, respectively.
4. Both the number of days with air pollutant events and high concentration of PM2.5 are low in winter.
Numerical Model Simulation
The distribution of aerosols in Asia is complex due to both the increasing emissions of anthropogenic particles associated with economic growth and the behavior of natural particles. Aerosols have a number of impacts on the social and natural environment. Aerosols affect the Earth's radiation balance due to the scattering and absorbing of solar and thermal radiation as well as by altering the composition of the atmosphere by triggering chemical reactions. Therefore, detailed investigation of aerosols is important. In the previous section, ground observations show that air pollutant events are caused by yellow dust in spring and by photochemical reactions in summer and PM2.5 concentration increases from spring to summer at Osaka. In this section, we consider the question that PM2.5 concentration is higher in summer than in winter at Osaka using numerical model simulation.
As we used the emission inventory data for 2000, aerosol concentration is likely to be different from that for around 2010 when the ground observations shown in the previous section were made. However, we took some sort of reference to seasonal variation of aerosol distribution by model simulation.
The major anthropogenic PM is sulfate aerosol emitted from the burning of fossil fuels. The seasonal mean vertical and horizontal distribution of sulfate aerosols is examined first. Figure 4 shows the 2-month averaged sulfate aerosol mass concentration and winds at 850 hPa derived from the model simulation. Simulated sulfate aerosol mass concentration is shaded (see the gray scale on the bottom-right corner of the figure) and winds are shown as vectors using zonal wind and north-south wind. The region of large sulfate aerosol mass concentration extends from southwestern to northern China and to Japan in the summer, whereas the enhanced sulfate aerosol mass concentration is limited to near the source area in winter. Osaka is located in western Japan, marked by the open circle in Figure 4. Sulfate aerosol is transported from continental China to western Japan by northwest winds throughout the year. Therefore, a high concentration of PM2.5 is often observed in western Japanese cities when air pollution occurs in eastern Chinese cities. Comparison between sulfate aerosol distributions averaged for January–February and July–August shows that the concentration of sulfate aerosol transported to eastern Japan is lower in winter. The region of large aerosol concentration extends from western to northern Japan in summer. It is supported by ground observations shown in the previous section and also satellite data, whose seasonal mean AOT for summer is larger than that for winter in this region (Chu et al., 2003).
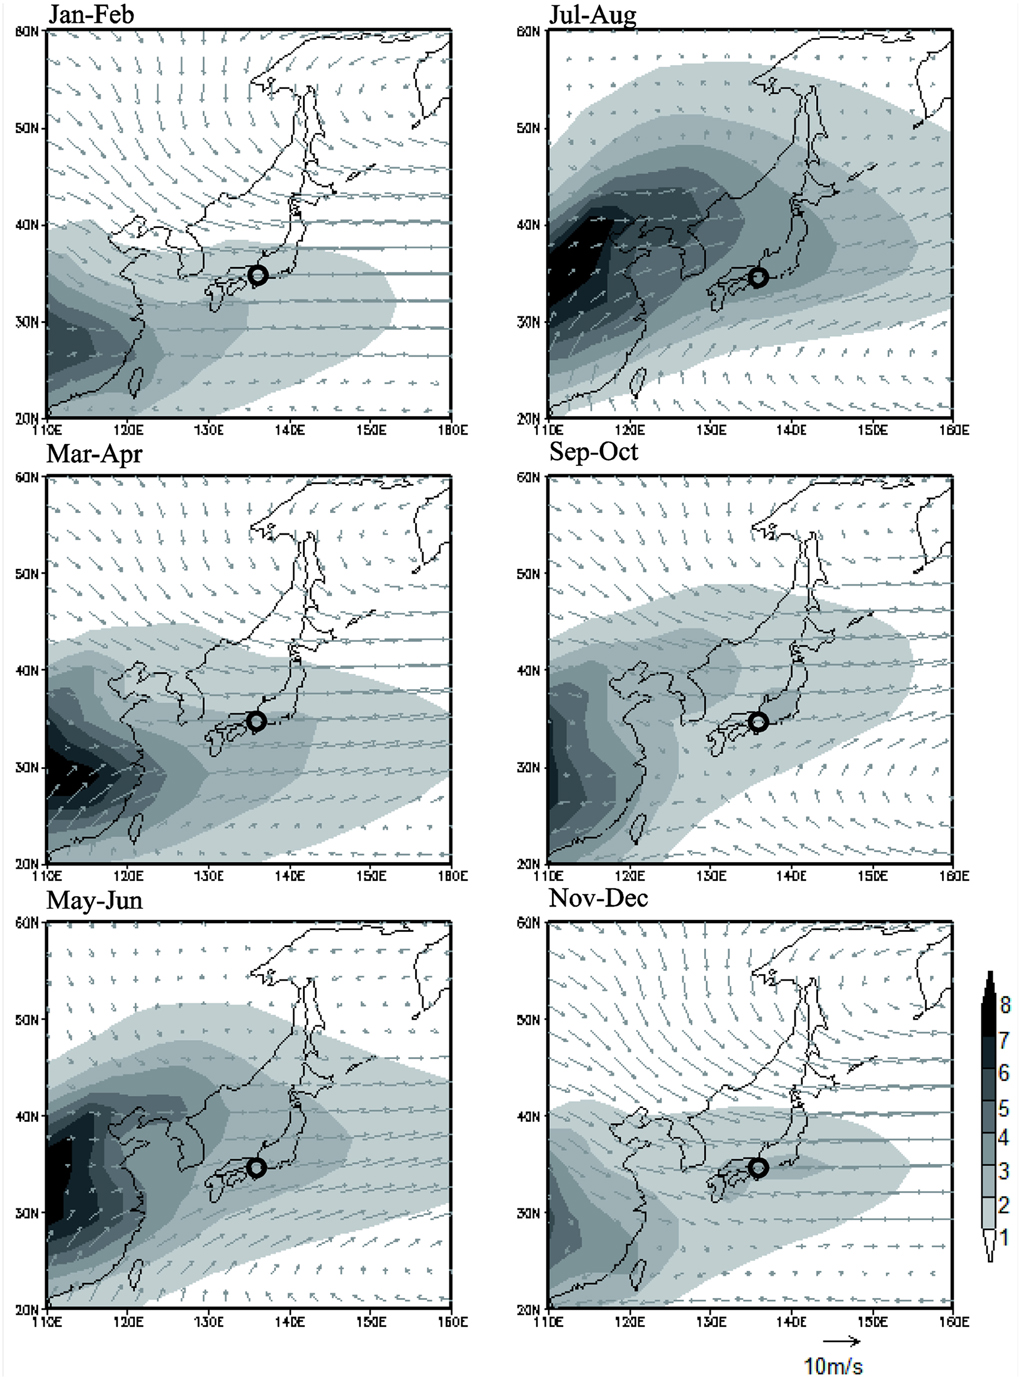
Figure 4. Simulated 2-month averaged sulfate aerosol mass concentration (μg/m3) refer to the gray scale and wind speed (m/s) denoted by arrows at 850 hPa. Open circles on the map show Osaka.
The vertical distribution of sulfate aerosol mass concentration from 110°E to 160°E at 35°N is shown in Figure 5 (refer to the gray scale at the bottom-right corner). The value of the gray scale in Figure 5 is larger than that in Figure 4, because sulfate aerosol mass concentration is high near the surface and decreases with altitude. For comparing Figures 4, 5, the dashed lines are drawn at the level of 850 hPa. The sulfate aerosol elevation is low in winter and increases from spring to summer with the presence of warmer surfaces. The result indicates that sulfate aerosols emitted in cities in eastern China are less likely to be carried to Japan by high altitude west winds in winter. This relates to the ground observation that PM2.5 concentrations are not so high at Osaka in winter. On the other hand, the elevation of sulfate aerosols is high and more sulfate aerosol is transported from continental China to Japan in summer. The model simulation result indicates that these sulfate aerosols carried by winds influence air pollution at Osaka in summer. Weather conditions in summer are also suitable for photochemical reactions and photochemical smog is formed by local emission sources. Thus, the high concentration of PM2.5 in summer at Osaka is caused by both local and remote sources.
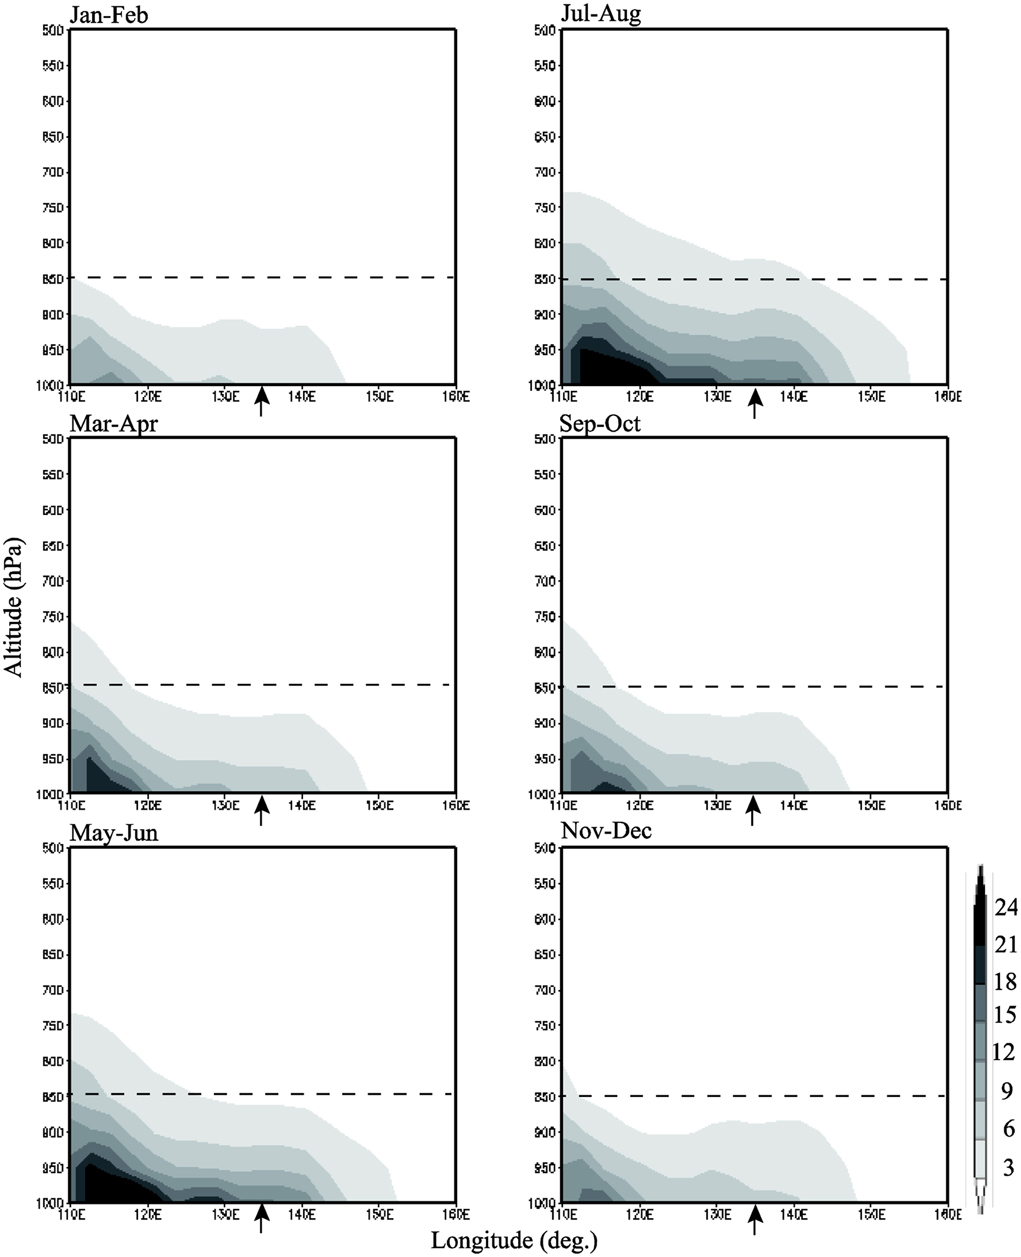
Figure 5. Simulated 2-month averaged vertical distribution of sulfate aerosol mass concentration (μg/m3) at 35°N. Dashed lines show the level of 850 hPa. Osaka is indicated by arrows.
The following results are drawn from numerical model simulation:
1. The concentration of sulfate aerosol transported from continental China to Japan in summer is higher than that in winter.
2. The sulfate aerosol elevation is low in winter and increases from spring to summer.
3. The high concentration of PM2.5 in summer in Osaka is caused by both local sources and transboundary pollutants.
Satellite Observations
Figure 6 shows Aqua/MODIS images over Asia in the summer of 2010 (King et al., 1992). The left and right figures represent distributions of AOT at a wavelength of 550 nm [AOT(550)] and Ångström exponent α (MYD04_L2 Collection 6), respectively, and the upper and lower images correspond to the results on July 22–24 and August 21–23, 2010, when photochemical events were detected over Osaka (refer to Section Air Pollution Events). It is usually difficult for satellites to observe the atmosphere over megacities such as Osaka because of the extremely high reflectance of artificial structures, where the space-based data are therefore not really reliable and they are often excluded from official dataset. Accordingly, products on AOT and α derived by MODIS sensor are very few just upon the Osaka site. Furthermore, unfortunately it was cloudy during the period; however, it can be seen from Figure 6 that both AOT and α over Osaka take rather high values, which suggest a hazy atmosphere with small particles. It can be said that MODIS observations indicate a photochemical smog event around Osaka in the summer of 2010. We know with certainty that much more cross-validation between the space observations and the ground measurements and algorithm improvement are necessary in order to undertake synthetic analysis of air pollutants.
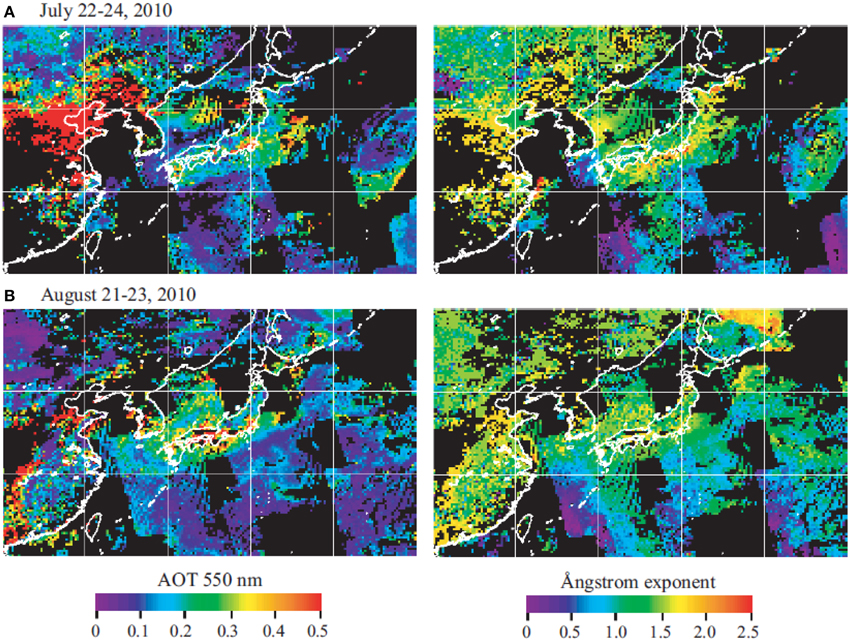
Figure 6. Aerosol characteristics (AOT and) by Aqua/MODIS sensor (MYD04_L2 Collection 6) over Asia.
Conclusions
This study investigates seasonal PM variations around Osaka, the second largest metropolitan area of Japan. The air quality appears to be worse in big cities than in remote areas. PM2.5 concentrations are high during spring and summer. The spring dust event increases the levels of pollution in the region with high concentrations of both coarse (PMC) and fine (PM2.5) particles. Increase in the sulfate aerosol concentrations produced by photochemical reactions is a likely cause of the high concentrations of PM2.5 during summer. Model simulation results show that the impact of anthropogenic PM at the observation site is significant in summer.
We focused here on air pollutants detected by ground measurements at Osaka. However, it is well known that satellites play an important role in Earth observations on a global scale. Satellite remote sensing provides us with a systematic monitoring of the Earth with different spatial, spectral, and temporal resolutions (Chuvieco, 2007). In addition, space observations are particularly useful for heavy air pollution events. While extreme concentrations of aerosols in the atmosphere can prevent aerosol monitoring with surface-level photometry, satellites can still be used in such conditions to observe the Earth's atmosphere from space. It is highly likely that large-scale air pollution will continue to occur because air pollution becomes severe due to both the increasing emissions of the anthropogenic aerosols and the complicated behavior of natural aerosols even outside of Asia. Therefore, synthetic analysis of air pollutants from ground, space, and computer is useful and necessary (Kinne et al., 2003).
This work suggests that a synthetic study of air pollutants based on a combination of observations from ground and space, and computer simulations are necessary.
Conflict of Interest Statement
The authors declare that the research was conducted in the absence of any commercial or financial relationships that could be construed as a potential conflict of interest.
Acknowledgments
The authors thank NASA for distributing the MODIS data, and the AERONET team for data processing. This work was supported in part by the Global Change Observation Mission-Climate project by JAXA (no. JX-PSPC-308878). This study was supported in part by the Global Environment Research Fund of the Ministry of Environment, Japan (S-12), and JSPS KAKENHI Grant Number 25340019.
References
Chu, D. A., Kaufman, Y. J., Zibordi, G. J. D., Chern, J. D., Mao, J., et al. (2003). Global monitoring of air pollution over land from the Earth Observing System-Terra Moderate Resolution Imaging Spectroradiometer (MODIS). J. Geophys. Res. 108, 4661. doi: 10.1029/2002JD003179
Chuvieco, E. (2007). Earth Observation of Global Change: The Role of Satellite Remote Sensing in Monitoring the Global Environment. Springer.
Dubovik, O., and King, M. D. (2000). A flexible inversion algorithm for retrieval of aerosol optical properties from Sun and sky radiance measurements. J. Geophys. Res. 105, 20673–20696. doi: 10.1029/2000JD900282
Eck, T. F., Holben, B. N., Reid, J. S., Dubovik, O., Smirnov, A., O'Neill, N. T., et al. (1999). Wavelength dependence of the optical depth of biomass burning, urban, and desert dust aerosols. J. Geophys. Res. 104, 31333–31349. doi: 10.1029/1999JD900923
Hara, Y., Uno, I., Shimizu, A., Sugimoto, N., Matsui, I., Yumimoto, K., et al. (2011). Seasonal characteristics of spherical aerosol distribution in eastern Asia: Integrated analysis using ground/space-based lidars and a chemical transport model. SOLA 7, 121–124. doi: 10.2151/sola.2011-031
Holben, B. N., Eck, T. F., Slutsker, I., Tanré, D., Buis, J. P., Setzer, A., et al. (1998). AERONET - A federated instrument network and data archive for aerosol characterization. Rem. Sens. Environ. 66, 1–16.
K-1 Model Developers (2004). K-1 Coupled GCM (MIROC) Description. K-1 Technical Report No.1, Center for Climate System Research (University of Tokyo), National Institute for Environmental Studies, and Frontier Research Center for Global Change.
Kahn, R., Anderson, J., Anderson, T. L., Bates, T., Brechtel, F., Carrico, C. M., et al. (2004). Environmental snapshots from ACE-Asia, J. Geophys. Res. 109, D19SD14, doi: 10.1029/2003JD004339.
King, M. D., Kaufman, Y. J., Menzel, W. P., and Tanré, D. (1992). Remote sensing of cloud, aerosol, and water vapor properties from the Moderate Resolution Imaging Spectrometer (MODIS). IEEE Trans. Geosci. Remote Sens. 30, 2–27. doi: 10.1109/36.124212
Kinne, S., Lohmann, U., Feichter, J., Schulz, M., Timmreck, C., Ghan, S., et al. (2003). Monthly averages of aerosol properties: A global comparison among models, satellite data and AERONET ground data. J. Geophys. Res. 108, D20:4634. doi: 10.1029/2001JD001253
Lee, K. H., and Kim, Y. J. (2010). Satellite remote sensing of Asian aerosols: a case study of clean, polluted and dust storm days. Atmos. Meas. Tech. 3, 1771–1784. doi: 10.5194/amt-3-1771-2010
Littmann, T. (1991). Dust storm frequency in Asia: Climatic control and variability. Int. J. Climatol. 11, 393–412. doi: 10.1002/joc.3370110405
Mukai, M., Nakajima, T., and Takemura, T. (2004). A study of long-term trends in mineral dust aerosol distributions in Asia using a general circulation model. J. Geophys. Res. 109:D19204. doi: 10.1029/2003JD004270
Mukai, M., Nakajima, T., and Takemura, T. (2008). A study of anthropogenic impacts of the radiation budget and the cloud field in East Asia based on model simulations with GCM. J. Geophys. Res. 113:D12211. doi: 10.1029/2007JD009325
Mukai, S., Nishina, M., Sano, I., Mukai, M., Iguchi, N., and Mizobuchi, S. (2007). Suspended Particulate Matter sampling at an urban AERONET site in Japan, part 1. Clustering analysis of Aerosols. J. Appl. Remote Sens. 1:013518. doi: 10.1117/1.2762202
Mukai, S., Sano, I., and Holben, B. N. (2005). Aerosol properties over Japan by sun/sky photometry. Water Air Soil Pollut. 5, 133–143. doi: 10.1007/s11267-005-0731-2
Mukai, S., Sano, I., Masuda, K., and Takashima, T. (1992). Atmospheric correction for ocean color remote sensing: Optical properties of aerosols derived from CZCS imagery. IEEE Trans. Geosci. Remote Sens. 30, 818–824. doi: 10.1109/36.158878
Mukai, S. (1990). Atmospheric correction of remote sensing images of the ocean based on multiple scattering calculations. IEEE Trans. Geosci. Remote Sens. 28, 696–702. doi: 10.1109/TGRS.1990.572985
Nakata, M., Sano, I., Mukai, S., and Holben, B. N. (2013). Spatial and variations of atmospheric Aerosol in Osaka. Atmosphere 4, 157–168. doi: 10.3390/atmos4020157
Nakata, M., Yokomae, T., Fujito, T., Sano, I., and Mukai, S. (2011). “Characterization of aerosols based on the simultaneous measurements,” in Proceedings of IEEE/IGARSS (Vancouver, BC), 4164–4167.
O'Neill, N. T., Eck, T. F., Smirnov, A., Holben, B. N., and Thulasiraman, S. (2003). Spectral discrimination of coarse and fine mode optical depth. J. Geophys. Res. 108:4559. doi: 10.1029/2002JD0029753
Sano, I., Mukai, S., Okada, Y., Holben, B. N., Ohta, S., and Takamura, T. (2003). Optical properties of aerosols during APEX and ACE-Asia experiments. J. Geophys. Res. 108:8649. doi: 10.1029/2002JD003263
Shimizu, A., Sugimoto, N., Matsui, I., Arao, K., Uno, U., Murayama, T., et al. (2004). Continuous observations of Asian dust and ither aerosols by polarization lidars in China and Japan during ACE-Asia. J. Geophys. Res. 109, 1–14. doi: 10.1029/2002JD003253
Smirnov, A., Holben, B. N., Eck, T. F., Dubovik, O., and Slutsker, I. (2000). Cloud-Screening and Quality control algorithms for the AERONET Database. Remote Sens. Environ. 73, 337–349. doi: 10.1016/S0034-4257(00)00109-7
Takemura, T., Egashira, M., Matsuzawa, K., Ichijo, H., O'ishi, R., and Abe-Ouchi, A. (2009). A simulation of the global distribution and radiative forcing of soil dust aerosols at the Last Glacial Maximum. Atmos. Chem. Phys. 9, 3061–3073. doi: 10.5194/acp-9-3061-2009
Takemura, T. H., Okamoto, Y., Maruyama, A., Numaguti, A., Higurashi, and Nakajima, T. (2000). Global three-dimensional simulation of aerosol optical thickness distribution of various origins. J. Geophys. Res. 105, 17853–17873. doi: 10.1029/2000JD900265
Takemura, T., Nakajima, T., Dubovik, O., Holben, B. N., and Kinne, S. (2002). Single-scattering albedo and radiative forcing of various aerosol species with a global three-dimensional model. J. Climate 15, 333–352. doi: 10.1175/1520-0442(2002)015<0333:SSAARF>2.0.CO;2
Takemura, T., Nozawa, T., Emori, S., Nakajima, T. Y., and Nakajima, T. (2005). Simulation of climate response to aerosol direct and indirect effects with aerosol transport-radiation model. J. Geophys. Res. 110:D02202. doi: 10.1029/2004JD005029
Ueda, K., Shimizu, A., Nitta, H., and Inoue, K. (2012). Long-range transported Asian Dust and emergency ambulance dispatches. Inhal. Toxicol. 24, 858–867. doi: 10.3109/08958378.2012.724729
PubMed Abstract | Full Text | CrossRef Full Text | Google Scholar
Keywords: aerosol, PM, GCM, MODIS, Asia
Citation: Nakata M, Sano I and Mukai S (2015) Air pollutants in Osaka (Japan). Front. Environ. Sci. 3:18. doi: 10.3389/fenvs.2015.00018
Received: 19 January 2015; Accepted: 25 February 2015;
Published: 18 March 2015.
Edited by:
Marco Casazza, Parthenope University of Naples, ItalyReviewed by:
Angeliki Karanasiou, Consejo Superior de Investigaciones Cientificas, SpainSaumitra Mukherjee, Jawaharlal Nehru University, India
Copyright © 2015 Nakata, Sano and Mukai. This is an open-access article distributed under the terms of the Creative Commons Attribution License (CC BY). The use, distribution or reproduction in other forums is permitted, provided the original author(s) or licensor are credited and that the original publication in this journal is cited, in accordance with accepted academic practice. No use, distribution or reproduction is permitted which does not comply with these terms.
*Correspondence: Makiko Nakata, Kinki University, 3-4-1 Kowakae, Higashi-Osaka 577-8502, JapanbmFrYXRhQHNvY2lvLmtpbmRhaS5hYy5qcA==