 Rogert Sorí
 Anita Drumond
 Raquel Nieto
- 1Grupo Científico del Centro Meteorológico, Instituto de Meteorologia, Ciego de Ávila, Cuba
- 2EPhysLab, Departamento de Física Aplicada, Facultad de Ciencias, Universidad de Vigo, Ourense, Spain
In this work we use a Lagrangian model (FLEXPART) to investigate the contribution of moisture from the Atlantic Warm Pool (AWP) to the atmospheric hydrological budget during the period from 1982 to 1999, and to identify which regions are affected by the moisture transport from this source. FLEXPART computes budgets of evaporation minus precipitation by calculating changes in the specific humidity along 10-day forward trajectories. A monthly analysis was made for May–October, the typical development period of the AWP. Climatologically, the moisture transported from the AWP to North and Central America increases from June onwards. Humidity is also transported toward western Europe from July to October, probably favored by the positioning of the North Atlantic Subtropical High and its associated flows. The largest moisture sinks associated with transport from the AWP were found from August to October, when the warm pool can extend to the north-western coast of Africa. The technique of composites was used to analyse how the interannual variability of moisture contribution from the AWP depends on changes in the pool's areal extension, and on the El Niño Southern Oscillation (ENSO). The results indicate that during episodes when the AWP is at its maximum extent, its moisture contribution increased to the Caribbean, to the region of the Inter-tropical Convergence Zone (ITCZ), and to the North Atlantic. By contrast, less moisture was transported to southeastern North America during July and August, or to central North America during September and October. The differences in moisture sink regions for extreme ENSO episodes suggest that there are favored sinks in the Caribbean and in the ITCZ region during La Niña events.
Introduction
The understanding and quantification of the link between evaporation of water in one region and precipitation in another, and of the connecting processes, is one of the main problems in hydrometeorology (Gimeno et al., 2010). However, moisture transport between different regions of the Earth is difficult to quantify because it involves all components of the hydrological cycle (Stohl and James, 2004, 2005). By considering a moisture source as an area of maximum divergence of the vertically integrated moisture flux (VIMF) (Trenberth and Guillemot, 1998), Gimeno et al. (2010) identified both the major oceanic source areas of moisture and the continental regions significantly influenced by the humidity transported from each source through a Lagrangian approach.
Applying the same methodology and focusing on tropical latitudes, Drumond et al. (2011) studied the moisture contribution of the Western Hemisphere Warm Pool (WHWP) to northern hemisphere precipitation. The WHWP is the world's second largest warm pool, and is defined by the sea surface temperature (SST) isoline of 28.5°C (Weisberg, 1996; Wang and Enfield, 2001). At various stages of development, the WHWP comprises the eastern North Pacific and eastern Pacific, the Gulf of Mexico, the Caribbean Sea, and the Western Tropical North Atlantic (TNA). The Central American land mass divides the WHWP into two oceanic regions: the eastern North Pacific Warm Pool and the Atlantic Warm Pool (AWP) (Wang et al., 2008). As the WHWP develops, higher SSTs drive a number of linked phenomena: increased temperature and moisture in the local troposphere, decreased sea level pressure (SLP), light winds from the east, and decreased vertical wind shear (Gray, 1968; Knaff, 1997).
Drumond et al. (2011) showed that during the WHWP's development, it is a source of moisture for precipitation in Central and North America, the North Atlantic, and Western Europe. However, they did not investigate contributions from the Atlantic and the Pacific subregions of the WHWP separately, and their 5-year analysis did not allow an investigation of interannual variations in moisture transport from the pool.
The AWP, as a component of the WHWP, is a large body of water warmer than 28.5°C, which may comprise the Gulf of Mexico, the Caribbean Sea, and the Western TNA (Wang and Enfield, 2001). The AWP reaches its maximum extension in the boreal summer (Wang and Enfield, 2001) and affects rainfall variability in the Western Hemisphere (Wang et al., 2006). A relationship with the tropical Atlantic SST is evident, because large (small) AWPs are associated with warm (cold) SST anomalies in the TNA. This anomalous pattern induces a low-level moisture flux convergence (divergence) and an anomalous ascending (descending) motion, enhancing (inhibiting) local precipitation. The intensification (reduction) of precipitation leads to negative (positive) “evaporation minus precipitation” (E − P) budget, and to anomalies in sea surface salinity across the pool. In this way, the atmospheric moisture transport from the Atlantic to the Pacific basin plays an important role in regulating North Atlantic salinity, and thus the strength of the thermohaline circulation (Richter and Xie, 2010).
The AWP tends to weaken the summertime North Atlantic Subtropical High (NASH), particularly at its south-western edge, which in turn weakens the easterly Caribbean Low Level Jet (CLLJ). The westward CLLJ's moisture transport has a semi-annual cycle: two maxima during the summer and winter, and two minima in the spring and fall (Wang and Lee, 2007). In addition to increasing the Caribbean precipitation (Martin and Schumacher, 2011), the weakening of the CLLJ associated with the AWP-induced changes in the upper-level winds also reduces the tropospheric vertical wind shear over the AWP region, and favors the development of hurricanes during August–October (Wang et al., 2007).
The AWP's warming on inter-annual time scales is associated with an anomalous tripolar SST pattern in the north Atlantic, and leads to more rainfall in the central and eastern United States (Liu et al., 2015). Additionally, the (E − P) anomalies in the AWP are also influenced remotely by the climatic variability modes of the El Niño-Southern Oscillation (ENSO) and of the North Atlantic Oscillation (NAO), as well as by anomalous conditions in the Tropical South Atlantic (TSA) (Liu et al., 2012; Zhang and Wang, 2012). Stephenson et al. (2014) verified some influence of the North Atlantic Ocean through the Atlantic Multi-decadal Oscillation (AMO) on Caribbean precipitation during boreal summer. Sea breezes in north-western Florida can be affected by changes in the size of the AWP: during years characterized by large AWP extensions, the NASH becomes weaker and moves further eastwards. At the same time, a large part of southeast North America including Florida is affected by relatively strong anomalous low-level northerly flow and large-scale subsidence, which suppress diurnal convection over the coast of the Florida panhandle (Misra et al., 2011).
Evidence for the importance of the AWP in modulating the climate system is also provided by studies of past and future conditions. For instance, reconstructed paleoclimatic data indicate that the persistence of the AWP during summer is responsible for increased precipitation and temperature detected in Florida during Heinrich events (Donders et al., 2011). Boer et al. (2011) suggest that the AWP may have played a key role in the glacial climate, by acting as a gatekeeper to regulate atmospheric moisture transport from the Atlantic across the Central American isthmus toward the Pacific. They also indicate that a decrease in the area of the AWP may enhance the cross-isthmus moisture transport, whereas extratropical North Atlantic cooling and a larger AWP may decrease it. Additionally, the Intergovernmental Panel on Climate Change's (IPCC) simulations of future climate suggest that atmospheric moisture will increase globally, increasing the moisture transport by 0.25 Sverdrups from the Atlantic to the Pacific (Richter and Xie, 2010).
Focusing on the Atlantic subregion of the WHWP, the aim of the present work is to analyse the role of the AWP as a source of moisture during its development, and to investigate the interannual variability of moisture transport across the region during the period 1982–1999 associated with changes in the warm pool's areal extension and with the ENSO.
Materials and Methods
Our method is based on the Lagrangian FLEXPART model developed by Stohl and James (2004, 2005) to calculate the variability of moisture along tracks of air particles and to identify regions where they gain and loss moisture. The methodology proposed here has been successfully applied to study moisture transport on the American continent in South America (Drumond et al., 2008) and Central America (Durán-Quesada et al., 2010), as well as other regions of the world (e.g., Gimeno et al., 2010).
In this approach, the atmosphere is divided into N evenly distributed “particles” or “parcels”, and their advection is described by the expression:
where x is the position of the parcel and v [x(t)] is the wind speed, interpolated in space and time, of the corresponding analysis grid. The gain (through evaporation from the environment, e) or loss (through precipitation, p) of specific humidity (q) by each parcel is calculated using the formula:
The value of mass (m) is constant for every parcel. Integrating the (e − p) values of all parcels in a vertical column of unit horizontal area over the depth of the atmosphere gives (E − P), where E represents the evaporation and P the precipitation per unit area. Regions where (E − P) < 0 indicate moisture loss, so that precipitation exceeds evaporation in those areas, and the opposite is true where (E − P) > 0. The air parcel trajectories can be integrated backwards or forwards in time.
The AWP's extent was defined for every month from 1982 to 1999 and the area was computed at a monthly scale by applying the 28.5 isotherm definition proposed by Wang and Enfield (2001, 2003) to the SST dataset.
The Lagrangian data used in this work were obtained from a FLEXPART experiment run on a global domain, in which the atmosphere was divided in 1.9 million uniformly distributed particles. The model was fed by the ERA-40 reanalysis data set (Uppala et al., 2005) available at 6 h intervals (00, 06, 12, and 18 UTC) at a resolution of 1° × 1° in 60 vertical levels, from 0.1 to 1000 hPa, with approximately 14 model levels below 1500 m, and 23 between 1500 and 5000 m. FLEXPART needs five three-dimensional fields: horizontal and vertical wind components, temperature, and specific humidity in the ECMWF vertical hybrid coordinate system. The model also needs the two-dimensional fields: surface pressure, total cloud cover, 10 m horizontal wind components, 2 m temperature and dew point temperature, large scale and convective precipitation, sensible heat flux, east/west and north/south surface stress, topography, land-sea-mask, and subgrid standard deviation of topography.
Because we want to investigate the role of the AWP as a moisture source, we analyse the forward trajectories. We tracked the movement of parcels leaving the area of the AWP for 10 days forwards in time, which is the average residence time of water vapor in the atmosphere (Numaguti, 1999). The climatology covered the months from May to October for the years 1982–1999. We used data from the Global Precipitation Climatology Project (GPCP) (Adler et al., 2003) with a horizontal resolution of 2.5°, and the NOAA Optimum Interpolation SST V2 data (Reynolds et al., 2002) at a horizontal resolution of 1°. Both monthly data sets were provided by the NOAA/OAR/ESRL PSD via their website (http://www.esrl.noaa.gov/psd/). The vertical integral (over all levels available at ECMWF) of eastward and northward water vapor flux components were also obtained from the ERA-40 data with resolution of 1°, and they were used to compute the divergence of moisture flux.
ENSO events were obtained using the Oceanic Niño Index (ONI) from the NOAA Climate Prediction Center (www.cpc.noaa.gov/products/analysis_monitoring/ensostuff/ensoyears.shtml). The ONI has become the standard that NOAA uses for identifying El Niño and La Niña events in the tropical Pacific for the Niño 3.4 region (5°N–5°S, 120°W–170°W). The index values were calculated as the 3-month running mean of Extended Reconstructed Sea Surface Temperature (ERSST) v3b SST anomalies (Smith et al., 2008) in the Niño 3.4 region, and the ONI is based on climatology for the period 1981–2010. Extreme ENSO episodes occur when the threshold of ±0.5°C for the ONI is exceeded on a minimum of five consecutive overlapping seasons. To select an ENSO episode, we considered those periods when the threshold was exceeded a minimum of five consecutive times between June in year 0 and May in year 1 (defining an ENSO cycle). Five El Niño episodes (1982/83, 1986/87, 1987/88, 1991/92, 1994/95) and six La Niña events (1984/85, 1988/89, 1995/96, 1998/99, 1999/00) were selected for analysis. Our analyses of composites refer to anomalous patterns during the development stage of an ENSO cycle, before the winter's peak.
Analysis of the composite differences was carried out using a qualitative comparison of the results. The availability of a short period of data (18 years) limits both the selection of episodes (each composite contains around five cases) and the application of any statistical evaluation. The scope of our study is therefore to provide an overview of the regional climate characteristics of the AWP and to suggest how variability of the moisture transport from this source is associated with changes in its area and with the ENSO. Nevertheless, we argue that a longer period of data would be necessary to increase the number of elements in the composites, which is crucial for a more meaningful statistical evaluation of the results.
Results and Discussion
Figure 1 shows the mean climatological fields for May of (a) (E − P) < 0 (sinks of moisture), (b) the number of months for which SST values are above 28.5°C (‘SST frequency’), (c) rainfall, and (d) VIMF and its divergence. The (E − P) results indicate the presence of moisture sinks over the Pacific coast of Central America. It is interesting to note the low contribution of transported moisture to the precipitation over North America. This pattern may be explained by the presence of high moisture flux divergence values over the Gulf of Mexico and the west coast of North America, which inhibit precipitation over the area. It is known that the Caribbean rainy season is during the months May-November, in the boreal summer (Gouirand et al., 2014). Nevertheless, it is important to take into account that precipitation in North America is derived not only from large scale transport, but also from tropical cyclones during summer (Larson et al., 2005) and from cold surges (which are particularly important for the Gulf of Mexico) (Colle and Mass, 1995). Because the methodology proposed here focuses on identifying the precipitation generated by large-scale moisture transport, the (E − P) and precipitation fields do not necessarily have to agree if the rainfall is produced through other mechanisms. The SST frequencies for May illustrate the positioning of the AWP restricted by the south of Cuba and the Central American coast. According to Mestas et al. (2005), the Intra-American Sea (IAS) may be considered a moisture source in which the moisture surplus is exported mainly to the west and north. A joint analysis of the maxima in the precipitation and in the convergence of the VIMF provides a rough estimate of the positioning of the Inter-tropical Convergence Zone (ITCZ) (Žagar et al., 2011), and (E − P) suggests some moisture contribution from the AWP toward the eastern Pacific ITCZ region.
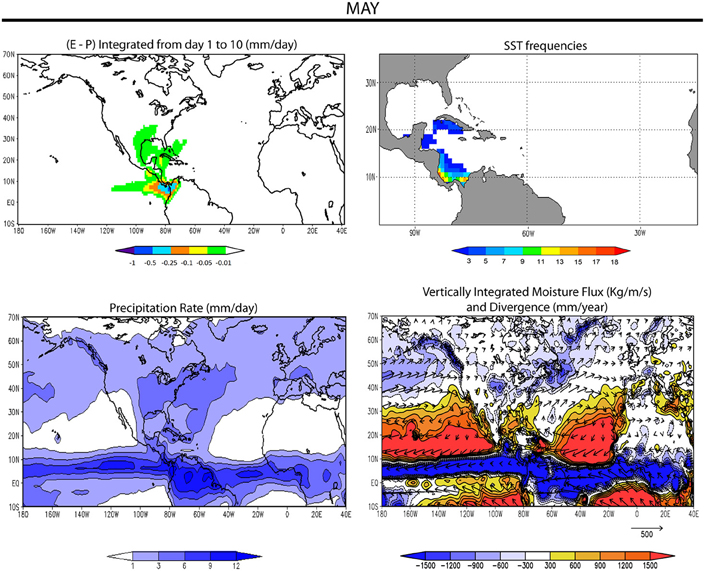
Figure 1. Top left: Mean value of the (E − P) field, forward integrated over a 10 day period from the AWP source defined for every May from 1982 to 1999. Only negative values of (E − P) are shown, in order to emphasize the sink regions. Top right: Absolute frequency of monthly SST above the threshold 28.5°C. Bottom left: Precipitation rate. Bottom left: Vertically integrated moisture flux (VIMF) and its divergence. Units of (E − P) and precipitation rate are mm d−1, units of SST frequency are number of months, vectors of moisture flux are in kg m−1 s−1, and units of contours of divergence of moisture are mm yr−1.
In June (Figure 2), the SST frequency field shows that the AWP has expanded to cover the whole Gulf of Mexico and the Caribbean Sea. The (E − P) field shows the moisture contribution toward a region covering a small area in the Pacific, as well as central-eastern North America and the Western Atlantic, agreeing qualitatively with the observed precipitation patterns. Anomalies in (E − P) are mainly balanced by the change in moisture flux divergence at time scales of a month and longer, while the contribution from transient eddies occurs at on a much shorter time scale (Wang et al., 2013). Chan et al. (2011) reported the importance of the Lesser Antilles in modulating regional atmospheric circulation, and the impact of AWP variations on the islands' climate. During June the moisture flux penetrates into south-eastern North America associated with the Great Plains Low Level Jet (GPLLJ). The GPLLJ is a mechanism which transports moisture from the IAS to the North American continent during summer, and enhances precipitation over the central United States (Ropelewski and Yarosh, 1998).
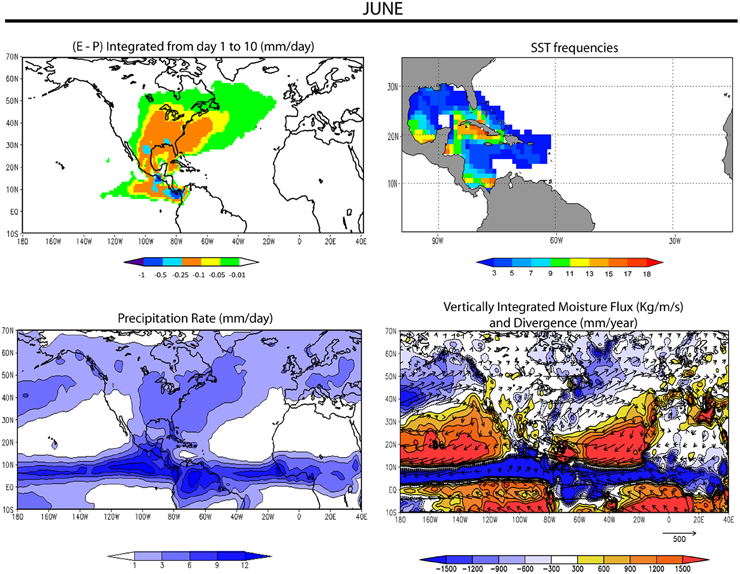
Figure 2. As Figure 1, for June.
During July (Figure 3), the region with higher SST frequencies covered the northern Gulf of Mexico and the seas around Cuba, including near La Española. In August (Figure 4) it expanded toward the Gulf of Mexico and part of the Caribbean Sea. During these months the moisture contribution to south-eastern North America increased strongly, while weakening to the sink regions over the Caribbean. In August the sinks expanded over south-eastern North America, Central America, and the Atlantic and Pacific oceans between approximately 3° and 6°N, coinciding with the region where the ITCZ develops (Žagar et al., 2011). The moisture contribution from the AWP also reached Western Europe during these months. The sink areas coincided with moisture flow convergence regions. A qualitative comparison between (E − P) and patterns of precipitation rate can be used to help to assess the results, suggesting that moisture from the AWP contributed to precipitation in these areas.
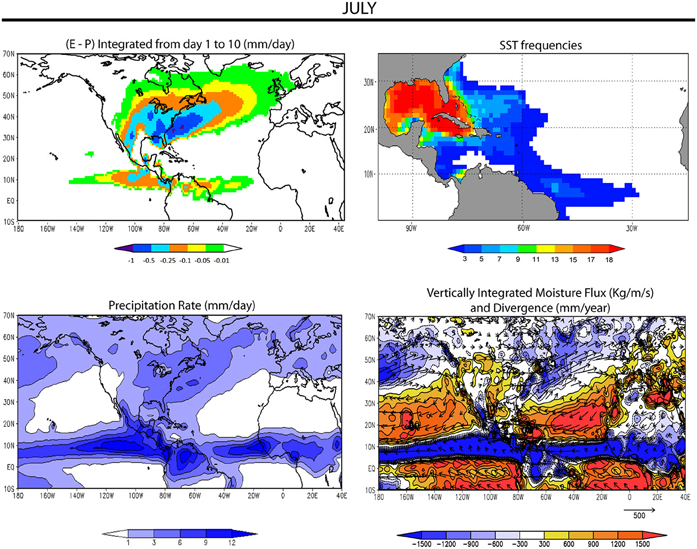
Figure 3. As Figure 1, for July.
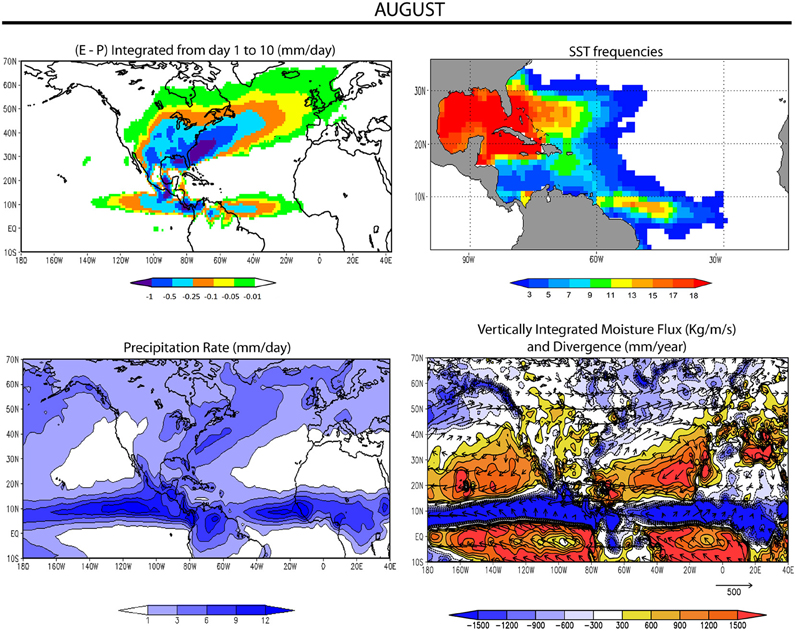
Figure 4. As Figure 1, for August.
In September (Figure 5) the AWP reached the central Atlantic, and in October (Figure 6) it reached the western coast of Africa and extended southwards. The temporal evolution of the AWP matches the previous results of Wang and Enfield (2001) and Drumond et al. (2011). In September, the moisture sink regions appear to cover a larger area than in previous months, and according to Table 1 this is also the month when the extent of the AWP reaches its maximum. In September and October the size of the moisture sinks increased over central and south-eastern North America, and over the Atlantic and Pacific ITCZ regions. A visual analysis indicates that zones of precipitation in both months increased significantly in size over these regions. Areas of moisture flux divergence weakened and were displaced eastwards over the tropical Atlantic during September, and in October they appeared over the Gulf of Mexico and the east coast of North America.
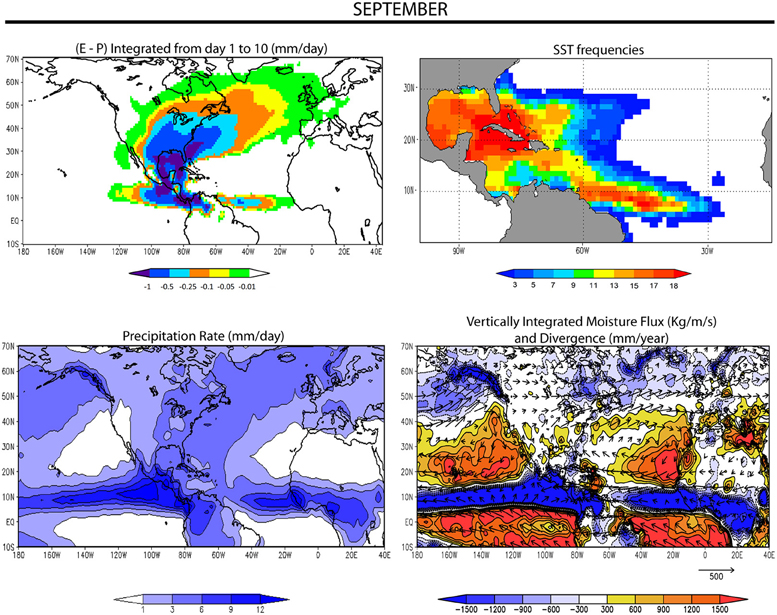
Figure 5. As Figure 1, for September.
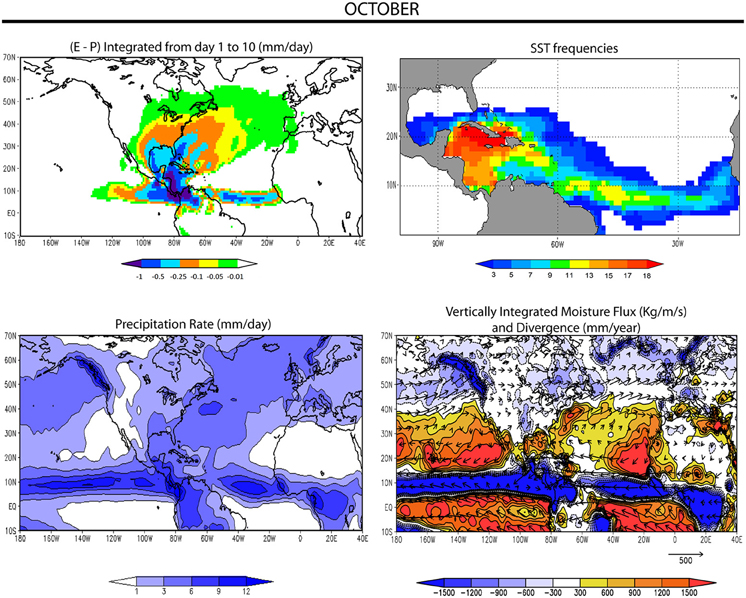
Figure 6. As Figure 1, for October.
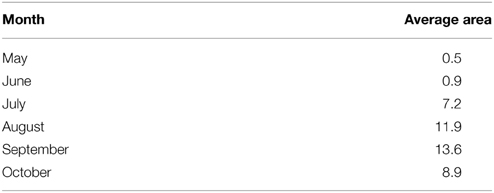
Table 1. Climatological monthly average area of AWP (× 1012 m2) for 1982–1999.
Drumond et al. (2011) used only a five year period (2000–2004) and considered the whole WHWP to explain an (E − P) pattern extending further westwards into the Pacific. Our separate analysis of the AWP shows that it provides moisture to the Pacific, Central and North America, and tropical and North Atlantic, confirming the interhemispheric influence of moisture transport from the AWP (Wang et al., 2009).
(E − P) during Times of Largest and Smallest AWP Area
Table 1 shows the values of the monthly climatological AWP area during the extended summer season. The minimum area of 0.5 × 10¹² m2 occurs in May, and it reaches its maximum in September with a value of about 13.6 × 10¹² m2. Figure 7 shows the monthly evolution of the AWP area during the period of interest, 1982–1999. The area was at a maximum during August and September 1998, with values up to 21.6 × 10¹² m2, while the minima occurred during May 1984, 1986, and 1992. It is important to note that there are some years for which the AWP area was a local maximum or minimum in almost all months. For example, in 1984, 1986 and 1992, for at least 5 of the 6 months analyzed, the area of the AWP was less than during the same month in the years before and after: in Table 2, these years are shaded gray, green and blue, respectively. By contrast, in 1987, 1995, 1997 and 1998, the AWP was larger than in the same months in the years before and after: these years are marked in Table 3. Tables 2, 3 show the five years that contain the smallest and largest AWP areas for each month respectively. The monthly differences in moisture sink patterns for the composite of the highest and lowest AWP areas (Figure 8) shows the impact of AWP extension on moisture transport. During May and June, negative values of (E − P) (blueish colors) prevailed over Central America, the Pacific ITCZ region, and southern North America, suggesting that the moisture contribution of the AWP increases when the AWP is at its largest. The moisture contribution to the climatological sinks during these periods is also enhanced during the other months, except for parts of south-eastern and central North America during July–August and September–October, respectively. The main reason is that an anomalously large (small) AWP weakens (strengthens) the southerly GPLLJ, which reduces (enhances) northward moisture transport from the Gulf of Mexico and thereby decreases (increases) summer rainfall over central North America (Wang et al., 2008). The direct relationship between larger AWPs and warmer North Atlantic temperatures from August to October described by Wang et al. (2006) is also associated with increased rainfall over the Caribbean, Mexico, eastern subtropical Atlantic, and the southeast Pacific, and decreased rainfall in northwest North America and eastern South America. In the warm season, warmer TNA conditions induce a local increase in atmospheric convection and a reduction of precipitation over western North America (Kushnir et al., 2010). From July to October there is an enhanced moisture contribution from the AWP to Western Europe during years when the AWP is larger than average.
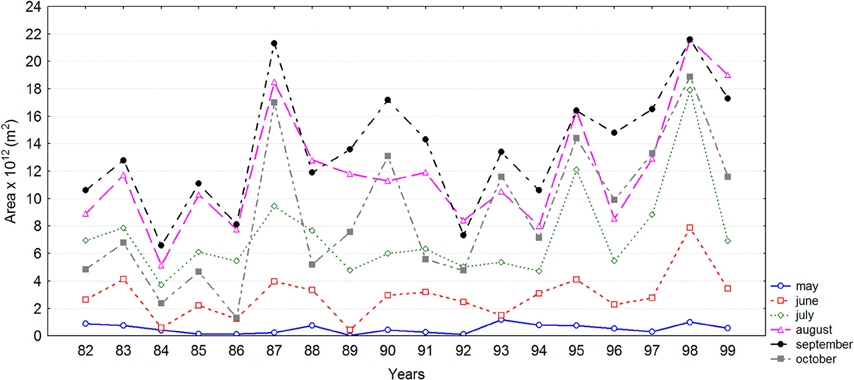
Figure 7. Annual time series of AWP area, 1982–1999.
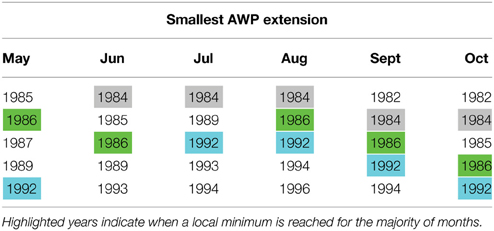
Table 2. Years of smallest AWP area for 1982–1999.
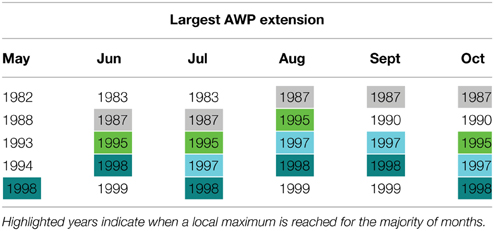
Table 3. Years of highest AWP area for 1982–1999.
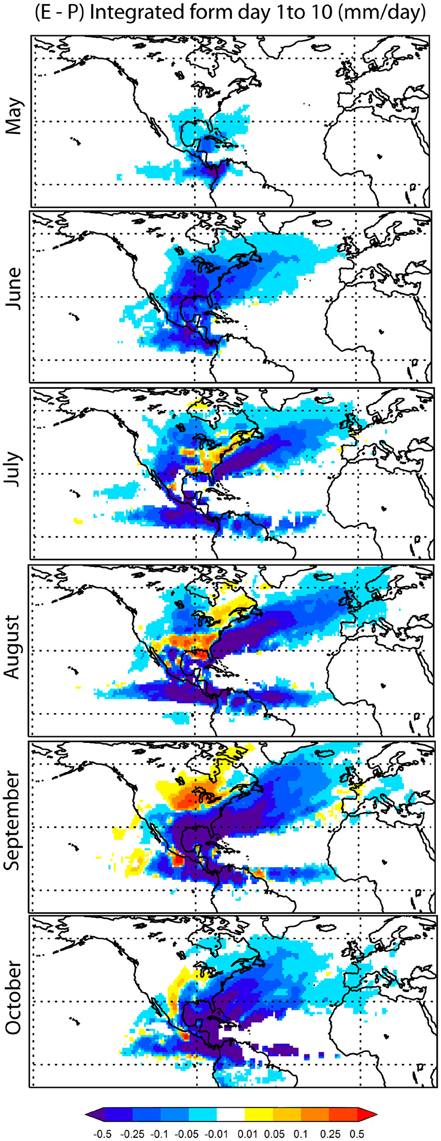
Figure 8. Monthly composite differences of moisture sinks (only E − P < 0 values) between years with the largest and smallest AWP areas during the period 1982–1999 (Tables 2, 3, respectively). Units are mm d−1.
The Monthly Influence of the Evolution of the ENSO Cycle
The ENSO is the most powerful coupled ocean-atmosphere mode on the planet (Trenberth and Caron, 2000; Trenberth and Stepaniak, 2001). It originates in the Pacific Ocean where the major environmental changes occur; however, its influence extends to the whole climatic system, with effects detected in precipitation patterns, SST, pressure, wind, and specific humidity among others (e.g., Peixoto and Oort, 1992; Giannini et al., 2001; Moron and Plaut, 2003; Wagner et al., 2005).
The direct effect of the size of the AWP's area on moisture transport was described in the previous section. In this section, we examine the effect of ENSO phase on the variability of moisture transport from the AWP. Wang et al. (2006) found that about two-thirds of the overall variability of warm pool size in the summer following a winter with a peak ENSO event appears to be unrelated to the ENSO. On the other hand, during the summer a strong (weak) easterly CLLJ is associated with warm (cold) SST anomalies in the tropical Pacific (Wang, 2007). Wang (2001) reported that ENSO can affect the TNA through the Walker and Hadley circulations, favoring the TNA warming in the subsequent spring of the El Niño year. According to the methodology explained in the Section Materials and Methods, five El Niño episodes (1982/83, 1986/87, 1987/88, 1991/92, 1994/95) and six La Niña events (1984/85, 1988/89, 1995/96, 1998/99, 1999/00) were selected during the period 1982–1999.
The variations in the AWP's moisture contribution during ENSO warm phases (El Niño) and cool phases (La Niña) were analyzed by subtracting sink patterns of composites of El Niño and La Niña episodes observed during the period of interest (Figure 9). In contrast to Wang et al. (2006), the composites in this work refer to the extended summer season preceding a mature ENSO phase, because we want to check whether the development of an extreme ENSO episode is associated with anomalies in the AWP region. Accordingly, in Figure 9 the reddish (blueish) colors indicate enhanced sinks for moisture transported from the AWP during La Niña (El Niño) events. During May and June, it seems that the moisture contribution to areas surrounding the AWP is higher during La Niña episodes. In July the bluish colors in parts of Central America, the Pacific, Atlantic, and central-eastern North America indicate enhanced moisture contribution during El Niño events. In August, September, and October the reddish colors over the Caribbean and TNA suggest that moisture sinks are intensified over these regions during la Niña events. Giannini et al. (2001) verified that Caribbean rainfall may be affected by extreme ENSO conditions, and indicated that dry conditions prevail over the Caribbean during the development stage of an El Niño episode.
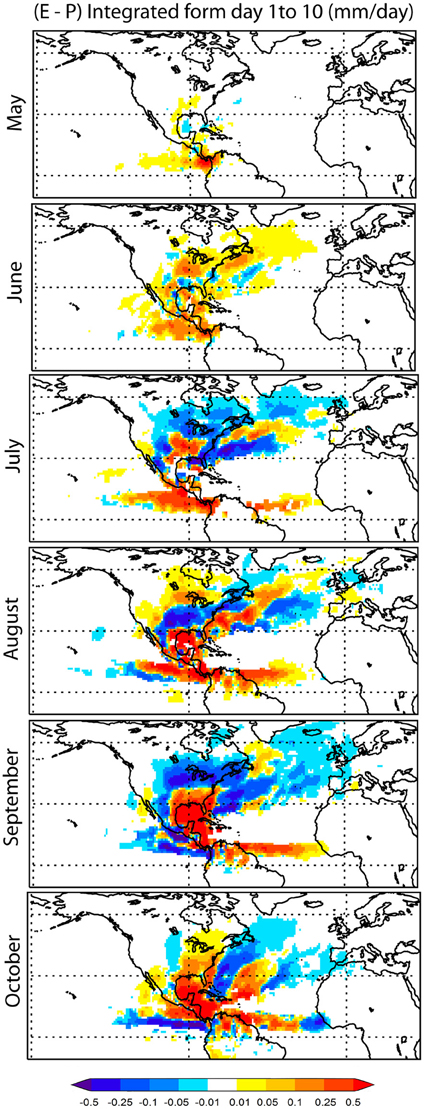
Figure 9. Monthly composite differences of moisture sinks (only E − P < 0 values) between El Niño and La Niña events for 1982–1999. Units are mm d−1.
Conclusions
The FLEXPART model allows air parcels, and the water vapor they contain, to be tracked for up to 10 days after they leave the area of the AWP. Visual analysis of (E − P) suggests that May and September are the months presenting the smallest and largest sink regions respectively, which agrees with the variations in the AWP's measured area. Higher moisture contributions to continental precipitation occur from June onwards, with sink regions mainly over Colombia, Central America, México, and the eastern United States and Canada. From July to October the sinks expand toward Western Europe, probably associated with flow conditioned by the North Atlantic Subtropical High. Although the contribution of moisture to the Pacific ITCZ region is lower than the results obtained by Drumond et al. (2011) for all WHWP extension, there is some moisture transport from the AWP toward the Pacific.
In respect of the climatological positioning of the AWP and its interannual variability, the pool is limited to the coast of Central America in May and expands toward the east and south covering the whole Caribbean in the months that follow, reaching the west coast of Africa in October. The number of months with SST above 28.5°C indicates the Gulf of Mexico and the Caribbean Sea surrounding Cuba as the most constant location of the AWP.
The composite analysis suggests that the largest warm pools found during the 18 year dataset accounted for most of the increased contribution of humidity to the climatological sinks. Differences between El Niño and La Niña suggest that during La Niña events the moisture loss increases in the Caribbean and TNA regions, particularly from August to October. It is important to stress that analysis of the composite differences was carried out using a qualitative comparison of the results. The availability of a short period of data limits both the selection of more episodes and the application of any significant statistical evaluation.
Although the present work analyzes the variations of the moisture contribution from the AWP during the development stage of the extreme ENSO episodes, a more detailed analysis on the links (including dynamical mechanisms) between ENSO and the WHWP is necessary and it will be considered in further studies. It was noted that the moisture transport within the region is not only dominated by the Atlantic component of the warm pool, but also by the Pacific one, which will be the focus of a future subsequent paper.
Conflict of Interest Statement
The authors declare that the research was conducted in the absence of any commercial or financial relationships that could be construed as a potential conflict of interest.
Acknowledgments
This work is based on the final project of the first author's Master degree. RS thanks the Spanish Agency of International Cooperation and Development (AECID) for the scholarship. The authors gratefully acknowledge the support of the Spanish Government through their funding of the TRAMO (“TRAnsport of MOisture”) project (CGL-2012-35485), which is also cofunded by FEDER (in Spanish European Regional Development Fund- ERDF).
References
Adler, R. F., Huffman, G. J., Chang, A., Ferraro, R., Xie, P., Janowiak, J., et al. (2003). The Version 2 Global Precipitation Climatology Project (GPCP) monthly precipitation analysis (1979-Present). J. Hydrometeor. 4, 1147–1167. doi: 10.1175/1525-7541(2003)004<1147:TVGPCP>2.0.CO;2
Boer, H. J., Roche, D. M., Renssen, H., and Dekker, S. C. (2011). Two-signed feedback of cross-isthmus moisture transport on glacial overturning controlled by the Atlantic warm pool. Clim. Past Discuss. 7, 3859–3893. doi: 10.5194/cpd-7-3859-2011
Chan, S. C., Misra, V., and Smith, H. (2011). A modeling study of the interaction between the Atlantic Warm Pool, the tropical Atlantic easterlies, and the Lesser Antilles. J. Geophys. Res. 116, D00Q02. doi: 10.1029/2010JD015260
Colle, B. A., and Mass, C. F. (1995). The structure and evolution of could surges east of the Rocky mountains. Mon. Wea. Rev. 123, 2577–2610.
Donders, T. H., de Boer, H. J., Finsinger, W., Grimm, E. C., Dekker, S. C., Reichart, G. J., et al. (2011). Impact of the Atlantic Warm Pool on precipitation and temperature in Florida during North Atlantic cold spells. Clim. Dyn. 36, 109–118. doi: 10.1007/s00382-009-0702-9
Drumond, A., Nieto, R., and Gimeno, L. (2011). On the contribution of the Tropical Western Hemisphere Warm Pool source of moisture to the Northern Hemisphere precipitation through a Lagrangian approach. J. Geophys. Res. 116, D00Q04. doi: 10.1029/2010JD015397
Drumond, A., Nieto, R., Gimeno, L., and Ambrizzi, T. (2008). A Lagrangian identification of major sources of moisture over central Brazil and La Plata Basin. J. Geophys. Res. 113, D14128. doi: 10.1029/2007JD009547
Durán-Quesada, A. M., Gimeno, L., Amador, J. A., and Nieto, R. (2010). Moisture sources for Central America: Identification of moisture sources using a Lagrangian analysis technique. J. Geophys. Res. 115, D05103. doi: 10.1029/2009JD012455
Giannini, A., Kushnir, Y., and Cane, M. A. (2001). Seasonality in the impact of ENSO and the North Atlantic High on Caribbean Rainfall. Phys. Chem. Earth 26, 143–147. doi: 10.1016/S1464-1909(00)00231-8
Gimeno, L., Drumond, A., Nieto, R., Trigo, R., and Stohl, A. (2010). On the origin of continental precipitation. Geophys. Res. Lett. 37, L13804. doi: 10.1029/2010GL043712
Gouirand, I., Moron, V., Hu, Z.-Z., and Jha, B. (2014). Influence of the warm pool and cold tongue El Niños on the following Caribbean rainy season rainfall. Clim. Dyn. 42, 919–929. doi: 10.1007/s00382-013-1753-5
Gray, W. M. (1968). A global view of the origin of tropical disturbances and storms. Mon. Wea. Rev. 96, 669–700.
Knaff, J. A. (1997). Implications of summertime sea level pressure anomalies in the tropical Atlantic region. J. Clim. 10, 789–804.
Kushnir, Y., Seager, R., Ting, M., Naik, N., and Nakamura, J. (2010). Mechanisms of tropical Atlantic SST influence on North American precipitation variability. J. Clim. 23, 5610–5628. doi: 10.1175/2010JCLI3172.1
Larson, J., Zhou, Y., and Higgins, R. W. (2005). Characteristics of landfalling tropical cyclones in the United States and Mexico: climatology and interannual variability. J. Clim. 18, 1247–1262. doi: 10.1175/JCLI3317.1
Liu, H., Wang, C., Lee, S.-K., and Enfield, D. (2012). Atlantic warm-pool variability in the IPCC AR4 CGCM simulations. J. Clim. 25, 5612–5628. doi: 10.1175/JCLI-D-11-00376.1
Liu, H., Wang, C., Lee, S.-K., and Enfield, D. (2015). Inhomogeneous influence of the Atlantic Warm Pool on United States precipitation. Atmos. Sci. Lett. 16, 63–69. doi: 10.1002/asl2.521
Martin, R. E., and Schumacher, C. (2011). The Caribbean low-level jet and its relationship with precipitation in IPCC AR4 models. J. Clim. 24, 5935–5950. doi: 10.1175/JCLI-D-11-00134.1
Mestas, N. A. M., Zhang, C., and Enfield, D. B. (2005). Uncertainties in estimating moisture fluxes over the Intra-Americas Sea. J. Hydrometeorol. 6, 696–709. doi: 10.1175/JHM442.1
Misra, V., Moeller, L., Stefanova, L., Chan, S., O'Brien, J. J., Smith, T. J. III, et al. (2011). The influence of the Atlantic warm pool on the Florida panhandle sea breeze. J. Geophys. Res. 116, D00Q06. doi: 10.1029/2010JD015367
Moron, V., and Plaut, G. (2003). The impact of El Niño-southern oscillation upon weather regimes over Europe and the North Atlantic during boreal winter. Int. J. Climatol. 25, 363–379. doi: 10.1002/joc.890
Numaguti, A. (1999). Origin and recycling processes of precipitating water over the Eurasian continent: Experiments using an atmospheric general circulation model. J. Geophys. Res. 104, 1957–1972. doi: 10.1029/1998JD200026
Peixoto, J. P., and Oort, A. H. (1992). Physics of Climate. New York, NY: Springer–Verlag New York Press.
Reynolds, R. W., Rayner, N. A., Smith, T. M., Stokes, D. C., and Wang, W. (2002). An improved in situ and satellite SST analysis for climate. J. Clim. 15, 1609–1625. doi: 10.1175/1520-0442(2002)015<1609:AIISAS>2.0.CO;2
Richter, I., and Xie, S.-P. (2010). Moisture transport from the Atlantic to the Pacific basin and its response to North Atlantic cooling and global warming. Clim. Dyn. 35, 551–566. doi: 10.1007/s00382-009-0708-3
Ropelewski, C. F., and Yarosh, E. S. (1998). The observed mean annual cycle of moisture budgets over the central United States (1973–1992). J. Clim. 11, 2180–2190.
Smith, T. M., Reynolds, R. W., Peterson, T. C., and Lawrimore, J. (2008). Improvements to NOAA's historical merged land-ocean surface temperature analysis (1880–2006). J. Clim. 21, 2283–2296. doi: 10.1175/2007JCLI2100.1
Stephenson, T. S., Vincent, L. A., Allen, T., Van Meerbeeck, C. J., McLean, N., Peterson, T. C., et al. (2014). Changes in extreme temperature and precipitation in the Caribbean region, 1961–2010. Int. J. Climatol. 34, 2957–2971. doi: 10.1002/joc.3889
Stohl, A., and James, P. (2004). A Lagrangian analysis of the atmospheric branch of the global water cycle. Part 1: Method description, validation, and demonstration for the August 2002 flooding in central Europe. J. Hydrometeorol. 5, 565–678. doi: 10.1175/1525-7541(2004)005<0656:ALAOTA>2.0.CO;2
Stohl, A., and James, P. (2005). A Lagrangian analysis of the atmospheric branch of the global water cycle. Part 2: Earth's river catchments, ocean basins, and moisture transports between them. J. Hydrometeorol. 6, 961–984. doi: 10.1175/JHM470.1
Trenberth, K. E., and Caron, J. M. (2000). The Southern oscillation revisited: sea level pressures, surface temperatures and precipitation. J. Clim. 13, 4358–4365.
Trenberth, K. E., and Guillemot, C. J. (1998). Evaluation of the atmospheric moisture and hydrological cycle in the NCEP/NCAR reanalysis. Clim. Dyn. 14, 213–231. doi: 10.1007/s003820050219
Trenberth, K. E., and Stepaniak, D. P. (2001). Indices of El Nino evolution. J. Clim. 14, 1697–1701. doi: 10.1175/1520-0442(2001)014<1697:LIOENO>2.0.CO;2
Uppala, S. M., Kallberg, P. W., Simmons, A. J., Andrae, U., da Costa Bechtold, V., Fiorino, M., et al. (2005). The ERA-40 re-analysis. Q. J. R. Meteorol. Soc. 131, 2961–3012. doi: 10.1256/qj.04.176
Wagner, T., Beirle, M., Grzegorski, M., Sanghavi, S., and Platt, U. (2005). El Niño induced anomalies in global data sets of total column precipitable water and cloud cover derived from GOME on ERS-2. J. Geophys. Res. 110:D15104. doi: 10.1029/2005jd005972
Wang, C. (2001). Atlantic climate variability and its associated atmospheric circulation cells. J. Clim. 15, 1516–1536. doi: 10.1175/1520-0442(2002)015<1516:ACVAIA>2.0.CO;2
Wang, C. (2007). Variability of the Caribbean low-level jet and its relations to climate. Clim. Dyn. 29, 411–422. doi: 10.1007/s00382-007-0243-z
Wang, C., and Enfield, D. B. (2001). The tropical hemisphere warm pool. Geophys. Res. Lett. 28, 1635–1638. doi: 10.1029/2000GL011763
Wang, C., and Enfield, D. B. (2003). A further study of the tropical Western Hemisphere Warm Pool. J. Climate, 16, 1476–1493. doi: 10.1175/1520-0442-16.10.1476
Wang, C., Enfield, D. B., Lee, S. K., and Landsea, W. (2006). Influences of the Atlantic warm pool on Western summer rainfall and Atlantic Hurricanes. J. Clim. 19, 3011–3028. doi: 10.1175/JCLI3770.1
Wang, C., and Lee, S.-K. (2007). Atlantic warm pool, Caribbean low-level jet, and their potential impact on Atlantic hurricanes. Geophys. Res. Lett. 34, L02703. doi: 10.1029/2006GL028579
Wang, C., Lee, S.-K., and Enfield, D. B. (2007). Impact of the Atlantic Warm Pool on the summer climate of the Western Hemisphere. J. Clim. 21, 5021–5040. doi: 10.1175/JCLI4304.1
Wang, C., Lee, S.-K., and Enfield, D. B. (2008). Climate response to anomalously large and small Atlantic warm pools during the summer. J. Clim. 21, 2437–2450. doi: 10.1175/2007JCLI2029.1
Wang, C., Lee, S.-K., and Mechoso, C. R. (2009). Interhemispheric influence of the Atlantic Warm Pool on the Southeastern Pacific. J. Clim. 23, 404–416. doi: 10.1175/2009JCLI3127.1
Wang, C., Zhang, L., and Lee, S.-K. (2013). Response of freshwater flux and sea surface salinity to variability of the Atlantic warm pool. J. Clim. 26, 1249–1267. doi: 10.1175/JCLI-D-12-00284.1
Weisberg, R. H. (1996). “On the evolution of SST over the PACS region,” in American Meteorological Society, 76th Annual Meeting (Atlanta, GA).
Žagar, N., Skok, G., and Tribbia, J. (2011). Climatology of the ITCZ derived from ERA Interim reanalyses. J. Geophys. Res. 116, D15103. doi: 10.1029/2011JD015695
Keywords: Atlantic Warm Pool, transport of moisture, Lagrangian analysis
Citation: Sorí R, Drumond A and Nieto R (2015) Moisture contribution of the Atlantic Warm Pool to precipitation: a Lagrangian analysis. Front. Environ. Sci. 3:22. doi: 10.3389/fenvs.2015.00022
Received: 20 September 2014; Accepted: 06 March 2015;
Published: 31 March 2015.
Edited by:
Silvina A. Solman, Centro de Investigaciones del Mar y la Atmósfera, ArgentinaReviewed by:
Alexandre M. Ramos, University of Lisbon, PortugalJuan José Taboada, MeteoGalicia, Spain
Copyright © 2015 Sorí, Drumond and Nieto. This is an open-access article distributed under the terms of the Creative Commons Attribution License (CC BY). The use, distribution or reproduction in other forums is permitted, provided the original author(s) or licensor are credited and that the original publication in this journal is cited, in accordance with accepted academic practice. No use, distribution or reproduction is permitted which does not comply with these terms.
*Correspondence: Anita Drumond, EPhysLab, Departamento de Física Aplicada, Facultad de Ciencias, Universidad de Vigo, Campus As Lagoas, S/N, 32004 Ourense, SpainYW5pdGFkcnVAdXZpZ28uZXM=