 Luca Lelli
 Mark Weber
 John P. Burrows
- Department of Physics, Institute of Environmental Physics and Remote Sensing, University of Bremen, Bremen, Germany
This paper reports on the evaluation of long-term cloud products as retrieved from measurements of the SCanning Imaging Absorption spectroMeter for Atmospheric CHartographY (SCIAMACHY) instrument with the DLR/ESA processor in its version 5.02 and the operational implementation of the Semi-Analytical CloUd Retrieval Algorithm SACURA. The comparison is performed against spaceborne and ground-based cloud data. The satellite records are the SCIAMACHY/SACURA in its scientific implementation and the Global retrieval of ATSR cloud parameters and evaluation (GRAPE) data set, in its version 3.2, generated for the nadir view of the Advanced Along-Track Scanning Radiometer (AATSR) instrument onboard ENVISAT. Ground-based data are derived from profiles of micro-pulse lidars, continuously operated at three Atmospheric Radiation Measurement (ARM) research facilities. They are, namely, North Slope Alaska, Southern Great Plains and Tropical Western Pacific-Nauru, located in three different latitude belts. It has been found that SCIAMACHY cloud top heights, inferred in the visible-near infrared, have a seasonal dependent overestimation in range 0.6–1.0 km when compared to the thermal infrared-derived AATSR cloud top heights. The comparison with the in-situ cloud retrievals reveals that SCIAMACHY cloud altitudes are more accurate for local cloud cover values > 0.6.
1. Introduction
The SCIAMACHY sensor is a passive grating spectrometer with moderate imaging capabilities. SCIAMACHY (Burrows et al., 1995; Bovensmann et al., 1999) was originally proposed in 1988 and descoped in 1995 to become the Global Ozone Monitoring Experiment (GOME) aboard European Remote Satellite 2 (ERS-2) (Burrows et al., 1999). Subsequently, SCIAMACHY was embarked as payload of ENVISAT into a sun-synchronized orbit of ≈ 800 km above the Earth's surface. It delivered continuous measurements of backscattered solar light in a spectral range from 240 to 1750 nm, with selected windows between 1900 and 2400 nm. It operated between March 2002 throughout April 2012, when contact to ENVISAT was lost.
Specifically, SCIAMACHY aims at the evaluation of tropospheric and stratospheric trace gases (e.g., O3, NO2, H2O, CO2, CH4, BrO, HCHO, OClO among others). However, the accuracy of trace gas retrievals might worsen if clouds appear in the field of view of the instrument, because clouds effectually shield gas columns below them as function of properties such as cloud optical thickness, cloud cover and cloud top height. The latter quantity is especially important due to the assumption, in most algorithms, of a ghost gas column below the scattering layer, requiring to resort on a climatological columnar value for the calculation of spatial and temporal means of the species under consideration.
Therefore, it is crucial to assess the accuracy of SCIAMACHY cloud products by intercomparison with cloud properties derived from independent measurements. In particular, cloud altitude and optical thickness for SCIAMACHY and GOME are derived with the Semi-Analytical CloUd Retrieval Algorithm (SACURA) (Kokhanovsky and Rozanov, 2004; Rozanov and Kokhanovsky, 2004; Lelli et al., 2012), while the portion of a satellite ground pixel occupied by a cloud (termed cloud fraction or cloud cover) is calculated with the Optical Cloud Recognition Algorithm OCRA (Loyola and Ruppert, 1998; Loyola, 2004; Lutz et al., 2016).
Other studies already focused on validation and intercomparison of the SACURA cloud products derived from measurements of the O2 A-band by GOME and SCIAMACHY. For instance, Kokhanovsky et al. (2006b,c) found a general overestimation of GOME cloud altitudes (+1 km on average) when comparing them with cloud properties derived from the Along-Track Scanning Radiometer (ATSR) aboard ERS-2 and an airborne spectrograph. To similar findings came Rozanov et al. (2006), while extending the total amount of analyzed GOME ground scenes (931 in total). More recently, Lelli et al. (2012) analyzed GOME-derived cloud top heights and co-located them with ground-based measurements, confirming previous results. As for SCIAMACHY, earliest validation was carried out with a ground-based cloud profiling radar located at the site of Cabauw (Netherlands) showing a qualitative agreement between the two products (Kokhanovsky et al., 2004). Subsequently, Kokhanovsky et al. (2007b) anaylized cloud top height (CTH) and optical thickness (COT) from SCIAMACHY 5.01 L1b radiances and validated them against CTH derived from the infrared channels of the Moderate Resolution Imaging Spectroradiometer MODIS and COT from the 443 nm channel of the MEdium Resolution Imaging Spectrometer MERIS, inferred from two different algorithms, namely SACURA and the operational algorithm developed at the Free University of Berlin (FUB) (Fischer et al., 2011). A mean overestimation for low clouds (mean altitude of 3.3 km) of +0.54 km in CTH against MODIS was found. SCIAMACHY COT has been found to be underestimated by 19% against MODIS COT and by 3% against MERIS/SACURA and 11% against MERIS/FUB.
Recently, Wang and Stammes (2014) evaluated the same ESA 5.02 SCIAMACHY cloud record against measurements of Cloudnet sites (Illingworth et al., 2007) and the FRESCO cloud product (Wang et al., 2008). They found that the ESA 5.02 cloud height record has a positive bias of +0.6 km as compared to FRESCO, being negatively correlated with the optical thickness of clouds. Moreover, the comparison with the ground-based data showed that the ESA 5.02 effectively retrieves cloud heights closer to their physical top, as seen by the in situ instrumentation. However, in their analysis neither the quality flagging provided by SACURA was accounted for nor a long-term comparison was carried out with independent spaceborne retrievals derived from other spectral channels, such the ones AATSR is equipped with. Therefore, in this study it has been attempted to comprehensively extend the approaches used in the existing literature in both temporal and spatial coverage.
The paper is structured as follows: first, the SACURA algorithm is briefly introduced (Section 2). Then, in Section 3, the data sets used for this work are presented. The validation methodology for both ground-based and satellite-based data is explained in Section 4. Evaluation of the results is given in the last section (Section 5) together with conclusions and recommendations for potential data users.
2. The SACURA Algorithm
SACURA aims at the retrieval of macrophysical (top and bottom height) and microphysical (optical thickness) properties of tropospheric clouds. The algorithm part devoted to the retrieval of macrophysical cloud properties is based on the analysis of changes of atmospheric oxygen absorption inside and around the A-band centered at 761 nm, in the visible-near infrared (Vis-NIR) part of the electromagnetic spectrum. The physical principle is that a cloud in this wavelength range is a highly reflective layer, to a large extent preventing the absorption of photons by the oxygen column below it. Therefore, the depth of the absorption band at 761 nm, relative to the continuum at 758 nm, is primarily a function of the altitude of the cloud. This oxygen sensitivity to cloud height, along with its constant vertical abundance all through the troposphere, can serve as a basis for the design of retrieval algorithms. This approach was firstly proposed by Saiedy et al. (1965, 1967), who also noticed that the assumption of a cloud as a perfect Lambertian reflector with zero transmittance leads to lower values of cloud heights. When light scattering inside and below the cloud are taken into account in the forward modeling, the geometrical thickness (CGT) of a cloud can also be retrieved, being beneficial for the accuracy of cloud top height (Fischer and Grassl, 1991; Kuji and Nakajima, 2002; Rozanov and Kokhanovsky, 2006; Ferlay et al., 2010; Schuessler et al., 2013).
2.1. The Atmospheric Forward Model
The features of the SACURA algorithm can be summarized as follows: the forward problem (Kokhanovsky and Rozanov, 2004) is solved modeling clouds as homogeneous plane-parallel slabs, consisting of spherical poly-dispersed water droplets (Deirmendjian, 1969) and holding the liquid water content (LWC) constant throughout the cloud. In reality, a constant LWC profile shape is not representative of a typical inhomogeneous cloud (Wood and Hartmann, 2006). Rozanov and Kokhanovsky (2004) have provided an error estimate if a constant LWC profile is assumed in the forward model. The introduced error in CTH is proportional to CGT and can amount up to 600–800 m. In general, the reasons for this assumption have been twofold. First, LWC is function of droplet radius and optical thickness. While the latter is retrieved from a visible channel, the former can be determined only from a channel in a water absorption wavelength window. This technique was not devised using a SCIAMACHY channel in the shortwave infrared. Similarly, to the best of our knowledge, an accurate a-priori LWC (or any climatology of) profile was not available at the time of algorithm design and cloud record generation. Second, the cloud parameters are derived upon normalization of the reflectance in the O2 A-band to the wavelength in the continuum at 758 nm. Since the solution of the radiative transfer equation is mainly dependent on the atmospheric single scattering albedo ω0, it is reasonable to assume that ω0 is dominated by the in-band absorption of oxygen as compared to the scattering contribution of cloud droplets. Thus, the depth of the O2 A-band is mainly driven by the number density and the extinction cross-sections of oxygen molecules, which in turn are height (i.e., pressure and temperature) dependent, exponentially increasing toward the ground.
The Top-Of-Atmosphere (TOA) reflectance is parameterized as the sum of reflected light emerging from a three-layered atmosphere: (1) above the cloud, where also aerosol and gas absorption and scattering are calculated in the single scattering approximation; (2) below the cloud, where surface-atmosphere interactions are taken into account only for the diffuse part of the light field (no direct solar illumination in considered), with aerosol and gas absorption and scattering included; (3) inside the cloud, where the oxygen absorption is considered calculating the weighted atmospheric (gaseous) single scattering albedo ω0. We stress that in a plane-parallel atmosphere the total radiation field can be defined as the sum of the direct solar beam and the diffuse radiation. In the presence of a scattering layer of optical depth large enough (as is the case of terrestrial water clouds), the contribution of multiple scattering to the transfer of radiation below a cloud outnumbers the contribution of single scattering of the direct beam. The attenuation of the monotonically decreasing diffusive component of the light field between the surface and the cloud bottom is described by virtue of the cloud transmittance introduced in Lelli et al. (2012, Equations 3–6, p. 1554).
Another factor influencing the accuracy of ω0 and the quantification of in-cloud absorption is the presence of entrained hydrophobic aerosol particles, that are externally mixed with water droplets. They not only modulate the spectral TOA reflectance in the shortwave spectral window and the optical properties of the cloud, but also change the mean free photon path length, modifying the depth of O2-absorbing wavelengths. Alternative analytical theories of radiative transfer in turbid media have been proposed to account for additional aerosol absorption (Melnikova and Vasilyev, 2005, and references therein), exploiting the multi-angle viewing instrument POLDER (Polarization and Directionality of the Earth's Reflectances) on the PARASOL (Polarization and Anisotropy of Reflectances for Atmospheric Sciences coupled with Observations from a Lidar) platform.
The current implementation of SACURA is built upon parameterizations that model clouds devoid of aerosol particles. There is a theoretical and a practical motivation. From the theoretical point of view, it has been demonstrated that the strongest contribution to the measured TOA reflectance, in terms of average photon scattering events, invariantly comes from the uppermost layers of a cloud and, specifically, not deeper than an optical depth of 0.75–1.00 from the cloud top (Rozanov and Kokhanovsky, 2005, Figures 3–5). With values of atmospheric volume scattering coefficient in range 8–45 km−1 and cloud geometrical thickness of 1 km (Melnikova and Vasilyev, 2005, pp. 253–255), the light penetration depth corresponds to 20–125 m. Unless for specific regions (Alfaro-Contreras et al., 2014), aerosol particles are customarily entrained from the cloud bottom (Rosenfeld et al., 2008; Li et al., 2011) and the sensitivity to their distribution decreases as function of cloud vertical extent. Hence, their additional absorption can not be precisely quantified, if prior information on the aerosol distribution and ω0 are not available beforehand. This leads to the practical motivation that a-priori are needed, especially for SACURA, that was implemented as operational algorithm aiming at the generation of global long-term cloud record from measurements in nadir geometry only. As such, the major factors affecting the accuracy of the retrieved cloud optical parameters are: (1) surface albedo, as function of which COT errors can total up to ±20% for various viewing geometries (Lelli et al., 2012, Figure 2); (2) radiometric calibration and stability, since an error of 2% in TOA radiance at non-absorbing wavelengths causes a COT uncertainty of 12% (Lelli et al., 2014, Figure 15); (3) the cloud fields' bumpiness, that induces a systematic COT underestimation by an average factor of 20%, if clouds are assumed as plane-parallel scattering layers (Varnai and Marshak, 2007).
Given the uncertainty factors listed above, one would expect that any missing information about in-cloud aerosol absorption translates into a COT underestimation (Li et al., 2014). However, SACURA has been applied to MODIS measurements, showing excellent correlation (R2 = 0.99) against MODIS-derived COT (Collection 6). The found average bias amounts to 2.6 (+16.3%) at 0.86 μm (Nauss et al., 2005). Similarly, when SACURA is applied to measurements from the same sensor (i.e., MODIS), the average COT bias against independent algorithms amounts to 0.45 (+3.2%). The bias turns negative on average (−0.95, −7.6%) when using measurements from a different platform (i.e., MSG-SEVIRI), pointing to different calibrations across platforms instead (Kühnlein et al., 2013).
2.2. Inversion of the Measurements
The solution of the inverse problem in SACURA (Rozanov and Kokhanovsky, 2004) relies upon the fact that the cloud reflection function is, to a first approximation, almost linear as function of height. Given the cloud optical thickness value, calculated at a single wavelength (758 nm) outside the O2 A-band, the minimal difference between the forward simulated spectrum and the actual measurement is iteratively looked for inside the A-band. At a nominal resolution of SCIAMACHY, 70 spectral points are used in the wavelength range 758–772 nm and both cloud top and bottom altitude are retrieved. Depending on the success of the concurrent fit of top and bottom height (CBH), the algorithm provides a quality flag classification (see Table 1). Accounting for the quality flag scheme allows the extraction from the record of realistic cloud scenarios. To this end, it has been advised (Lelli et al., 2012, Section 4.1, p. 1561) the aggregation of fully converged retrievals (flag 5) together with retrievals converged for CTH only (flag 2) and with those flagged 3, given a CTH < 5 km, if multi-layer clouds are to be discarded. Pixels labeled with flag 2 are to be considered only when investigating the bottom altitude of clouds, while the remaining retrievals, labeled 0 (no retrieval) and 4 (no convergence), must be dropped. It must be stressed that retrievals flagged 3 reflect the tendency of the algorithm to find any pair {CTH, CGT} such that the effect of in-cloud and above-cloud absorptances together will reproduce the actual TOA measurement. In fact, an increase in CGT denotes more in-cloud absorption either for a single-layered cloud or a multi-layered cloud system and the atmosphere located in between. This will be reflected in a deepened O2 A-band. However, this situation will also concurrently increase linearly CTH (see Rozanov et al., 2004, Figures 2, 4 and Lelli et al., 2012, Figure 4), therefore shallowing the O2 A-band by reducing the above-cloud absorption. In SACURA, the CGT is constrained to an upper limit of 11 km.

Table 1. SACURA quality flags.
Additionally, due to the SCIAMACHY spectral coverage of the shortwave infrared, SACURA can also differentially exploit the absorption features of water and ice and retrieve the effective radius of cloud droplets (Kokhanovsky et al., 2003) as well as the thermodynamic phase from measurements at 1.55 and 1.67 μm (Kokhanovsky et al., 2006a,c). However, in the present paper, the focus is only on cloud products derived from Vis-NIR channels.
2.3. Cloud Fraction
Cloud fraction is retrieved using the broadband Polarization Measurement Device (PMD) channels in three different spectral bands (red, green and blue - RGB). One advantage of using PMD measurements is their finer spatial resolution, under the assumption that clouds in the visible range of the spectrum are white objects and their reflection is wavelength independent. At the contrary, the surface is not spectrally neutral, hence the discrimination of the signal from a cloud and a cloud-free pixel becomes feasible, where each PMD delivers the intensity of light in one dedicated RGB band. A composite of the three bands is projected into the color space and the white point is defined as being a fully cloudy pixel. Specifically, the normalized PMD reflectances RPMDi in red and green channels (r, g) are calculated with
where μ, μ0 are the cosines of the solar and viewing angles, E0 the solar irradiance, n is the number of available PMD channels. The discrimination between cloudy and cloud-free pixels results with a set of thresholds, being the lowest one for cloud-free and the highest one for cloudy scenes. Lower thresholds are calculated for season and geo-location (x, y) with a monthly time sampling and the following inequality
where is the defined white point in the color space. Eventually, the cloud fraction cf is derived from a linear interpolation between the lowest (darkest) and the highest (brightest) point in the color space with
In Equation 3, the factors Oi, Si are empirical weighting coefficients, derived by histogram analysis of the measurements. The offset coefficients Oi determine whether the PMD pixels are really cloud free, whereas the scaling coefficients Si control the selection of those pixels representing a fully cloudy pixel. The former correct PMD signals for misinterpretation of scenes with low cloud fraction and mitigate influence of surface reflection, while the latter ameliorate the retrieval of cloud fraction for scenes where macro- (viewing geometry) and micro-physical (effective droplet radius and cloud optical thickness) effects come into play. The cloud fraction is set equal to 0, if the xi are negative. This technique is termed the Optical Cloud Recognition Algorithm (OCRA, Loyola and Ruppert, 1998; Loyola, 2004). A comprehensive description of the ESA 5.02 OCRA and SACURA implementation can be found in Lichtenberg (2011), while the newest OCRA update, as applied to GOME-2 radiances and ameliorated for the upcoming launch of Sentinel-5 precursor, is described by Lutz et al. (2016).
3. Data
3.1. SCIAMACHY: The ESA/DLR and IUP Data Sets
The data sets used in this study are the operational cloud record disseminated by ESA, in its offline version 5.02, inferred from calibrated and geolocated SCIAMACHY Level 1b radiances with consolidation degree W of the Level 0-1 processor in its version 7.04. The cloud records from IUP Bremen, at the time of processing and evaluation, have been derived from consolidated Level 1b U7.03 spectra and spans the period August 2002 throughout June 2010. Both cloud records are generated with the SACURA algorithm. Due to the in-orbit commissioning phase period of approximately 5 months, the data sets have been compared from January the 1st, 2003 onward. Both data sets are available on a orbit basis (14 orbits a day) at the nominal footprint size of SCIAMACHY (i.e., 60 × 40 km2) and cover the full globe (i.e., ± 90 ° latitude).
It must be stressed that, for the present study, the ESA 5.02 and the IUP data sets differ in the implementation of the OCRA cloud fraction and precisely in the choice of the scaling and offset factors Oi, Si of Equation 3. These factors result from the histogram analysis of 14 days, distributed throughout the year, thought to be representative of all atmospheric conditions and upon verification of the cloud fraction values against independent data sets. Hence, different values between OCRA-IUP and OCRA-ESA are the result of different implementation strategies rather than distinct steps in the evolution of the algorithm. First, since the OCRA approach relies on the beforehand generation of a multi-year composite of cloud-free reflectances, at ESA and IUP the time spans 2003–2007 (Lichtenberg, 2011) and 2003–2008 were respectively used. Additionally, the in-house verification of OCRA-IUP was conducted against sub-pixel informations provided by colocated MERIS reflectances (R). By spectral thresholding at wavelength 410 nm, MERIS pixels have been termed cloud-free if R < 0.2, cloudy otherwise (Kokhanovsky et al., 2009) and compared with SCIAMACHY cloud fractions. OCRA-ESA has been verified against the FRESCO cloud fraction (Wang et al., 2008) instead. The implications of the two different implementations are provided later in Section 5.1.
3.2. AATSR: The GRAPE Data Set
The Global Retrieval of ATSR Cloud Parameters and Evaluation (GRAPE version 3.2, evaluated by Sayer et al., 2011) dataset is generated with the Oxford-Rutherford Appleton Laboratory (RAL) Aerosol and Clouds (ORAC, Poulsen et al., 2011) algorithm and provides Level-2 retrievals of cloud and aerosol properties from measurements of the Along-Track Scanning Radiometer (ATSR) family. Recently, GRAPE Level 3 aggregated output has been intercompared with cloud products derived from other spaceborne data in the framework of the Global Energy and Water Cycle Experiment (GEWEX) assessment (Stubenrauch et al., 2013). The dataset coverage spans June 1995 to June 2003 for ATSR-2 aboard ERS-2 and from July 2002 to December 2009 for the successor Advanced ATSR (AATSR). Specifically for this work, AATSR is a dual-view sounder onboard ENVISAT, being a straightforward choice for comparison with SCIAMACHY because no spatial and temporal lag between the two instruments is to be expected, when looking in nadir geometry. However, AATSR has a limited across-nadir swath (≈ 500 km wide), which reduces the number of co-registered pixels within the SCIAMACHY swath (≈ 1000 km) and results in a decreased spatial coverage (see Table 2 for the full technical specification of the two sensors).
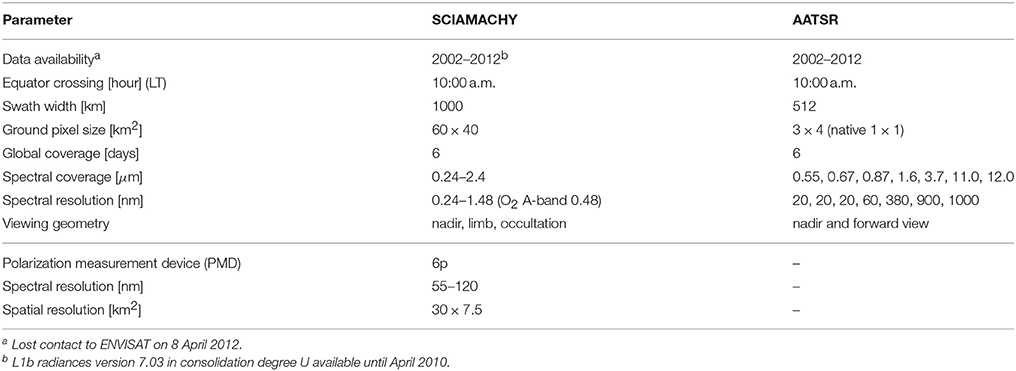
Table 2. Nominal technical specifications of SCIAMACHY and AATSR.
The AATSR retrieval algorithm is based on a different physical principle than SACURA. It uses two IR channels (e.g., 10.8 and 12 μm) to infer the brightness temperature (BT) of a cloud. BT is related to the cloud height because cold (warm) clouds are generally located at higher (lower) altitudes in the troposphere. The minimum temperature at which a local temperature profile matches the derived cloud top temperature is assumed to equal the cloud top height. Clouds are modeled as single-layered. Other settings of GRAPE are as follows: atmospheric transmittances and reflectances, calculated with DISORT as radiative transfer code DISORT and MODTRAN for gaseous absorption part, are saved in look-up-tables; the Lambertian surface reflection value is the MODIS albedo product for 2002 over land; pressure, temperature and water vapor profiles are taken from the European Centre for Medium-Range Weather Forecasts (ECMWF) model; individual ground pixels are down-sampled to create a superpixel of 4 pixels along and 3 pixels across track.
3.3. ARM: Ground-Based Data
The ground-based data are collected at three different Atmospheric Radiation Measurement (ARM) climate research facilities, namely Southern Great Plain (SGP), Barrow (North Slope Alaska, NSA) and Nauru Island (Tropical Western Pacific, TWP). The location of the facilities is given in Figure 1. From the datastreams available at the website http://www.archive.arm.gov/, the datastream named “30smplcmask” (Atmospheric Radiation Measurement (ARM) Climate Research Facility, 1996) has been selected for the comparison. It provides the number of cloud layers overpassing the detector as well as the lowest cloud bottom and highest cloud top height. These parameters are inferred from vertical profiles of a micro-pulsed LIght Detection And Ranging (LIDAR) device with the Wang and Sassen (2001) algorithm. Since a lidar signal is highly attenuated by cloud droplets in the visible wavelength range as compared to a radar signal operating in the gigahertz frequency range, the algorithm introduces the following ameliorations: first, the lidar returns are averaged over 30 s, such that the signal-to-noise ratio increases; then, as additional thresholds, the ratio between the baseline signal and the peak signal at each layer border is calculated as well as the maximum negative slopes detected inside the layer. In this way, the accuracy required to sense multi-layered cloud systems is achieved. The advantage of the selected datastream is not only the continuous coverage, ranging from the late 1990 until present, but it provides also the lowest and the highest cloud heights in the field of view of a satellite footprint. Thus, it is deemed to be the most appropriate for comparison with cloud macrophysical parameters derived by the SACURA algorithm, which retrieves the physical boundaries of a cloud (Lelli et al., 2012).
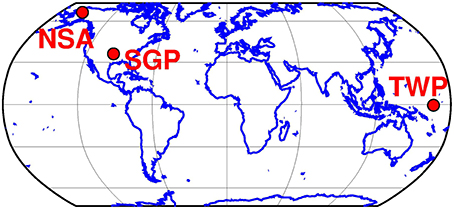
Figure 1. Location of the ARM Climate Research facilities (see http://www.archive.arm.gov/) for which ground-based cloud data have been compared with. Geolocations are given in Table 4.
The rationale behind the choice of the ground-based facilities and the datastreams has been driven by the characteristics of the SCIAMACHY instrument and the cloud dataset. The length of the satellite record together with the coarse footprint size require a long ground-based record in order to maximize the statistics of usable colocations. Moreover, given that different parts of the cloud bodies will be sensed when exploiting different spectral windows, only those sites have been selected which can consistently provide the same instrumentation and algorithm together, in order to avoid any additional uncertainty in the comparison. For instance, the SGP facility provides already cloud measurements starting mid 1996 until present. TWP has a temporal coverage from mid 1999, while NSA already from mid 1998 onward. Other sites, which would have added significance to the analysis due to the variety of surface and meteorological conditions (e.g., the mobile ARM facility in Niamey, Nigeria), offer a considerably shorter time series, also derived from a different instrumentation and algorithm than the ones used in this work.
4. Validation Methodology
For this study two strategies have been employed. The verification step against the IUP record makes use only of retrieval flagged 5 (best flag, see Table 1). In this way differences in the algorithmic implementations become visible. These retrievals show full convergence for both CTH and CBH. On the other hand, the validation against products of other research groups will employ a mix of flag 5, 3 (given a CTH > 5 km) and 2. The filtering for flag 3 is justified by the occurrence of multi-layered scenes (Lelli et al., 2012), which are identified by the highest cloud geometrical thickness value retrievable by the algorithm (Rozanov et al., 2004).
The GRAPE dataset offers a quality assessment, described by a combination of quality flag, data type and goodness of the fit. In this work the quality flag (in range 0–3) has been set greater than 2 and the data type (0: no data, 1: cloud and 2: aerosol) equals 1. A combination of values for convergence iterations (< 0: failed, 1–14: cloud, 1–24: aerosol) and retrieval cost (chi-squared threshold, 5: aerosol, 10: single-layer cloud, 30 multi-layer cloud) is employed. 14 is the upper limit of the iteration range which flags only cloudy pixels, while 10 is the chi-square threshold of the cost function in the retrieval procedure identifying single layered clouds, as in the SACURA forward modeling. In order to increase confidence in the extracted cloud scenarios, the retrievals are additionally selected as function of latitude excluding those located higher than ±70°. The maximum solar zenith angle allowed is set to 70°.
At the time of generation of the GRAPE dataset, a bug was found in the conversion between cloud top pressure (the actual retrieved quantity) and cloud top height (A. Sayer, personal communication). Therefore, cloud top altitudes (Z*, in km) are calculated from top pressures (P, in mbar) with The corresponding AATSR ground pixels are colocated and selected cloud properties are averaged within the coarser footprint of the SCIAMACHY ground pixel.
For the ground-based comparison, the selection of SCIAMACHY pixels satisfies the strict condition that the ground pixel center falls into a radius of 25 km from the ARM facilities. This value is justified by the fact that some ground pixels may just scratch the facility location, as can be seen from Figure 2, where the relative displacement of the SCIAMACHY pixels from the ARM facility is displayed as function of distance, at the overpass time of ENVISAT for the whole record. For instance, the overpass frequency distribution over the TWP facility, located in the remote Pacific, exhibits a second peak at 30 km, which points to a poor spatial sampling for orbits about the equatorial parallel.
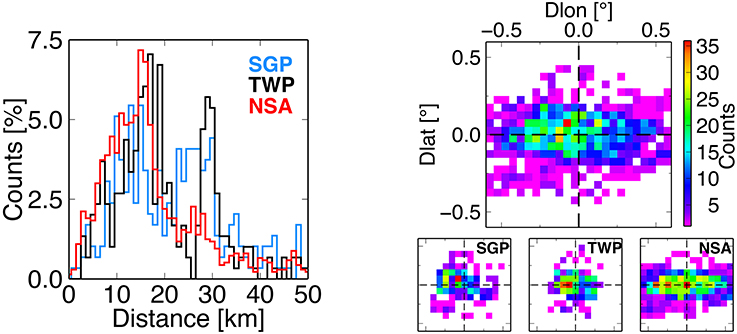
Figure 2. (Left) Count frequency of SCIAMACHY overpasses as function of distance from the ARM facility. Search radius criteria: 100 km for orbit and 50 km for individual pixel selection. (Right) Joint (upper plot) and relative (lower plots) count frequency of SCIAMACHY overpasses as function of relative displacement from the three ARM facilities.
5. Results and Discussion
5.1. The OCRA/SACURA Cloud Record
Prior to comparison of the ESA record with independent data sets, the accuracy of the implementation of the operational version has been assessed looking at the convergence rate of SACURA as function of cloud parameters and checked against the scientific implementation of the algorithm at IUP. The question to be addressed is whether the ESA SACURA record is populated in a way to provide a meaningful representation of clouds. To this end, year 2007 has been chosen. From left to right of Figure 3, the occurrence of the SACURA quality flags (normalized to the total retrieval counts for the corresponding bin) for cloud fraction, cloud top height and optical thickness have been plotted. The top and bottom rows display the ESA 5.02 and the IUP distributions, respectively. Please note that the IUP records have missing values because failed retrievals (flag 0) are not written to the output.
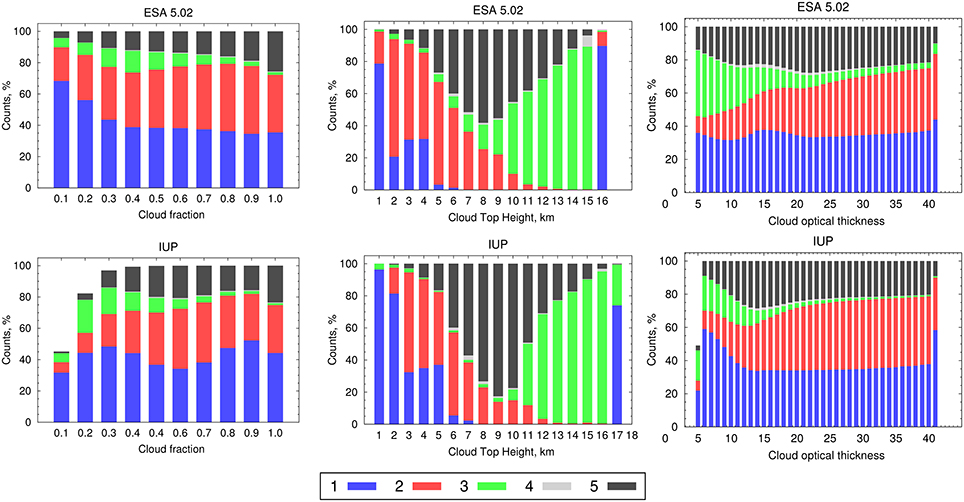
Figure 3. SCIAMACHY SACURA quality flag statistics of ESA 5.02 (top row) and IUP dataset (bottom row) for CF (left column), CTH (middle column) and COT (right column), year 2007. The color-coded values refers to the quality flags of Table 1. The studied subsample of SCIAMACHY CTH retrievals is populated with black, red and green (given that CTH < 5 km) retrievals. See Lelli et al. (2012, Section 4.1, p. 1561) for the selection criteria.
Looking at cloud fraction (Figure 3, left column), there is almost perfect agreement between the ESA and IUP for fully cloudy pixels (CF = 1). Departing from fully cloudy toward clear-sky scenes (CF = 0), the success rate decreases for both datasets. However, the two datasets differ for CF in range [0.4–0.7], the IUP record showing more converged fits. One source of discrepancy in the CF quality flag record arises if the OCRA offset and scaling factors (see Equation 2) are differently chosen. In the operational ESA and scientific IUP processing, slightly different values have been adopted (see Table 3).
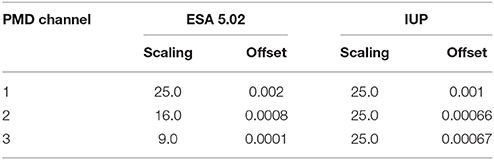
Table 3. Offset and scaling parameters for ESA 5.02 and IUP OCRA cloud fraction algorithm implementation.
Focusing on cloud top height (mid column), it can be seen that both data sets have similar distributions. However, ESA displays fully convergent retrievals (black histograms, flag 5) 25% less than IUP, mainly in the altitude range 7–11 km, where they are replaced by green bars, corresponding to quality flag 3. This implies that the ESA implementation of SACURA is more sensitive to the heterogeneity of clouds, because the limits of allowed geometrical thickness are met more frequently during the minimization of the cost function in the retrieval (Lelli et al., 2012, Equation 12, p. 1555). Reasons can be found in both the treatment of oxygen spectroscopy and difference in a-priori values. For instance, quality flag 3 can appear as long as the algorithm tries to iteratively fit an oxygen spectrum for a cloud either geometrically too thin (< 1.1 km) or too thick (> 11 km). The number of iterations to achieve convergence depends, in turn, on the treatment of the instrument response function and on the resulting convoluted O2 spectrum.
Since the sub-sample of extracted retrievals is always composed by black and red bars, the total amount doesn't change appreciably between the two implementations as function of altitude bin. This argument provides reasonable confidence that the ESA dataset isn't affected much by inhomogeneities in the cloud record due to degradation of algorithmic performance or differences in the implementation. Indeed, the comparison of global time series for cloud top height and quality flag 5 of Figure 4 shows a general agreement. The seasonal cycle is preserved and the ESA 5.02 product exhibits oscillations in-phase with the IUP dataset. However there is discrepancy in amplitude and variance, especially in late spring/early summer months. The mean bias between ESA and IUP amounts to +0.28 ± 2.1 km, while the ESA standard deviation amounts to half of that of the IUP dataset. Both differences are reflected in the dissimilar tails of the distributions of black histograms of Figure 3 for high-level clouds (CTH > 9 km). In this quantile ESA occurrence of best retrievals increases relative to the maximum placed at bin 8 km, shifting the overall mean to slightly higher CTH values. Since Figure 4 displays only that subset of the cloud record relevant to differences in the pure algorithmic implementation, the remaining source of discrepancy that can alter the distributions of the black histograms for high clouds may be traced back in different atmospheric profiles used. While the ESA record has been created with profiles from the ECMWF, the IUP record has been generated with the output of the Bremen 3D Chemistry Transport Model (B3DCTM, Sinnhuber et al., 2003; Aschmann et al., 2009, 2011).
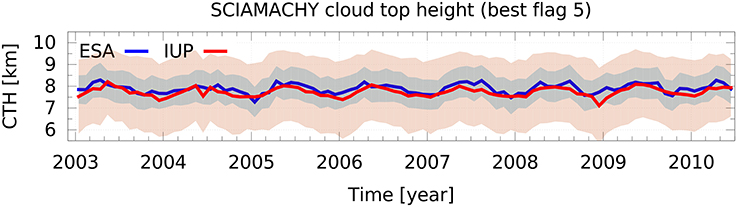
Figure 4. Comparison of ESA 5.02 and IUP SACURA cloud top height for quality flag 5 (black histograms, mid column of Figure 3) and 2-σ standard deviations.
5.2. Comparison with Ground-based Data
Figure 5 shows SCIAMACHY retrievals of co-located CTH vs. time-averaged ground-based CTH from the ARM facilities (see Table 4 for their location). The points are subset for number of cloud layers detected by the lidar (top panel: single-layer, bottom panel: double-layers), for SCIAMACHY cloud fraction and plotted separately for the three ARM facilities. Total number of cases amount to 37 (1 layer) and 25 (2 layers) for SGP, 39 and 33 for TWP and 90 and 53 for NSA, respectively. Lidar profiles are averaged in a window of 30 min about the overpass time of SCIAMACHY and the ground cloud top height is calculated taking the arithmetic mean, the median value and the average. In Table 5 the relative statistics are given. Additionally, in the right column values of optical thickness and cloud fraction for the corresponding SCIAMACHY ground pixels are given.
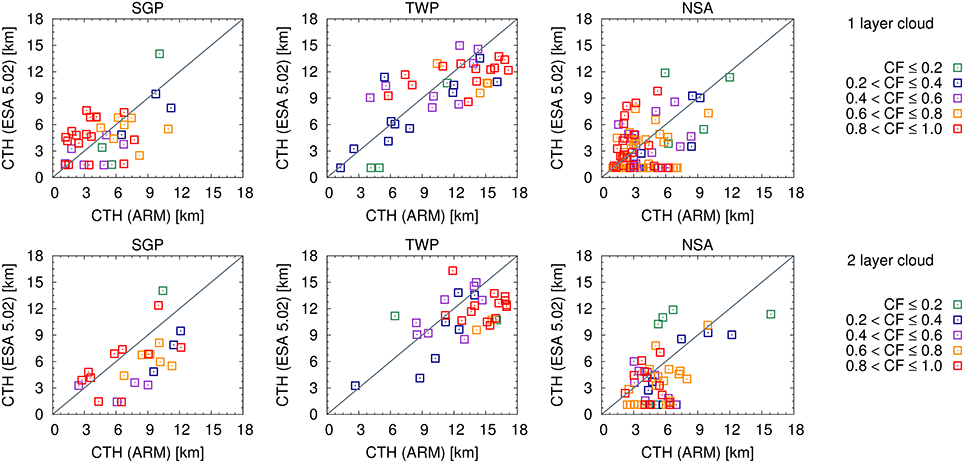
Figure 5. Scatterplots of co-located cloud top heights from SCIAMACHY vs. time-averaged ground-based cloud top heights for a 1-layer (top) and 2-layer (bottom) cloud (as provided by the ground-based lidar profiles). Sorting as function of satellite cloud fraction.
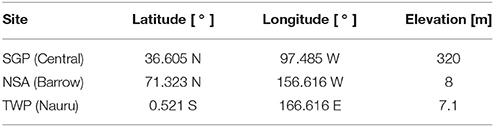
Table 4. Location of the ARM facilities with elevation above mean sea level.
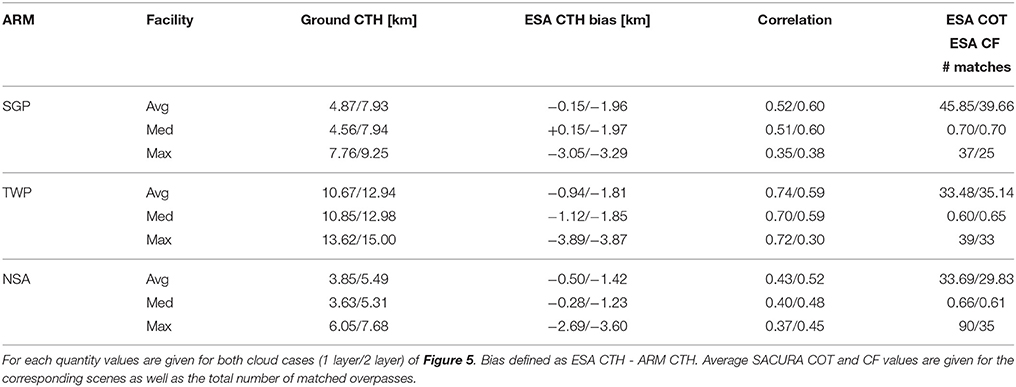
Table 5. Statistics of co-located ESA 5.02 CTH vs. ground-based retrievals.
The location of the three ARM ground facilities makes their choice an optimal opportunity to study clouds in three different latitude belts, with distinct mean cloud properties due to the diverse local meteorological conditions. For instance, the location of Barrow (North Alaska) is characterized by very low clouds together with seasonally snow-covered surfaces and a stratified atmosphere. The central facility of Lamont (Southern Great Plain) is located over a relatively flat plateau in the so-called “Tornado Alley” in center Oklahoma. Besides such extreme weather events, mid-level homogeneous clouds are frequent. Conversely, westward winds, flowing across the Tropical Western Pacific facility, generate aerosol outflows from the Nauru Island, which subsequently form heterogeneous cloud systems due to water vapor availability (Henderson et al., 2006). Therefore multilayered scenes have to be expected.
We focus on single-layer clouds (Figure 5), as defined by the local ground-based mask. Inspecting the results of Table 5, ESA bias (and correlation) with respect to average ground CTH amounts to −0.15 (0.52), −0.94 (0.74) and −0.5 (0.43) km for SGP, TWP and NSA, respectively. Fully and partly cloudy SCIAMACHY pixels (CF ∈ [0.6–1]) generally contribute to the overestimation of CTH, especially for homogeneous low and mid-level clouds (SGP and NSA). High-level clouds (TWP, CF > 0.6, CTH > 12 km) are mainly underestimated up to 1.12 km for single-layer and 1.85 km for double-layer clouds.
A special case is NSA. The quality of the retrievals is almost insensitive to cloud cover, because the majority of points cluster about the SACURA lower limit of 1.1 km, almost irrespective of SCIAMACHY cloud fraction. This fact hints a snow-covered surface, that the algorithm isn't capable to handle.
5.3. Comparison with AATSR/GRAPE Retrievals
In order to have a consistent comparison, it has been attempted to exclude cirrus clouds from the GRAPE data set, employing a mixture of filters. Cloud optical thickness must be less than 5, for heights greater than 8 km and ice cloud phase must be detected. This is because AATSR IR channels provide sensitivity to ice clouds at high altitudes (cirrus), whereas SACURA can detect only water and mixed phase clouds. A global view of the biases in cloud top height and cloud fraction between ESA 5.02 and GRAPE for the year 2007 is shown in Figure 6. The biases are defined as ESA − GRAPE and amount to +0.74 km for global CTH and −0.25 for CF. Not shown here is the bias in COT, which is +6.58 for the corresponding time span.
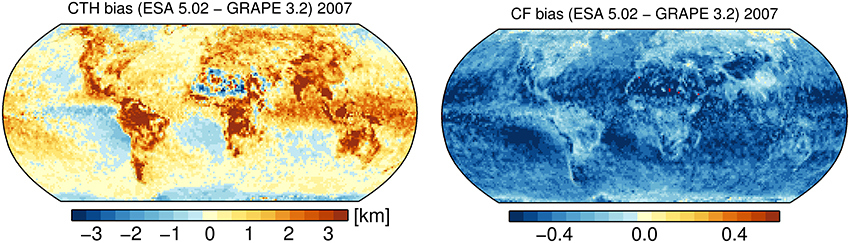
Figure 6. Map of cloud top height bias (left) and cloud fraction bias (right) between SCIAMACHY/ESA 5.02 and AATSR/GRAPE 3.2 for the year 2007.
Focusing on the left plot (cloud top height bias), a general overestimation of CTH is evident in the region of deep convective clouds close to the Equator. In this case, SACURA tends to retrieve the physical top of a cloud deck and GRAPE is biased low. It can be also concluded that a positive CTH bias is spatially positively correlated with COT, because those regions are characterized by optically dense clouds. Concurrently, it is also known that GRAPE underestimates CTH in the case of water clouds, because IR photons penetrate deep into the clouds and the backscatter signal sensed by the instrument is, to a good approximation, that of a radiating blackbody. It has been already proven that GRAPE CTH can be regarded as the radiative height of the cloud (Sayer et al., 2011).
The opposite situation holds true over North Africa, where ESA underestimates CTH as compared to GRAPE. This region is characterized more frequently by cirrus clouds than by underlying thick clouds, owing to the dry climatological conditions of the ground. In this case it is expected that GRAPE detects them. Given that it has been attempted to subset the GRAPE dataset, this would imply a suboptimal removal of cirrus clouds and to the partial inadequacy of the applied filters.
Focusing on cloud systems over water, one also recognizes low-level marine stratocumulus clouds in the southern hemisphere, facing the coasts of West Africa and South America. These persistent and uniform cloud decks frequently form in presence of boundary layer temperature inversions. A positive temperature vertical gradient inhibits convection and caps water vapor in the lowest 3 km of the troposphere. An algorithm based on the use of IR brightness temperatures can obtain the cloud-top temperature right but if the pressure and height profiles are wrong (i.e., they don't take into account positive temperature gradients), there are multiple heights for a given temperature. Typically all sensors with similar channels, such as AATSR, MODIS, AVHRR and the geostationary SEVIRI (Hamann et al., 2014), are affected and will retrieve very low clouds at higher altitudes above the inversions, matching cloud temperature with the first local profile value, unless dedicated strategies are deployed using temperature profiles from numerical weather predictions (Marcos and Rodriguez, 2013). Conversely, sensors operating in the visible are not affected, since a cloud is a bright object in this spectral range. Therefore a systematic bias by ESA/SACURA is expected. Indeed, the cluster of low level retrievals (CTH < 3 km) in the left scatter plot of Figure 7 corroborates this interpretation. In this case, SACURA flags such retrievals with 2, this being a converged fit only for the top of a cloud. The scatter plot shows also that for mid-level (above ≈ 3.5 km) and high-level clouds (CTH > 6 km) the ESA 5.02 data set has a constant positive bias. Referring to the central plots of Figure 3, these retrievals are flagged 5 (i.e., convergence is achieved for either CTH and CBH), providing high confidence in the presence of mid-aged single-layer cumulus clouds, with optical thicknesses between 20 and 40.
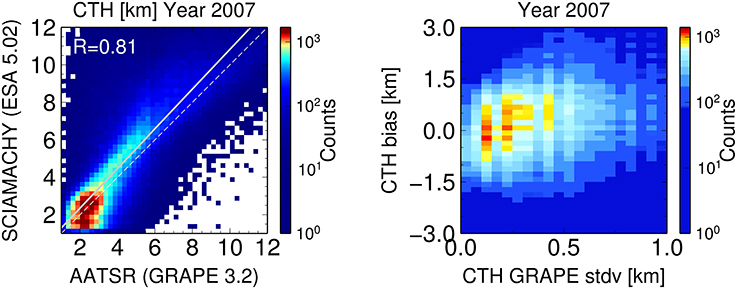
Figure 7. (Left) Scatter plot of SCIAMACHY cloud top height vs. AATSR cloud top height for year 2007. (Right) Cloud top height bias (defined as ESA - GRAPE, km) as function of cloud height horizontal variability of AATSR/GRAPE (measured as CTH standard deviation) within a SCIAMACHY ground pixel for the year 2007.
It is interesting to note that the bias in CTH can be explained also as function of horizontal heterogeneity of the cloud inside the field of view of SCIAMACHY. Cloud horizontal variability is measured as the standard deviation (stdv) of co-located AATSR CTH retrievals within a SCIAMACHY ground pixel. The right plot of Figure 7 shows a well defined relationship: the altitude of homogeneously extended clouds (low stdv) is underestimated. With increasing bumpiness of the cloud, the spatial averaging of CTHs from GRAPE results in a lower mean CTH, while SACURA has the tendency of placing the altitude closer to the physical top. One might argue that 3D effects (brightening of the edges, shadowing effects) play a role when looking at irregular clouds. However, it has been shown that at such coarse spatial scales (60 × 40 km2) the radiative contribution to the measured TOA intensity is principally dominated by the light backscattered in the vertical direction and not in the horizontal direction (Kokhanovsky et al., 2007a; Lelli et al., 2012).
The map of cloud fraction bias (right plot of Figure 6) shows a systematic underestimation. Some geographical features are evident. First, at high latitudes OCRA CF is closer (or higher than) to GRAPE CF. Snow-capped regions like Siberia, Alaska, Greenland and Antarctica affect the efficiency of OCRA/SACURA, because the algorithm is not capable to distinguish clouds from snow, due to missing optical contrast. Cloud fractions are also similar above areas known to be source of natural and human aerosols. Indeed, the bias is small (ΔCF ≤ 0.15) over central Africa, western-central Amazonia and over highly urbanized regions such as the american East Coast, western China, the Indian subcontinent and central Europe. Misclassification of aerosol layers as clouds may also contaminate the statistics in both datasets. Finally, the seasonality of the correlation and bias between SCIAMACHY and AATSR-derived CTH is shown in Figure 8. The time series don't exhibit trends throughout the period under study, indicating that either sensor and algorithm are not respectively affected by calibration drift and making both datasets possibly suitable for long-term climate studies.
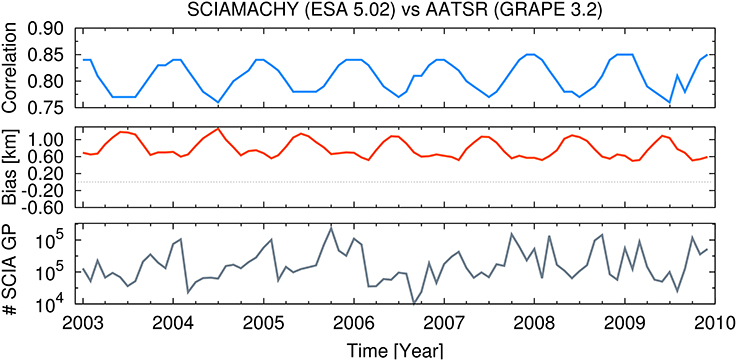
Figure 8. Time series of monthly correlation (top), mean bias (mid) and number of SCIAMACHY ground pixels for the comparison with co-located retrievals of cloud top height as seen by AATSR with the GRAPE dataset.
6. Summary and Conclusions
A comprehensive comparison of 10 years of cloud properties from SCIAMACHY from the ESA/DLR 5.02 dataset with ground and other satellite data has been carried out. Cloud properties investigated are cloud optical thickness, cloud fraction and cloud top height, which is the primary focus of this comparison. The reported results are useful for future algorithm development as well as for users of the ESA/DLR 5.02 dataset.
It has been found that cloud top height is the most accurate product in the ESA/DLR operational record from radiances in their version W7.04. This is because it is inferred from the relative depth of the oxygen A-band, which does not exhibit calibration drifts, being it spectrally located in the Vis-NIR SCIAMACHY channels and, therefore, less prone to degradation issues than the UV channels. This conclusion is also substantiated not only by the comparison against the same CTH record inferred from U7.03 radiances and independent satellite products from AATSR, but also by the insensitivity of the SACURA algorithm to radiometric uncertainties (Lelli et al., 2014, Appendix A, p. 5690).
Conversely, COT in the ESA/DLR dataset is systematically biased high, when compared to the IUP record and comparable in absolute value to the one derived by IR measurements of AATSR. While higher COT at thermal infrared wavelengths can be explained with its spectral dependence for a given TOA reflectance, the found bias at visible/near-infrared wavelengths amounts to 15.2 ± 23.13 (positive for latitudes in range ± 60 ° and negative otherwise) with an increasing drift in time. As COT is retrieved from a single-channel in the continuum, therefore ruling out issues in different oxygen spectroscopies, this discrepancy can be likely attributed to radiometric calibration offsets, which may be addressed in a future version of the ESA/DLR processor.
The comparison with IR-measurements shows also physically consistent patterns of CTH biases, which are rooted in the different retrieval techniques due to changes in spectral sensitivity to cloud properties across the electromagnetic spectrum. Optimally designed algorithms shall exploit co-registered measurements from both ViS-NIR and IR channels from different sensors. This approach is beneficial not only for the discrimination of cloud thermodynamic phase and a more accurate vertical profiling of cloud bodies, but also of scenes contaminated by natural and anthropogenic aerosol particles.
Moreover, the examination of patterns of CTH biases with retrievals from AASTR has shown spatial correlation with characteristic CF regimes, suggesting that the accuracy of SACURA CTH does not depend on the effective local cloud cover value (Kokhanovsky et al., 2007a), but on its geometrical value instead. Therefore, it would be beneficial to process a set of TOA SCIAMACHY radiances with co-registered AATSR fractional cloud cover values, as already carried out for the combination of SCIAMACHY and MERIS measurements (Kokhanovsky et al., 2009; Schlundt et al., 2011).
The comparison with colocated ground-based lidar-derived CTH suggests good agreement for mid- and high-level clouds, given that the SCIAMACHY pixel is sufficiently cloudy (CF > 0.6). The accuracy of height for low-level clouds (CTH < 3 km) over snow-free regions is not expected to exceed −250 m (Lelli et al., 2012, Figure 1, p. 1556). In the presence of snow, clouds will be misclassified as too thick and too low, because cloud decks at visible wavelengths are optically similar to snow packs and contrast is reduced. However, the O2 A-band seems to provide enough information content for the discrimination of snow from clouds. Schlundt et al. (2013), making use of derivatives of TOA radiances, demonstrated sufficient sensitivity for the retrieval not only of COT of elevated thin clouds, but also of the bottom altitude of clouds. It follows that having knowledge of the ground height from a digital elevation model, the differential analysis of wavelengths in the solar spectrum region, selected within and outside of strong gaseous absorption such the O2A, provide the informations to separate the bright ground scene from a cloud. Both aspects need to be taken into account for future versions of the algorithm.
Author Contributions
LL, MW, and JB equally contributed to this paper conceiving the workflow, processing the satellite radiances, analysing the data and revising the manuscript.
Funding
This work has been supported by the European Space Agency through the SCIAMACHY long term validation (SCILOV-10) project (contract ESRIN/RFQ/3-13173/10/I-LG) and partially by the German Science Foundation (DFG) through the DFG-Research Center/Cluster of Excellence “Ocean in the Earth System” (OC-CCP1).
Conflict of Interest Statement
The authors declare that the research was conducted in the absence of any commercial or financial relationships that could be construed as a potential conflict of interest.
Acknowledgments
V. V. Rozanov, M. Vountas, and S. Noël (Institute of Environmental Physics, Bremen, Germany) are acknowledged for discussions on radiative transfer, data processing and radiometric stability. A. Dehn, T. Fehr (ESA-ESRIN, Frascati, Italy) and S. Casadio (SERCO, Frascati, Italy) are credited for the SCILOV-10 project supervision and discussions during the recurrent meetings.
References
Alfaro-Contreras, R., Zhang, J., Campbell, J., Holz, R., and Reid, J. S. (2014). Evaluating the impact of aerosol particles above cloud on cloud optical depth retrievals from MODIS. J. Geophys. Res. Atmos. 119, 5410–5423. doi: 10.1002/2013JD021270
Aschmann, J., Sinnhuber, B.-M., Atlas, E. L., and Schauffler, S. M. (2009). Modeling the transport of very short-lived substances into the tropical upper troposphere and lower stratosphere. Atmos. Chem. Phys. 9, 9237–9247. doi: 10.5194/acp-9-9237-2009
Aschmann, J., Sinnhuber, B.-M., Chipperfield, M. P., and Hossaini, R. (2011). Impact of deep convection and dehydration on bromine loading in the upper troposphere and lower stratosphere. Atmos. Chem. Phys. 11, 2671–2687. doi: 10.5194/acp-11-2671-2011
Atmospheric Radiation Measurement (ARM) Climate Research Facility (1996). Cloud mask from Micropulse Lidar (30SMPLCMASK1ZWANG). Southern Great Plains (SGP) Central Facility, Lamont, OK; North Slope Alaska (NSA) Central Facility, Barrow AK; Tropical Western Pacific (TWP) Central Facility, Nauru Island. Updated monthly. Compiled by C. Sivaraman and L. Riihimaki. Data Archive: Oak Ridge, TN, Data set last accessed: January 2014.
Bovensmann, H., Burrows, J. P., Buchwitz, M., Frerick, J., Noël, S., Rozanov, V. V., et al. (1999). SCIAMACHY: mission objectives and measurement modes. J. Atmos. Sci. 56, 127–150.
Burrows, J. P., Hölzle, E., Goede, A. P. H., Visser, H., and Fricke, W. (1995). Sciamachy - scanning imaging absorption spectrometer for atmospheric chartography. Acta Astronautica 35, 445–451. doi: 10.1016/0094-5765(94)00278-T
Burrows, J. P., Weber, M., Buchwitz, M., Rozanov, V. V., Ladsttätter Weissenmayer, A., Richter, A., et al. (1999). The global ozone monitoring experiment (GOME): mission concept and first scientific results. J. Atmos. Sci. 56, 151–175.
Deirmendjian, D. (1969). Electromagnetic Scattering on Spherical Polydispersions. New York, NY: Elsevier Scientific Publishing.
Ferlay, N., Thieuleux, F., Cornet, C., Davis, A. B., Dubuisson, P., Ducos, F., et al. (2010). Toward new inferences about cloud structures from multidirectional measurements in the oxygen a band: middle-of-cloud pressure and cloud geometrical thickness from polder-3/parasol. J. Appl. Meteor. Clim. 49, 2492–2507. doi: 10.1175/2010JAMC2550.1
Fischer, J., and Grassl, H. (1991). Detection of cloud-top height from reflected radiances within the oxygen a band, part 1: theoretical studies. J. Appl. Meteor. 30, 1245–1259.
Fischer, J., Schüller, L., and Preusker, R. (2011). Cloud Albedo and Cloud Optical Thickness. Introduction to MERIS Level 2 Algorithm Theoretical Basis Document. Technical Report Issue 5.0. Doc. No.: PO-TN-MEL-GS-0005, ESA.
Hamann, U., Walther, A., Baum, B., Bennartz, R., Bugliaro, L., Derrien, M., et al. (2014). Remote sensing of cloud top pressure/height from SEVIRI: analysis of ten current retrieval algorithms. Atmos. Meas. Tech. 7, 2839–2867. doi: 10.5194/amt-7-2839-2014
Henderson, B. G., Chylek, P., Porch, W. M., and Dubey, M. K. (2006). Satellite remote sensing of aerosols generated by the Island of Nauru. J. Geophys. Res. 111:D22209. doi: 10.1029/2005jd006850
Illingworth, A., Hogan, R. J., O'Connor, E. J., Bouniol, D., Delano'́e, J., Pelon, J., et al. (2007). Cloudnet - Continuous evaluation of cloud profiles in seven operational models using ground-based observations. Bull. Amer. Meteor. Soc 88, 883–898. doi: 10.1175/BAMS-88-6-883
Kokhanovsky, A. A., Jourdan, O., and Burrows, J. P. (2006a). The cloud phase discrimination from a satellite. IEEE Geosci. Remote Sensing Lett. 3, 103–106. doi: 10.1109/LGRS.2005.858487
Kokhanovsky, A. A., Mayer, B., Rozanov, V. V., Wapler, K., Burrows, J. P., and Schumann, U. (2007a). The influence of broken cloudiness on cloud top height retrievals using nadir observations of backscattered solar radiation in the oxygen A-band. J. Quant. Spectrosc. Rad. Tran. 103, 460–477. doi: 10.1016/j.jqsrt.2006.06.003
Kokhanovsky, A. A., Nauss, T., Schreier, M., von Hoyningen-Huene, W., and Burrows, J. P. (2007b). The intercomparison of cloud parameters derived using multiple satellite instruments. IEEE Trans. Geosci. Rem. Sens. 45, 195–200. doi: 10.1109/TGRS.2006.885019
Kokhanovsky, A. A., and Rozanov, V. V. (2004). The physical parameterization of the top-of-atmosphere reflection function for a cloudy atmosphere–underlying surface system: the oxygen a-band case study. J. Quant. Spectrosc. Rad. Tran. 85, 35–55. doi: 10.1016/S0022-4073(03)00193-6
Kokhanovsky, A. A., Rozanov, V. V., Nauss, T., Reudenbach, C., Daniel, J. S., Miller, H. L., et al. (2006b). The semianalytical cloud retrieval algorithm for sciamachy i. the validation. Atmos. Chem. Phys. 6, 1905–1911. doi: 10.5194/acp-6-1905-2006
Kokhanovsky, A. A., Rozanov, V. V., von Hoyningen-Huene, W., Bovensmann, H., Burrows, J. P., and Baltink, H. K. (2004). The determination of cloud altitudes using SCIAMACHY onboard ENVISAT. IEEE Geosci. Remote Sens. Lett. 1, 211–214. doi: 10.1109/LGRS.2004.830123
Kokhanovsky, A. A., Rozanov, V. V., Zege, E. P., Bovensmann, H., and Burrows, J. P. (2003). A semianalytical cloud retrieval algorithm using backscattered radiation in 0.4–2.4 μm spectral region. J. Geophys. Res. 108:4008. doi: 10.1029/2001JD001543
Kokhanovsky, A. A., von Hoyningen-Huene, W., and Burrows, J. P. (2009). Determination of the cloud fraction in the SCIAMACHY ground scene using MERIS spectral measurements. Int. J. Rem. Sens. 30, 6151–6167. doi: 10.1080/01431160902842326
Kokhanovsky, A. A., von Hoyningen-Huene, W., Rozanov, V. V., Noël, S., Gerilowski, K., Bovensmann, H., et al. (2006c). The semianalytical cloud retrieval algorithm for SCIAMACHY II. The application to MERIS and SCIAMACHY data. Atmos. Chem. Phys. 6, 4129–4136. doi: 10.5194/acp-6-4129-2006
Kühnlein, M., Appelhans, T., Thies, B., Kokhanovsky, A., and Nauss, T. (2013). An evaluation of a semi-analytical cloud property retrieval using MSG SEVIRI, MODIS and CloudSat. Atmos. Res. 122, 111–135. doi: 10.1016/j.atmosres.2012.10.029
Kuji, M., and Nakajima, T. (2002). “Retrieval of cloud geometrical parameters using remote sensing data,” in 11th Conference on Cloud Physics (Ogden, UT: American Meteorological Society), JP1.7.
Lelli, L., Kokhanovsky, A. A., Rozanov, V. V., Vountas, M., and Burrows, J. P. (2014). Linear trends in cloud top height from passive observations in the oxygen A-band. Atmos. Chem. Phys. 14, 5679–5692. doi: 10.5194/acp-14-5679-2014
Lelli, L., Kokhanovsky, A. A., Rozanov, V. V., Vountas, M., Sayer, A. M., and Burrows, J. P. (2012). Seven years of global retrieval of cloud properties using space-borne data of GOME. Atmos. Meas. Tech. 5, 1551–1570. doi: 10.5194/amt-5-1551-2012
Li, Z., Niu, F., Fan, J., Liu, Y., Rosenfeld, D., and Ding, Y. (2011). Long-term impacts of aerosols on the vertical development of clouds and precipitation. Nat. Geosci. 4, 888–894. doi: 10.1038/ngeo1313
Li, Z., Zhao, F., Liu, J., Jiang, M., Zhao, C., and Cribb, M. (2014). Opposite effects of absorbing aerosols on the retrievals of cloud optical depth from spaceborne and ground-based measurements. J. Geophys. Res. Atmos. 119, 5104–5114. doi: 10.1002/2013JD021053
Lichtenberg, G. (2011). SCIAMACHY Offline Processor Level1b-2 ATBD, Algorithm Theoretical Baseline Document (SGP OL Version 5). Technical report, DLR, Oberpfaffenhofen.
Loyola, D. G. (2004). “Automatic cloud analysis from polar-orbiting satellites using neural network and data fusion techniques,” in IEEE Trans. Geosci. Remote Symposium, Vol. 4 (Anchorage, AL), 2530–2534. doi: 10.1109/IGARSS.2004.1369811
Loyola, D. G., and Ruppert, T. (1998). A new PMD cloud-recognition algorithm for GOME. ESA Earth Observ. Q. 58, 45–47.
Lutz, R., Loyola, D., Gimeno García, S., and Romahn, F. (2016). OCRA radiometric cloud fractions for GOME-2 on MetOp-A/B. Atmos. Meas. Tech. 9, 2357–2379. doi: 10.5194/amt-9-2357-2016
Marcos, C., and Rodriguez, A. (2013). Algorithm Theoretical Basis Document for Precipitation Products from Cloud Physical Properties. Technical Report Issue 1.0., Rev. 0, Doc. No.: SAF/NWC/CDOP2/INM/SCI/ATBD/14, EUMETSAT, Darmstadt.
Melnikova, I., and Vasilyev, A. (2005). Short-Wave Solar Radiation in the Earth's Atmosphere: Calculation, Observation, Interpretation. Berlin; Heidelberg; New York, NY: Springer.
Nauss, T., Kokhanovsky, A., Nakajima, T., Reudenbach, C., and Bendix, J. (2005). The intercomparison of selected cloud retrieval algorithms. Atmos. Res. 78, 46–78. doi: 10.1016/j.atmosres.2005.02.005
Poulsen, C. A., Watts, P. D., Thomas, G. E., Sayer, A. M., Siddans, R., Grainger, R. G., et al. (2011). Cloud retrievals from satellite data using optimal estimation: evaluation and application to ATSR. Atmos. Meas. Tech. Discuss. 4, 2389–2431. doi: 10.5194/amtd-4-2389-2011
Rosenfeld, D., Lohmann, U., Raga, G., O'Dowd, C., Kulmala, M., Fuzzi, S., et al. (2008). Flood or drought: how do aerosols affect precipitation? Science 321, 1309–1313. doi: 10.1126/science.1160606
Rozanov, V., and Kokhanovsky, A. (2005). The average number of photon scattering events in vertically inhomogeneous atmospheres. J. Quant. Spectrosc. Rad. Tran. 96, 11–33. doi: 10.1016/j.jqsrt.2004.12.026
Rozanov, V. V., and Kokhanovsky, A. A. (2004). Semianalytical cloud retrieval algorithm as applied to the cloud top altitude and the cloud geometrical thickness determination from top-of-atmosphere reflectance measurements in the oxygen A band. J. Geophys. Res. 109:4070. doi: 10.1029/2003JD004104
Rozanov, V. V., and Kokhanovsky, A. A. (2006). Determination of cloud geometrical thickness using backscattered solar light in a gaseous absorption band. IEEE Trans. Geosci. Rem. Sens. 3, 250–253. doi: 10.1109/LGRS.2005.863388
Rozanov, V. V., Kokhanovsky, A. A., and Burrows, J. (2004). The determination of cloud altitudes using GOME reflectance spectra: multilayered cloud systems. IEEE Trans. Geosci. Rem. Sens. 42, 1009–1017. doi: 10.1109/TGRS.2004.825586
Rozanov, V. V., Kokhanovsky, A. A., Loyola, D. G., Siddans, R., Latter, B., Stevens, A., et al. (2006). Intercomparison of cloud top altitudes as derived using GOME and ATSR-2 instruments onboard ERS-2. Rem. Sens. Environ. 102, 186–193. doi: 10.1016/j.rse.2006.02.009
Saiedy, F. H., Hilleary, D. T., and Morgan, W. A. (1965). Cloud-top altitude measurements from satellites. Appl. Opt. 4, 495–500. doi: 10.1364/AO.4.000495
Saiedy, F. H., Jacobowitz, H., and Wark, D. Q. (1967). On cloud-top determination from Gemini-5. J. Atmos. Sci. 24, 63–69.
Sayer, A. M., Poulsen, C. A., Arnold, C., Campmany, E., Dean, S., Ewen, G. B. L., et al. (2011). Global retrieval of ATSR cloud parameters and evaluation (GRAPE): dataset assessment. Atmos. Chem. Phys. 11, 3931–3936. doi: 10.5194/acp-11-3913-2011
Schlundt, C., Kokhanovsky, A., Rozanov, V., and Burrows, J. P. (2013). Determination of cloud optical thickness over snow using satellite measurements in the oxygen A-Band. IEEE Trans. Geosci. Rem. Sens. 10, 1162–1166. doi: 10.1109/LGRS.2012.2234720
Schlundt, C., Kokhanovsky, A. A., von Hoyningen-Huene, W., Dinter, T., Istomina, L., and Burrows, J. P. (2011). Synergetic cloud fraction determination for SCIAMACHY using MERIS. Atmos. Meas. Tech. 4, 319–337. doi: 10.5194/amt-4-319-2011
Schuessler, O., Loyola, D., Doicu, A., and Spurr, R. (2013). Information content in the oxygen A-band for the retrieval of macrophysical cloud parameters. IEEE Trans. Geosci. Rem. Sens. 52, 3246–3255. doi: 10.1109/TGRS.2013.2271986
Sinnhuber, B.-M., Weber, M., Amankwah, A., and Burrows, J. P. (2003). Total ozone during the unusual antarctic winter of 2002. Geophys. Res. Lett. 30:1580. doi: 10.1029/2002gl016798
Stubenrauch, C. J., Rossow, W. B., Kinne, S., Ackerman, S., Cesana, G., Chepfer, H., et al. (2013). Assessment of global cloud datasets from satellites: project and database initiated by the GEWEX radiation panel. Bull. Amer. Meteorol. Soc. 94, 1031–1049. doi: 10.1175/BAMS-D-12-00117.1
Varnai, T., and Marshak, A. (2007). View angle dependence of cloud optical thicknesses retrieved by Moderate Resolution Imaging Spectroradiometer (MODIS). J. Geophys. Res. 112:D06203. doi: 10.1029/2005JD006912
Wang, P., and Stammes, P. (2014). Evaluation of SCIAMACHY oxygen a band cloud heights using cloudnet measurements. Atmos. Meas. Tech. 7, 1331–1350. doi: 10.5194/amt-7-1331-2014
Wang, P., Stammes, P., van der, A. R., Pinardi, G., and van Roozendael, M. (2008). FRESCO+: an improved O2 A-band cloud retrieval algorithm for tropospheric trace gas retrievals. Atmos. Chem. Phys. 8, 6565–6576. doi: 10.5194/acp-8-6565-2008
Wang, Z., and Sassen, K. (2001). Cloud type and macrophysical property retrieval using multiple remote sensors. J. Appl. Meteor. 40, 1665–1682. doi: 10.1175/1520-0450(2001)040h1665:CTAMPRi2.0.CO;2
Keywords: clouds, SCIAMACHY, nadir, validation, long-term monitoring, climate
Citation: Lelli L, Weber M and Burrows JP (2016) Evaluation of SCIAMACHY ESA/DLR Cloud Parameters Version 5.02 by Comparisons to Ground-Based and Other Satellite Data. Front. Environ. Sci. 4:43. doi: 10.3389/fenvs.2016.00043
Received: 01 March 2016; Accepted: 30 May 2016;
Published: 21 June 2016.
Edited by:
Thomas Nauss, Philipps Universität Marburg, GermanyReviewed by:
Irina Melnikova, St.Petersburg State University, RussiaAnke Kniffka, Karlsruhe Institute of Technology, Germany
Copyright © 2016 Lelli, Weber and Burrows. This is an open-access article distributed under the terms of the Creative Commons Attribution License (CC BY). The use, distribution or reproduction in other forums is permitted, provided the original author(s) or licensor are credited and that the original publication in this journal is cited, in accordance with accepted academic practice. No use, distribution or reproduction is permitted which does not comply with these terms.
*Correspondence: Luca Lelli, bHVjYUBpdXAucGh5c2lrLnVuaS1icmVtZW4uZGU=