 Olusegun S. A. Oluwole
- Neurology Unit, College of Medicine, University of Ibadan, Ibadan, Nigeria
Low precipitation enhances transmission of influenza viruses, which cause seasonal epidemics during the winter in northern and southern hemispheres. El Niño southern oscillation (ENSO) which modulates global precipitation is a multicomponent signal that is composed of sub-annual to multi-decadal oscillations. The dynamics of oscillatory components of ENSO and influenza are characterized, and causal relationship of annual oscillatory components is determined. Seasonality of influenza was determined in five geographical areas of north and south hemispheres. Monthly influenza time series of these regions and of ENSO were decomposed to oscillatory components. The oscillatory components were characterized in time-frequency and phase space domains. Periodicities of the oscillatory components of ENSO and influenza range from sub-annual to multidecadal. Time-dependent intrinsic correlations of instantaneous amplitude and frequencies of annual oscillatory components of ENSO and influenza are > 0.9. The dynamics of ENSO and influenza, which are dissipative with multifractal chaotic attractors, transit from quasi-periodic to chaotic regimes. Five most severe peaks of epidemic, which include 2009–2010 pandemic, occur during chaos. ENSO and influenza dynamics are phase coherent, but there is unidirectional causal effect of ENSO on influenza. Amplitude and frequency modulations of annual oscillatory components of ENSO and influenza are strongly coupled. Chaotic dynamics of ENSO determines the timing and severity of influenza epidemics. Monitoring of ENSO dynamics will aid public health surveillance of influenza epidemics.
Introduction
Influenza epidemics occur annually during the winter in northern and southern hemispheres (Oluwole, 2015). Occurrence is attributed to seasonal changes in virulence, transmission, and survival of influenza viruses, as well as seasonal changes in host immunity and behavior like overcrowding (Furhmann, 2010). Spectra coherence of El Niño southern oscillation (ENSO) and influenza time series (Oluwole, 2015) show, however, that climate is a major determinant of seasonality. ENSO modulates global precipitation on multiple timescales which range from sub-annual to multi-decadal (An and Wang, 2000), but it is the most dominant modulator of inter-annual changes in precipitation (Liu et al., 2014). Transmission of influenza viruses in human populations occurs via aerosols, droplets, and direct contact with infected secretions (Lindsley et al., 2010), but aerosols is the most effective mode of transmission. Low precipitation, which increases the duration of suspension of aerosols in the air, has been shown in epidemiological (Shaman et al., 2010) and experimental (Lowen et al., 2007) studies to increase transmission of influenza viruses.
ENSO is coupled ocean-atmosphere system in equatorial Pacific ocean. Southern oscillation, the atmospheric component of ENSO, is the alternating low and high sea level pressures between the west and east equatorial Pacific ocean, which is driven by the Walker circulation (Bjerknes, 1969). The oceanic component is the alternating warming and cooling of sea surface between the west and east equatorial Pacific ocean, which is driven by easterly winds (Bjerknes, 1969). Sea surface temperature anomaly in equatorial east Pacific Ocean ≥ 0.5 °C, which lasts five consecutive overlapping 3-month periods in the Niño 3.4 region (5°N–5°S, 120°–170°W) is defined as El Niño (National Oceanic and Atmospheric Administration, 2015b), while La Niña occurs when there is temperature anomaly of ≤ −0.5 °C for similar period. The ENSO is a non-linear, non-stationary system that is composed of oscillatory components with periodicities which range from less than a year to multiples of decades (An and Jin, 2011). The annual oscillatory component is phase-locked to seasons (Stuecker et al., 2015), just as El Niño, which typically starts in spring and peaks in winter, is also phase-locked to seasons (Rasmusson and Carpenter, 1982). The quasi-periodicity or aperiodicity of El Niño events has been attributed to chaos in ENSO dynamics (McPhaden, 1999). Chaos, or turbulent flow (Packard et al., 1980), describes the irregular behavior of dynamic systems that evolve in time without noise or external stochasticity, but are sensitive to initial conditions of the system. Study was done to characterize the dynamics of the oscillatory components of ENSO and of influenza time series in disparate regions of northern and southern hemispheres, and determine if dynamic causal relationship exists between the annual oscillatory components.
Methods
Data
Monthly data of subjects from 15 countries, who had positive specimens for influenza viruses from January 2000 to December 2015 were obtained from the database of the WHO Global Influenza Programme (World Health Organization, 2015). Monthly data of multivariate El Niño-southern Oscillation Index (MEI) were downloaded from the website of National Oceanic and Atmospheric Administration (National Oceanic and Atmospheric Administration, 2015a). The MEI, which was computed from sea-level pressure, zonal and meridional components of the surface wind, sea surface temperature, surface air temperature, and total cloudiness fraction of the sky of the South Pacific Ocean (Wolter and Timlin, 1998), was used for analysis because it provides a single index of both atmospheric and oceanic components, rather than Southern Oscillation Index, which measures the atmospheric component, or Sea Surface Temperature, which measures the oceanic component.
Study Regions
Subjects were grouped into three regions in the north hemisphere, but into two regions in the southern hemisphere. Regional groupings, which were of contiguous countries as much as possible are North America, which included United States of America and Canada; Nordic/Europe, which included Spain, Portugal, France, Germany, Denmark, Norway and Sweden; Asia, which included China and Japan; South America, which included Argentina and Chile; and Oceania, which included Australia and New Zealand. Angular histograms of monthly distribution of influenza cases were drawn to determine the seasonality of influenza in each region of study. The Rayleigh's test for non-uniformity of circular distribution was performed to determine significance.
Oscillatory Components of ENSO and Influenza Time Series
ENSO time series has been shown to be non-linear and (Elsner and Tsonis, 1993; Mukhin et al., 2015) and non-stationary (Timmermann et al., 2003). Linear and stationary methods are not appropriate to analyze time series with non-linearities. Presence of non-linearities in atmospheric and oceanic components was determined using the third order moment method (Barnett, 2007). The highest p-value for rejecting the null hypothesis of linearity and stationarity was < 0.001. The synchrosqueezing transform (Daubechies et al., 2011), a time-frequency reassignment algorithm, was applied to determine the spectra of time-varying oscillatory components of ENSO and influenza time series.
Non-linear, non-stationary signals which contain single time-varying amplitude and phases can be modeled as s(t) = A(t)cos[2πϕ(t)] (Boashash, 1992), where A(t) is time varying amplitudes, and ϕ(t) is time varying phases. Natural signals like the ENSO, which have multiple oscillatory components, can be modeled as sum of oscillatory components and noise, . Such signals must, however, be decomposed to monocomponents before physically meaningful instantaneous phases (ϕi(t)), frequencies (Ai(t)), and amplitudes (ωi(t)) can be generated. Empirical mode decomposition (Huang et al., 1998) separates fast and slow oscillatory components of non-linear and non-stationary signals into intrinsic mode functions (IMFs), unlike harmonic analysis, which decomposes signals into components that are integer multiples of the fundamental frequency. To align the oscillatory components of ENSO and influenza time series and reduce mode mixing, noise assisted multivariate empirical mode decomposition (Rehman and Mandic, 2010a) which applies multivariate empirical mode decomposition algorithm (Rehman and Mandic, 2010a), was used. The algorithm of multivariate EMD (Rehman and Mandic, 2010a) is as follows:
1. Generate pointset based on Hammersley sequence for sampling on an (n − 1) − sphere
2. Calculate projection , of the input signal along the direction of vector , for all k (the whole set of direction vectors), giving as the set of projections.
3. Find the time instants , which correspond to the maxima of projected signals set.
4. Interpolate for all values of k, to obtain multivariate envelope curves
5. For a set of K direction vectors, calculate mean m(t) of the envelope curves as
6. Extract detail d(t) using d(t) = x(t) − m(t). if the detail d(t) fulfills the stoppage criterion for multivariate IMF, apply the above procedure to d(t), otherwise apply it to x(t) − d(t).
The synchrosqueezing transform was applied to determine the oscillatory components in each IMF. The IMFs with annual oscillatory component were selected for further analyses to determine time-dependent intrinsic correlations, phase space, recurrence and joint recurrence plots, synchronization, and direction of causality.
Time dependent intrinsic cross correlation measures the cross correlation (TDIC) of oscillatory components of non-linear, non-stationary time series (Chen and Huang, 2010). TDIC is a three stage method of empirical mode decomposition, Hilbert transform of IMFs to instantaneous amplitudes and frequencies, and TDIC of instantaneous amplitudes and frequencies (Huang and Schmitt, 2014). The Hilbert transform of IMF2 was done to generate analytical signal from which instantaneous amplitude (ωi(t)), phase (ϕi(t)), and frequencies (Ai(t)) were extracted (Huang et al., 1998). TDIC of instantaneous frequencies and amplitudes of ENSO and influenza for IMF2 were performed for each region.
Phase Spaces of El Niño Southern Oscillation and Influenza
The phase space of time series can be reconstructed from scalar data using the method of delayed embedding vector coordinates, which derives from the Taken's theorem (Takens, 1981). Scalar time series {xi, i = 1, 2, …} is converted to its vector form {Xi = xi, xi+L, xi+2L, …, xi+(m − 1)L}, where m is embedding dimension, and L is the delay or lag (Packard et al., 1980). Theoretically the embedding dimension should be m ≥ 2⌈d⌉ + 1, where d is the fractal dimension, and ⌈d⌉ is the lowest integer greater than d to preserve the dynamical properties of the attractor. To characterize the phase spaces of ENSO and of influenza in five geographical regions, embedding dimensions m were calculated for IMF2s using Cao's algorithm (Cao, 1997), and lags τ were estimated using mutual information algorithm (Martinerie et al., 1992). The Lyapunov exponent, which measures the sensitivity of dynamic systems to small changes in initial conditions (Wolf et al., 1985), was used to detect the presence of chaotic attractors.
Differentiable graphs have topological dimension d, while non-differentiable graphs have fractal dimension, which have values between the topological dimension d and d + 1 (Gneiting et al., 2012). Fractal time series, which are not differentiable, can be characterized using the Hurst exponent (H), which measures long range dependence or memory. Hurst exponent, which is expressed as x(t) = aHx(at), is related to fractal dimension D as D = 2 − H (Mandelbroit and van Ness, 1968). While the Hurst exponent of monofractal time series is independent of time and space, multifractal time series have time varying Hurst exponents (Ihlen, 2012). Detrended fluctuation analysis (DFA) algorithm estimates Hurst exponent of long-range temporal correlations, while multifractal detrended fluctuation analysis (Kantelhardt et al., 2002) detects multiple scaling of fractal time series. To characterize the geometry of ENSO and influenza attractors, multifractal detrended fluctuation analysis (Ihlen, 2012) of annual oscillatory components of ENSO and influenza in five geographical regions were performed.
Recurrence of ENSO and Influenza Trajectories
The recurrence plot of dynamic systems is generated from recurrence matrix, which is defined as , where N is the number of measured points , ϵ is the threshold distance, Θ(.) is the Heaviside function, and ∥·∥ is the norm (Marwan et al., 2007). When a trajectory in phase space, , visits a state the recurrence Ri, j is 1, but when the trajectory visits a state the recurrence Ri, j is 0. Since trajectories do not return to exact regions of phase space , the threshold ϵ defines the region of phase that is the neighborhood (Marwan et al., 2007). Recurrence plots were produced to characterize the recurrence of annual oscillatory components of ENSO and influenza.
Chaos-periodic and periodic-chaos transitions of non-linear dynamics systems have been detected using metrics of recurrence quantification analysis, which are computed for windows or sub-matrices along the line of identity of recurrence plots (Marwan, 2011). These metrics, which complement visual interpretation of recurrence plots, are measures of complexities that are derived from diagonal and vertical structures of recurrence plots (Marwan et al., 2002, 2007). Determinism (DET), which is the ratio of recurrence points that form diagonal lines of at least lmin and all recurrence plots, and divergence (DIV), which is the inverse of the longest diagonal line Lmax (Marwan, 2011) are metrics of diagonal structures, which show maximal values at periodic-chaos and chaos-periodic transitions (Marwan et al., 2007; Marwan, 2011). To characterize the regimes in ENSO and influenza dynamics, divergence and determinism were calculated for window sizes of 36 months, which is approximately the median period of recurrence of El Niño events. To determine the statistical significance of the metrics, the distributions of determinism and divergence for 5,000 surrogate time series of influenza and ENSO were determined and compared with the distribution of 5,000 bootstrap samples of determinism and divergence of annual oscillatory components of influenza and ENSO. Each geographical region was tested separately.
Joint recurrence plots were computed to compared recurrences of ENSO and influenza in phase space. Metrics of network analysis, which maps time series to networks with distinct topological characteristics (Campanharo et al., 2011), have been used to detect the presence of regimes in dynamic systems. These metrics are computed from adjacency matrix, which is defined as Apq(ϵ) = Rpq(ϵ) − δpq, and has correspondence to the recurrence matrix. Global clustering coefficient (C), which is the mean of the local clustering coefficient of all vertices, and average path length (), which is the mean geodesic distance between all pairs of vertices where paths exist (Donner et al., 2011; Zou et al., 2012), are network metrics that have been used to detect the presence of regimes and transitions from periodic to chaotic regimes and vice versa. To characterize the regimes in joint recurrence of ENSO and influenza using geometrical properties, global clustering and average path lengths were calculated for 36 months windows of joint recurrence networks of annual oscillatory components of ENSO and influenza. To determine statistical significance of the network metrics, the distribution of average path length and global clustering of joint recurrence network of 5,000 surrogate time series of ENSO and influenza were compared with 5,000 bootstrap samples of joint recurrence network of annual oscillatory components of ENSO and influenza. To determine the effect of chaos on severity of influenza epidemics, the five most severe peaks of influenza epidemics between 2000 and 2015 were mapped to joint recurrence network of annual oscillatory components of ENSO and influenza, Figure 4.
Synchronization of ENSO and Influenza Trajectories
The phase space of periodic trajectories increases by 2π for each rotation, or ∥x(t+T) − x(t) ∥ = 0, where T is the period (Romano et al., 2005). Although chaotic trajectories shift between unstable periodic orbits, recurrence occurs when each unstable periodic orbit is completed, which is an increment of 2π (Boccaletti et al., 2002). The unstable periodic orbits of chaotic trajectories are locked when they are in phase synchrony, which implies ni : mi relationship of their recurrence plot phases, where i is time index (Romano et al., 2005). The statistical measure is how often ϕ1 and ϕ2 increase by 2π or its multiples within time interval τ (Romano et al., 2005). Phases of recurrence plot of chaotic trajectories, therefore, increase by 2πk within time interval τ. Phase synchrony is measured by comparing the probability P(ϵ)(τ) that the trajectory returns to ϵ-neighborhood of a previous point on the trajectory. The cross correlation between P1(τ) and P2(τ) is defined as . When the trajectories are in phase synchrony the probability of recurrence are maximal at the same time, and CPR ≈ 1. To determine if the trajectories of ENSO and influenza are synchronized, the CPR index was calculated for the five regions.
Two dynamic systems are topologically equivalent or homeomorphic, if there is a function that maps every point on one trajectory with the other. If time series x(t) and y(t) are from the same n-dimensional manifold, there will be correspondence between their reconstructed manifold Mx and My (Deyle and Sugihara, 2011). Causal relationship can be unidirectional x(t) → y(t) or bidirectional x(t) ↔ y(t). To determine if there is causal relationship between the dynamics of ENSO and influenza, annual oscillatory components of influenza in five geographical areas were cross mapped with annual oscillatory components of ENSO using convergent cross mapping algorithm (Sugihara et al., 2012).
Scripts, Programming and Statistical Packages
Matlab scripts, which contained relevant algorithms, were used to test for non-linearities in time series (Barnett, 2007), for noise assisted multivariate empirical mode decomposition (Rehman and Mandic, 2010b), for time-dependent intrinsic correlation (Chen and Huang, 2010), to generate surrogate time series (Leontitsis, 2004), and for multifractal detrended fluctuation analysis (Ihlen, 2012). All Matlab scripts were implemented in Matlab-Octave programming language.
Lyapunov spectrum, lag, embedding dimension, Takens, and phase space plots were implemented in the non-linearTseries package of R Statistical Programming and Environment, Austria, version 3.2.2, 2015 (R Core Team, 2016). Embedding dimensions m were calculated for IMF2s using Cao's algorithm (Cao, 1997), and lags τ were estimated using mutual information algorithm (Martinerie et al., 1992), both implemented in non-linearTseries package of R Statistical Programming and Environment, Austria, version 3.2.2, 2015 (R Core Team, 2016). Python programming language pyunicorn package was used to generate matrices of recurrence plots and networks, while its astropy package was used for bootstrap statistics. Python seaborn and matplotlib packages were used to produce distributions, time series, and angular histogram plots. Calculations of CPR index to determine synchronization of dynamics were performed as described in publication (Romano et al., 2005).
Results
Seasonality of Influenza Epidemics and El Niños
Regions of northern and southern hemispheres in the study are shown in Figure 1. Monthly time series of influenza in the five regions show consistent seasonal peaks, but multiple peaks occurred during the 2009–2010 pandemic in northern hemisphere regions (Figures 2A–E). Seasonal epidemics occurred from October to March in North America, October to April in Nordic/Europe, December to March in Asia, which range from middle of fall to middle of spring of northern hemisphere, but from May to November in South America, and June to October in Oceania, which range from late fall to middle of spring of southern hemisphere (Figures 3A–D). Seasonal epidemics peaked in January in North America and Asia, February in Nordic/Europe, July in South America, and August in Oceania, during the winter of both hemispheres (Figures 3A–D). The Rayleigh's test for non-uniformity of circular distribution was statistically significant at p < 0.0001 for all the regions. Of five El Niños which occurred in 2002–2003, 2004–2005, 2006–2007, 2009–2010, and 2015–2016, onsets of three were in summer, one in spring, and one in fall. The peaks of three were in winter (December), and two in fall (October and November).
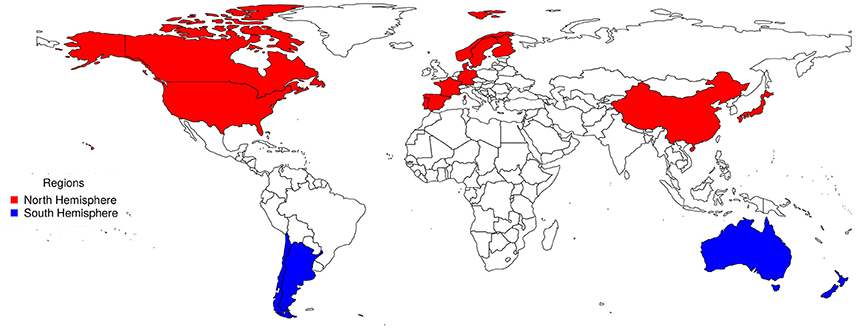
Figure 1. Map of study regions.
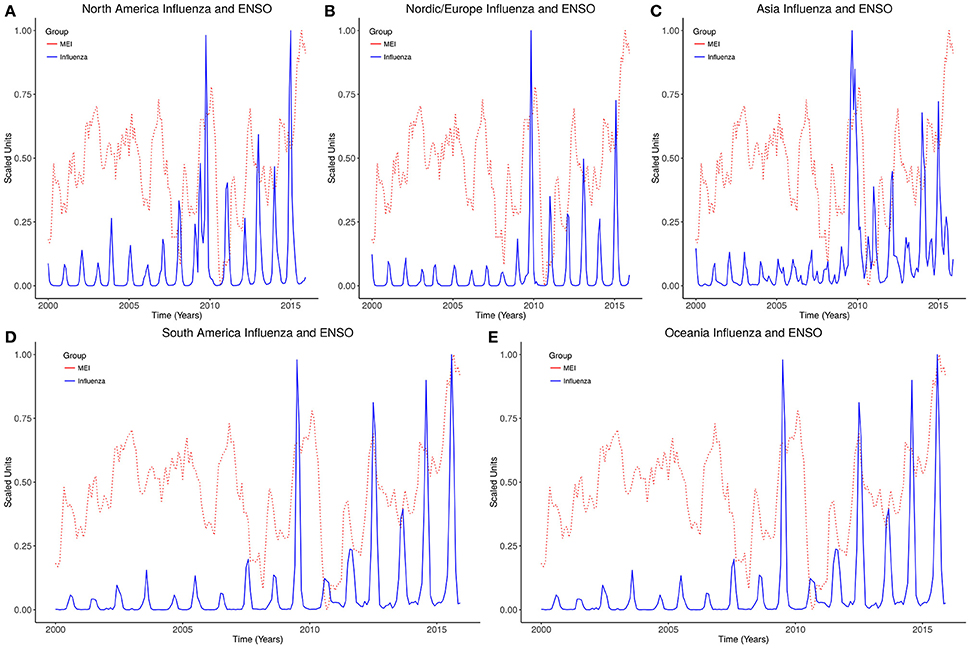
Figure 2. Time series of influenza and ENSO. (A) North America. (B) Nordic/Europe. (C) Asia. (D) South America. (E) Oceania.
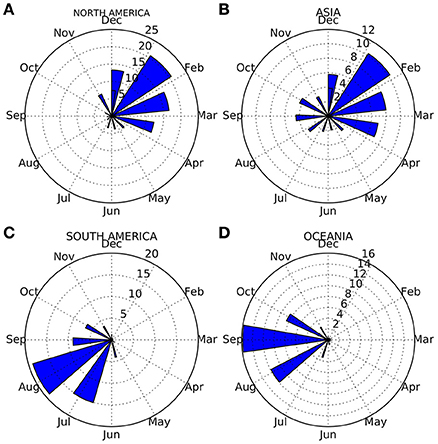
Figure 3. Angular histograms of monthly influenza occurrence. (A,B) Northern hemisphere. (C,D) Southern hemisphere.
Oscillatory Components of ENSO and Influenza Time Series
The time series of ENSO and influenza of all regions show statistically significant non-linearities, p < 0.001. Synchrosqueezing transform of ENSO shows that time-varying oscillatory components with periodicities from less than a year to multi-decadal are present in the spectra, (Figures 4A–F). Influenza time series in North America, Nordic/Europe, Asia, South America, and Oceania also shows spectra of time-varying oscillations with periodicities from less than a year to multidecadal. Time-varying spectral of influenza time series showed concentration of power predominantly at 1.0 year periodicity in all regions except Asia, which has power concentrated at multiple periodicities.
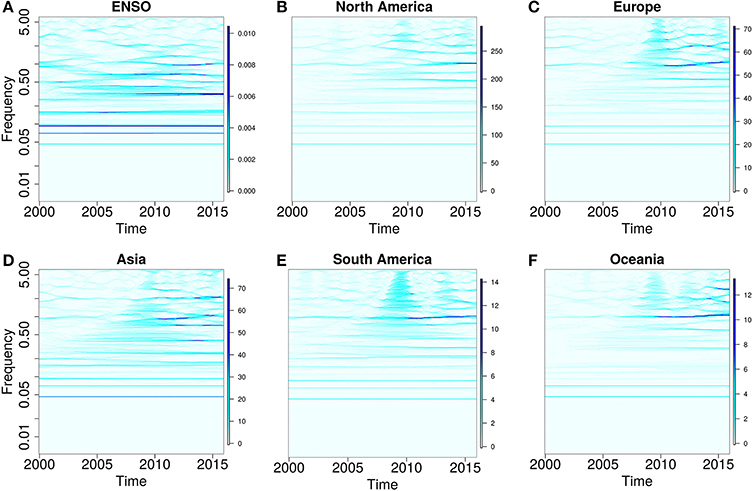
Figure 4. Spectra of ENSO and influenza oscillatory components. (A) El Niño Southern Oscillation. (B) North America Influenza. (C) Nordic/Europe Influenza. (D) Asia Influenza. (E) South America Influenza. (F) Oceania Influenza.
Figures 5A–I shows intrinsic mode functions 2–4 for Asia, Oceania, and South America regions. Synchrosqueezing transform of intrinsic mode functions showed that the second intrinsic mode function (IMF2) is the annual oscillatory component. TDIC of instantaneous frequencies of ENSO and influenza in five regions show correlations > 0.9 for all windows, (Figures 6A–D). Similarly, time dependent intrinsic correlation of instantaneous amplitudes of ENSO and influenza show correlations > 0.9 for all windows, (Figures 7A–D).
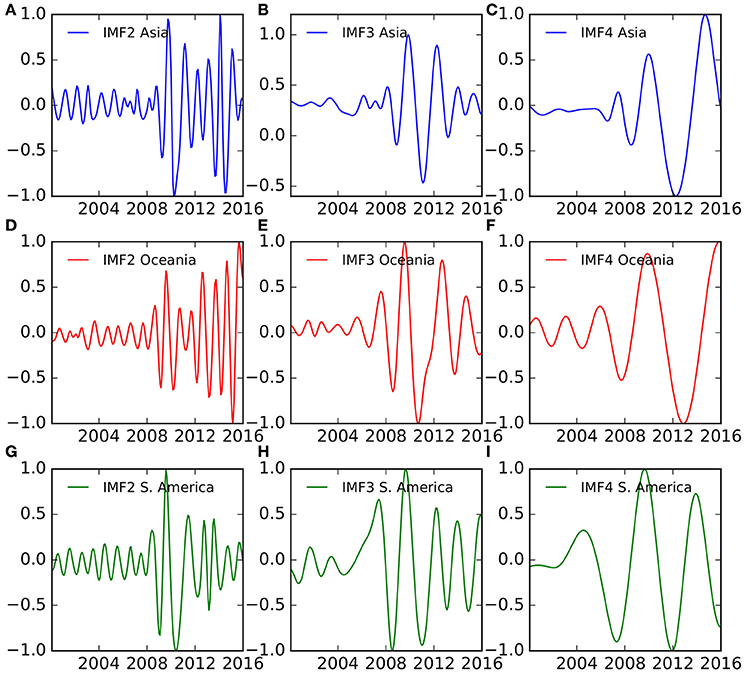
Figure 5. Intrinsic mode functions. (A–C) Asia. (D–F) Oceania. (G–I) South America.
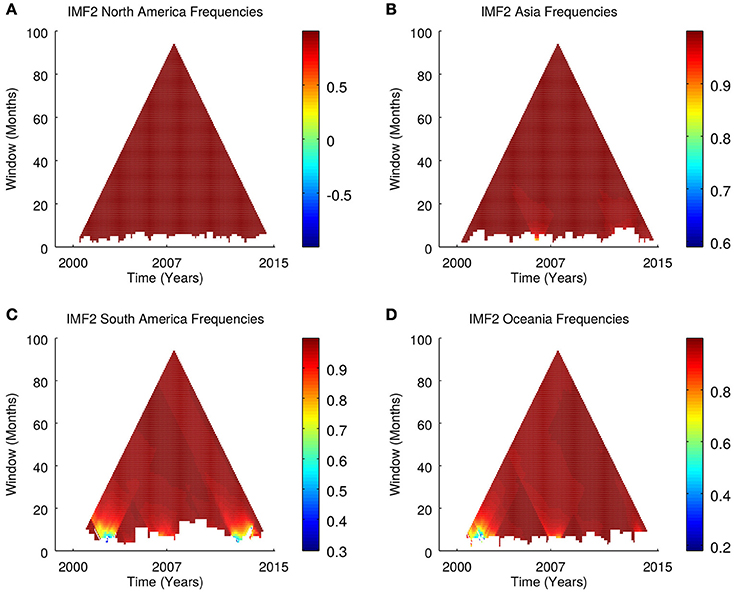
Figure 6. Time dependent intrinsic correlations of ENSO and influenza frequencies. (A,B) Northern hemisphere. (C,D) Southern hemisphere.
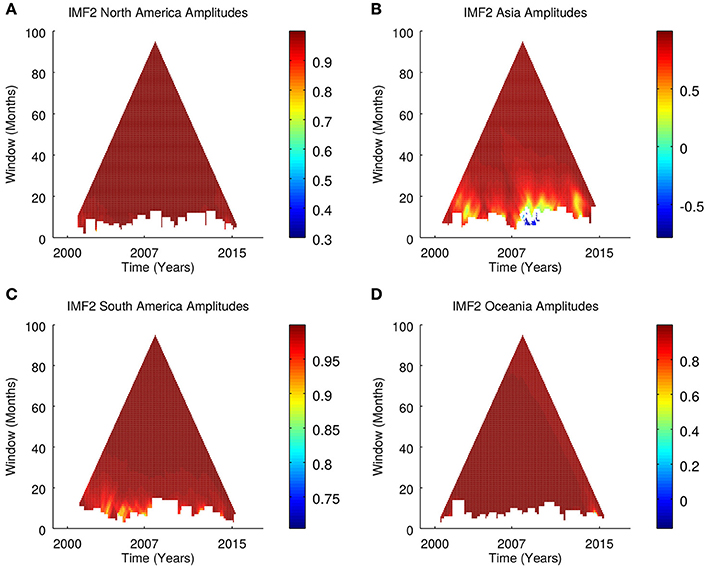
Figure 7. Time dependent intrinsic correlations of ENSO and influenza amplitudes. (A,B) Northern hemisphere. (C,D) Southern hemisphere.
Phase Spaces of El Niño Southern Oscillation and Influenza
Phase spaces of all oscillatory components of ENSO and influenza time series show dissipative dynamics, (Figures 8A–I). The trajectories of oscillatory components of ENSO and influenza graphically appear to run in the same manifold. The maximum Lyapunov exponents of annual oscillatory components of ENSO, and of influenza in all five regions are positive. Hurst spectra of multifractal detrended fluctuation analysis show that annual oscillatory components of ENSO and influenza in five regions of the study are multifractals.
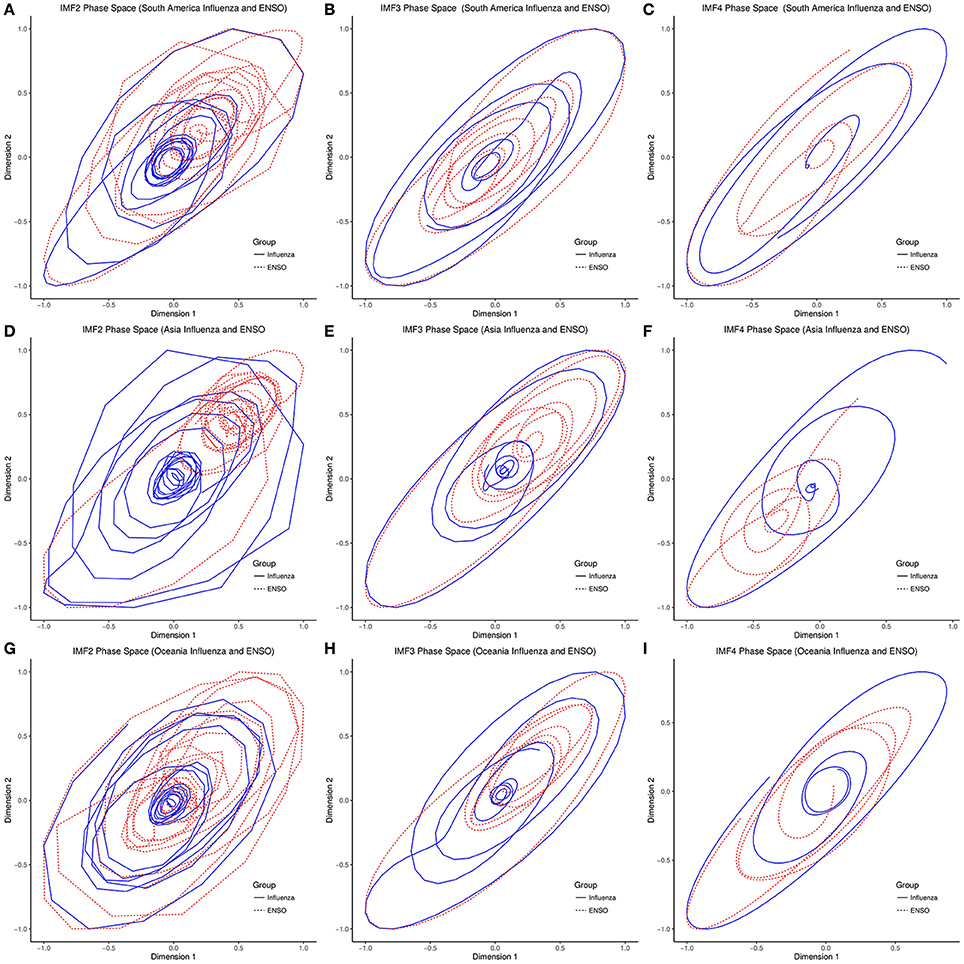
Figure 8. Phase space portraits of oscillatory components. (A–C) South America. (D–F) Asia. (G–I) Oceania.
Short diagonal lines in the recurrence plots of ENSO is typical of chaotic dynamics (Figure 9E). Recurrence plots of influenza in the five regions also show line structures typical of chaotic dynamics, (Figures 9A–D). The line structure of both dynamics, however, suggest presence of quasi-periodic and chaotic regimes. Peaks and troughs of divergence and determinism confirm the presence of regimes and transitions in both dynamics (Figures 9F–J). The bootstrap distributions of determinism and divergence for surrogate time series, influenza, and ENSO show that determinism and divergence of ENSO and influenza are highly statistically significantly different from surrogate data, p < 0.0001.
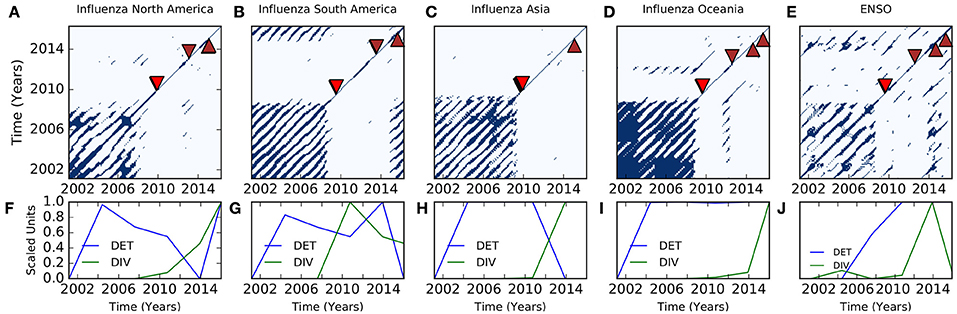
Figure 9. Recurrence plots of influenza and ENSO annual oscillatory components. (A) North America. Arrow heads indicate time of occurrence of five highest peaks of influenza occurrence. Red arrow heads indicate high peaks during influenza pandemic of 2009–2010, while brown arrow head indicate seasonal influenza epidemics. (B) South America. (C) Asia. (D) Oceania. (E) ENSO. (F–J) DET is determinism, and DIV is divergence.
Joint recurrence plot of ENSO and influenza show line structures similar to the recurrence plots of ENSO and influenza, (Figures 10A–E). Global clustering coefficient, and average path length confirm the presence of quasi-periodic and chaotic regimes (Figures 11F–J). Bootstrap statistics shows statistically significant difference in global clustering coefficient and average path length of quasi-periodic and chaotic regimes, p < 0.0001.
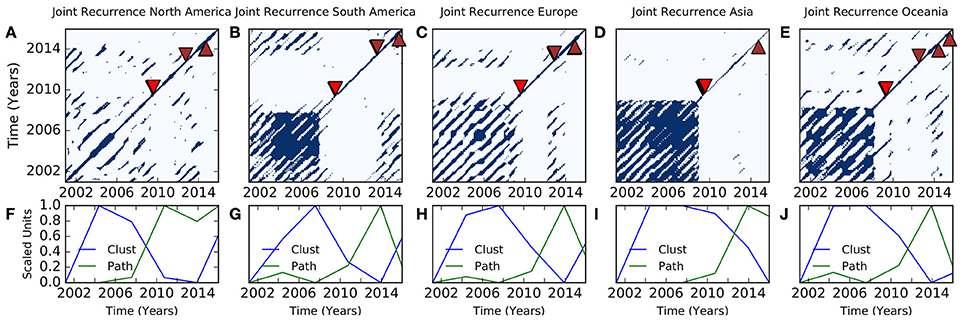
Figure 10. Joint recurrence of ENSO and influenza. (A) North America. Arrow heads indicate time of occurrence of five highest peaks of influenza occurrence. Red arrow heads indicate high peaks during influenza pandemic of 2009–2010, while brown arrow head indicate seasonal influenza epidemics. (B) South America. (C) Nordic/Europe. (D) Asia. (E) Oceania. (F–J) Clust is global clustering, and Path is average path length.
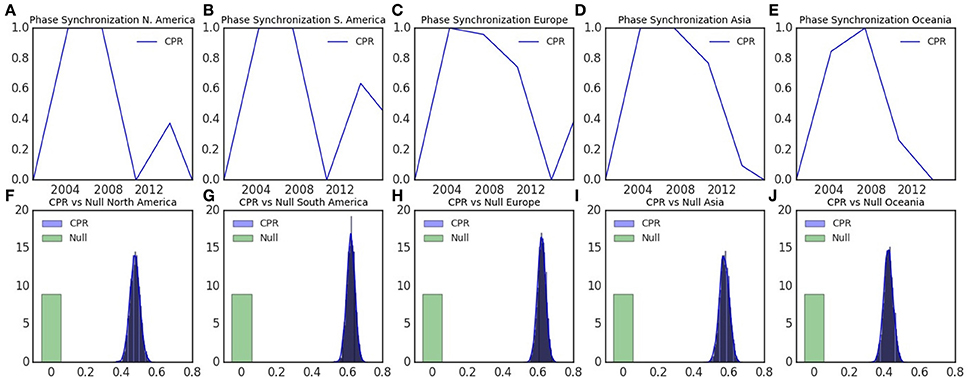
Figure 11. Phase synchronization of ENSO and influenza. (A) North America. (B) South America. (C) Nordic/Europe. (D) Asia. (E) Oceania. (F–J) Distributions of CPR index of ENSO and influenza with Null data in.
Synchronization of ENSO and Influenza Trajectories
CPR index peaked during the quasi-periodic regime in all five regions, but reached lowest values before 2012 in northern and southern America, but after 2012 in Europe, Asia, and Oceania, (Figures 11A–E). There is highly statistical significance difference of CPR index of ENSO and influenza compared with 5,000 samples of their surrogate time series (p < 0.0001), (Figures 11F–J).
The signature of annual oscillatory component of ENSO on influenza in North America is statistically significant, but not vice versa (Figure 12A). Convergence, which is improvement of cross-mapped estimates as the length of time series increases is present. Statistically significant signature of annual oscillatory component of ENSO in influenza is also present in South America, Europe, Asia, and Oceania (Figures 12B–E).
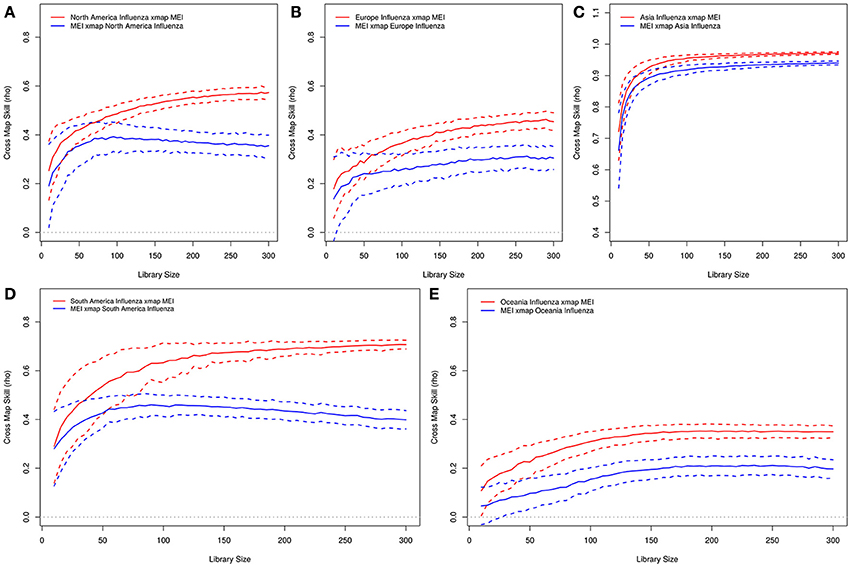
Figure 12. Convergent cross mapping of influenza and ENSO annual oscillatory components. (A) North America. (B) Nordic/Europe. (C) Asia. (D) South America. (E) Oceania.
Chaos and Severity of Epidemics
The five highest peaks of influenza epidemics occurred during chaotic regimes in all regions of the study. Of the five highest peaks two occurred during the 2009–2010 influenza pandemic in North America, South America, and Oceania, but one in Europe and four in Asia, (Figures 10A–E). There is highly statistical significant difference between the bootstrap distributions of 5,000 bootstrap samples of average path length and global clustering of windows, which contained the five highest influenza peaks compared with the remaining windows, (p < 0.0001).
Discussion
Circular statistics of monthly distribution of influenza cases, which show strong seasonality of influenza epidemics in five disparate regions of northern and southern hemispheres, indicate coupling of the epidemics to climate (Figures 1, 3A–D). Although influenza epidemics peak during the winter, the period of increase occurrence of influenza range from October to April in northern hemisphere and from May to November in the southern hemisphere, which is fall to spring in both hemispheres. This indicates that influenza epidemics occur during the same phases of seasons in both hemispheres. Monthly time series of influenza in disparate regions of northern and southern hemispheres, which show time-varying peaks, indicate inter-annual changes in severity of seasonal influenza epidemics (Figures 1, 2A–E). Multiple peaks which occur during the pandemic of 2009–2010 in northern hemisphere regions, however, indicate frequency modulation during pandemics (Figures 2A–E). Multiple seasonal peaks of influenza occurrence, which correlated with the waveforms of ENSO, have been observed during all influenza pandemics since 1918 (Oluwole, 2016). El Niño typically starts in spring (Philander, 1985) and peaks in winter (Sheinbaum, 2003; Caviedes, 2007). Occurrence of El Niños from 2000 to 2015, with onsets in spring or summer and peaks in fall or winter, is also strongly coupled to seasons. Thus, El Niño events and influenza epidemics are coupled to similar phases of season cycles.
Oscillatory Components of ENSO and Influenza Time Series
The power spectra of ENSO of the past 21,000 years, which was derived from paleoclimate data, showed presence of oscillatory components from sub-annual to 64 years periodicities (Liu et al., 2014). The synchrosqeezing spectra show that ENSO is composed of time-varying sub-annual, annual, decadal, and multidecadal oscillations (Figures 4A–F). The periodicities of the oscillatory components are consistent with the multiple timescales that ENSO modulates the climate. Influenza time series of northern and southern hemisphere regions, which also show sub-annual, annual, decadal, and multi-decadal oscillations, indicate that influenza time series have oscillatory components of similar periodicities to ENSO (Figures 4A–F). Although the power of ENSO spectra is strong in multiple bandwidths from sub-annual to multi-decadal periodicities, that of influenza is strong in the bandwidth about 1 year periodicity except for Asia region, which has strong sub-annual to multi-decadal oscillatory components (Figures 4A–F). Thus, both ENSO and influenza are multicomponent systems with oscillations of similar periodicities.
Annual warming of equatorial east Pacific ocean during Christmas was documented in a lecture in 1895 (Cane, 1986), but references to this phenomenon, which lasts about 2 months, were made by Peruvian fishermen in the 18th century (Julian and Chervin, 1978). The annual oscillatory cycle of ENSO, which is tightly coupled to season cycles, has strong impact on global precipitation (Kessler et al., 1998; Stuecker et al., 2015). Very strong time dependent intrinsic correlations of instantaneous frequencies and amplitudes of annual oscillatory cycles of ENSO and influenza indicate that frequencies and amplitudes of both oscillations are coupled (Figures 6A–D, 7A–D). The ENSO, which is amplitude and frequency modulated (An and Wang, 2000; An and Jin, 2011), had periodicity of 3–4 years for El Niño events between 1872 and 1910, 5–7 years between 1911 and 1960, and 5 years between 1970 and 1972 (Torrence and Compo, 1998; Torrence and Webster, 1999). Thus, strong coupling of amplitude and frequency modulations of irregular ENSO with influenza indicate functional relationship.
Phase Spaces of El Niño Southern Oscillation and Influenza
Models of ENSO dynamics which predicted chaos include discharge-recharge oscillator (Jin, 1997), delayed oscillator (Battisti and Hirst, 1989), and linear annual subharmonic steps to chaos (Jin et al., 1994). In this study, however, ENSO dynamics was reconstructed from phase space embedding, which is derived from Taken's theorem (Takens, 1981), (Figures 8A–I). The phase space, state or vector space, of deterministic dynamic systems are usually defined by a set of first-order differential equations, which ensures uniqueness of the trajectories (Kantz and Schreiber, 2003). Every point in the phase space, which recovers the topology and preserves the properties or behavior of the dynamic system (Packard et al., 1980), specifies the state of the system (Kantz and Schreiber, 2003). Differential equations are, however, not available for ENSO and influenza, which are time series of scalar values. While the phase space volume of conservative dynamics system is preserved as time evolves, that of dissipative dynamic system contracts as time evolves t → ∞ (Grebogi et al., 1987). Figures 8A–I, which show that the phase space volumes of all oscillatory components of ENSO and influenza contract, indicate dissipative dynamics of both systems.
Trajectories of dissipative systems return to a region of phase space called attractor as time t → ∞. The geometry of phase space attractors characterizes dynamic systems. Phase space attractors with Euclidean geometry like fixed point, limit cycle, or torus are simple, while phase space attractors with fractal geometry are chaotic (Ruelle and Takens, 1971). Fractals are geometrical objects that have non-integer dimensions, which exceed their topological dimensions. This implies they are not locally linear when dilated or contracted, nor differentiable at all scales (Mandelbroit, 1989). The Lyapunov exponent, which measures the sensitivity of dynamic systems to small changes in initial conditions or the average rate of divergence of close trajectories (Wolf et al., 1985), is an indicator of the presence of chaos. A dynamic system is chaotic if the maximum Lyapunov exponent (λ) is > 0. Since the maximum Lyapunov exponents of annual oscillatory components of ENSO and influenza are positive, the attractors of both dynamics have fractal dimensions, which indicate chaos. Thus, the dynamics of annual oscillatory components of ENSO and influenza are chaotic as predicted by theoretical models (Vallis, 1986; Thornley and France, 2012).
Correlation dimension of 3.5 for sea surface temperature (SST) of east Pacific ocean (Tziperman et al., 1994) showed that ENSO has fractal geometry. Scale invariance of multivariate El Niño Index (MEI) between 1950 and 2008 (Mazzarella and Giuliacci, 2009), and detrended fluctuation analysis of southern oscillation index (SOI) between 1866 and 2000 also showed that ENSO is fractal (Ausloos and Ivanova, 2001). Similarity of ENSO waveforms during five influenza pandemics from 1876 to 2015, which suggests scale invariance (Oluwole, 2016), is indicative of fractal time series (van Rooij et al., 2013). While chaotic trajectories have fractal geometry, not all fractals are self-similar under magnification (Mandelbroit, 1989). Fractal time series, which do not have the same reduction ratio of shape at all scales (Mandelbroit, 1989), are multifractals. Multifractality of the annual oscillatory components of ENSO and influenza of five regions of the study indicate statistical self-similarity, which is typical of natural fractals.
Recurrence of ENSO and Influenza Trajectories
Recurrence, which describes the return of trajectories to regions of phase space that have been previously visited, is characteristic of dynamic systems (Kantz and Schreiber, 2003). Poincaré recurrence theorem states that trajectories of dynamic systems return to states that are close to the initial state as time evolves sufficiently long (Kantz and Schreiber, 2003). The recurrence plot is a graphical tool to display the pattern of recurrence of dynamic systems (Eckmann et al., 1987). Its line structures reveal the dynamics of trajectories in phase space (Eckmann et al., 1987). Periodic dynamics show long uninterrupted diagonal lines in recurrence plots, while chaotic dynamics like the Lorenz system show short diagonal lines (Gao and Cai, 2000). There are no uninterrupted diagonal lines in the recurrence plot of annual oscillatory component of ENSO, but periods of relatively long and short diagonal lines which resemble recurrence plots of theoretical chaotic dynamics like Lorenz and Rössler systems (Figure 9E). The recurrence plots of annual oscillatory components of influenza in five regions of the study have line structures similar to that of ENSO (Figures 9A–D). Thus, recurrence of annual oscillatory components of ENSO and influenza show chaotic dynamics, but regimes are not homogeneous.
Chaotic regimes of dynamic system can be preceded by period doubling, intermittency, crisis, and Ruelle-Takens, which describe changes of attractors from simple to chaotic (Argyris et al., 1993). The dynamics of climate data has been shown to have periodic, quasi-periodic, and chaotic regimes (Donges et al., 2011). Periodic or quasi-periodic regimes that have long diagonal lines, which are described as unstable periodic orbits, are present in chaotic systems like the Lorenz and Rössler system (Marwan et al., 2007). Quasi-periodic regimes preceded chaos in theoretical models of ENSO which included season cycles (Tziperman et al., 1994). Determinism (DET), which is the ratio of recurrence points that form diagonal lines of at least lmin and all recurrence plots, and divergence (DIV), which is the inverse of the longest diagonal line Lmax (Marwan, 2011) are metrics of diagonal structures, which show maximal values at periodic-chaos and chaos-periodic transitions (Marwan et al., 2007; Marwan, 2011). Peaks of divergence and determinism confirm the presence of regimes and transitions in the dynamics of ENSO and influenza (Figures 9F–J). The highly statistically significant difference between the distributions of determinism and divergence of ENSO and influenza and their surrogate time series indicate these observations are not random. Thus, the annual oscillatory components of ENSO and influenza follow quasi-periodic route to chaos.
Joint recurrence plot assesses the probability that similar points in phase space are visited by two chaotic dynamics, which are from physically different time series (Marwan et al., 2007). Figures 10A–E, which shows that joint recurrence plots of ENSO and influenza in five regions have similar line structures as recurrence plots of ENSO and influenza, indicate that the phase spaces of both systems are similar. Global clustering and average path length, which are metrics of network analysis, have been used to detect transitions in chaotic dynamics (Donner et al., 2011; Zou et al., 2012). Global clustering coefficient () is the mean of the local clustering coefficient of all vertices, while average path length () is the mean geodesic distance between all pairs of vertices where paths exist (Donner et al., 2011; Zou et al., 2012). Global clustering coefficient is high during unstable periodic orbits, while the average path length is high during chaotic regimes. These metrics indicate that quasi-periodic and chaotic transitions are also present in joint recurrence of ENSO and influenza (Figures 10F–J). The highly statistically significant differences between the distributions of global clustering and average path length metrics of ENSO and influenza compared with surrogate time series indicate that the observations are not random. Thus, the trajectories of annual oscillatory components of ENSO and influenza run in similar geometrical phase space.
Severity of seasonal influenza epidemics vary interannually from mild to severe (Doshi, 2008; Frieden et al., 2010) even when the circulating influenza virus strains are unchanged. Seasonal influenza epidemics in the USA was moderately severe in 2003–2004 and 2007–2008, moderate in 2002–2003, but mild in 2011–2012 (Bresee and Hayden, 2013). The virulent H3N2 influenza virus, which circulated during the moderately severe seasons of 2007–2008 and the mild season of 2011–2012 (Bresee and Hayden, 2013), show that virulence is not the only determinant of severity. Five most severe peaks of influenza epidemics which map to chaotic regime of ENSO and influenza joint recurrence indicate that the most severe influenza epidemics occur during chaos (Figures 10A–E). Thus, chaotic regime has greater impact on seasonal influenza epidemics than quasi-periodic regimes.
Synchronization of ENSO and Influenza Dynamics
Synchronization occurs when oscillating systems adjust to a common rhythm due to coupling (Pikovsky et al., 2001). Although two chaotic oscillators with similar initial conditions diverge exponentially and become uncorrelated, chaotic dynamics like Lorenz and Rössler systems have been shown to adjust to common rhythm. Synchronization of chaotic oscillators occurs when a property of their motion, like phase or amplitude, adjusts to common behavior due to coupling or forcing such that their trajectories evolve in a common phase (Boccaletti et al., 2002). The cross correlation index (CPR), which compares the probability P(ϵ)(τ) that the trajectory returns to ϵ-neighborhood of a previous point on the trajectory, shows that the annual oscillatory components of ENSO and influenza are phase coherent during quasi-periodic and chaotic regimes in five regions in northern and southern hemispheres (Figures 11F–J). The highly statistically significant differences between the distributions CPR index compared with null values indicate that the observations are not random. Thus, ENSO and influenza dynamics are phase coherent in northern and southern hemispheres.
Synchronization is unidirectional, when one oscillator drives the other, but bidirectional when both oscillators adjust to a common manifold (Pikovsky et al., 2001). The concept of temporal precedence of time series was developed by Wiener, who proposed in 1956 that if prediction of a time series X by its past values is improved by the past values of another time series Y, then time series Y has causal influence on time series X (Wiener, 1956). Granger's formulation of this concept as autoregression models led to the Wiener-Granger causality (Granger, 1969). The trajectories of causally related dynamic systems share the same attractor manifold (Deyle and Sugihara, 2011). If time series x(t) causally influences time series y(t), the signature of x(t) exists in y(t) (Sugihara et al., 2012). Historical values of y(t) can, therefore, be used to estimate x(t). Convergent cross mapping compares the coordinates of reconstructed manifolds Mx and My for correspondence to determine if signature of x(t) exists in y(t) (Sugihara et al., 2012). If the average correlation between x(t) and its estimated values x(t) is high, it is concluded that there is sufficient information of x(t) in y(t) (Sugihara et al., 2012). Wiener-Granger causality, which is applicable to dynamic systems that are separable and have non-zero entropy rate is, therefore, not applicable to coupled non-linear dynamic systems, which contain information about each other and are not separable. Comparison of the reconstructed manifolds of annual oscillatory components of ENSO and influenza in North America region, which show statistically significant signature of ENSO in influenza but not vice versa, indicate unidirectional causal effect of ENSO on influenza (Figure 12A). Convergence, a necessary condition for causation (Sugihara et al., 2012), is fulfilled by the improved cross-mapped estimates as the length of time series increased (Figure 12A). Statistically significant signature of annual oscillatory component of ENSO in influenza, which is also present in South America, Europe, Asia, and Oceania regions, indicate that ENSO has unidirectional dynamic causal relationship with influenza in disparate regions of northern and southern hemispheres (Figures 12B–E). Thus, seasonality of influenza epidemics is driven by the dynamics of ENSO, although biological causation is due to viruses, while impaired immunity and overcrowding, which are contributory causes, are also induced by climate.
Conclusions
Influenza epidemics, which occur from fall to spring, but peak during the winter in disparate regions of northern and southern hemispheres, indicate strong coupling of occurrence to season cycles. The periodicities of fast and slow oscillatory components of ENSO is in keeping with the multiple timescales that ENSO modulates climate. Similarity of the periodicities of oscillatory components of ENSO and influenza oscillatory components indicate comparable dynamics of both systems. Strong coupling of instantaneous amplitudes and frequencies of ENSO and influenza annual oscillatory components indicate coherence of amplitude and frequency modulations.
Dissipative dynamics of ENSO and influenza, which have multifractal chaotic attractors, explain the irregularity of El Niño events and inter-annual variations of severity of influenza epidemics. Line structures of ENSO and influenza recurrence is similar to those of chaos models. There is phase coherence of ENSO and influenza trajectories, but ENSO has unidirectional dynamic causality relationship with influenza. Severity of influenza epidemic is higher during chaotic than quasi-periodic regimes. Currently surveillance for novel strains of influenza viruses is the main paradigm of public health strategy to control seasonal epidemics. Since circulating virulent strains do not always cause severe seasonal epidemics, monitoring the dynamics of ENSO, the main environmental determinant of seasonal changes in occurrence, should increase accuracy forecasts.
Author Contributions
The corresponding author is responsible for the concept, design, data collection, management and analysis, and writing the manuscript.
Conflict of Interest Statement
The author declares that the research was conducted in the absence of any commercial or financial relationships that could be construed as a potential conflict of interest.
Acknowledgments
Useful discussions with Professor Danilo Mandic, Drs Apit Hemakom, and Dmitriy Afanasyev with respect to empirical mode decomposition algorithm is appreciated. Dr. Jonathan Donges is appreciated for assistance which clarified usage of Python's pyunicorn package.
References
An, S., and Jin, F. F. (2011). Linear solutions for the frequency and amplitude modulation of ENSO by the annual cycle. Tellus A 63, 238–243. doi: 10.1111/j.1600-0870.2010.00482.x
An, S., and Wang, B. (2000). Interdecadal change of the structure of the ENSO mode and its impact on the ENSO frequency. J. Clim. 13, 2044–2055. doi: 10.1175/1520-0442(2000)013<;2044:ICOTSO>;2.0.CO;2
Argyris, J., Faust, G., and Haase, M. (1993). Route to chaos and turbulence. A computational introduction. Phil. Trans. R. Soc. Lond. 344, 207–234. doi: 10.1098/rsta.1993.0088
Ausloos, M., and Ivanova, K. (2001). Power-law correlations in the southern-oscillation-index fluctuations characterizing El Niño. Phys. Rev. E. Stat. Nonlin. Soft Matter Phys. 63 (4 Pt 2):047201. doi: 10.1103/PhysRevE.63.047201
Barnett, A. (2007). Test of Nonlinearity. Available online at: https://in.mathworks.com/matlabcentral/fileexchange/16062-test-of-non-linearity/content/boottime.m (visited on 10/26/2016).
Battisti, D., and Hirst, A. C. (1989). Interannual Variability in a tropical atmosphere-ocean model: influence of the basic state, ocean geometry and nonlinearity. J. Atmos. Sci. 46, 1687–1712. doi: 10.1175/1520-0469(1989)046<;1687:IVIATA>;2.0.CO;2
Bjerknes, J. (1969). Atmospheric teleconnections from the equatorial Pacific. Mon. Weather Rev. 97, 163–172. doi: 10.1175/1520-0493(1969)097<;0163:ATFTEP>;2.3.CO;2
Boashash, B. (1992). Estimating and interpreting the instantaneous frequency of a signal. I. Fundamentals. Proc. IEEE 80, 520–538.
Boccaletti, S., Kurths, J., Osipov, G., Valladares, D. L., and Zhou, C. S. (2002). The synchronization of chaotic systems. Phys. Rep. 366, 1–101. doi: 10.1016/S0370-1573(02)00137-0
Bresee, J., and Hayden, F. G. (2013). Epidemic influenza-responding to the expected but un- predictable. N. Engl. J. Med. 368, 589–592. doi: 10.1056/NEJMp1300375
Campanharo, A. S. L. O., Sirer, M. I., Malmgren, R. D., Ramos, F. M., and Amaral, L. A. N. (2011). Duality between time series and networks. PLoS ONE 6:e23378. doi: 10.1371/journal.pone.0023378
Cane, M. A. (1986). El Niño. Ann. Rev. Earth Planet Sci. 14, 43–70. doi: 10.1146/annurev.ea.14.050186.000355
Cao, L. (1997). Practical method for determining the minimum embedding dimension of a scalar time series. Phys. D Nonlin. Phenom. 110, 43–50. doi: 10.1016/S0167-2789(97)00118-8
Caviedes, C. N. (2007). “Impacts of El Nino-Southern Oscillation on natural and human systems,” in The Physical Geography of South America, eds T. T. Veblen, K. R. Young, and A. R. Orme (New York, NY: Oxford University Press), 305–321.
Chen, X. Y., and Huang, N. E. (2010). The Time-dependent intrinsic correlation based on the empirical mode decomposition. Adv. Adapt. Data Anal. 2, 233–265. doi: 10.1142/S1793536910000471
Daubechies, I., Lu, J., and Wu, H. T. (2011). Synchrosqueezed wavelet transform: an empirical mode decomposition-like tool. Appl. Comput. Harmon. Anal. 30, 243–261. doi: 10.1016/j.acha.2010.08.002
Deyle, E. R., and Sugihara, G. (2011). Generalized theorems for nonlinear state space reconstruction. PLoS ONE 6:e18295. doi: 10.1371/journal.pone.0018295
Donges, J. F., Donner, R. V., Trauth, M. H., Marwan, N., Schellnhuber, H.-J., and Kurths, J. (2011). Nonlinear detection of paleoclimate-variability transitions possibly related to human evolution. Proc. Natl. Acad. Sci. U.S.A. 108, 20422–20427. doi: 10.1073/pnas.1117052108
Donner, R. V., Heitzig, J., Donges, J. F., Zou, Y., Marwan, N., and Kurths, J. (2011). The geometry of chaotic dynamics - a complex network perspective. Eur. Phys. J. 84, 653–672. doi: 10.1140/epjb/e2011-10899-1
Doshi, P. (2008). Trends in recorded influenza mortality: United States, 1900–2004. Am. J. Public Health 98, 939–945. doi: 10.2105/AJPH.2007.119933
Eckmann, J. P., Kamphorst, S. O., and Ruelle, D. (1987). Recurrence plots of dynamical systems. Europhys. Lett. 4, 973–977. doi: 10.1209/0295-5075/4/9/004
Elsner, J. B., and Tsonis, A. A. (1993). Nonlinear dynamics established in the ENSO. Geophys. Res. Lett. 20, 213–216. doi: 10.1029/93GL00046
Frieden, T. R., Jaffe, H. W., Stephens, J. W., and Thacker, S. B. (2010). Estimates of deaths associated with seasonal influenza United States, 1976–2007. MMWR 59, 1058–1089.
Furhmann, C. (2010). The effects of weather and climate on the seasonality of influenza: what we know and what we need to know. Geography. Compass. 7, 718–730. doi: 10.1111/j.1749-8198.2010.00343.x
Gao, J., and Cai, H. (2000). On the structures and quantificaton of recurrence plots. Phys. Lett. A 270, 75–87. doi: 10.1016/S0375-9601(00)00304-2
Gneiting, T., Sevcikova, H., and Perciva, D. B. (2012). Estimators of fractal dimension: assessing the roughness of time and spatial data. Stat. Sci. 27, 247–277. doi: 10.1214/11-STS370
Granger, C. W. J. (1969). Investigating causal relations by econometric models and cross- spectral methods. Econometrica 37, 424–438. doi: 10.2307/1912791
Grebogi, C., Ott, E., and Yorke, J. A. (1987). Chaos, strange attractors, and fractal basin boundaries in nonlinear dynamics. Science 238, 632–638. doi: 10.1126/science.238.4827.632
Huang, N. E., Shen, Z., Long, S. R., Wu, M. C., Shih, H. H., Zheng, Q., et al. (1998). The empirical mode decomposition and the Hilbert spectrum for nonlinear and nonstationary time series analysis. Proc. R. Soc. Lond. A 454, 903–905. doi: 10.1098/rspa.1998.0193
Huang, Y., and Schmitt, F. G. (2014). Time dependent Intrinsic correlation analysis of tem- perature and dissolved oxygen time series using empirical mode decomposition. J. Mar. Sys. 130, 90–100. doi: 10.1016/j.jmarsys.2013.06.007
Ihlen, E. (2012). Multifractal Detrended Fluctuation Analyses. Available online at: https://www.mathworks.com/matlabcentral/fileexchange/38262-multifractal-detrended-fluctuation-analyses/content/Introduction_to_MFDFA4/MFDFA1.m (visited on 10/26/2016).
Jin, F. F. (1997). An equatorial ocean recharge paradigm for ENSO. Part 1: Conceptual Model. J. Atmos. Sci. 54, 811–829. doi: 10.1175/1520-0469(1997)054<;0811:AEORPF>;2.0.CO;2
Jin, F. F., Neelin, J. D., and Ghil, M. (1994). El Nino on the Devil's staircase: annual subharmonic steps to chaos. Science 264, 70–72. doi: 10.1126/science.264.5155.70
Julian, P. R., and Chervin, R. M. (1978). A study of the southern oscillation and Walker circulation Phenomenon. Mon. Weather Rev. 106, 1433–1451. doi: 10.1175/1520-0493(1978)106<;1433:ASOTSO>;2.0.CO;2
Kantelhardt, J. W., Zschiegner, S. A., Koscielny-Bunde, E., Havlin, S., Bunde, A., and Stanley, H. E. (2002). Multifractal detrended Fluctuation analysis of nonstationary time series. Phys. A 316, 87–114. doi: 10.1016/S0378-4371(02)01383-3
Kantz, H., and Schreiber, T. (2003). Nonlinear Time Series Analysis. Cambridge, UK: Cambridge University Press.
Kessler, W. S., Rothstein, L. M., and Chen, D. (1998). Annual cycle of SST in the Eastern tropical Pacific, diagnosed in an ocean GCM. J. Clim. 11, 777–799. doi: 10.1175/1520-0442(1998)011<;0777:TACOSI>;2.0.CO;2
Leontitsis, A. (2004). Chaotic Systems Tootbox. Available online at: https://in.mathworks.com/matlabcentral/fileexchange/1597-chaotic-systems-toolbox/content/AAFT.m (visited on 10/26/2016).
Lindsley, W. G., Blachere, F. M., Thewlis, R. E., Vishnu, A., Davis, K. A., Cao, G., et al. (2010). Measurements of airborne influenza virus in aerosol particles from human coughs. PLoS ONE 5:e15100. doi: 10.1371/journal.pone.0015100
Liu, Z., Lu, Z., Wen, X., Otto-Bliesner, B. L., Timmermann, A., and Cobb, K. M. (2014). Evolution and forcing mechanisms of El-Niño over the past 21,000 years. Nature 515, 550–553. doi: 10.1038/nature13963
Lowen, A. C., Mubareka, S., Steel, J., and Palese, P. (2007). Influenza virus transmission is dependent on relative humidity and temperature. PLoS Pathog 3:e151. doi: 10.1371/journal.ppat.0030151
Mandelbroit, B. (1989). Fractal geometry: what is it, and what does it do? Proc. R. Soc. Lond. 423, 3–16. doi: 10.1098/rspa.1989.0038
Mandelbroit, B., and van Ness, J. W. (1968). Fractional Brownian motions, fractional noises and applications. SIAM Rev. 10, 422–437. doi: 10.1137/1010093
Martinerie, J. M., Albano, A. M., Mees, A. I., and Rapp, P. E. (1992). Mutual information, strange attractors, and the optimal estestimate of dimension. Phys. Rev. A 45, 7059–7064. doi: 10.1103/PhysRevA.45.7058
Marwan, N. (2011). How to avoid potential pitfalls in recurrence plot based data analysis. Int. J. Bifurcat. Chaos 21, 1003–1017. doi: 10.1142/S0218127411029008
Marwan, N., Romano, M. C., Thiel, M., and Kurths, J. (2007). Recurrence plots for the analysis of complex systems. Phys. Rep. 438, 237–329. doi: 10.1016/j.physrep.2006.11.001
Marwan, N., Wessel, N., Meyerfeldt, U., Schirdewan, A., and Kurths, J. (2002). Recurrence-plot-based measures of complexity and their application to heart-rate-variability data. Phys. Rev. E. Stat. Nonlin. Soft Matter Phys. 66:026702. doi: 10.1103/PhysRevE.66.026702
Mazzarella, A., and Giuliacci, A. (2009). The El Niño events: their classification and scale- invariance laws. Ann. Geophys. 52, 517–522.
McPhaden, M. J. (1999). Genesis and evolution of the 1997-98 El Nino. Science 283, 950–954. doi: 10.1126/science.283.5404.950
Mukhin, D., Gavrilov, A., Feigin, A., Loskutov, E., and Kurths, J. (2015). Principal nonlinear dynamical modes of climate variability. Sci. Rep. 5:15510. doi: 10.1038/srep15510
National Oceanic and Atmospheric Administration (2015a). MEI-Ext. Available online at: https://www.esrl.noaa.gov/psd/enso/mei.ext/table.ext.html (visited on 07/10/2015).
National Oceanic and Atmospheric Administration (2015b). Oceanic Nino Index. Available online at: http://ggweather.com/enso/oni.htm
Oluwole, O. S. A. (2015). Seasonal Influenza Epidemics and El Ninos. Front. Public Health 3:250. doi: 10.3389/fpubh.2015.00250
Oluwole, O. S. A. (2016). Waves of El Nino-Southern Oscillation and Influenza Pandemics. Front. Environ. Sci. 4:25. doi: 10.3389/fenvs.2016.00025
Packard, N., Crutchfield, J., Farmer, J., and Shaw, R. (1980). Geometry from a time series. Phys. Rev. Lett. 45, 712–716. doi: 10.1103/PhysRevLett.45.712
Philander, S. G. H. (1985). El Niño and La Niña. J. Atmos. Sci. 42, 2652–2662. doi: 10.1175/1520-0469(1985)042<;2652:ENALN>;2.0.CO;2
Pikovsky, A., Rosenblum, M., and Kurths, J. (2001). Synchronization: A Universal Concept in Nonlinear Sciences. Cambridge, UK: Cambridge University Press.
Rasmusson, E. M., and Carpenter, T. H. (1982). Variations in tropical sea surface temperature and surface wind associated with the southern oscillation/El Nino. Mon. Weather Rev. 110, 358–384. doi: 10.1175/1520-0493(1982)110<;0354:VITSST>;2.0.CO;2
R Core Team (2016). R: A Language and Environment for Statistical Computing. Version 3.3.2. Vienna: R Foundation for Statistical Computing.
Rehman, N., and Mandic, D. P. (2010a). Multivariate empirical mode decomposition. Proc. R. Soc. Lond. A Math. Phys. Eng. Sci. 466, 1291–1302. doi: 10.1098/rspa.2009.0502
Rehman, N., and Mandic, D. P. (2010b). Multivariate Empirical Mode Decomposition. Available online at: http://www.commsp.ee.ic.ac.uk/?mandic/research/memd/memdversion2.zip (visited on 10/26/2016).
Romano, M. C., Thiel, M., Kurths, J., Kiss, I. Z., and Hudson, J. L. (2005). Detection of synchro-nization for non-phase-coherent and non-stationary data. Europhys. Lett. 71, 466. doi: 10.1209/epl/i2005-10095-1
Ruelle, D., and Takens, F. (1971). On the nature of turblence. Commum. Math. Phys. 20, 167–192. doi: 10.1007/BF01646553
Shaman, J., Pitzer, V. E., Viboud, C., Grenfell, B. T., and Lipsitch, M. (2010). Absolute humidity and the seasonal onset of influenza in the continental United States. PLoS Biol. 8:e1000316. doi: 10.1371/journal.pbio.1000316
Sheinbaum, J. (2003). Current theories on El Nino-Southern Oscillation: a review. Geofis. Int. 42, 291–305.
Stuecker, M. F., Jin, F. F., and Timmermann, A. (2015). El Niño-southern oscillation frequency cascade. Proc. Natl. Acad. Sci. U.S.A. 112, 13490–13495. doi: 10.1073/pnas.1508622112
Sugihara, G., May, R., Ye, H., Hsieh, C., Deyle, E., Fogarty, M., et al. (2012). Detecting causality in complex ecosystems. Science 338, 496–500. doi: 10.1126/science.1227079
Thornley, J. H. M., and France, J. (2012). Dynamic of single-city influenza with seasonal forcing: from regularity to chaos. ISRN Biomath. 2012:471653. doi: 10.5402/2012/471653
Timmermann, A., Jin, F.-F., and Abshagen, J. (2003). A nonlinear theory for El Niño bursting. J. Atmos. Sci. 60, 152–165. doi: 10.1175/1520-0469(2003)060<;0152:ANTFEN>;2.0.CO;2
Torrence, C., and Compo, G. P. (1998). A Practical guide to wavelet analysis. Bull. Am. Meteor. Soc. 79, 61–78. doi: 10.1175/1520-0477(1998)079<;0061:APGTWA>;2.0.CO;2
Torrence, C., and Webster, P. J. (1999). Interdecadal changes in the ENSO-Monsoon System. J. Clim. 12, 2679–2690. doi: 10.1175/1520-0442(1999)012<;2679:ICITEM>;2.0.CO;2
Tziperman, E., Stone, L., Cane, M. A., and Jarosh, H. (1994). El Nino chaos: overlapping of resonances between the seasonal cycle and the Pacific ocean-atmosphere oscillator. Science 264, 72–74. doi: 10.1126/science.264.5155.72
Vallis, G. K. (1986). El Niño: a chaotic Dynamic System? Science 232, 243–245. doi: 10.1126/science.232.4747.243
van Rooij, M. J. W., Nash, B. A., Rajaraman, S., and Holden, J. G. (2013). A fractal approach to dynamic inference and distribution analysis. Front. Physiol. 4:1. doi: 10.3389/fphys.2013.00001
Wiener, N. (1956). Nonlinear dynamics prediction. Proc. Third Berkeley Symp. Math. Statist. Prob. 3, 247–252.
Wolf, R., Swift, J. B., Swinney, H. L., and Vastano, J. A. (1985). Determining Lyapunov exponents from a time series. Physica 16D, 285–317. doi: 10.1016/0167-2789(85)90011-9
Wolter, K., and Timlin, M. S. (1998). Measuring the strength of ENSO events: how does 1997/98 rank? Weather 53, 315–324. doi: 10.1002/j.1477-8696.1998.tb06408.x
World Health Organization (2015). Influenza Surveillance Report. Available online at: https://extranet.who.int/sree/Reports?op=vs&path=/WHO_HQ_Reports/G5/PROD/EXT/Influenza%20Surveillance+Report+by+Country.
Keywords: El Niño, influenza, epidemic, pandemic, chaos, attractor, fractals, turbulence
Citation: Oluwole OSA (2017) Deterministic Chaos, El Niño Southern Oscillation, and Seasonal Influenza Epidemics. Front. Environ. Sci. 5:8. doi: 10.3389/fenvs.2017.00008
Received: 30 December 2016; Accepted: 27 February 2017;
Published: 15 March 2017.
Edited by:
Yuhua Duan, National Energy Technology Laboratory (DOE), USAReviewed by:
Tianzhou Wu, Centers for Disease Control and Prevention, USARaul Isea, Fundaciòn Instituto de Estudios Avanzados IDEA, Venezuela
Copyright © 2017 Oluwole. This is an open-access article distributed under the terms of the Creative Commons Attribution License (CC BY). The use, distribution or reproduction in other forums is permitted, provided the original author(s) or licensor are credited and that the original publication in this journal is cited, in accordance with accepted academic practice. No use, distribution or reproduction is permitted which does not comply with these terms.
*Correspondence: Olusegun S. A. Oluwole, b3Nhb2x1d29sZUBob3RtYWlsLmNvbQ==