 Yi Zeng
 Shuang Wang
 Jiaping Luan
 Min Yu2
- 1College of Information Science, Beijing Forestry University, Beijing, China
- 2College of Forestry, Beijing Forestry University, Beijing, China
The forest ecosystem is the largest land vegetation type, which plays the role of unreplacement with its unique value. And in the landscape scale, the research on forest landscape pattern has become the current hot spot, wherein the study of forest canopy structure is very important. They determines the process and the strength of forests energy flow, which influences the adjustments of ecosystem for climate and species diversity to some extent. The extraction of influencing factors of canopy structure and the analysis of the vegetation distribution pattern are especially important. To solve the problems, remote sensing technology, which is superior to other technical means because of its fine timeliness and large-scale monitoring, is applied to the study. Taking Lingkong Mountain as the study area, the paper uses the remote sensing image to analyze the forest distribution pattern and obtains the spatial characteristics of canopy structure distribution, and DEM data are as the basic data to extract the influencing factors of canopy structure. In this paper, pattern of trees distribution is further analyzed by using terrain parameters, spatial analysis tools and surface processes quantitative simulation. The Hydrological Analysis tool is used to build distributed hydrological model, and corresponding algorithm is applied to determine surface water flow path, rivers network and basin boundary. Results show that forest vegetation distribution of dominant tree species present plaque on the landscape scale and their distribution have spatial heterogeneity which is related to terrain factors closely. After the overlay analysis of aspect, slope and forest distribution pattern respectively, the most suitable area for stand growth and the better living condition are obtained.
Introduction
Forest landscape takes the forest ecosystem as the subject and the research on forest landscape can reveal basic laws and provide guiding theories for monitoring forest resource. The classification of forest landscape can determine its elements and distribution pattern, which is the foundation of discussing integration problems of forest ecosystem in large scale. However, the study on forest canopy is very important in the researching process of forest landscape (Zhao et al., 2013). Forest canopy is the main layer of forest photosynthesis which acts as the interface of energy flow and material exchange between forest and outside world. The canopy structure, which is one of the important factors that influence forest local climate, determines the process and the strength of energy flow of the forest (Chen, 1997). The characteristic of canopy distribution can influence total effective light intensity in different heights and understory strongly, and it has significant influence on understory biodiversity. Studying the forest distribution pattern with the help of technical means is an important issue in forest management and biodiversity conservation, which is also the most challenging problem (Kong et al., 2011; Du et al., 2013).
With the development of remote sensing technology, high spatial resolution satellite remote sensing data, which contains more detailed information, has become available. The QuickBird data, which are of high resolution, are used to classify the forest vegetation in our study. However, there are many factors that must be took into consideration, including the composition of arborous layer, stand structure and density, illumination, terrain, soil and human disturbance etc when analyzing the complexity of canopy structure and the composition of understory community (Chen and Huang, 1997), which are vital to the later study.
Over the researches of vegetation distribution pattern at home and abroad, there are two methods that are used to classify the vegetation. The information, obtained by traditional methods, such as manual field observation and statistical analysis, are abundant and precise. In order to analyze the temporal and spatial variation of peatland ecosystems, the Institute of Forest Science, Russian Academy of Sciences, made the field survey and used the measured data to establish the GIS database of peatland ecosystems (Vompersky et al., 2011). For the classification of wetland in Changbai Mountain Nature Reserve, Lu made field survey to assure the distribution of forest wetland (Lu, 2010). However, the labor intensity of traditional methods which need lots of human and material resources is great, and it can't meet the demand in information age.
Compared to traditional methods, the method that uses remote sensing data and GIS tools has advantages such as scientific nature and timeliness. When the method is used to analyze vegetation distribution pattern, useful and detailed information can be obtained quickly and precisely. In order to get the large-scale spatial distribution pattern of species diversity in arbor layer, Zhang et al. combined remote sensing images with GIS tools to establish and verify the inversion model for the tree layer species diversity, and studied the distribution pattern in the tree layer in montane regions of eastern Liaoning Province of China (Zhang et al., 2009). Xu made the detailed research on spatial dynamic variation of forest vegetation pattern in Chongqing with the help of technical means including remote sensing and GIS tools, which had significance on the operation and management of vegetation (Xu, 2012). However, the above studies using remote sensing and GIS tools don't put particular emphasis on the analysis of spatial characteristics of canopy structure distribution and the extraction of relevant factors. In addition, the previous studies don't conduct much result on the extraction of terrain factors and hydrological factors.
The primary focus of this study was to explore the spatial characteristics of canopy structure distribution and the relationship between terrain factors and vegetation pattern. In our approach, the Lingkong Mountain was taken as the study area, and pretreatment is carried on QuickBird remote sensing image with geometrical rectification and other-rectification. The QuickBird image is used to analyse forest distribution pattern, and the forest species and spatial distribution characteristic were carried out through the object-oriented classification method. Then paper discusses the approach to extract terrain factors based on DEM data, and GIS spatial analysis and surface processes quantitative simulation. The Hydrological Analysis tool is used to build distributed hydrological model, and corresponding algorithm is applied to determine surface water flow path, rivers network and basin boundary.
In the process of the research, in order to avoid the disadvantages of pixel-based classification, we chose the object-oriented classification method combining spatial features and spectral features. The multi-adjacent homogeneous pixel geometry is used as the processing unit, and the ENVI EX software is used to extract the features of the high-resolution image. Finally, the accurate and reasonable classification results are obtained.
The study uses overlay analysis, and combines the above data with environmental factors to analyse and summarize the results. Our results indicate that the tree species distribution of the study area presents spatial heterogeneity in landscape scale which is related to terrain factors closely, which has a practical significance on forest management and biodiversity conservation.
Stand Information Extraction
The Study Area
The study site is located in Lingkong forest region of Taiyue forest farm, Qinyuan County, Shanxi Province with the east longitude is 112°01′–112°15′and the north latitude is 36°31′–36°43′, with temperate continental monsoon climate. There are four distinctive seasons. The digital remote sensing image is shown in Figure 1. Annual average temperature is 8°C, accumulated temperature is 2,542°C, average annual precipitation amount is 662 mm, the range of frostless season days is from 110 to 125 days. The west is higher than the east and the range of vertical distribution is from the elevation of 1,150 to 2,088 m. The soil is leaching cinnamon that grows in Limestone rock with medium thick. PH value is 6.7. The area is semi-arid Chinese pine-Liaodong oak mixed forest with warm temperate zone whose business area is 4,931 hm2. The main tree species are Chinese pine, Liaodong oak, birch, echinoderms, birch, and aspen.
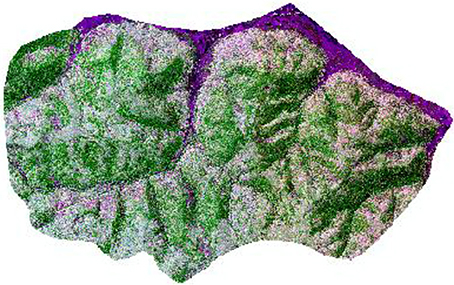
Figure 1. The remote sensing image of study area under the merging methods of principal component transform.
The Classification Method
Remote sensing image classification can be divided into two categories including object-based classification and pixel-based classification. Traditional pixel-based classification, including hierarchical clustering, maximum likelihood, support vector machine model and neural network model, is based on pixel spectral values. With the extensive application of high resolution images, the defects of pixel-based classification are obvious increasingly, including that it only uses spectral information but neglects abundant geometric information and texture information (Yin et al., 2013). Moreover, the results of classification have undergone severe fragmentation and go against with the later spatial analysis (Zhang et al., 2010). Object-oriented classification bases on objects and it uses spatial characteristic and spectral characteristic to classify different objects.
Object-oriented classification takes several adjacent homogeneous pixel collections as processing unit and analyses the properties of high resolution images such as spectrum, geometry, texture and space comprehensively, and the classification results are accurate and reasonable. The QuickBird image in the study is of high spatial resolution, in which the geometric features, texture features are more abundant compared with the low resolution images, so the study chooses object-oriented classification to achieve feature extraction with ENVI EX software. The processes are shown in Figure 2.
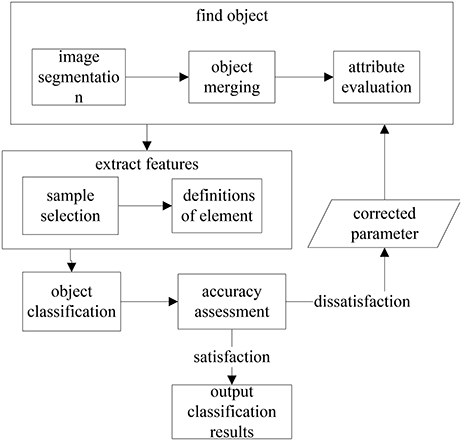
Figure 2. Object-oriented classification method.
The Operation Steps
Our study first establishes mask in Select Addition Files framework, and sets segmentation scale parameters. After several experiments (scale parameters are set to 30, 35, 40, 45, 50, 55, and 60, respectively), when the scale parameter is set to 40, the classification result is better than that with other parameters. Furtherly the approach selects calculation properties, classification method, samples and support vector algorithm. The processes are shown in Figure 3.
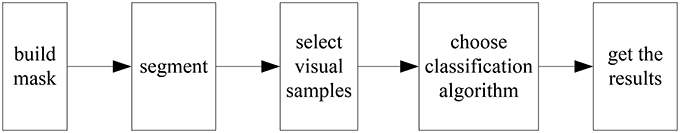
Figure 3. The operation steps of remote sensing images classification based on object.
The geometric and topological information provided by objects provides the possibility to establish specific classification rules. The establishment of object hierarchy structure provides a good classification platform for ground objects in different map spots. The dominant tree species in the study area are Chinese pine, Liaodong oak and Chinese pine- Liaodong oak mixed forest, and our study establishes corresponding classification rules. The results are shown in Figure 4.
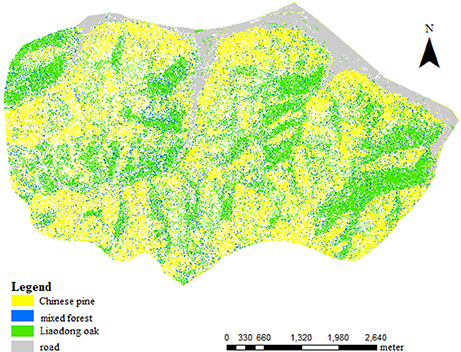
Figure 4. The result of object-oriented classification.
Through the statistical analysis of different stand patch numbers and area, the results are concluded that the area of Liaodong oak is 1.06 km2 which takes up 59% of the stand area; the area of Chinese pine is 0.27 km2 which takes up 15% of the stand area; the area of mixed forest is 0.45 km2 which takes up 25% of the stand area. From the research on tree species classification using remote sensing images and analysis of stand information, the canopy distribution of Lingkong Mountain is shown in spots, while the species distribution of single stand type is with a plaque and continuous. The stand canopy of dominant species that include Chinese pine, Liaodong oak and Chinese pine- Liaodong oak mixed forest has the characteristic of spatial heterogeneity. The growth agglomeration effect of Liaodong oak forest is apparent, while both the patch fragmentation index and agglomeration effect of the other two forests are similar.
The Extraction of Terrain Factors
Extraction Method
The process of extracting information through DEM mainly consists of two parts: one is the extraction of terrain information; the other is the extraction of hydrological information. With the DEM as basic data, using ArcGIS can extract varieties of terrain factors including slope and aspect, slope variability, variability slope, curvature and profile curvature plane in microscopic scales, and land surface roughness, relief amplitude, variation coefficient in elevation and cutting depth of terrain in macroscopic scales. Compared with the extraction based on traditional topographic map, using high-precision DEM is more convenient and the accuracy is higher (Liu and Wang, 2004; Jiang, 2008).
In accordance with the difference in DEM data structure, using DEM to extract terrain features can be divided into grid-based, TIN-based and digital contour-based while grid-based is used widely, and it is also used in our study. Data conversion and grid computing module in ArcGIS provide great convenience for the study. This study mainly uses the ArcMap. 3D Analyst toolset is mainly used for data conversion and Spatial Analyst Tools are used for hydrological analysis, surface analysis and grid computing. Data management tools are used for coordinate transformation and projective transformation.
The factors being extracted are shown in Table 1.
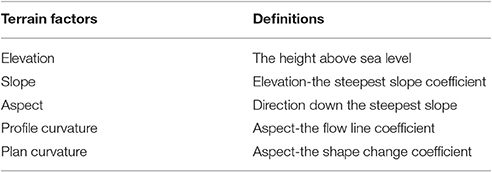
Table 1. Terrain factor parameters.
The important data of stand canopy research include:
(1) Slope
Ground slope (the slope) is a quantitative description of the degree of tilt which is also a basic indicator of landform. By affecting the gravity, slope affects surface runoff, the occurrence and intensity of soil erosion and soil and water conservation layout. Slope represents the degree of tilt of local surface which is an important factor that constrains productivity spatial distribution, and the slope size influences the scale and intensity of surface material flow and energy conversion directly. The slope of the ground surface at any point refers to the angle between tangent plane and horizontal ground.
(2) Aspect
Aspect is defined as projection along of normal direction in the horizontal plane which is one of the important terrain factors that determine local ground receiving sunlight and redistribute solar radiation. Aspect can cause the differences in local climate characteristics directly and affect a number of important agricultural production indexes such as soil moisture, ground frost and crop suitability degree (Li et al., 2004). Slope and aspect have close relationship.
(3) Profile curvature and plane curvature
Curvature of ground is a quantitative measurement factor of distortion degree of terrain surface change which is called profile curvature in vertical direction and plan curvature in horizontal direction. The profile curvature is the measure of the change rate of ground elevation. The plan curvature refers to the curvature value of the point on the terrain surface which describes the degree of bend of ground contours.
Processing Steps
As for the extraction of terrain factors, data pretreatment is very important. Since the resolution, coordinates, scale of DEM can affect extraction results from a very large extent, the data processing of DEM is important to the final results. For every terrain factor needed to be extracted, there are many methods. Using which method can extract the terrain factors promptly, effectively and accurately is one of the research objectives. After choosing the appropriate method, the problems in the process of extraction and the solutions are mainly researched.
In accordance with the difference in DEM data structure, using DEM to extract terrain features can be divided into grid-based, TIN-based and digital contour-based while grid-based is used widely, and it is also used in the study (Tang et al., 2005). After comparison, using nature neighbors method and observation 250 to transform DEM in TIN format into raster formats is more appropriate, and the result is more intuitive and effective. The result is shown in Figure 5.
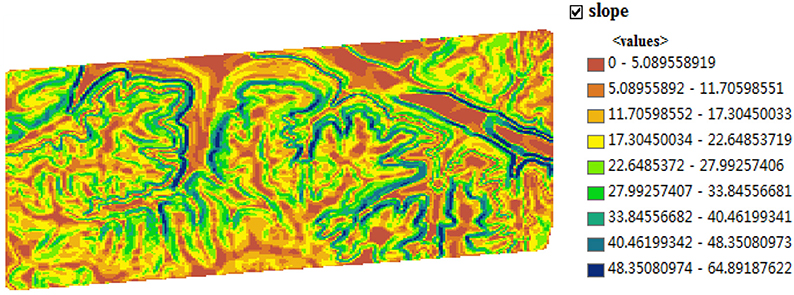
Figure 5. Slope.
Raster images that have been converted are directly used to extract slope information while most of the slopes are concentrated in the range from 87.1762489 to 90 which is unreasonable. The reason of the mistake is that the coordinate system is WGS-1984, and coordinate units on X-Y plane are degree, minute, and second, so the unit must be converted to meter, otherwise the result will be incorrect, and the average of the slope should range from 80 to 90°. The study converted to Beijing 1954 coordinate system that uses meter as unit.
The detailed extraction processes are given in Table 2.
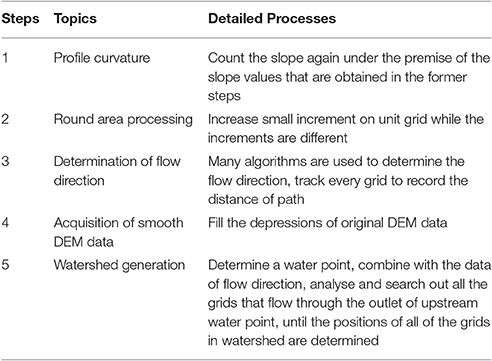
Table 2. Detailed extraction processes.
Experimental Results and Analysis
The Overlay Analysis of Slope
International Geographical Union Geomorphologic Survey and Geomorphologic Mapping Committee proposes to use six-slope classification method including plain in 0–0.5°, micro-ramp in 0.5–2°, slow ramp in 2–5°, ramp in 5–15°, and the plain in 15–35° can be divided into two parts including steep slope in 15–25° and aclinal slope in 25–35°. As can be seen from the chart, the experimental areas are mostly located in steep slope section. The result is shown in Figure 6.
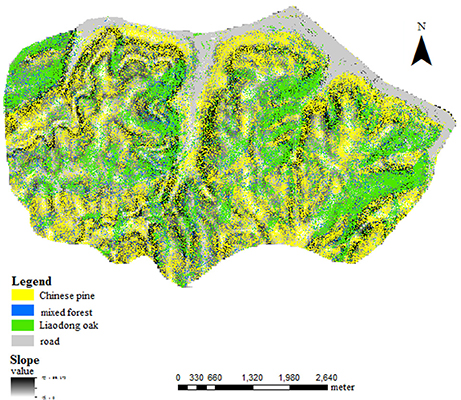
Figure 6. Slope-stand overlay chart.
After the overlay analysis, our study concludes that stand distribution concentrates between 0 and 40°, and the vegetation rarely distributes in the slope over 45°.75.16% of mixed forest, 74.87% of Liaodong oak and 72.49% of Chinese pine distributed in 10–40° which take up the most of stand distribution, so the slope between 10 and 40° is the most suitable areas for stand growth. In the situation, stand growth not only can get more resources, but also can reduce the potential human disturbance.
The Overlay Analysis of Aspect
Aspect is one of the important terrain factors that determines local ground receiving sunlight and redistribute solar radiation. Aspect can cause the differences in local climate characteristics directly and affect a number of important agricultural production indexes such as soil moisture, ground frost and crop suitability degree. The result is shown in Figure 7.
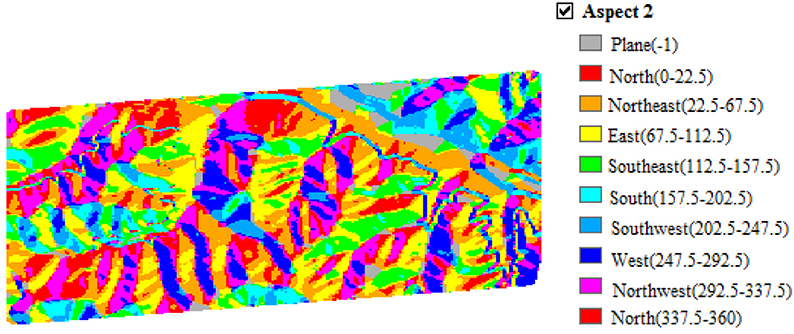
Figure 7. Aspect.
After the overlay analysis, we found that stand distribution concentrates in shady and the vegetation distributions are less in other aspects. 50.99% of mixed forest, 47.2% of Liaodong oak and 53.1% of Chinese pine distributes in shady. This may be because both species have some shade tolerance and soil moisture and nutrients in shady are better than other conditions. 49.01% of mixed forest, 52.8% of Liaodong oak and 46.9% of Chinese pine are distributed in sunny slope, half sunny slope and half shady slope. Stands are well distributed. The result is shown in Figure 8.
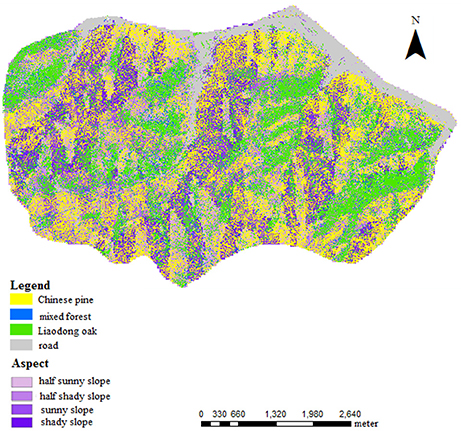
Figure 8. Aspect-stand overlay chart.
Conclusion
From the whole research, it is apparent that remote sensing and GIS are indispensable in the process of the study. With the above technologies, the analysis of the forest distribution pattern and the relationship between distribution and terrain factors on the landscape scale can be carried on better. The main conclusion in the study has been summarized as follows.
By using QuickBird images to analyze the forest distribution pattern, the spatial characteristic of the study area is determined comprehensively and efficiently. The result shows that the tree species distribution of the study area presents spatial heterogeneity in landscape scale which is related to terrain factors closely. Using ground survey data, overall classification accuracy is 82.1% compared to traditional classification method. The object-oriented classification, wherein many experiments have been done to choose the optimal segmentation parameter under which situation the result is the best, can determine the spatial characteristic of canopy structure distribution. The combination of GIS tool and high-precision DEM data is an important means of studying the effect that the terrain factors have on forest vegetation pattern. After the overlay analysis of forest distribution pattern and terrain factors, the optimum slope area of stand growth and stand distribution are obtained.
This study opens doors for further study. When analyzing forest distribution pattern, the paper focuses on researching the influence that terrain factors have on the forest distribution pattern. However, the human factors can't be ignored; therefore, the relationship between forest distribution pattern and human factors can be further studied.
Author Contributions
YZ contributed significantly to data analyses and wrote the manuscript; SW and JL helped to perform the analysis; MY contributed to design the experiment.
Conflict of Interest Statement
The authors declare that the research was conducted in the absence of any commercial or financial relationships that could be construed as a potential conflict of interest.
The reviewer YM and handling Editor declared their shared affiliation, and the handling Editor states that the process nevertheless met the standards of a fair and objective review.
Acknowledgments
This work was partially supported by the Beijing Natural Science Foundation (No. 6164038). The authors would like to express their gratitude to the funds.
References
Chen, L. Z. (1997). Biodiversity in China: Status Quo and Protectionist Policy. Beijing: Science Press.
Chen, L. Z., and Huang, J. H. (1997). The Research on the Structure and Function of Forest Ecosystems in Warm Temperate Zone. Beijing: Science Press.
Du, Z., Kang, X. G., Meng, J. H., Kong, L., Guo, W. W., and Yue, G. (2013). Spatial distribution patterns and associations of dominant tree species in Poplar-Birth secondary forest stand in Changbai Mountains. J. Northeast For. Univ. 41, 36–42. doi: 10.13759/j.cnki.dlxb.2013.04.028
Jiang, L. (2008). Research on Digital Geomorphologic Mapping Based on RS and DEM of TOnle Sap Area Cambodia. Nanjing Normal University, 4–6.
Kong, L., Yang, H., Kang, X. G., Gao, Y., and Feng, Q. X. (2011). Review on the methods of spatial distribution pattern in forest. J. Northwest A&F Univ. (Nat. Sci. Ed.) 39, 119–125. doi: 10.13207/j.cnki.jnwafu.2011.05.032
Li, T. W., Liu, X. J., and Tang, G. A. (2004). Influence of terrain complexity on slope and aspect. J. Mount. Res. 3, 272–277. doi: 10.16089/j.cnki.1008-2786.2004.03.003
Liu, X. J., and Wang, Y. F. (2004). A study of error spatial distribution of slope and aspect derived from grid DEM. Bull. Survey. Mapp. 2004, 24–28.
Lu, S. B. (2010). Study on Wetland Classification and Distribution in the Changbai Mountain Nature Reserve Based on 3S Technologie. Yanbian University.
Tang, G. A., Liu, X. J., and Wen, G. N. (2005). Principles and Methods of DEM and Geoanalysis. Beijing: China Machine Press.
Vompersky, S. E., Sinn, A. A., and Sarnikov, A. A. (2011). Estimation of forest cover extent over peatlands and paludified shallow-peat lands in Russia. Contemp. Prob. Ecol. 4, 734–741. doi: 10.1134/S1995425511070058
Xu, S. J. (2012). Vegetation dynamics, patterns and carbon sinks in Chongqing Based on RS, GIS, DEM and NDVI. Southwest University.
Yin, Z., Zhang, J. G., and Li, H. B. (2013). Application research on information extraction based on high-resolution remote sensing images using object-oriented analysis. Geomatics Spatial Inf. Technol. 36, 61–63.
Zhang, C. H., Li, W. Y., Hu, Z. B., Zhu, J. J., and Yan, Q. L. (2009). Distribution pattern of tree layers species diversity based on RS and GIS: a case study of water conservation forests in montane regions of eastern Liaoning Province of China. Chin. J. Ecol. 28, 1749–1755.
Keywords: remote sensing image, analysis of forest distribution pattern, extraction of terrain factors, object-oriented classification, DEM
Citation: Zeng Y, Wang S, Luan J and Yu M (2017) The Analysis of Tree Species Distribution Information Extraction and Landscape Pattern Based on Remote Sensing Images. Front. Environ. Sci. 5:46. doi: 10.3389/fenvs.2017.00046
Received: 10 May 2017; Accepted: 18 July 2017;
Published: 21 August 2017.
Edited by:
Peng Liu, Institute of Remote Sensing and Digital Earth (CAS), ChinaCopyright © 2017 Zeng, Wang, Luan and Yu. This is an open-access article distributed under the terms of the Creative Commons Attribution License (CC BY). The use, distribution or reproduction in other forums is permitted, provided the original author(s) or licensor are credited and that the original publication in this journal is cited, in accordance with accepted academic practice. No use, distribution or reproduction is permitted which does not comply with these terms.
*Correspondence: Yi Zeng, emVuZ3lpQGJqZnUuZWR1LmNu