 Kristin Boye
 Anke M. Herrmann
 Michael V. Schaefer
 Malak M. Tfaily
 Scott Fendorf
- 1Stanford Synchrotron Radiation Lightsource, SLAC National Accelerator Laboratory, Menlo Park, CA, United States
- 2Earth System Science, Stanford University, Stanford, CA, United States
- 3Department of Soil and Environment, Swedish University of Agricultural Sciences, Uppsala, Sweden
- 4Department of Environmental Sciences, University of California, Riverside, Riverside, CA, United States
- 5Environmental Molecular Sciences Laboratory, Pacific Northwest National Laboratory, Richland, WA, United States
Recurring dry-wet cycles of soils, such as in rice paddies and on floodplains, have a dramatic impact on biogeochemical processes. The rates and trajectories of microbial metabolic functions during transition periods from drained to flooded conditions affect the transformation rates and phase partitioning of carbon, nutrients, and contaminants. However, the regulating mechanisms responsible for diverging functional metabolisms during such transitions are poorly resolved. The chemistry of organic carbon within the microbially available pool likely holds key information regarding carbon cycling and redox transformation rates. In this study, we used mesocosms to examine the influence of different carbon sources (glucose, straw, manure, char) on microbial energetics, respiration rates, and carbon balances in rice paddy soils during the transition from drained to flooded conditions following inundation. We found that variability in carbon solubility (1.6–400 mg g−1) and chemical composition of the amendments led to non-uniform stimulation of carbon dioxide production per unit carbon added (0.4–32.9 mmol CO2 mol−1 added C). However, there was a clear linear correlation between energy release and net CO2 production rate (R2 = 0.85), between CO2 and initial soluble C (R2 = 0.91, excluding glucose treatment) and between heat output and Gibbs free energy of initial soluble C (R2 = 0.78 and 0.69, with/without glucose respectively). Our results further indicated that the chemical composition of the soluble C from amendments initiated divergent anaerobic respiration behavior, impacting methane production and the partitioning of elements between soil solid phase and solution. This study shows the benefit of monitoring energy and element mass balances for elucidating the contribution of various microbial metabolic functions in complex systems. Further, our results highlight the importance of organic carbon composition within the water soluble pool as a key driver of microbially mediated redox transformations with major impacts on greenhouse gas emissions, contaminant fate, and nutrient cycling in paddy soils and similar ecosystems.
Introduction
Microbial processes within rice paddy soils have profound impacts on crop production and the environment, ranging from changes in nutrient (e.g., N and P) and contaminant (e.g., As) availability to production and emission of greenhouse gases (GHG; e.g., CO2, CH4). Rice paddies consistently go through drainage and re-flooding between cropping cycles. Flooding of soils induce dramatic, temporary increases in microbial respiration rates (Fierer and Schimel, 2003; Corstanje and Reddy, 2004; Valett et al., 2005; Wilson et al., 2011), and the microbial response is influenced by the period of drainage and C input history (Bodelier et al., 2012; Göransson et al., 2013; Meisner et al., 2013; Shi and Marschner, 2014). However, the specific microbial metabolic response with flooding progression (as the soil becomes increasingly depleted in oxygen) and with different inputs remains unresolved. In general, anaerobic respiration conforms to thermodynamic predictions, owing to partial equilibrium, to proceed with progressively less favorable electron acceptors, i.e., Mn(IV)>Fe(III)>CO2 (Postma and Jakobsen, 1996; Arndt et al., 2013), but increasing evidence shows that the available electron donors (e.g., organic C compounds, H2) and high variability in local conditions (e.g., pH, gas pressure, diffusion rates, concentrations of reactants and products) can off-set the metabolic transitions from this predicted trajectory (Jin and Bethke, 2005; LaRowe and Van Cappellen, 2011; Arndt et al., 2013; Hansel et al., 2015). The period immediately following flooding, when the system transitions from aerobic to anaerobic conditions, exhibits dramatic changes in reaction rates and metabolic activity, with a critical impact on C fate, rate of nutrient release, extent of denitrification, iron (and sulfate) reduction, contaminant release, and methanogenesis (Baldwin and Mitchell, 2000; Burns and Ryder, 2001; Newman and Pietro, 2001; Corstanje and Reddy, 2004; Wilson et al., 2011). Therefore, in order to predict C turnover rates in paddy soils and consequential processes impacting crop growth and environmental quality, it is necessary to determine the variability in microbial C oxidation, and its causes, in the response to flooding of paddy soils.
Soil organic matter serves as both C source and energy source for microorganisms, and the distribution between anabolic (biomass-yielding) and catabolic (energy-yielding) C use varies between different types of microorganisms and available substrates. Interestingly, independent of changes in enthalpy and metabolic pathway, the Gibbs energy (ΔG) dissipation per unit biomass produced exhibits little variability (von Stockar and Liu, 1999; Roden and Jin, 2011), i.e., the energy requirement for anabolism is relatively constant. Thus, the large variation in energy yield from different catabolic reactions results in a relatively proportional variation in growth, but with important differences in how the decrease in entropy from building biomass is handled (von Stockar and Liu, 1999). Aerobic metabolism achieves energy balance almost entirely through heat dissipation, i.e., the overall metabolic reaction is exothermic with the enthalpy change, ΔH, roughly equaling ΔG. Anaerobic metabolism, on the other hand, can range from being highly exothermic (methanogenesis from CO2+H2 has ΔH > ΔG) to being endothermic (ΔH < 0) and entropy-driven (e.g., methanogenesis from acetate) (von Stockar and Liu, 1999; Liu et al., 2001). Thus, valuable information about differences in microbial metabolic activity can be gained through simultaneous measurements of microbial C utilization (e.g., respiration and/or biomass yield) and changes in enthalpy (by isothermal calorimetry) (Hansen et al., 2004; Herrmann et al., 2014; Barros et al., 2015; Bölscher et al., 2016; Arcand et al., 2017), particularly if the ΔG and/or ΔH of the substrate is known.
In well-aerated, moist soils, the calorespirometric ratio, Rq/RCO2 (heat dissipation per unit CO2 produced), varies depending on soil management and land use history (e.g., fertilization, deforestation, reforestation, crop rotations) (Barros Pena et al., 2014; Herrmann and Bölscher, 2015; Barros et al., 2016; Bölscher et al., 2016) and this has been linked to differences in microbial community composition (Bölscher et al., 2016) and organic matter sources (Barros et al., 2016). Such evaluations are based on the thermodynamic relationship between heat and respiration in aerobic systems at steady-state (i.e., no growth), where Rq/RCO2 is dependent only on the oxidation state of the substrate (Hansen et al., 2004):
where Rq is the heat output rate (J g−1 soil day−1), RCO2 is the CO2 production rate (μmol g−1 soil day−1), NOSC is the nominal oxidation state of C in the substrate (ranging from −4 to +4), and ΔHO2 is Thornton's constant or the oxycaloric equivalent (−455±15 kJ mol−1 O2) (Hansen et al., 2004). Deviations from the predicted value in fully aerated systems with a known substrate can then be attributed to growth (Rq/RCO2 smaller than predicted) or metabolic inefficiency due to environmental stressors (Rq/RCO2 larger than predicted) (Hansen et al., 2004). In systems with mixed or purely anaerobic metabolisms, the relationship between Rq and RCO2 is more complicated. Most commonly, anaerobic metabolism dissipates less heat than aerobic metabolism per unit biomass formed, due to the increase in entropy associated with fermentation and production of gaseous metabolites from dissolved substrates (von Stockar and Liu, 1999; Hansen et al., 2004). However, the relationship between heat and CO2-production is less straightforward than the biomass yield; for example, CO2 can be produced essentially without heat generation (e.g., through anaerobic respiration with sulfate or nitrate and an organic electron donor, or disproportionation of substrates) (Hansen et al., 2004; Ozuolmez et al., 2015). Contrastingly, CO2 can be consumed with extreme heat dissipation (methanogenesis from CO2 and H2) (von Stockar and Liu, 1999), and heat can be generated without CO2 being part of the metabolic reaction at all (e.g., fermentation of glucose to lactate). Therefore, the relationships between respiration rate, oxygen consumption, heat dissipation, and microbial growth in complex systems with mixed substrates and/or metabolisms need further evaluation in order to be useful for assessing microbial processes.
One of the fundamental prerequisites for thermodynamic evaluations of metabolic activities is to know the reactants and products. For incubations with single (or few) organisms and simple substrates (e.g., glucose, acetate, propionate, ethanol, methanol) the metabolic reactions can largely be predicted and the enthalpy of combustion for substrates and products, as well as their NOSC, are generally known. Thus, the thermodynamic energy yield of such a system can be calculated and compared to measured heat and CO2 generation to deduce which types of metabolic pathways are active and how efficiently energy, carbon, and nutrients are converted into biomass (Herrmann et al., 2014; Bölscher et al., 2016). Such predictions also hold true for mixed aerobic/anaerobic and growing systems (von Stockar and Liu, 1999; Hansen et al., 2004; Roden and Jin, 2011). However, soils are complex heterogeneous environments, where it is practically impossible to determine which substrate compounds are being metabolized through a certain metabolic pathway at any given point in time. Nevertheless, the Gibbs free energy of complex organic matter can be estimated based on its elemental stoichiometry (LaRowe and Van Cappellen, 2011). Recently, we used Fourier-transform ion cyclotron resonance mass spectrometry (FT-ICR-MS) to estimate a ΔG of water soluble organic C from sediment extracts, and we revealed that thermodynamic limitations for anaerobic respiration result in preferential removal of substrates with a favorable ΔG when coupled to sulfate reduction in typical anoxic conditions (Boye et al., 2017). Combining FT-ICR-MS determination of NOSC, and by extension the composite ΔG of soluble C, illuminates a potential solution to overcoming the challenges associated with quantifying metabolic pathways in systems with complex substrates. Such an approach greatly enhances the possibilities of constraining the thermodynamics of metabolic reactions in soil systems, as long as the rates of production or consumption of other participating compounds can be determined (e.g., O2, anaerobic electron acceptors (Mn(IV), , Fe(III), etc.), methane, H2).
Therefore, the objectives of this study were to (1) evaluate the relationship between heat and carbon flow in non-steady-state soil systems with complex natural organic substrates and multiple types of active microbial metabolic strategies, and (2) test the hypothesis that the variability in microbial response to flooding is dependent on organic matter source and soil type and can be explained by thermodynamic theory and relatively easily obtained mass and energy balances. We thus determine key drivers of microbially mediated redox transformations, which have profound impacts on greenhouse gas emissions and other important element cycles in paddy soils and similar ecosystems. A better understanding of these mechanisms and their dependence on initial properties of soil and organic matter, will help simplify the predictions of carbon fate and other environmental impacts from flooding.
Materials and Methods
Soil and Amendment Sampling and Characterization
In order to investigate the variability in microbial activity in response to flooding, we used three different types of rice paddy soils and three types of organic matter that are commonly present on rice paddies: dried rice straw (DS), charred rice straw (CS), and cattle manure (M). Straw amendments were collected from two separate Cambodian rice fields where harvested straw was deposited (DS) or piled and burned (CS). The “charred straw”, thus, consisted of a mix of ashes (more aerated outer portions of the pile) and charred material (from the interior of the pile). Cattle manure was collected from grazing fields. Paddy soils were collected from the top 10 cm of rice fields in the Mekong delta of Vietnam (peaty paddy soil and acid sulfate soil) and Cambodia (mineral paddy soil). All soils and amendments were dried at room temperature for 1–2 weeks prior to analyses and experiments. Soils were gently ground to crush aggregates >2 mm and sieved (2 mm). Amendment material was ground to a fine powder in a ball mill. Soils and amendments were analyzed (in triplicate) for total C and N concentration (weight-% of dry material) by a Carlo Erba NA 1500 elemental analyzer. Total concentrations of other elements in soils were determined by X-ray fluorescence (XRF) spectroscopy (Spectro Xepos HE). Amendments were digested (in triplicate) in 70% nitric acid (trace metal grade) using a CEM MarsXpress™ microwave digester (CEM, Matthews, NC, USA). The digests were diluted 1:5 with ultrapure DI water and analyzed for total Fe and S concentrations with inductively coupled plasma optical emission spectroscopy (ICP-OES, iCAP6000, Thermo Scientific, Cambridge, UK). The pH of soil and amendments (except M, due to insufficient material) was determined in 1:5 (v/v) of material:DI-water slurries after shaking 5 min and settling for 2–8 h. Total enthalpy of combustion for all soils and amendments (except M, due to insufficient material), was determined by bomb calorimetry (6300 automatic isoperibol calorimeter, USA).
Incubation Experiment
For each soil, 50 aliquots of 4 g dry soil were weighed into 20 ml glass vials and separated into two sets, one for calorimetry measurements (in duplicate) and one for gas/solution analyses (with 4 sampling points, each in duplicate). Within each set of mesocosms, each soil was subjected to five treatments: DS, CS, M, glucose, and control [i.e., 5 treatments × 2 duplicates × 5 measurements (1 calorimetry + 4 gas/solution) = 50 vials]. Amendments were distributed so that 36 mg C were added to each vial (no amendment added to control vials). Thereafter, 15 ml TRIS buffer solution (10 mM, pH 7.03) was added, the vials were crimp-sealed, and thoroughly shaken to mix the amendments with the soil and ensure complete saturation of solids. The vials were then left to settle without further disturbance to allow anaerobiosis to gradually establish away from the headspace, similar to the progression in a flooded paddy field. For glucose amended vials, glucose was dissolved in the TRIS buffer solution and added with the solution to the vials; all other amendments were added as powdered solids prior to adding the solution. The first set of duplicates from each treatment and soil were placed in a TAM Air isothermal microcalorimeter (TA Instruments, Sollentuna, Sweden) at 25°C, along with reference vials filled with DI water to match the estimated heat capacity of the soil samples. After sample equilibration for 6.5 h, heat flow (corrected for baseline and instrument drift, <2 μW over the incubation period) was measured continuously for ca. 5 days, allowing the initially fully aerated system (headspace and solution) to convert to anoxic conditions; a preliminary test (with another, but very similar, mineral paddy soil) using optical spot sensors (PreSens, Germany) showed that O2 was depleted (<3 μmol/L) in the solution of all amended vials after 2–3 days of incubation (data not shown), although O2 still remained in the headspace of some treatments. At the end-point, the solution from vials treated with glucose was filtered (0.2 μm) and analyzed for residual glucose, using an assay kit (Sigma-Aldrich, Stockholm, Sweden). The second set of mesocosms was kept in an incubator at 25°C and used to measure CO2, CH4, and O2 on a Shimadzu GC-2014 at four time points: 0.5, 1.5, 2.5, and 5.5 days after flooding. The total CO2/CH4-production and O2-consumption were calculated as the sum molar content of each gas in the headspace and solution using Henry's law (assuming equilibrium, atmospheric pressure, and negligible chemical reactions between gases and water). Solution samples were taken by a luer-lock needle/syringe assembly after gas sampling at the same time points (and same vials). Solutions were passed through a syringe filter (0.2 μm) and immediately analyzed for pH and acidified to 2% with nitric acid for analyses of dissolved concentrations of Fe and S by ICP-OES. Sampled mesocosms were removed from the experiment (i.e., each gas/solution measurement point was performed on unique replicate vials).
Water Soluble C Characterization
Water soluble organic C concentrations in soils and amendments (except glucose) was determined on water extracts (1:10 soil:DI-water, w/v) by the non-purgeable organic C (NPOC) method on a Shimadzu TOC-L analyzer with in-line acidification (phosphoric acid) and He-purging of samples to volatilize inorganic C. The chemical composition of water-soluble organic C was examined using a 12 Tesla Bruker SolariX Fourier transform ion cyclotron resonance mass spectrometer (FT-ICR-MS) within the Environmental Molecular Sciences Laboratory (EMSL), Richland, WA, USA. Extracts were diluted 1:2 (v/v) with LC-MS grade methanol less than 30 min before analysis to minimize potential esterification. Samples were injected directly into the mass spectrometer at a concentration of 20 ppm. A standard Bruker electrospray ionization (ESI) source was used to generate negatively charged molecular ions. Samples were introduced to the ESI source equipped with a fused silica tube (30 μm i.d.) through an Agilent 1200 series pump (Agilent Technologies) at a flow rate of 3.0 μL/min. Experimental settings followed previously established optimal parameterization: needle voltage +4.4 kV; Q1 set to 50 m/z; heated resistively coated glass capillary operated at 180 °C. All samples were run with instrument settings optimized by tuning on the IHSS Suwannee River fulvic acid standard. The instrument was externally calibrated weekly with a tuning solution from Agilent, which calibrates to a mass accuracy of < 0.1 ppm and contains the following compounds: C2F3O2, C6HF9N3O, C12HF21N3O, C20H18F27N3O8P3, and C26H18F39N3O8P3 with an m/z range of 112–1,333. Forty-four individual scans were averaged for each sample, and they were internally calibrated using an organic matter homologous series separated by 14 Da (−CH2 groups). Mass measurement accuracy was typically within 1 ppm for singly charged ions across a broad m/z range (100–1,100). The mass resolution was ~350,000 at m/z 321. All observed ions in the spectra were singly charged, as confirmed by the 1.0034 Da spacing found between isotopic forms of the same molecule (between 12Cn and 12Cn−1−13C1). DataAnalysis software (BrukerDaltonik version 4.2) was used to convert raw spectra to a list of peak locations applying FTMS peak picker with the absolute intensity threshold set to the default value of 100. To further reduce cumulative errors, all sample peak lists within a dataset were aligned to each other prior to formula assignment to eliminate possible mass shifts that would impact formula assignment.
Chemical formulas were assigned using Formularity software (Tolić et al., 2017). The following criteria were used for formula assignments: signal to noise ratio, S/N >7, mass measurement error <1 ppm, and C, H, N, O, S, and P were the only elements considered. The presence of P cannot be confirmed through isotope analogs in the same way as the other elements. Therefore, P was only included in formulas where a single P atom was accompanied by at least four O atoms and two P atoms by at least seven O atoms. Additionally, we consistently picked the formula with the lowest error and the lowest number of heteroatoms, since molecules containing both P and S are relatively rare. All calculated formulas were screened according to a list of selection criteria previously applied to eliminate those unlikely to occur in natural organic matter (Koch and Dittmar, 2006; Kujawinski and Behn, 2006; Stubbins et al., 2010). The possibility for other potential formula assignments within our mass error ranges increases with increasing mass or mass to charge ratios. Thus, peaks with large mass to charge ratios (m/z values >500) often have multiple possible formulas. These peaks were assigned formulas through the detection of homologous series (CH2, O, H2). Specifically, whenever an observed m/z >500 could be assigned by adding the m/z of a group (CH2, O, H2) consistent with a homologous series to the m/z of an already putative assignment for a smaller compound, the formula for the large compound was assigned in this manner. If no chemical formula matched an m/z value within the allowed error, the peak was not included in the list of elemental formulas (i.e., the peak was unassigned).
Organic compound composition was assigned to major biochemical classes based on the molar H/C (y-axis) and O/C (x-axis) ratios (Kim et al., 2003; Šantl-Temkiv et al., 2013; Hodgkins et al., 2014; Tfaily et al., 2015). Our abundance calculations assumed equal concentrations for all compounds with an assigned molecular formula; in other words, the intensity of the peak was disregarded and a simple presence/absence approach was employed to assign relative abundance. This approach avoids biases incurred by different ionization efficiencies for different types of compounds and potential interferences between compounds or from complexation with metals. In general, the ionization efficiency is determined by the ability of different functional groups to stabilize the charge. In negative ion mode, ESI preferentially ionizes molecules that can carry a negative charge as a result of deprotonation. For example, acidic functional groups, such as carboxylic acids, are easily deprotonated and preferentially ionized relative to alcohols or nitrogen-containing compounds. This leads to charge competition when both compound types are present in an extract. For example, compounds that contain carboxylic functional groups will be more readily ionized than compounds like lignin, tannins, and sugars, which are rich in hydroxyl functional groups. In general, compound classes ionize in the following order: lipids > lignin > hydrophilic tannins/sugars. In this study, all samples were run under similar condition, with similar starting concentrations. The effect of noise peaks was minimized by only assigning formulas to peaks with S/N >7.
Calculations and Statistical Analyses
All statistical analyses (ANOVA and linear regression analyses) were performed in R Studio® Version 1.1.383 (RStudio, Inc.).
We used the FT-ICR-MS data from the water extracts of soils and organic substrates to calculate the predicted heat output based on Equation 1 and the Gibbs free energy of the C oxidation reaction (Δ) for respiration. For this purpose the stoichiometry of each assigned formula was used to calculate the nominal oxidation state of C (NOSC) for that compound (LaRowe and Van Cappellen, 2011):
where the letters represent the stoichiometric numbers for the elements with the corresponding capital symbol (C, H, O, N, S, P) and z is the charge of the molecule. The average NOSC for all identified compounds in the water extract was then used to calculate the Gibbs free energy of the initial water soluble C (LaRowe and Van Cappellen, 2011):
We used this average multiplied by the total amount (mol-C) of water soluble C in each vial (soil+amendment) to calculate the maximum Gibbs free energy that would be released through complete oxidation of all water soluble C to CO2 with O2 as the electron acceptor (i.e., if all soluble C was oxidized through aerobic respiration) (Table 1). Using the measured net O2-consumption, net dissolution of Fe, and net consumption of dissolved S, and the stoichiometrically proportional production of CO2 per mol terminal electron acceptors (TEA) consumed (Table 2), we also calculated the total Gibbs free energy that was generated from respiration with O2, ferrihydrite [Fe(OH)3], and as TEA, respectively (Table 2).
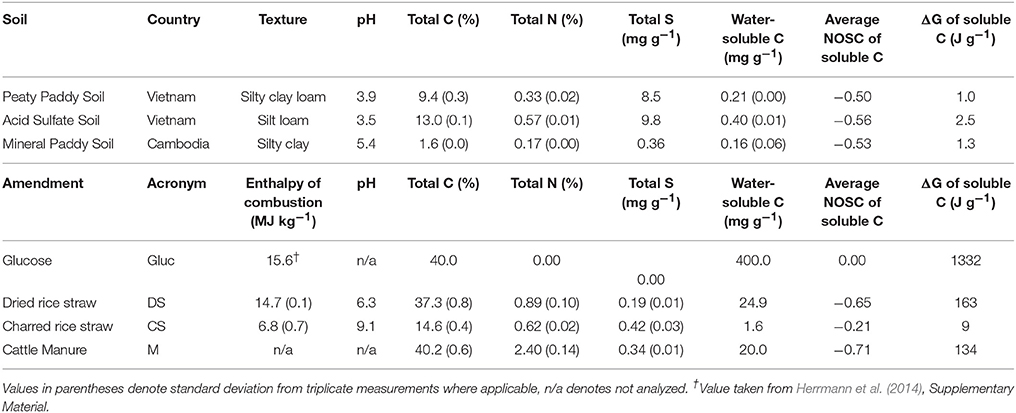
Table 1. Soil and amendment properties.
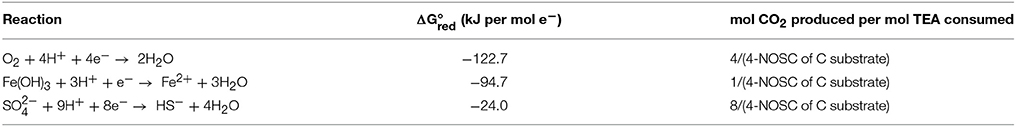
Table 2. Half-reactions for reduction of terminal electron acceptors (TEA) considered for the respiration calculations with Gibbs free energy (kJ per mol e−) from Arndt et al. (2013) and stoichiometric relation to oxidized C, assuming complete oxidation to CO2.
Results
For all three soils, both heat output and respiration increased in the order control < CS < M < DS < Gluc over a ~5 d period, although initially the microbial response to flooding in the different treatments deviated slightly from this order (Figure 1). The duplicate vials generated very similar heat signals (Figures 1A–C) and respiration data (Figures 1D–F), which validates the comparison of calorimetry and gas measurements conducted on separate vials. Statistical analyses (one-way ANOVA, all soils combined, N = 6) confirmed significant treatment differences in heat and CO2 output (P < 0.05). Although the calorespirometric ratios ranged from 440 to 1,110 kJ per mol CO2 (Table 3), there was a clear linear relationship between heat dissipation and CO2 generation across all treatments and soils (Figure 2), with a slope of 0.86 and an intercept of −0.57 J at 0 μmol CO2, suggesting an average Rq/RCO2 of ~800 kJ mol−1CO2 for these systems (R2 = 0.77, P < 0.001, linear regression not shown in Figure 2). However, the mineral paddy soil exhibited a different response pattern to the glucose treatment with substantial heat emissions compared to all other treatments (including glucose in the two other soils) (Figure 3), suggesting this system comprised an extreme case. Excluding this potential outlier, the linear fit improved (R2 = 0.85, P < 0.001) and the slope changed to 0.65 with an intercept close to 0, suggesting an average Rq/RCO2 of 650 kJ mol−1CO2, which is similar to previously reported values for saturated soils (Barros et al., 2016). Also shown in Figure 2 is the calculated heat output from Equation (1) (open diamond symbols, thin solid regression line), assuming (i) all CO2 was produced from O2 consumption and (ii) that the average NOSC of initial soluble C (Table 3) is representative of the substrate used. However, O2-consumption did not match the CO2-production (Table 3), suggesting anaerobic metabolism accounted for 33–62% of the CO2 production. Thus, we also calculated the heat that would be generated from no-growth aerobic respiration using the measured O2 consumption data and the oxycaloric equivalent (Equation 1), and plotted this against the measured CO2 production in Figure 2 (x symbols, dashed regression line). The deviation between this and the measured data represents heat generating processes that do not consume oxygen, which we interpret as anaerobic metabolic processes. Indeed, we observed a net increase in dissolved Fe and detected methane in all vials (Table 3), although the methane production was limited in the peaty paddy soil. Methane production in the mineral paddy soil was more than an order of magnitude higher than in the other two soils. The DS treatment produced the most methane in each soil, followed by Gluc in the peaty paddy and acid sulfate soils and M in the mineral paddy soil. The Fe-dissolution followed the same order as the heat and CO2 production (control < CS < M < DS < Gluc). Net S removal, an indicator of sulfate reduction, only occurred in the CS, M, and DS treatments in the mineral paddy soil (Table 3). In spite of the use of pH 7 TRIS buffer, pH was remarkably lower in the peaty paddy and the acid sulfate soils than in the mineral paddy soil (Table 4). In general, pH remained within ±0.5 units of the values measured on day 1 throughout the incubation, with the exception of the M and DS treatments in the mineral paddy soil, which increased by 0.7 and 0.8 pH units respectively from day 1 to day 5.
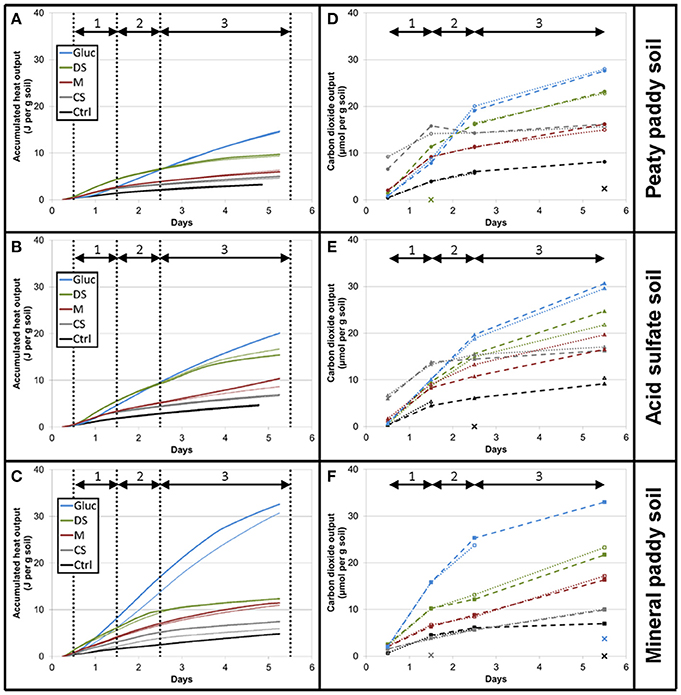
Figure 1. Cumulative heat output (A–C) and respiration (D–F) for the first 5 days after flooding. Soils from top to bottom: peaty paddy soil (A,D), acid sulfate soil (B,E), and mineral paddy soil (C,F). Colors represent treatments: Control, black; CS, gray; M, red; DS, green; Gluc, blue. Duplicate vials are depicted by thick and thin lines. The dashed and dotted lines in the respiration figures (D–F) are only intended as guides for the eye as sampling was made on separate vials for each time point (i.e., there is no direct connection between the vials plotted within the same series other than that they belong to the same treatment). Data points marked with X denote gas samples where the GC measurements failed. Vertical dotted lines in the heat figures (A–C) indicate sampling times for the respiration measurements. Arrows denote intervals (1–3) used for calculating rates between sampling points.
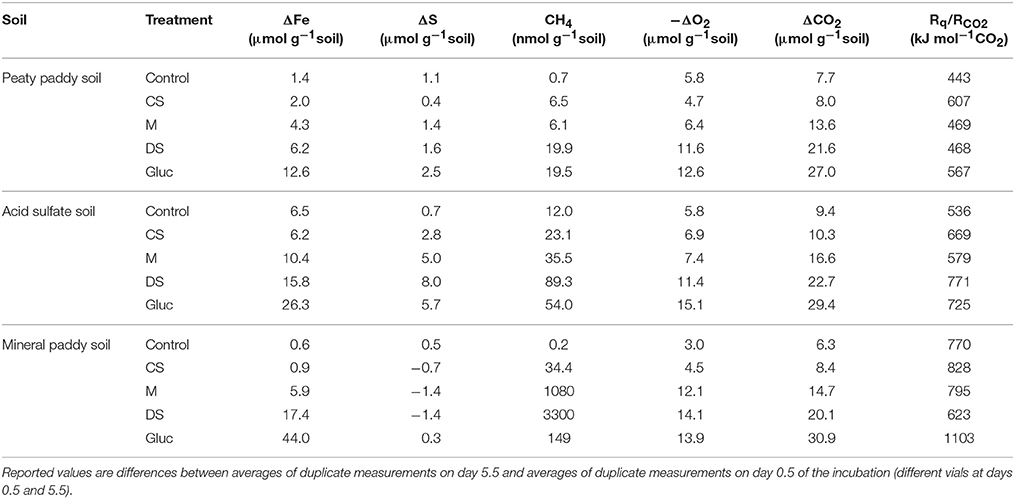
Table 3. Net change in dissolved Fe and S concentrations, total methane production, total O2-consumption, and calorespirometric ratios for the 5 days of incubation.
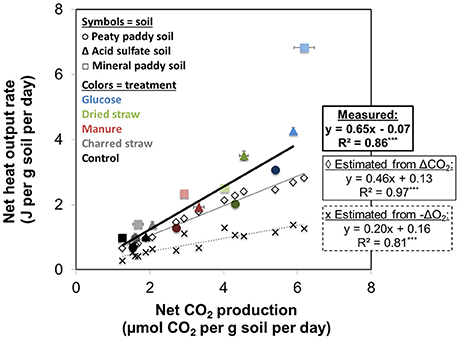
Figure 2. Average respiration rate (μmol CO2 per g soil per day) during 5 days of incubation, plotted against the average heat output rate (J per g soil per day) for the same period. Soils are represented by different symbols and shades (light □ = mineral paddy soil, medium Δ = acid sulfate soil, dark ° = peaty paddy soil) and the colors correspond to treatments: Control, black; CS, gray; M, red; DS, green; Gluc, blue. Error bars denote standard error of the mean of the duplicates. Open diamonds show the predicted heat dissipation (Equation 1) if all CO2 had been produced from aerobic respiration (assuming no-growth). Crosses show predicted heat output from aerobic respiration based on O2-consumption and the oxycaloric equivalent (455 kJ mol−1 O2) plotted against measured CO2-production. Lines indicate regression fits (with equations and R2-values given in the figure) for calculated aerobic respiration heat output (thin solid line and dashed line for CO2-based and O2-based calculations, respectively) and measured respiration and heat output (thick solid line), excluding the glucose treatment in the mineral paddy soil.
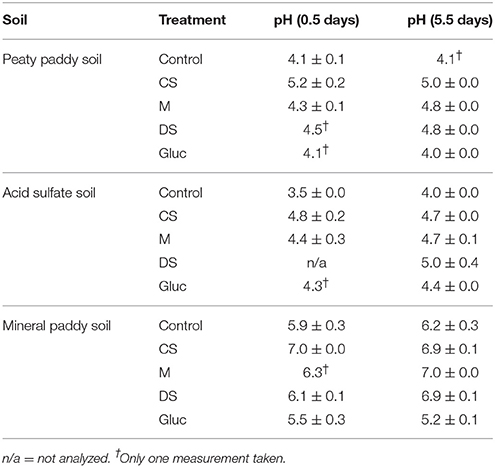
Table 4. pH (average of duplicate vials ± standard deviation) in solution after 1.5 and 5.5 days of incubation, respectively.
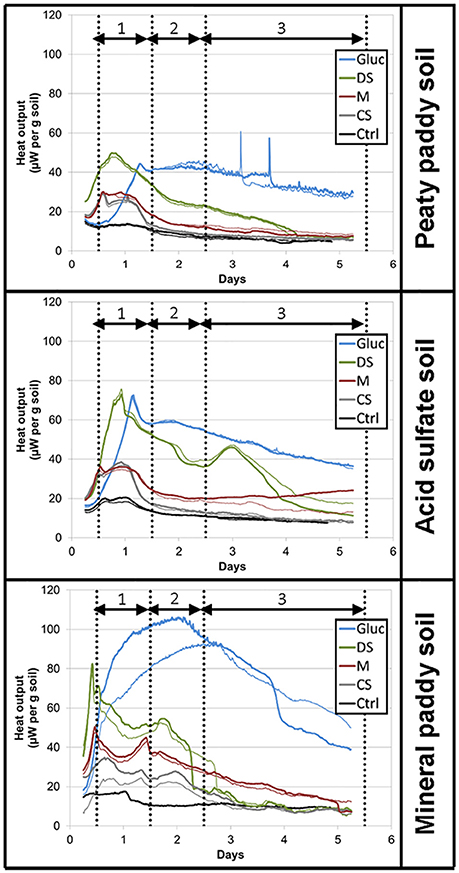
Figure 3. Heat flow (μW per g soil) over the course of the 5-day incubation. Colors represent treatments: Control, black; CS, gray; M, red; DS, green; Gluc, blue. Duplicate vials are depicted by thick and thin lines. Vertical dotted lines indicate sampling times for the respiration measurements.
In order to better understand the causes of variability in metabolic response between the different soils and treatments, we examined the organic matter solubility (Table 1) and chemical composition in water extracts from soils and substrates with FT-ICR-MS (Figure 4, Table 5). All three soils had average NOSC values ~-0.5 and the amendments ranged from 0 to −0.71 in the order Gluc>CS>DS>M, but due to the large variation in solubility of the amendment C (Table 1), the calculated total Gibbs free energy of the added soluble C varied immensely (Table 1). Linear regression analyses showed that the amount of added soluble C in complex organic matter (i.e., excluding glucose) was clearly correlated with respiration rate, with an R2 = 0.91 (P < 0.001) (Figure 5A). Excluding glucose from this analysis is reasonable given it was added in solution and, hence, substrate solubility would not be a limiting factor in this system. Considering the strong correlation with soluble C and that CO2-production comprised < 40% of this pool (Figure 5C), we assumed that all CO2 produced during the incubation originated from the initial soluble C pool, which was comprised of soluble organic matter from the soil plus the soluble portion of the amendment. Thus, we calculated the Gibbs free energy that would have been released by respiration, based on the fraction of total soluble C that had been converted to CO2, using O2- and S-consumption and Fe-dissolution to stoichiometrically partition CO2 production between aerobic, Fe(III), and respiration (which were the only respiration pathways we could approximately constrain in this study) according to values in Table 2. This generated a strong correlation between calculated ΔGs and the heat outputs (R2 = 0.69, P < 0.001; Figure 5B, dashed line), in spite of evidence of other metabolic pathways, such as methanogenesis (Table 3) and fermentation, being active to some extent in all soils and treatments. The relationship between ΔGs and heat outputs improved when the glucose treatment was excluded (R2 = 0.78, P < 0.001; Figure 5B, solid line). Post-experiment analyses of the glucose treated vials showed that no glucose remained in solution after 5 days of incubation, although only a small fraction of the added C (2–3% mol-C/mol-C basis, Figure 5C) had been converted to CO2, indicating fermentation and/or other non-CO2 generating metabolism must have been active in this treatment.
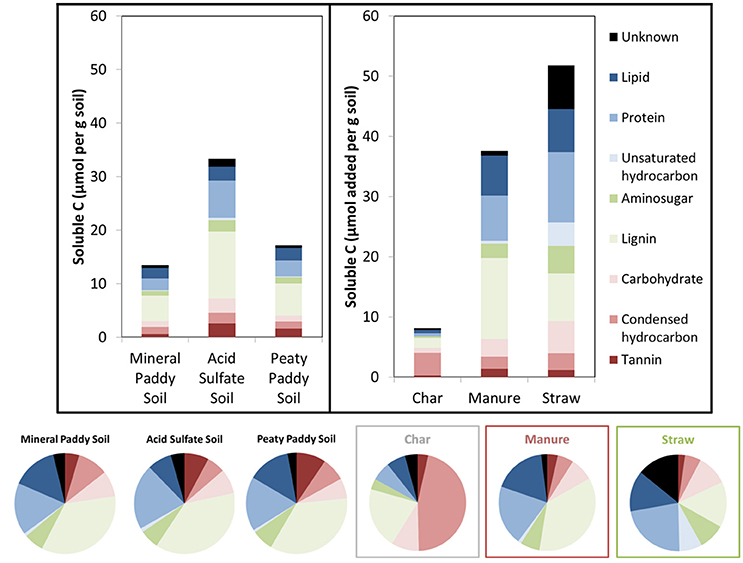
Figure 4. Initial total water soluble C (μmol per g soil) in soils and added substrate materials (bars). Pie charts and bar colors show the relative distribution of compound classes determined from H/C and O/C ratios in molecule formulas identified by FT-ICR-MS.
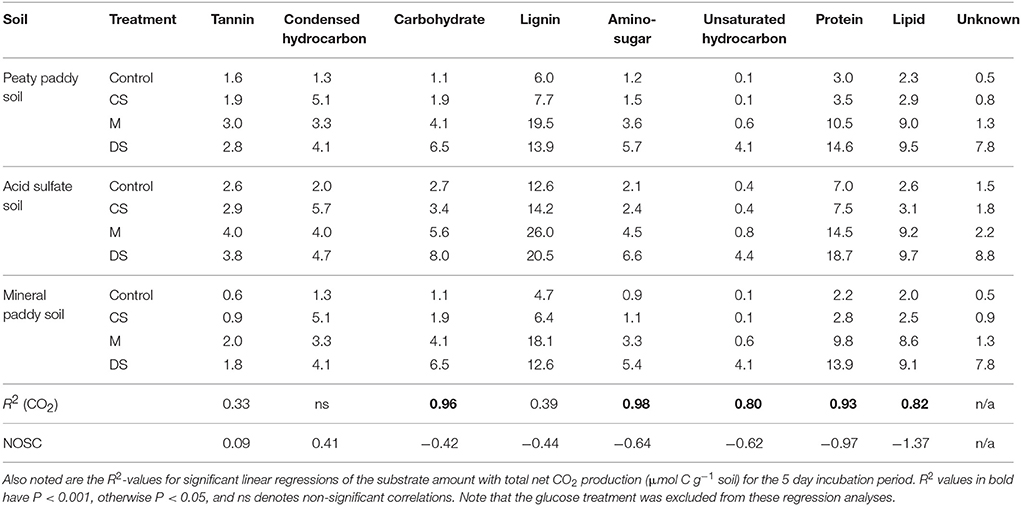
Table 5. Initially available substrates (μmol C g−1 soil) in solutions, estimated from relative distribution among different compound classes, based on H/C and O/C ratios (Kim et al., 2003; Šantl-Temkiv et al., 2013; Hodgkins et al., 2014; Tfaily et al., 2015) in molecular formulas identified with FT-ICR-MS, in water extracts and the total amount of water soluble C per g of soil.
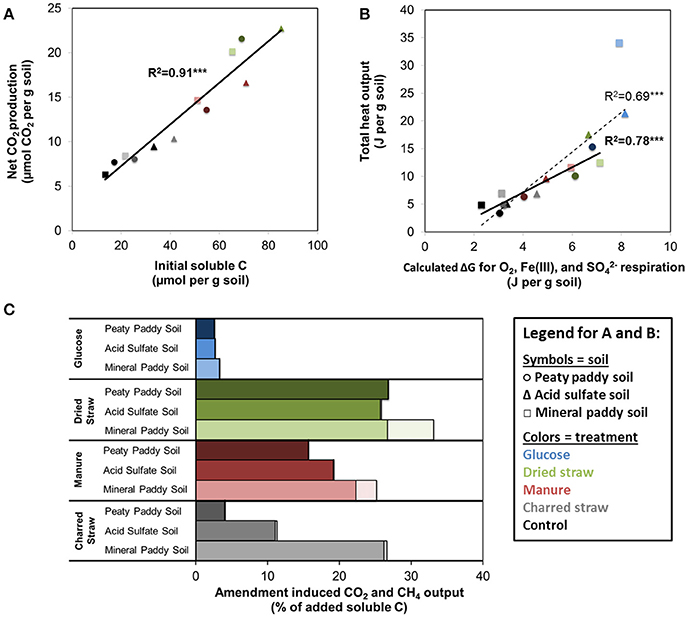
Figure 5. Relationship between (A) initial amount of water soluble C and total respiration (μmol per g soil), excluding glucose treatment, and (B) total heat dissipation during the incubation (J per g soil) and the calculated Gibbs free energy of respired C, calculated from average NOSC of initial water soluble C and the fraction of this C that was respired with O2, Fe(III), and (assuming NOSC-unbiased utilization and complete oxidation to CO2, using stoichiometric balances and values from Table 1). In both (A,B) soils are represented by different symbols and shades (light □ = mineral paddy soil, medium Δ = acid sulfate soil, dark ° = peaty paddy soil) and the colors correspond to treatments: Control, black; CS, gray; M, red; DS, green; Gluc, blue. Linear regression fits and R2-values are shown in solid and bold for fits excluding glucose and dashed, normal font (B) for fit including glucose. (C) shows total amendment induced output of CO2 (solid) and CH4 (light, shaded) as % of added water soluble C.
In contrast to soluble C, there was no correlation between CO2 or heat production and the initial amount of total C or combustion enthalpy of the materials (data not shown).
Discussion
Our results show that there is a correlation between heat generation and respiration even at non-steady state conditions in heterogeneous systems with complex substrates and a mix of metabolisms. As expected, in systems with mixed aerobic/anaerobic metabolism, the relationship (~650 kJ per mol CO2) deviated from the 460 kJ per mol CO2 that was predicted by Equation (1) using the oxycaloric equivalent, the total CO2 generation, and the average NOSC of soluble organic C (Figure 2). Given the complexity of the systems, we cannot rule out abiotic processes that may have contributed to offsetting either heat or CO2 production rates, but they are likely to be minor relative to the microbial activity following C addition and re-wetting of soils; Herrmann et al. (2014) did not observe any abiotic heat dissipation in gamma-irradiated sterilized soils amended with glucose. Thus, the deviation from predicted values must be attributed to anaerobic metabolism, as the Rq values calculated from O2-consumption were even lower than those predicted by Equation (1) (Figure 2). Given the generally lower enthalpy dissipation per unit biomass formed for fermentation and anaerobic respiration compared to aerobic respiration (von Stockar and Liu, 1999), this may seem surprising. However, it is important to distinguish between the relationship of heat to anabolic reactions, as examined in von Stockar and Liu (1999), and that of heat to catabolic reactions, as examined here and in other calorespirometry studies (Hansen et al., 2004). Therefore, to elucidate the influence of anaerobiosis on the calorespirometric ratios, we divided the incubation period into an initial, aerobic phase (sampling points 0.5–1.5 days) and a mixed aerobic/anaerobic phase (1.5–5.5 days) and calculated the deviation of measured Rq/RCO2 from those predicted by Equation (1) and the average NOSC in the initial soluble C pool (Figure 6). This revealed that the measured Rq/RCO2 in the initial phase in most cases was close to or lower than that predicted from Equation (1), which indicates growth (i.e., endothermic anabolism) and dominance of aerobic catabolism, although minor contributions from early anaerobiosis cannot be ruled out. After 1.5 days, the measured Rq/RCO2 values were always higher (and often much higher) than those predicted from Equation (1) (Figure 6). Thus, in this experiment, increasing contribution from anaerobic metabolism resulted in increasing Rq/RCO2 values, which is in contradiction to predictions based on heat dissipation relative to biomass yield (von Stockar and Liu, 1999) and expectations from thermodynamic calculations of CO2-yielding fermentation and anaerobic respiration reactions (Hansen et al., 2004). However, an Rq/RCO2 higher than predicted by Equation (1), can be explained in several ways:
• Incomplete metabolic oxidation of organic substrates to CO2. This is the case for fermentation, which is accomplished through disproportionation of a substrate into smaller molecules, with variable thermodynamic implications. For example, glucose fermented to lactate leads to a standard enthalpy change of −120 kJ per mol glucose (i.e., 20 kJ of dissipated heat per mol C fermented), with no simultaneous CO2-production. Hence, Rq/RCO2 is infinitely large for this process. In contrast, fermentation of glucose to ethanol produces 2 mol CO2 per mol glucose plus H2 and ethanol, a process that at standard state releases 37.2 kJ heat per mol CO2. This is an order of magnitude less than the 468 kJ per mol CO2 released for glucose oxidation with O2. However, the subsequent use of H2 (and/or CO2) in anoxic systems, for example by autotrophic methanogens, can be highly exothermic (von Stockar and Liu, 1999). Thus, although fermentation is a low-enthalpy metabolic process in terms of heat dissipation per unit biomass formed, the heat per unit CO2 can still be higher than for aerobic respiration. The relationship between the two is dependent on the fermentation pathway and the subsequent fate of the metabolites. Incomplete oxidation of substrates is also common for anaerobic respiration (Coates et al., 1999; Detmers et al., 2001; Heidelberg et al., 2004), again potentially resulting in higher heat dissipation per unit CO2 even if the heat dissipation per unit biomass yield is lower.
• Autotrophic metabolism. Microorganisms that use CO2 for synthesizing biomass still need to dissipate heat from their catabolic processes, which can be highly exothermic (e.g., methanogenic autotrophy) (von Stockar and Liu, 1999). Thus, chemoautotrophic metabolism by itself would yield a negative calorespirometric ratio. However, in a mixed metabolic environment, where CO2 is simultaneously produced by heterotrophs and consumed by autotrophs, the net effect will be seen as an increase in Rq/RCO2 relative to a system with only heterotrophic metabolic processes (as that considered in Equation 1).
• Other “hidden” metabolic cycles & recycling of metabolites. In addition to fermentation and autotrophy, chemolithoheterotrophic strategies (inorganic energy source, organic biomass source) also deviate from Rq/RCO2 values predicted by Equation (1), as they generate (some) heat without producing CO2 or consuming O2.
• Utilization of more reduced compounds than the average available substrate. This is technically not an exception from the rule represented in Equation (1), but a matter of knowing which substrate was used for the metabolic reaction, which is difficult in complex systems. Because Rq/RCO2 depends on the oxidation state of the substrate, deviations from the predicted value in a fully aerobic system can be interpreted as an indication that a more reduced (higher Rq/RCO2) or more oxidized (lower Rq/RCO2) substrate than predicted was used (Barros et al., 2016).
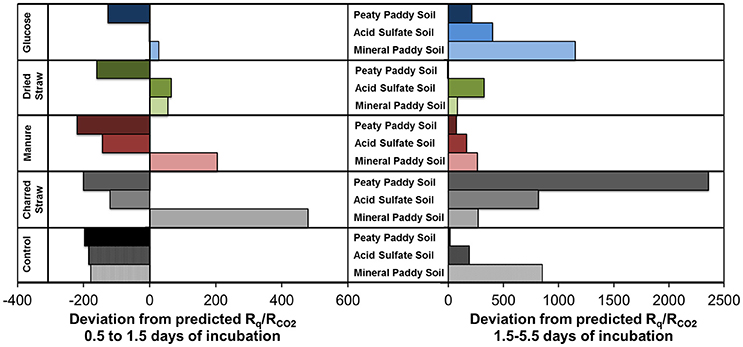
Figure 6. Deviations of measured Rq/RCO2, from those calculated by Equation (1) using NOSC of initial soluble C in soils and amendments, during the first day of incubation (Left) and the subsequent 4 days (Right). Negative values indicate the measured Rq/RCO2 was lower than the predicted value.
With the experimental approach used here, we cannot fully decipher which of these processes led to the high Rq/RCO2 values, but all could have contributed to some extent. In the glucose treatment, fermentation and/or respiration with incomplete oxidation must have occurred as the CO2 production only accounted for 2–3% of the removed glucose (mol-C/mol-C basis). It is likely that fermentation was also active in the other treatments, although we cannot confirm this without post-experimental analyses of the soluble C fraction. The dissolution of Fe (all soils and treatments) and disappearance of S (some soils and treatments) from solution, strongly suggests that one or more anaerobic respiration pathways were active and contributed to heat release without proportional CO2 production (predicted by Equation 1), if the substrate was not completely oxidized. Both Fe and sulfate reduction are further subject to recycling of reaction intermediates and products (Weber et al., 2006; Canfield et al., 2010; Holler et al., 2011; Pester et al., 2012; Friedrich and Finster, 2014; Hansel et al., 2015; Berg et al., 2016), which constitute “hidden” or “cryptic” cycles when net measurements of total concentrations are used. Similarly, the detection of methane in all vials suggests that recycling of CO2 to methane may have contributed to lowering the net CO2 production, while emitting more heat than that expected from heterotrophic metabolism. However, we cannot partition between methane produced from acetate (or other organic compounds) and that produced from CO2 with the simplified approach used here and, thus, cannot reliably estimate heat generation from methanogenesis.
In complex systems, such as those examined here, it is impossible to determine exactly what substrate(s) were used at what time. However, the correlation between CO2 production and the initially available soluble C, as well as that between produced heat and the calculated ΔG released by aerobic and anaerobic (Fe(III), ) respiration of C from this pool (Figure 5), strongly suggests that the utilized substrates were in the soluble C pool. Even so, it is likely that the substrate used in the metabolic reactions (both aerobic and anaerobic) differed in NOSC from the average NOSC of the water-soluble C, as some compounds are more suitable for direct metabolism than others. Linear correlation analyses of produced CO2 relative to the estimated amount of different types of compounds that were present in the initial soluble C pool, provided strongest fits for the carbohydrate- and aminosugar-like groups (Table 5). These groups contain compounds that are commonly used substrates and that on average have NOSC values similar to the overall average for the soluble C. However, protein-like and (although less strongly) lipid-like and unsaturated hydrocarbon types of compounds also correlated with CO2, suggesting substrates with a considerably lower NOSC than the overall average were also metabolized. This explains, in part, the higher Rq/RCO2 ratios observed than predicted in this experiment. Indeed, using Equation (1) we can calculate the NOSC that would be required to generate the measured Rq/RCO2 values with purely aerobic respiration, and arrive at values ranging from 0.1 to −3.3 (excluding the glucose treatment in the mineral paddy soil), with most values falling below −1. However, there were no molecules identified in any of the soil or amendment water extracts with a NOSC below −1.83 (minimum NOSC ranged from −1.7 to −1.83), which corresponds to a Rq/RCO2 ratio of 663 kJ per mol CO2 i.e., almost identical to the 650 kJ per mol CO2 we arrived at with the linear regression of measured values (Figure 2). Therefore, we can conclude that anaerobic metabolism must have contributed to off-setting the Rq/RCO2 from the prediction, as shown above, as it is unlikely that only the most reduced substrates were used. Except for the glucose treatment in the mineral paddy soil, the calorespirometric ratios obtained in our study are reasonable and within range of what can be expected even in purely aerobic systems with the identified soluble substrates. The extreme Rq/RCO2 value obtained for the glucose treatment in the mineral paddy soil would have required a substrate with a NOSC < −4 if only aerobic respiration was active. Thus, low CO2-yielding anaerobic metabolism, such as fermentation and methanogenesis from CO2, must have occurred in this treatment.
We conclude that much of the variability between soils and treatments in overall microbial response to flooding can be explained by organic substrate solubility and the oxidation state of water soluble C (a corollary to thermodynamic yield and viability of microbial C oxidation). However, at a more detailed level, we observed highly variable responses in the types of metabolic processes that were stimulated by the different amendments, particularly in the mineral paddy soil. This could potentially be attributed to the differences in pH (Table 4) or variabilities in the microbial community composition among the soils. Given the overall higher metabolic activity (respiration and heat production) in glucose-amended vials, which is consistent with its thermodynamic and kinetic favorability for metabolic reactions, it is intriguing that both the dried straw and manure treatments generated a higher methane-production than the glucose treatment (Table 3). It is possible that the lower pH in the glucose treatment (Table 4) contributed to this effect, as methanogens are most active at circumneutral pH (Oh et al., 2003; Liu et al., 2008). It is also possible that the first pulse of aerobic respiration depleted the smaller pool of soluble and favorable organic substrates available in the dried straw and manure treatments, while generating enough CO2 to allow autotrophic methanogens to compete with heterotrophs (for H2); the first respiration pulse occurred earlier in these two treatments than in the glucose treatment (Figure 3). More surprising, perhaps, is that we only observed indications of sulfate reduction in the charred straw, dried straw, and manure treatments of the mineral paddy soil, which had the lowest initial sulfur concentration (Table 1) and the highest pH (Table 4). Further, the estimated proportion of anaerobically generated CO2 produced by sulfate reduction (0.27, 0.56, and 0.56 μmol CO2 per g soil and day for CS, M, and DS, respectively) was larger than that of iron reduction (0.04, 0.25, and 0.40 μmol CO2 per g soil and day) in all three treatments in this soil. It is likely that the gross rates of iron and sulfate reduction were higher than those measured by net changes in total dissolved Fe and S concentrations, as considerable recycling of Fe(II) and S redox intermediates is known to occur (Weber et al., 2006; Canfield et al., 2010; Holler et al., 2011; Pester et al., 2012; Friedrich and Finster, 2014; Hansel et al., 2015; Berg et al., 2016). Therefore, future work that includes more detailed measurements of Fe and S speciation [e.g., Fe(III) mineralogy, soluble Fe2+, HS−, and concentrations], would elucidate whether the unexpected absence of sulfate reduction in the peaty paddy and acid sulfate soils is real or hidden due to the recycling of sulfur. Likewise, such measurements would help resolve the reasons for the high methanogen-activity and apparent dominance of sulfate reduction over Fe-reduction after amendment with organic substrates in the mineral paddy soil.
In summary, this experiment showed that the microbial activity in soils (heat release and respiration) is strongly correlated with the availability and oxidation state of soluble organic C, indicating that the substrates used for metabolic reactions are found in this pool. This enhances the possibilities to use thermodynamic calculations to predict and evaluate metabolic processes in environments with complex organic matter, as long as the stoichiometric composition of the soluble organic C pool can be determined (e.g., by FT-ICR-MS). Our results further indicated that the chemical composition of the soluble C added with the amendments initiated divergent anaerobic respiration behavior, impacting methane production and the partitioning of elements between soil solid phase and solution. This variability led to non-uniform stimulation of carbon dioxide production per unit carbon added and off-set the calorespirometric ratios (Rq/RCO2) from predicted values for aerobic respiration; but there was still a strong linear correlation between energy release and respiration rate. We conclude that measurements which allow for energy and major elemental mass balances to be established can provide insights into the partitioning between main metabolic functions that govern C, nutrient, and contaminant fate in highly complex and transitory systems, such as paddy soils after flooding. Continued investigations to this end would be useful in order to further enlighten the mechanisms behind the observed variability. A deepened understanding of these mechanisms and their dependence on initial soil and organic matter properties will facilitate the development of simplified models for predicting the environmental outcomes of flooding.
Author Contributions
This study was conceived and designed by KB in consultation with SF and AMH. Field sampling was conducted by MS with assistance from KB and AMH. Experimental work was conducted by KB with assistance from MS and AMH. MT performed the FT-ICR-MS analyses and assisted with the data processing and interpretation. KB processed the experimental data and wrote the manuscript with assistance from all co-authors.
Funding
This work was funded by the Swedish Foundation for International Cooperation in Research and Higher Education (STINT Initiative Grant IB2013-5275). KB was supported in part by the Marcus and Amalia Wallenberg Foundation, Sweden, and in part by the SLAC SFA research program (SLAC FWP 10094), which is funded by the U.S. Department of Energy (DOE) Subsurface Biogeochemical Research (SBR) program within the Office of Biological and Environmental Research. Work by SF on this project was supported by US Department of Energy, Office of Biological and Environmental Research, Terrestrial Ecosystem Program (Award Number DE-FG02-13ER65542) and Subsurface Biogeochemistry Program (Award Number DE-SC0016544). AMH was supported by the Swedish Research Council for Environment, Agricultural Sciences and Spatial Planning (Formas 2012-530). MS was funded through the U.S. National Science Foundation Graduate Research Fellowship Program (Grant Number DGE-114747). A portion of the research (FT-ICR-MS analysis) was performed using EMSL, a DOE Office of Science User Facility sponsored by the Office of Biological and Environmental Research under proposal ID 49333.
Conflict of Interest Statement
The authors declare that the research was conducted in the absence of any commercial or financial relationships that could be construed as a potential conflict of interest.
Acknowledgments
We are very grateful to Professor Ngo Ngoc Hung and Do Thi Xuan at Can Tho University, Vietnam and Resource Development International, Cambodia for access to field sites and sampling assistance. Many thanks also to Shikha Avancha, Lilia Barragan, Guangchao Li, and Douglas Turner for laboratory assistance and analytical measurements.
References
Arcand, M. M., Levy-Booth, D. J., and Helgason, B. L. (2017). Resource legacies of organic and conventional management differentiate soil microbial carbon use. Front. Microbiol. 8:2293. doi: 10.3389/fmicb.2017.02293
Arndt, S., Jørgensen, B. B., LaRowe, D. E., Middelburg, J., Pancost, R., and Regnier, P. (2013). Quantifying the degradation of organic matter in marine sediments: a review and synthesis. Earth Sci. Rev. 123, 53–86. doi: 10.1016/j.earscirev.2013.02.008
Baldwin, D. S., and Mitchell, A. M. (2000). The effects of drying and re-flooding on the sediment and soil nutrient dynamics of lowland river–floodplain systems: a synthesis. Regul. Rivers 16, 457–467. doi: 10.1002/1099-1646(200009/10)16:5<457::AID-RRR597>3.0.CO;2-B
Barros, N., Hansen, L. D., Piñeiro, V., Pérez-Cruzado, C., Villanueva, M., Proupín, J., et al. (2016). Factors influencing the calorespirometric ratios of soil microbial metabolism. Soil Biol. Biochem. 92(Suppl. C), 221–229. doi: 10.1016/j.soilbio.2015.10.007
Barros, N., Piñeiro, V., and Hansen, L. D. (2015). Calorespirometry: a novel tool to assess the effect of temperature on soil organic matter decomposition. Thermochim. Acta 618(Suppl. C), 15–17. doi: 10.1016/j.tca.2015.09.005
Barros Pena, N., Merino García, A., Martín Pastor, M., and Pérez Cruzado, C. (2014). Changes in soil organic matter in a forestry chronosequence monitored by thermal analysis and calorimetry. SJSS 4, 239–253. doi: 10.3232/SJSS.2014.V4.N3.03
Berg, J. S., Michellod, D., Pjevac, P., Martinez-Perez, C., Buckner, C. R. T., Hach, P. F., et al. (2016). Intensive cryptic microbial iron cycling in the low iron water column of the meromictic Lake Cadagno. Environ. Microbiol. 18, 5288–5302. doi: 10.1111/1462-2920.13587
Bodelier, P. L., Bär-Gilissen, M.-J., Meima-Franke, M., and Hordijk, K. (2012). Structural and functional response of methane-consuming microbial communities to different flooding regimes in riparian soils. Ecol. Evol. 2, 106–127. doi: 10.1002/ece3.34
Bölscher, T., Wadsö, L., Börjesson, G., and Herrmann, A. M. (2016). Differences in substrate use efficiency: impacts of microbial community composition, land use management, and substrate complexity. Biol. Fertil. Soils 52, 547–559. doi: 10.1007/s00374-016-1097-5
Boye, K., Noël, V., Tfaily, M. M., Bone, S. E., Williams, K. H., Bargar, J. R., et al. (2017). Thermodynamically controlled preservation of organic carbon in floodplains. Nat. Geosci. 10, 415–419. doi: 10.1038/ngeo2940
Burns, A., and Ryder, D. S. (2001). Response of bacterial extracellular enzymes to inundation of floodplain sediments. Freshw. Biol. 46, 1299–1307. doi: 10.1046/j.1365-2427.2001.00750.x
Canfield, D. E., Stewart, F. J., Thamdrup, B., De Brabandere, L., Dalsgaard, T., Delong, E. F., et al. (2010). A cryptic sulfur cycle in oxygen-minimum–zone waters off the Chilean Coast. Science 330, 1375–1378. doi: 10.1126/science.1196889
Coates, J. D., Ellis, D. J., Gaw, C. V., and Lovley, D. R. (1999). Geothrix fermentans gen. nov., sp. nov., a novel Fe (III)-reducing bacterium from a hydrocarbon-contaminated aquifer. Int. J. Syst. Evol. Microbiol. 49, 1615–1622.
Corstanje, R., and Reddy, K. R. (2004). Response of biogeochemical indicators to a drawdown and subsequent reflood. J. Environ. Qual. 33, 2357–2366. doi: 10.2134/jeq2004.2357
Detmers, J., Brüchert, V., Habicht, K. S., and Kuever, J. (2001). Diversity of sulfur isotope fractionations by sulfate-reducing prokaryotes. Appl. Environ. Microbiol. 67, 888–894. doi: 10.1128/AEM.67.2.888-894.2001
Fierer, N., and Schimel, J. P. (2003). A proposed mechanism for the pulse in carbon dioxide production commonly observed following the rapid rewetting of a dry soil. Soil Sci. Soc. Am. J. 67, 798–805. doi: 10.2136/sssaj2003.0798
Friedrich, M. W., and Finster, K. W. (2014). How sulfur beats iron. Science 344, 974–975. doi: 10.1126/science.1255442
Göransson, H., Godbold, D. L., Jones, D. L., and Rousk, J. (2013). Bacterial growth and respiration responses upon rewetting dry forest soils: impact of drought-legacy. Soil Biol. Biochem. 57, 477–486. doi: 10.1016/j.soilbio.2012.08.031
Hansel, C. M., Lentini, C. J., Tang, Y., Johnston, D. T., Wankel, S. D., and Jardine, P. M. (2015). Dominance of sulfur-fueled iron oxide reduction in low-sulfate freshwater sediments. ISME J. 9, 2400–2412. doi: 10.1038/ismej.2015.50
Hansen, L. D., MacFarlane, C., McKinnon, N., Smith, B. N., and Criddle, R. S. (2004). Use of calorespirometric ratios, heat per CO2 and heat per O2, to quantify metabolic paths and energetics of growing cells. Thermochim. Acta 422, 55–61. doi: 10.1016/j.tca.2004.05.033
Heidelberg, J. F., Seshadri, R., Haveman, S. A., Hemme, C. L., Paulsen, I. T., Kolonay, J. F., et al. (2004). The genome sequence of the anaerobic, sulfate-reducing bacterium Desulfovibrio vulgaris Hildenborough. Nat. Biotechnol. 22:554. doi: 10.1038/nbt959
Herrmann, A. M., and Bölscher, T. (2015). Simultaneous screening of microbial energetics and CO2 respiration in soil samples from different ecosystems. Soil Biol. Biochem. 83(Suppl. C), 88–92. doi: 10.1016/j.soilbio.2015.01.020
Herrmann, A. M., Coucheney, E., and Nunan, N. (2014). Isothermal Microcalorimetry provides new insight into terrestrial carbon cycling. Environ. Sci. Technol. 48, 4344–4352. doi: 10.1021/es403941h
Hodgkins, S. B., Tfaily, M. M., McCalley, C. K., Logan, T. A., Crill, P. M., Saleska, S. R., et al. (2014). Changes in peat chemistry associated with permafrost thaw increase greenhouse gas production. Proc. Natl. Acad. Sci. U.S.A. 111, 5819–5824. doi: 10.1073/pnas.1314641111
Holler, T., Wegener, G., Niemann, H., Deusner, C., Ferdelman, T. G., Boetius, A., et al. (2011). Carbon and sulfur back flux during anaerobic microbial oxidation of methane and coupled sulfate reduction. Proc. Natl. Acad. Sci. U.S.A. 108, E1484–E1490. doi: 10.1073/pnas.1106032108
Jin, Q., and Bethke, C. M. (2005). Predicting the rate of microbial respiration in geochemical environments. Geochim. Cosmochim. Acta 69, 1133–1143. doi: 10.1016/j.gca.2004.08.010
Kim, S., Kramer, R. W., and Hatcher, P. G. (2003). Graphical method for analysis of ultrahigh-resolution broadband mass spectra of natural organic matter, the Van Krevelen Diagram. Anal. Chem. 75, 5336–5344. doi: 10.1021/ac034415p
Koch, B. P., and Dittmar, T. (2006). From mass to structure: an aromaticity index for high-resolution mass data of natural organic matter. Rapid Commun. Mass Spectr. 20, 926–932. doi: 10.1002/rcm.2386
Kujawinski, E. B., and Behn, M. D. (2006). Automated analysis of electrospray ionization fourier transform ion cyclotron resonance mass spectra of natural organic matter. Anal. Chem. 78, 4363–4373. doi: 10.1021/ac0600306
LaRowe, D. E., and Van Cappellen, P. (2011). Degradation of natural organic matter: a thermodynamic analysis. Geochim. Cosmochim. Acta 75, 2030–2042. doi: 10.1016/j.gca.2011.01.020
Liu, C. F., Yuan, X. Z., Zeng, G. M., Li, W. W., and Li, J. (2008). Prediction of methane yield at optimum pH for anaerobic digestion of organic fraction of municipal solid waste. Bioresour. Technol. 99, 882–888. doi: 10.1016/j.biortech.2007.01.013
Liu, J. S., Marison, I. W., and von Stockar, U. (2001). Microbial growth by a net heat up-take: a calorimetric and thermodynamic study on acetotrophic methanogenesis by Methanosarcina barkeri. Biotechnol. Bioeng. 75, 170–180. doi: 10.1002/bit.1176
Meisner, A., Bååth, E., and Rousk, J. (2013). Microbial growth responses upon rewetting soil dried for four days or one year. Soil Biol. Biochem. 66, 188–192. doi: 10.1016/j.soilbio.2013.07.014
Newman, S., and Pietro, K. (2001). Phosphorus storage and release in response to flooding: implications for Everglades stormwater treatment areas. Ecol. Eng. 18, 23–38. doi: 10.1016/S0925-8574(01)00063-5
Oh, S. E., Van Ginkel, S., and Logan, B. E. (2003). The relative effectiveness of pH control and heat treatment for enhancing biohydrogen gas production. Environ. Sci. Technol. 37, 5186–5190. doi: 10.1021/es034291y
Ozuolmez, D., Na, H., Lever, M., Kjeldsen, K., Jørgensen, B., and Plugge, C. (2015). Methanogenic archaea and sulfate reducing bacteria co-cultured on acetate: teamwork or coexistence? Front. Microbiol. 6:492. doi: 10.3389/fmicb.2015.00492
Pester, M., Knorr, K. H., Friedrich, M., Wagner, M., and Loy, A. (2012). Sulfate-reducing microorganisms in wetlands – fameless actors in carbon cycling and climate change. Front. Microbiol. 3:72. doi: 10.3389/fmicb.2012.00072
Postma, D., and Jakobsen, R. (1996). Redox zonation: equilibrium constraints on the Fe (III)/SO4-reduction interface. Geochim. Cosmochim. Acta 60, 3169–3175. doi: 10.1016/0016-7037(96)00156-1
Roden, E. E., and Jin, Q. (2011). Thermodynamics of microbial growth coupled to metabolism of glucose, ethanol, short-chain organic acids, and hydrogen. Appl. Environ. Microbiol. 77, 1907–1909. doi: 10.1128/AEM.02425-10
Shi, A., and Marschner, P. (2014). Drying and rewetting frequency influences cumulative respiration and its distribution over time in two soils with contrasting management. Soil Biol. Biochem. 72, 172–179. doi: 10.1016/j.soilbio.2014.02.001
Stubbins, A., Spencer, R. G. M., Chen, H., Hatcher, P. G., Mopper, K., Hernes, P. J., et al. (2010). Illuminated darkness: molecular signatures of Congo River dissolved organic matter and its photochemical alteration as revealed by ultrahigh precision mass spectrometry. Limnol. Oceanogr. 55, 1467–1477. doi: 10.4319/lo.2010.55.4.1467
Šantl-Temkiv, T., Finster, K., Dittmar, T., Hansen, B. M., Thyrhaug, R., Nielsen, N. W., et al. (2013). Hailstones: a window into the microbial and chemical inventory of a storm cloud. PLoS ONE 8:e53550. doi: 10.1371/journal.pone.0053550
Tfaily, M. M., Chu, R. K., Tolić, N., Roscioli, K. M., Anderton, C. R., Paša-Tolić, L., et al. (2015). Advanced solvent based methods for molecular characterization of soil organic matter by high-resolution mass spectrometry. Anal. Chem. 87, 5206–5215. doi: 10.1021/acs.analchem.5b00116
Tolić, N., Liu, Y., Liyu, A., Shen, Y., Tfaily, M. M., Kujawinski, E. B., et al. (2017). Formularity: software for automated formula assignment of natural and other organic matter from ultrahigh-resolution mass spectra. Anal. Chem. 89, 12659–12665. doi: 10.1021/acs.analchem.7b03318
Valett, H. M., Baker, M. A., Morrice, J. A., Crawford, C. S., Molles, M. C., Dahm, C. N., et al. (2005). Biogeochemical and metabolic responses to the flood pulse in a semiarid floodplain. Ecology 86, 220–234. doi: 10.1890/03-4091
von Stockar, U., and Liu, J.-S. (1999). Does microbial life always feed on negative entropy? Thermodynamic analysis of microbial growth. Biochim. Biophys. Acta Bioener. 1412, 191–211. doi: 10.1016/S0005-2728(99)00065-1
Weber, K. A., Achenbach, L. A., and Coates, J. D. (2006). Microorganisms pumping iron: anaerobic microbial iron oxidation and reduction. Nat. Rev. Microbiol. 4, 752–764. doi: 10.1038/nrmicro1490
Keywords: soil carbon, microbial respiration, organic amendments, anaerobic metabolism, paddy soil, calorimetry, FT-ICR-MS
Citation: Boye K, Herrmann AM, Schaefer MV, Tfaily MM and Fendorf S (2018) Discerning Microbially Mediated Processes During Redox Transitions in Flooded Soils Using Carbon and Energy Balances. Front. Environ. Sci. 6:15. doi: 10.3389/fenvs.2018.00015
Received: 23 December 2017; Accepted: 26 March 2018;
Published: 04 May 2018.
Edited by:
Jennifer Pett-Ridge, Lawrence Livermore National Laboratory (DOE), United StatesReviewed by:
Aaron Thompson, University of Georgia, United StatesNabeel Khan Niazi, University of Agriculture, Faisalabad, Pakistan
Copyright © 2018 Boye, Herrmann, Schaefer, Tfaily and Fendorf. This is an open-access article distributed under the terms of the Creative Commons Attribution License (CC BY). The use, distribution or reproduction in other forums is permitted, provided the original author(s) and the copyright owner are credited and that the original publication in this journal is cited, in accordance with accepted academic practice. No use, distribution or reproduction is permitted which does not comply with these terms.
*Correspondence: Kristin Boye, a2JveWVAc2xhYy5zdGFuZm9yZC5lZHU=