 Pascal Benard
 Mohsen Zarebanadkouki2
- 1Division of Soil Hydrology, University of Göttingen, Göttingen, Germany
- 2Chair of Soil Physics, University of Bayreuth, Bayreuth, Germany
Vast amounts of water flow through a thin layer of soil around the roots, the rhizosphere, where high microbial activity takes place—an important hydrological and biological hotspot. The rhizosphere was shown to turn water repellent upon drying, which has been interpreted as the effect of mucilage secreted by roots. The effects of such rhizosphere water dynamics on plant and microbial activity are unclear. Furthermore, our understanding of the biophysical mechanisms controlling the rhizosphere water repellency remains largely speculative. Our hypothesis is that the key to describe the emergence of water repellency lies within the microscopic distribution of wettability on the pore-scale. At a critical mucilage content, a sufficient fraction of pores is blocked and the rhizosphere turns water repellent. Here we tested whether a percolation approach is capable to predict the flow behavior near the critical mucilage content. The wettability of glass beads and sand mixed with chia seed mucilage was quantified by measuring the infiltration rate of water drops. Drop infiltration was simulated using a simple pore-network model in which mucilage was distributed heterogeneously throughout the pore space with a preference for small pores. The model approach proved capable to capture the percolation nature of the process, the sudden transition from wettable to water repellent and the high variability in infiltration rates near the percolation threshold. Our study highlights the importance of pore-scale distribution of mucilage in the emergent flow behavior across the rhizosphere.
Introduction
The rhizosphere is defined as the layer of soil particles actively modified by plant root growth and exudation (Gregory, 2006; Hinsinger et al., 2009). Regardless of its narrow extent ranging from millimeters to a few centimeters, this region is crossed by an immense amount of water. About 40% of all terrestrial precipitation flows across the root-soil interface when taken up by plants (Bengough, 2012; Sposito, 2013). In this context, the importance of the hydraulic properties of the rhizosphere, hosting a tremendous biodiversity (Philippot et al., 2013) ought to be acknowledged.
Alterations in rhizosphere physical and hydraulic properties induced by plant roots have been reported by an increasing number of studies (Young, 1995; Hallett et al., 2003; Carminati et al., 2010; Zarebanadkouki et al., 2016; Naveed et al., 2017). Several of these rhizosphere alterations were attributed to the presence of root exuded mucilage, such as hysteretic fluctuations in water content during drying-wetting cycles in the rhizosphere of lupins (Lupinus albus) (Carminati et al., 2010). In this case, the authors related the observed increased water retention during drying and decreased wettability during rewetting to root exuded mucilage. Low rhizosphere wettability was also observed in maize (Zea Mays) (Ahmed et al., 2016).
Mucilage is a polymeric substance released from the root tip. It is mainly composed of polysaccharides and about 1% of lipids (Oades, 1978; Read et al., 2003). It can be classified as a hydrogel (Brinker and Scherer, 1990) and its polymer network is capable to increase the water retention when embedded in a soil matrix (Kroener et al., 2018). Recently, Kroener et al. (2018) hypothesized that mucilage polymers need to be anchored to soil particles to withstand shrinkage and subsequent collapse during soil drying. It has been shown that mucilage and other highly polymeric substances, like bacterial EPS (extracellular polymeric substances) and their analogs, form distinct structures within the soil pore space during drying (Roberson et al., 1993; Albalasmeh and Ghezzehei, 2014; Benard et al., 2018). At low content, mucilage forms thin threads between particles. When a critical mucilage content is reached, these threads extend throughout the pore space forming large 2D lamellar structures (Benard et al., 2018). The authors proposed that this critical mucilage content determines the onset of water repellency in the rhizosphere. A physical explanation for the formation of these structures in drying soil was provided by Carminati et al. (2017) and was related to the high viscosity of mucilage.
Dry root mucilage deposits reduce soil wettability depending on plant species and concentration (Zickenrott et al., 2016; Naveed et al., 2017) and they can potentially turn hydrophobic (Ahmed et al., 2016). Kroener et al. (2015) and Benard et al. (2016, 2018) made a first attempt to estimate the amount of mucilage needed to induce water repellency in the rhizosphere for varying soil textures. Using a percolation model the authors were able to predict the mucilage content at which water could no longer penetrate into the soil. In the present paper, we aimed to further develop this model by including the temporal dynamics of water infiltration.
The water drop penetration time (WDPT) is typically used to characterize soil wettability. The method consists in placing water drops of known volume onto soil and capturing the time of their complete penetration into the pore space (van't Woudt, 1959; Dekker and Ritsema, 1996). We used this method to assess the water repellency of sand particles and glass beads mixed with chia seed mucilage, which is used as a preliminary model of the rhizosphere. Our hypothesis is that the water penetration time across the rhizosphere has a percolation nature which originates from the non-uniform distribution of mucilage (preferably deposited in small pores). This results in a heterogeneous distribution of wettability on the pore-scale, which in turns determines the on-set of water repellency. At a critical mucilage content (the percolation threshold), when a sufficient fraction of pores are non-wettable, the water penetration time increases and becomes highly variable. Above this threshold, the non-wettable pores block the water penetration, which becomes very slow, and macroscopic water repellency occurs. Surface roughness is expected to induce a more homogeneous distribution of mucilage and the percolation threshold is expected to occur at higher mucilage content. The effect of particle size on macroscopic wettability has been analyzed in a previous study (Benard et al., 2018), where it was shown that the finer are the soil particles, the higher is their specific surface and the critical mucilage content at which water repellency occurs.
Here, we focused on the temporal dynamics of water infiltration measured in sand and glass beads embedded with mucilage and simulated using a new percolation method. The model was designed as basic as possible to allow for an unbiased evaluation of its capabilities to capture the percolation nature of the process and assess the impact of pore-scale wettability on rhizosphere rewetting dynamics.
Materials and Methods
Mucilage Extraction and Sample Preparation
A detailed description of mucilage extraction and sample preparation can be found in Benard et al. (2018). In summary, we mixed different amounts of mucilage with glass beads of 0.1–0.2 mm, and fine sand of 0.125–0.2 mm in diameter to achieve different dry mucilage contents (weight of dry mucilage per weight of particles). As an analog for root exuded mucilage, we used mucilage extracted from chia seeds (Salvia hispanica L.). Its physical properties are similar to mucilage exuded by maize roots in the sense that for increasing mucilage content the contact angle increases (Ahmed et al., 2016). The mixtures of mucilage and glass beads (and of mucilage and sand) were spread on glass slides and let dry at 20°C for 48 h. Upon drying the samples were not repacked to avoid artificial alterations of the microscopic mucilage distribution in the pore space. Dry mucilage content of the samples ranged from 0.9 to 6 mg g−1 in glass beads, and 2.8 to 9.3 mg g−1 in sand. These ranges of mucilage content were selected according to preliminary tests. At higher contents the samples were repellent (contact angle above 90°), while at lower contents the samples were wettable. We focused on the interesting ranges of mucilage content when the samples switched between the two states. Sample thickness was ~1.5 ± 0.1 mm.
Wettability Quantification
In a classical WDPT (water drop penetration time) test, drops of known volume are placed on a soil and the time for complete penetration is captured. The water drop penetration times are divided in discrete classes to characterize the wettability of different soils (van't Woudt, 1959; Dekker and Ritsema, 1996). In this study we focused on the infiltration dynamics in soil affected by dry mucilage deposits of reduced wettability. To capture the effect of mucilage on infiltration dynamics we placed 1 μL drops of deionized water on the dry samples and the infiltration process was recorded at intervals of about 200 ms (CCD camera; Drop Shape Analyzer DSA30, Krüss GmbH). The drop volume was estimated from the optically detected drop geometry and a manually set baseline. For each mucilage content two slides were prepared and the infiltration of at least 10 drops per slide was captured. Note that the decrease in volume could not always be easily captured from recorded image sequences. Due to that reason, the number of captured drop infiltrations per mucilage content ranged from 13 to 20 in glass beads and 19 to 31 in sand.
For high mucilage content, water did not completely infiltrate within the observation time of 5 min. Therefore, we calculated the WDPT from the slope of the infiltration rate over the square root of time. For consistency we followed this procedure for all measurements.
Measurements were conducted in a temperature controlled room at about 25°C. Humidity was not measured in the process of wettability quantification. Evaporation loss was approximated for a relative humidity of 65%.
Model Description
We developed a simple pore-network model based on the concept of percolation theory. In a percolation system, pores are randomly assigned open or closed. When a critical fraction of pores is blocked, the connectivity of the open pores is strongly reduced and the system switches from conductive to non-conductive. Our idea is that such a concept can be used to predict and describe the transition of soils mixed with hydrophobic substances such as mucilage from wettable to water repellent. We assume that the distribution of pore sizes of our model system is random and during drying mucilage is preferentially deposited in the small pores. The contact angle in each pore depends on its specific surface and the amount of mucilage. If the contact angle is above 90° the pore is blocked.
The effect of the pore-scale distribution of wettability is illustrated in Figure 1, in which pores are distributed on a 2D square lattice. When the fraction of hydrophobic pores reaches a critical value (at the percolation threshold), small variations in their number and distribution can cause a substantial change in macroscopic wettability, as in the central image of Figure 1. For a low mucilage content in soil, most pores are wettable and so is the soil (left image). At the threshold mucilage content, there is a 50% chance for a connected cluster of wettable pores to span from the upper to the lower side of the system (central image). Macroscopic wettability is most critically affected by the pore-scale distribution of wettability at this point and preferential flow is likely to be observed. Above this threshold, the rhizosphere turns water repellent (right image).
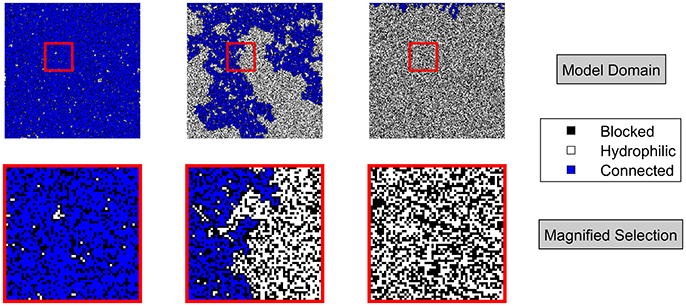
Figure 1. (Top) Results from a percolation model in a 2D square lattice of 300 x 300 sites. Probability of a pore to be hydrophobic, hence blocked from left to right: 0.3, 0.41, 0.5. (Bottom) Magnification of indicated area (red rectangle) of 60 x 60 pores of above shown realizations. Hydrophobic pores are black. Hydrophilic pores are white. Open pores connected to the top of the system are blue.
The percolation model described hereafter was used to simulate the water drop infiltration experiments. The numerical model was written in MATLAB 2017b (The MathWorks, Inc.). Capillarity was considered to be the main driving force for infiltration of 1 μL of water. Pores can be filled only through saturated adjacent pores. In consecutive steps, the shortest time to fill a pore is calculated. The time is derived by approximation of water flow through a cylindrical pore, with the flow rate depending on the contact angle, pathway distance and pore radius. Saturation of each pore currently being filled is updated according to this interval. Simultaneously, the decrease in drop volume is corrected for loss by evaporation according to the approximation by Hu and Larson (2002). Final water drop penetration time is derived by summation of all consecutive infiltration and/or evaporation time steps needed to deplete a drop volume of 1 μL.
The soil pores are placed on a cubic lattice with a coordination number of 6, hence each pore is connected to its six adjacent neighbors. Pore volume is estimated from a random normal distribution of grain diameters between 0.1 and 0.2 (glass beads), respectively 0.125–0.2 mm (sand), assuming a porosity of 0.36, which is the porosity of a random close packing (RCP) of equally sized spheres (Torquato et al., 2000). The surface area of a pore derived for a cubic packing is corrected to fit the increase in surface area by 1.22 for a unit volume of an RCP of spheres. The surface area was doubled for simulations in sand, to account for roughness which induced an increase in the number of sites for preferential mucilage deposition (Benard et al., 2018). The mucilage content of each pore is derived from a random normal distribution of mucilage contents. Mucilage contents from high to low are assigned to pore volumes from small to large. In this way we mimicked the preferential deposition of mucilage in small pores.
Flow of water from a filled to an empty accessible (wettable) pore is calculated through a cylindrical capillary of length L, which is equal to the sum of the two grain radii of particles defining adjacent pores. The radius of the cylinder r is derived from the biggest circle that can be fit into the bottleneck of the smaller particle pack. The term bottleneck refers to the minimum radius of the six pathways toward the central pore in a cubic packing of spheres.
Flow from a filled into an empty pore through a cylindrical capillary is calculated employing the Hagen-Poiseuille Equation (1):
where the volumetric flow rate Q [mm3 ms−1] depends on the radius of the connecting capillary r [mm], viscosity of water η [mN ms mm−2], flow length L [mm], and the pressure gradient Δp [mN mm−2]. The capillary pressure in a cylindrical tube is approximated employing the Young-Laplace Equation (1):
with surface tension γ [mN mm−1], contact angle α [deg.], and pore radius r [mm].
Integrating (2) into (1) and given Q = V/t one obtains the time t [ms] it takes to fill a pore of defined volume V [mm3] through a cylindrical pipe (3):
Note that Ltot is the length of the flow path from the placed drop of water through water filled pores to an empty accessible pore. The derived time to fill a pore and the current flux Q into a pore is updated for additional flow paths emerging in the process of water percolation through the system. In other words, when water finds an additional route to a partially unsaturated pore, this pore is filled quicker.
The contact angle α was calibrated using the measurements by Benard et al. (2016). In this study, the contact angle was measured for different concentrations of mucilage per surface area. Contact angles were derived after fitting the contact angle against the square root of dry mucilage concentration per surface area (Figure 2).
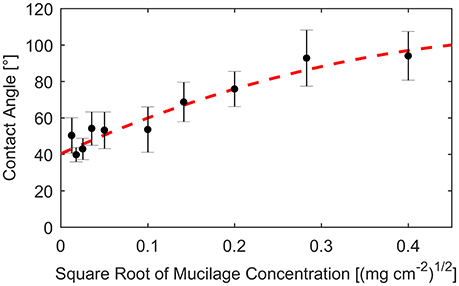
Figure 2. Contact angle measured on glass slides covered with different concentrations of mucilage per surface area (dots). Standard deviation indicated by error bars. Fit of measured contact angles against square root of mucilage concentration per surface area (dashed line).
Since our measurements were based on optical measures of the decrease in drop volume, the decrease was corrected for loss by evaporation. In water repellent conditions when the contribution of infiltration diminishes, evaporation substantially contributes to the decrease in drop volume over time. The current evaporation rate e(t) [μL s−1] is approximated according to Hu and Larson (2002):
with contact-line radius R [mm], water vapor diffusivity D [mm2 s−1], relative humidity H [-], saturated water vapor concentration cv [g mm−3], and drop contact angle α [rad.] which changes over time. R [mm] was derived from the mean size of the 9 randomly generated grains in x- and y-direction below the imposed drop center. In this way a mean base radius of 0.68 mm for 0.1 to 0.2 mm particles (glass beads) and 0.73 mm for 0.125–0.2 mm particles (sand) was achieved.
For known initial drop volume (i.e., 1 μL), the contact angle α is derived integrating the height of the drop h [mm] in its center (5) into (6). The initial contact angle of a water drop on a sample is approximated in this first step based on the initial volume [V(t = 0), i.e., 1 μL] and base radius R. The drop volume is decreased by the sum of evaporated and infiltrated volume in each time step. As long as additional pores are being filled, α is adapted for a decrease in drop volume according to the shortest time step t needed to saturate an additional pore. Maximum time step for infiltration was fixed to 1000 ms to assure a constant update of evaporation and avoid overestimation of infiltration times, especially in the water repellent regime. When the infiltration of water was incomplete, due to a lack of accessible empty pores, the time step of constant evaporation was fixed to 1000 ms. In this way the contact angle was adapted over time and evaporation was approximated stepwise with decrease in drop volume.
Results
Wettability Quantification
Measurements of decrease in drop volume over time were performed for a range of dry mucilage contents across the transition to water repellency. Individual infiltration slopes were obtained by fitting the decrease in drop volume as a function of square root of time. Results are presented as a summary of fitted slopes of infiltration curves at each mucilage content (Figure 3).
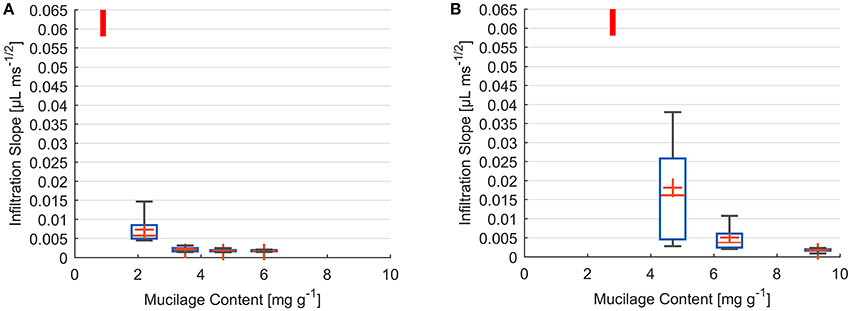
Figure 3. Box and Whisker plots of infiltration slope derived from fit of volume against square root of time for water drops placed on glass bead (A) and sand (B) samples of different dry mucilage content; Lowest measured mucilage content (infiltration time below detection limit) indicated by red bar; Slope at 300 ms detection limit ≥ 0.058 μL ms−1/2; Whiskers mark the upper and lower 25% (quartiles) of values excluding outliers exceeding 1.5 times the interquartile range (box); Median indicated by red line within the box separating second and third quartile. Mean indicated by red cross.
The infiltration dynamics in glass beads showed a threshold-like decrease in wettability with increase in dry mucilage content. For 0.9 mg g−1 all drops penetrated within 300 ms corresponding to a slope of ≥0.058 μL ms−1/2. At 2.2 mg g−1 a high variation was observed, with the infiltration slopes ranging from 0.015 to 0.004 μL ms−1/2. Standard deviation decreased with increase in mucilage content. Mean infiltration slopes decreased to 0.0023, 0.0018, and 0.0018 μL ms−1/2 for 3.5, 4.7, and 6 mg g−1 respectively (Figure 3A).
For the lowest content of 2.8 mg g−1 in sand, all drops infiltrated within the detection limit of 300 ms (slope of ≥0.058 μL ms−1/2). At 4.7 mg g−1 a high variability in infiltration slopes was observed. Slopes ranged from 0.003 to 0.038 μL ms−1/2 with a mean of 0.003 μL ms−1/2. With an increase to 6.5 mg g−1 variation in infiltration slope decreased to values between 0.011 and 0.002 μL ms−1/2. The highest mucilage content of 9.3 mg g−1 resulted in a mean infiltration slope of 0.002 μL ms−1/2 (Figure 3B).
Water Drop Penetration Time (WDPT)
The derived water drop penetration time (WDPT) from measurements and simulations are shown alongside exemplary top views of average final water saturation from simulations (Figures 4, 5).
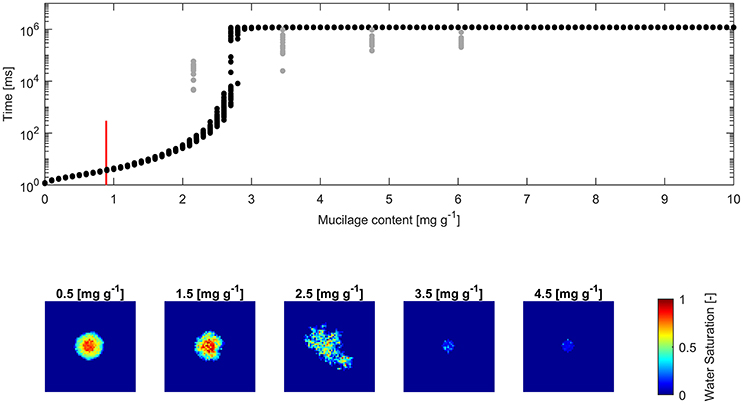
Figure 4. (Top) Water drop penetration time (WDPT) derived from optically detected drop volume decrease (gray dots) and simulated WDPT (black dots) in glass beads (0.1–0.2 mm in diameter); Detection limit of 300 ms is indicated for the lowest measured mucilage content of 0.9 mg g−1 by a red bar; (Bottom) left to right: Top view of average final water saturation of exemplary simulations of mucilage contents across the repellent transition.
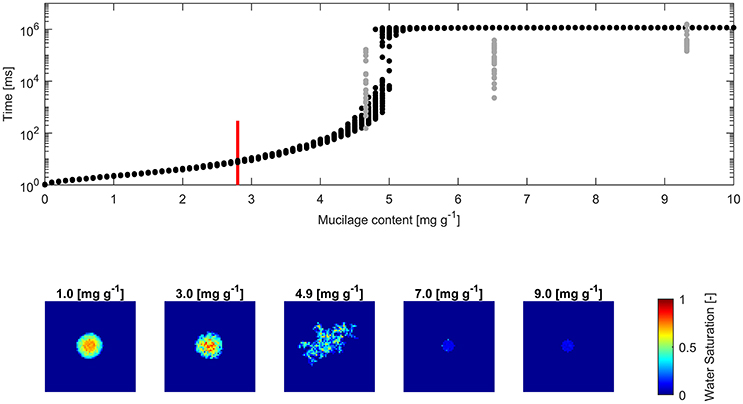
Figure 5. (Top) Water drop penetration time (WDPT) fitted from optically detected drop volume decrease (gray dots) and simulated WDPT (black dots) in sand (0.125–0.2 mm in diameter); Detection limit of 300 ms is indicated for the lowest measured mucilage content of 2.8 mg g−1 by a red bar; (Bottom) left to right: Top view of average final water saturation of exemplary simulations of mucilage contents across the repellent transition.
The square root of the Pearson product moment correlation coefficient (r2) of the mean WDPT of measurements and simulations including the lowest mucilage content measured with an approximated WDPT of 150 ms was 0.16. For glass beads it was 0.18 and for sand it was 0.55.
Fitted measurements and simulations of infiltration in glass beads showed increasing WDPT with increasing mucilage content (Figure 4). The threshold mucilage content was identified between 2.5 and 2.8 mg g−1 from the simulations, marked by a maximum in variability in penetration time and followed by a drastic change in wettability. Likewise, a maximum in diversity of connected, water filled pore clusters (wetted front) was observed across the threshold. Mean WDPT from simulations above the repellent transition (>3 mg g−1) was about 19.7 min.
Fitted WDPT and simulations in sand showed a similar trend as in glass beads with a high variability and rapid change in wettability at 4.9 mg g−1 (Figure 5). Derived mean WDPT from simulations above the repellent transition (>5.5 mg g−1) was about 19.1 min.
Discussion
The main hypothesis was that the occurrence of macroscopic water repellency and the critical nature of water infiltration in soils mixed with mucilage was related to the heterogeneous distribution of wettability on the pore-scale. We tested this hypothesis by monitoring the infiltration of water drops placed on particles of comparable size and different surface roughness mixed with varying mucilage content. Subsequently, a simple pore-network model was used to simulate the drop infiltration experiments.
The water drop penetration time in glass beads and sand mixed with mucilage showed the expected threshold-like behavior, with a sudden increase in penetration time. Infiltration times increased from milliseconds to minutes for mucilage contents ranging from 1 to 6 mg g−1 in glass beads, respectively 3 to 9 mg g−1 in sand. The derived threshold for sand is in agreement with the results of Kroener et al. (2015), who observed it between 5 and 10 mg g−1.
The highest variability in infiltration time was observed at the percolation threshold, confirming the percolation nature of the process. The threshold in penetration time was well predicted by the model in which mucilage was preferentially deposited in small pores inducing a heterogeneous spatial distribution of wettability. Measurements and simulations confirm the substantial impact of the heterogeneous pore-scale wettability on water flow through the rhizosphere. When the continuity of wettable pores was blocked, the onset of macroscopic soil water repellency was observed. Increased surface roughness in sand caused the expected shift to higher mucilage content needed to induce macroscopic water repellency.
The simulations showed a sharper transition in wettability than the measurements. This might be related to the assumption that mucilage is mainly deposited in small pores. This caused large pores to remain almost unaffected and highly conductive. An underestimation of infiltration time is therefore likely to occur below the repellent transition. Additionally, the difference might arise from the time dependent properties of mucilage not considered in the model. Wettability of substrates mixed with mucilage is expected to increase over time as a consequence of mucilage rehydration and decrease in contact angle, as reported in Moradi et al. (2012) and Zickenrott et al. (2016). Below the percolation threshold, water penetration is matter of milliseconds to seconds. Due to this reason, a decrease in contact angle upon rewetting does not impact water penetration. Nevertheless, pore clogging due to mucilage rehydration and swelling might slow down the infiltration process at and above the wettability threshold. Above the repellent transition, mean infiltration time deviated by several minutes from measurements in glass beads and sand. Water adsorption by previously dry, hydrophobic mucilage deposits could be an explanation for the overestimated water penetration time.
The variability in infiltration times across the wettability threshold was bigger and the transition smoother in sand than in glass beads. This difference between sand and glass beads is possibly related to the increased surface roughness of sand particles. Rough surface leads to an increase in number of sites for preferential mucilage deposition (Benard et al., 2018), inducing a more uniform distribution of wettability and resulting in a smoother transition across the threshold. It also explains the higher mucilage content needed to achieve a similar magnitude of water repellency as observed in glass beads in terms of infiltration time.
This study shows that macroscopic water repellency in substrates mixed with mucilage emerges from the distribution of mucilage on the pore-scale and it has a percolation nature. Toward and above the percolation threshold, the fraction of non-wettable pores increases and eventually blocks the pathway for water infiltration and the porous medium turns water repellent. The fact that water repellency was observed repeatedly in the rhizosphere (Carminati et al., 2010; Moradi et al., 2012; Ahmed et al., 2016) indicates that mucilage content around the roots is close to or above the percolation threshold. If we assume that the size of connected pore clusters affected by high mucilage content (high enough to induce water repellency) increases across the percolation threshold1, then the combination of water retention and preferential distribution has the potential to keep pores hydraulically connected at low matric potential, when otherwise this crucial link would be lost. Additionally, close to the percolation threshold, roots could effectively control the wettability, and therefore also the diffusion of oxygen, by slightly changing the exudation rate or the chemical composition of exudates.
In summary this study reveals that the wettability of soils embedded with mucilage emerges from pore-scale mechanisms and has a percolation nature—the connectivity of hydrophobic pores determines the switch from wettable to non-wettable soil. The mixture of sand (or glass beads) with chia mucilage has been used as analog of the rhizosphere. Doing so, we implicitly assumed that (1) mucilage is the primary factor controlling the rhizosphere wettability, (2) mucilage from chia seeds is a good analog of root mucilage, and (3) the processes can be easily scaled for finer soil textures. All these assumptions are (over)simplifications of rhizosphere dynamics. First of all, mucilage from different plant species showed different degrees of water repellency (Zickenrott et al., 2016; Naveed et al., 2018). Secondly, in the rhizosphere root exudates are degraded by microorganisms, which can secret other highly polymeric blends altering the properties of the soil solution. Such complexities need to be studied and applied to varying soil textures, including structured soils. The importance of the current study is that it points to the pore-scale distribution of hydrophilic/hydrophobic region as the key factor determining the rhizosphere properties and it proposes the percolation theory as the key concept to link pore-scale to transport properties across the rhizosphere.
Author Contributions
PB, MZ, and AC conceived the experimental set-up. PB conducted the experiments and processed the data. PB and AC developed the conceptual model. PB developed the numerical code and wrote the manuscript in consultation with MZ and AC.
Funding
The doctoral position of PB was funded by the Volkswagen Stiftung (VWZN3152).
Conflict of Interest Statement
The authors declare that the research was conducted in the absence of any commercial or financial relationships that could be construed as a potential conflict of interest.
Footnotes
1. ^This assumption implies that the coordination number of pores critically affected by mucilage is bigger than the one of hydraulically connected (hydrophilic) pores.
References
Ahmed, M. A., Kroener, E., Benard, P., Zarebanadkouki, M., Kaestner, A., and, Carminati, A. (2016). Drying of mucilage causes water repellency in the rhizosphere of maize: measurements and modelling. Plant Soil 407, 161–171. doi: 10.1007/s11104-015-2749-1
Albalasmeh, A. A., and Ghezzehei, T. A. (2014). Interplay between soil drying and root exudation in rhizosheath development. Plant Soil 374, 739–751. doi: 10.1007/s11104-013-1910-y
Benard, P., Kroener, E., Vontobel, P., Kaestner, A., and Carminati, A. (2016). Water percolation through the root-soil interface. Adv. Water Resour. 95, 190–198. doi: 10.1016/j.advwatres.2015.09.014
Benard, P., Zarebanadkouki, M., Hedwig, C., Holz, M., Ahmed, M. A., and Carminati, A. (2018). Pore-scale distribution of mucilage affecting water repellency in the rhizosphere. Vadose Zone J. 17:17001. doi: 10.2136/vzj2017.01.0013
Bengough, A. G. (2012). Water dynamics of the root zone: rhizosphere biophysics and its control on soil hydrology. Vadose Zone J. 11. doi: 10.2136/vzj2011.0111
Brinker, C. J. and Scherer, G. W. (1990). Sol-gel Science: The Physics and Chemistry of Sol-gel Processing. Boston, MA: Academic Press.
Carminati, A., Moradi, A. B., Vetterlein, D., Vontobel, P., Lehmann, E., Oswald, U., et al. (2010). Dynamics of soil water content in the rhizosphere. Plant Soil 332, 163–176. doi: 10.1007/s11104-010-0283-8
Carminati, A., Benard, P., Ahmed, M. A., and Zarebanadkouki, M. (2017). Liquid bridges at the root-soil interface. Plant Soil 417, 1–15. doi: 10.1007/s11104-017-3227-8
Dekker, L. W., and Ritsema, C. J. (1996). Variation in water content and wetting patterns in Dutch water repellent peaty clay and clayey peat soils. Catena 28, 89–105. doi: 10.1016/S0341-8162(96)00047-1
Gregory, P. J. (2006). Roots, rhizosphere and soil: the route to a better understanding of soil science? Eur. J. Soil Sci. 57, 2–12. doi: 10.1111/j.1365-2389.2005.00778.x
Hallett, P. D., Gordon, D. C., and Bengough, A. G. (2003). Plant influence on rhizosphere hydraulic properties: direct measurements using a miniaturized infiltrometer. New Phytol. 157, 597–603. doi: 10.1046/j.1469-8137.2003.00690.x
Hinsinger, P., Bengough, A. G., Vetterlein, D., and Young, I. M. (2009). Rhizosphere: biophysics, biogeochemistry and ecological relevance. Plant Soil 321, 117–152. doi: 10.1007/s11104-008-9885-9
Hu, H., and Larson, R. G. (2002). Evaporation of a sessile droplet on a substrate. J. Phys. Chem. B 106, 1334–1344. doi: 10.1021/jp0118322
Kroener, E., Ahmed, M. A., and Carminati, A. (2015). Roots at the percolation threshold. Phys. Rev. E 91:042706. doi: 10.1103/PhysRevE.91.042706
Kroener, E., Holz, M., Zarebanadkouki, M., Ahmed, M., and Carminati, A. (2018). Effects of mucilage on rhizosphere hydraulic functions depend on soil particle size. Vadose Zone J. 17:170056. doi: 10.2136/vzj2017.03.0056
Moradi, A. B., Carminati, A., Lamparter, A., Woche, S. K., Bachmann, J., Oswald, D., et al. (2012). Is the rhizosphere temporarily water repellent? Vadose Zone J. 11. doi: 10.2136/vzj2011.0120
Naveed, M., Brown, L. K., Raffan, A. C., George, T. S., Bengough, A. G., Hallett, T., et al. (2017). Plant exudates may stabilize or weaken soil depending on species, origin and time: effect of plant exudates on rhizosphere formation. Eur. J. Soil Sci. 68, 806–816. doi: 10.1111/ejss.12487
Naveed, M., Brown, L. K., Raffan, A. C., George, T. S., Bengough, A. G., Hallett, T., et al. (2018). Rhizosphere-scale quantification of hydraulic and mechanical properties of soil impacted by root and seed exudates. Vadose Zone J. 17:170083. doi: 10.2136/vzj2017.04.0083
Oades, J. M. (1978). Mucilages at the root surface. Eur. J. Soil Sci. 29, 1–16. doi: 10.1111/j.1365-2389.1978.tb02025.x
Philippot, L., Raaijmakers, J. M., Lemanceau, P., and van der Putten, W. H. (2013). Going back to the roots: the microbial ecology of the rhizosphere. Nat. Rev. Microbiol. 11, 789–799. doi: 10.1038/nrmicro3109
Read, D. B., Bengough, A. G., Gregory, P. J., Crawford, J. W., Robinson, D., Zhang, C. M., et al. (2003). Plant roots release phospholipid surfactants that modify the physical and chemical properties of soil. New Phytol. 157, 315–326. doi: 10.1046/j.1469-8137.2003.00665.x
Roberson, E. B., Chenu, C., and Firestone, M. K. (1993). Microstructural changes in bacterial exopolysaccharides during desiccation. Soil Biol. Biochem. 25, 1299–1301. doi: 10.1016/0038-0717(93)90230-9
Sposito, G. (2013). Green water and global food security. Vadose Zone J. 12. doi: 10.2136/vzj2013.02.0041
Torquato, S., Truskett, T. M., and Debenedetti, P. G. (2000). Is random close packing of spheres well defined? Phys. Rev. Lett. 84:2064. doi: 10.1103/PhysRevLett.84.2064
van't Woudt, B. D. (1959). Particle coatings affecting the wettability of soils. J. Geophys. Res. 64, 263–267. doi: 10.1029/JZ064i002p00263
Young, I. M. (1995). Variation in moisture contents between bulk soil and the rhizosheath of wheat (Triticum aestivum L. cv. Wembley). New Phytol. 130, 135–139. doi: 10.1111/j.1469-8137.1995.tb01823.x
Zarebanadkouki, M., Ahmed, M. A., and Carminati, A. (2016). Hydraulic conductivity of the root-soil interface of lupin in sandy soil after drying and rewetting. Plant Soil 398, 267–280. doi: 10.1007/s11104-015-2668-1
Zickenrott, I.-M., Woche, S. K., Bachmann, J., Ahmed, M. A., and Vetterlein, D. (2016). An efficient method for the collection of root mucilage from different plant species-A case study on the effect of mucilage on soil water repellency. J. Plant Nutr. Soil Sci. 179, 294–302. doi: 10.1002/jpln.201500511
Keywords: rhizosphere, water percolation, mucilage, water repellency, rewetting, pore scale, connectivity
Citation: Benard P, Zarebanadkouki M and Carminati A (2018) Impact of Pore-Scale Wettability on Rhizosphere Rewetting. Front. Environ. Sci. 6:16. doi: 10.3389/fenvs.2018.00016
Received: 05 January 2018; Accepted: 26 March 2018;
Published: 11 April 2018.
Edited by:
Philippe C. Baveye, AgroParisTech Institut des Sciences et Industries du Vivant et de L'environnement, FranceReviewed by:
Hannes Schmidt, Universität Wien, AustriaWieslaw Fialkiewicz, Wroclaw University of Environmental and Life Sciences, Poland
Copyright © 2018 Benard, Zarebanadkouki and Carminati. This is an open-access article distributed under the terms of the Creative Commons Attribution License (CC BY). The use, distribution or reproduction in other forums is permitted, provided the original author(s) and the copyright owner are credited and that the original publication in this journal is cited, in accordance with accepted academic practice. No use, distribution or reproduction is permitted which does not comply with these terms.
*Correspondence: Pascal Benard, cGJlbmFyZEB1bmktZ29ldHRpbmdlbi5kZQ==