 Steffen Schlüter1*
 Sina Henjes2Jan Zawallich3Linda Bergaust4
 Marcus Horn2Olaf Ippisch3
 Hans-Jörg Vogel1,5
 Peter Dörsch6
- 1Department of Soil System Sciences, Helmholtz-Centre for Environmental Research-UFZ, Halle, Germany
- 2Institute of Microbiology, Leibniz University, Hannover, Germany
- 3Institue of Mathematics, TU Clausthal, Claustal-Zellerfeld, Germany
- 4Faculty of Chemistry, Biotechnology and Food Science, Norwegian University of Life Sciences, NMBU, Ås, Akershus, Norway
- 5Institute of Soil Science and Plant Nutrition, Martin Luther University of Halle-Wittenberg, Halle, Germany
- 6Faculty of Environmental Sciences and Natural Resource Management, Norwegian University of Life Sciences, NMBU, Ås, Akershus, Norway
Soil-borne nitrous oxide (N2O) emissions have a high spatial and temporal variability which is commonly attributed to the occurrence of hotspots and hot moments for microbial activity in aggregated soil. Yet there is only limited information about the biophysical processes that regulate the production and consumption of N2O on microscopic scales in undisturbed soil. In this study, we introduce an experimental framework relying on simplified porous media that circumvents some of the complexities occuring in natural soils while fully accounting for physical constraints believed to control microbial activity in general and denitrification in particular. We used this framework to explore the impact of aggregate size and external oxygen concentration on the kinetics of O2 consumption, as well as CO2 and N2O production. Model aggregates of different sizes (3.5 vs. 7 mm diameter) composed of porous, sintered glass were saturated with a defined growth medium containing roughly 109 cells ml−1 of the facultative anaerobic, nosZ-deficient denitrifier Agrobacterium tumefaciens with N2O as final denitrification product and incubated at five different oxygen levels (0–13 vol-%). We demonstrate that the onset of denitrification depends on the amount of external oxygen and the size of aggregates. Smaller aggregates were better supplied with oxygen due to a larger surface-to-volume ratio, which resulted in faster growth and an earlier onset of denitrification. In larger aggregates, the onset of denitrification was more gradual, but with comparably higher N2O production rates once the anoxic aggregate centers were fully developed. The normalized electron flow from the reduced carbon substrate to N-oxyanions (/ ratio) could be solely described as a function of initial oxygen concentration in the headspace with a simple, hyperbolic model, for which the two empirical parameters changed with aggregate size in a consistent way. These findings confirm the important role of soil structure on N2O emissions from denitrification by shaping the spatial patterns of microbial activity and anoxia in aggregated soil. Our dataset may serve as a benchmark for constraining or validating spatially explicit, biophysical models of denitrification in aggregated soil.
1. Introduction
Emission and uptake of greenhouse gases (CO2, CH4, N2O) by soil are subject to pronounced spatial and temporal fluctuations. Emission patterns in space and time appear to be controlled by the spatial and temporal distribution of labile organic matter (e.g., roots, crop residues, animal manure, particulate organic matter) and the occurrence of physicochemical conditions (e.g., temperature, soil moisture, anoxic volumes) favorable for specific microbial processes (e.g., nitrification, denitrification). This has led to the notion that the bulk of microbially driven greenhouse gas (GHG) turnover occurs in “hot spots” and during “hot moments” (Groffman et al., 2009; Vos et al., 2013; Kuzyakov and Blagodatskaya, 2015; Tecon and Or, 2017). While the emission of carbon dioxide (CO2) through soil respiration exhibits a fairly low spatio-temporal variability, nitrous oxide emissions (N2O) are a notorious example for extreme variability. Sampling campaigns with undisturbed soil often exhibit a log-normal distribution of denitrification activity in aerated soil with numerous “coldspots” without emissions and some samples with very high emissions (Röver et al., 1999; Mathieu et al., 2006). In a seminal study Parkin (1987) demonstrated that 25–85% of denitrification activity was associated with particulate organic matter that comprised <1% of the soil volume. Thus, a better understanding of denitrification activity on microscopic scales is required to improve predictions of N2O emissions at relevant spatial scales.
Denitrifiers are facultative aerobes that start to denitrify when oxygen becomes limiting. The reduction of nitrate () to dinitrogen (N2) occurs via a series of enzymatic steps and intermediates (, NO, N2O) (Philippot et al., 2007). The basic requirements for heterotrophic denitrification in soil are (1) the presence of decomposable carbon supplying electrons for anaerobic respiration, (2) a shortage of O2 as electron acceptor, (3) the availability of as an alternative electron acceptor and (4) a microbial community that has the capacity to express the enzymes for some or all reduction steps in denitrification. Key soil environmental factors that govern denitrification are well understood and can be roughly grouped into biochemical constraints and physical constraints, but it is the interaction of all factors that causes the seemingly erratic nature of denitrification activity in soils. Firstly, denitrification is constrained biochemically by the availability and quality of carbon substrates in soil such as root exsudates, plant litter and soil organic matter. Besides sustaining denitrification, organic substrates fuel aerobic respiration, thus enhancing local anoxia in micro-sites. Secondly, the denitrifier community is composed of species exhibiting different regulatory phenotypes (Bergaust et al., 2011) that differ in completeness and timing of denitrification gene transcription. This causes the onset of denitrification as well as the accumulation of intermediates to be different for different denitrifying communities (Dörsch et al., 2012). Notably, a significant fraction of the denitrifiers does not have the genetic capacity to reduce N2O (Jones and Hallin, 2010) and it is debated whether functional redundancy enabling complete denitrification is always warranted in soil microbial consortia at a micro-scale (Philippot et al., 2011, 2013). Simplistic estimates of spatially explicit bacterial diversity in soil suggest that moderately active soil (109 cells g−1 soil) harbors around 100 bacterial species within interaction distance (<20 μm) and this number remains below 400 in hotspots (1010 cells g−1 soil) (Raynaud and Nunan, 2014). Thirdly, microbial activity as well as post-transcriptional regulation are controlled by environmental factors such as the presence of N-oxides (, NO, N2O), temperature and pH. It is well-known, for instance, that a low pH suppresses the N2O reductase enzyme post-transcriptionally so that the molar ratio between N2O and N2 is shifted toward N2O (Šimek and Cooper, 2002; Liu et al., 2010; Bakken et al., 2012). On the other hand, diffusion of reactants and products to and from the sites of microbial denitrification are constrained physically in the soil matrix. The diffusion pathways for gaseous fluxes are mainly governed by the water content, because the diffusion coefficients are many orders of magnitudes smaller in water than in air. This leads to the well-known phenomenon that N2O emissions exhibit a threshold behavior around a water saturation of 70% and peaks around 90% (Linn and Doran, 1984; Ruser et al., 2006) at which the air becomes discontinuous. With lost air continuity the average distance for dissolved oxygen to reach a microbial hotspot starts to diverge from the size of the hotspot itself to typical aggregate sizes. If aggregation is poorly developed, then the mean diffusion length amounts to the average half distances between air-filled macropores. At higher saturation, the N2O/N2 ratio shifts toward N2, because large fractions of the soil become anoxic so that dissolved N2O is consumed where it is produced or during its extended diffusion path toward the atmosphere. Even the role of wet soils as a sink for atmospheric N2O is debated but poorly investigated (Chapius-Lardy et al., 2007; Kolb and Horn, 2012). Finally, denitrification activity in hotspots can also be constrained by nitrate diffusion to sites of active denitrification (Smith, 1990). The well-known observation that nitrate amendment leads to increased denitrification activity is often interpreted from a biochemical standpoint as the effect of a high half-saturation constant of dissimilatory reductase (Firestone, 1982). Yet, by employing Fick's law it can be shown that the diffusion flux into a hotspot also scales linearly with the concentration gradient between the depleted hotspot and the external concentration regulated by the nitrate amendment (Myrold and Tiedje, 1985). Hence, the high half-saturation constant can simply be a consequence of a diffusion constraint.
Microscale denitrification models that combine the aforementioned biochemical and physical controls based on a set of reaction-diffusion equations typically employ individual soil aggregates as a model domain (Leffelaar and Wessel, 1988; Arah and Smith, 1989). Assuming a steady-state situation and uniform initial substrate concentration, the denitrification activity typically scales with the volume fraction of the anoxic aggregate center which, in turn, is mainly controlled by the aggregate size. The resulting oxygen profiles as a function of distance to the aggregate boundary typically exhibit an exponential decline at a rate that scales with microbial activity. This has been confirmed experimentally with micro-sensors (Sexstone et al., 1985; Zausig et al., 1993; Højberg et al., 1994). Currently, new models are underway that allow for numerical experiments on the role of substrate location for denitrification activity through spatial self-organization of aerobic and anaerobic species along oxygen gradients (Ebrahimi and Or, 2015). A major outcome is that an internal carbon source such as sequestered particulate organic matter is more efficient in invoking denitrification activity in an anoxic micro-site than an external carbon source like dissolved organic matter.
Such new insights into spatially explicit, micro-scale denitrification models call for new, systematic laboratory experiments on denitrification in soil aggregates. The objective of this study was to explore the impact of aggregate size and external oxygen concentration on aerobic and anaerobic respiration in model soil aggregates. For this, we inoculated the aggregates with a single bacterial strain (Agrobacterium tumefaciens), which is able to switch from aerobic respiration to denitrification. In this way, the physical constraints on denitrification kinetics could be studied without the added complexity of spatial or temporal patterns in denitrification activity through interactions within bacterial consortia. Furthermore, the delicate balance between N2O and the difficult to quantify N2 production could be neglected as A. tumefaciens lacks the nosZ gene encoding N2O reductase and hence has N2O as its final denitrification product. This still leaves a wealth of diffusion and reaction processes co-occurring within an aggregate as depicted in Figure 1. Denitrification activity was assessed by incubating differently sized aggregates loosely placed in closed bottles and monitoring O2 depletion and N2O accumulation in the headspace of the bottles at high resolution until the added carbon source (succinate) or the electron acceptor () were depleted. We did not measure dissolved oxygen directly, but inferred the spatial extent of the anoxic volume from denitrification kinetics. The data can be used to predict the critical aggregate size for denitrification in A. tumefaciens to occur at different external O2 concentrations.
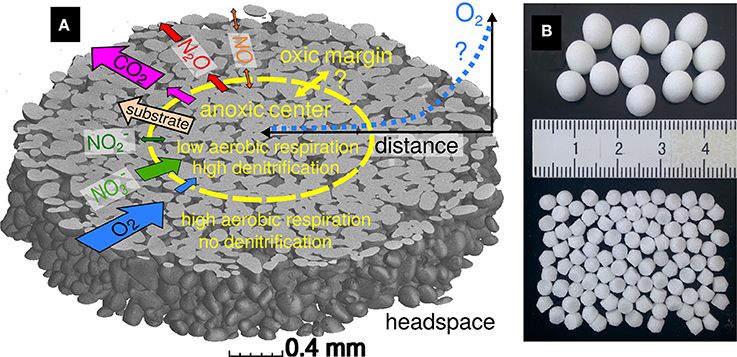
Figure 1. (A) An anoxic aggregate center of variable extent is expected to form during incubation. Here it is depicted within a subvolume of a 3.5 mm aggregate scanned with X-ray microtomography, showing the grains in gray while the liquid-filled pore space is transparent. Arrows are drawn proportionally to the expected fluxes between the headspace, aggregate margin and center. Precursor substances of aerobic respiration and denitrification (substrate, O2, ) as well as final products (CO2, N2O) are drawn as one-sided arrows, whereas intermediate substances may diffuse in any direction depending on concentration gradients. (B) Two different aggregate sizes (3.5 and 7 mm diameter) were used for incubation. Identical fluid volumes (0.83 ml) were used during incubation by adjusting the number of inoculated aggregates per bottle (100 and 13).
2. Materials and Methods
2.1. Bacterial Strain and Growth Medium
We used a pure culture of the bacterial strain Agrobacterium tumefaciens C58 (ATCC 33970), a facultative anaerobic α-proteobacterium, which lacks the genes encoding nitrous oxide reductase (Baek and Shapleigh, 2005; Bergaust et al., 2008). Therefore, N2O was the final denitrification product. Sistrom's medium (Sistrom, 1960) with an initial pH of 7 was used as growth medium. The medium contained (l−1): K2HPO4 3.48 g, NH4Cl 0.195 g, succinic acid 4 g, L-glutamic acid 0.1 g, L-aspartic acid 0.04 g, NaCl 0.5 g, nitrolotriacetic acid 0.2 g, MgSO4* 7H2O 0.3 g, CaCl2* 7H2O 15 mg, and FeSO2* 7H2O 7 mg. In addition, trace elements and vitamins were added (l−1): EDTA (triplex 3) 1.765 mg, ZnSO4* 7H2O 10.95 mg, FeSO4* 7H2O 5 mg, MnSO4* 7H2O 1.54 mg, CuSO4* 5H2O 0.392 mg, Co(NO3)7* 6H2O 0.248 mg, H3BO3 0.114 mg, nicotinic acid 1 mg, thiamine HCl 0.5 mg, biotin 0.01 mg. pH was brought to 7.0 with 10 M KOH and the medium was sterilized by autoclaving. KNO3 was added to the medium to a concentration of 5 mM as a substrate for denitrification. A stirred culture was grown aerobically at 25°C. Cells were harvested during exponential growth by centrifugation (10,000 rpm for 7 min). The resulting cell pellets were immediately resuspended in fresh growth medium to a density of ≈3 × 10⁹ cells ml−1 which is typical for hotspots in real soil (Raynaud and Nunan, 2014). The cultures were kept on ice to inhibit growth until the start of the experiment.
2.2. Aggregate Inoculation
Porous borosilicate glass beads (VitraPOR P100, ROBU Glasfilter Geräte GmbH, Hattert Germany) served as a simplified analogue for soil aggregates. The sintered glass beads had a porosity of 32% and an internal pore size in the range of 45–100 μm. Two different bead sizes were used with a diameter of 3.5 and 7 mm and an internal pore volume of 8.3 ± 0.2 μl and 64.0 ± 0.6 μl, respectively. In the following these will be referred to as small and large aggregates. The shape and internal pore structure as obtained via X-ray microtomography are depicted in Figure 1. After submersion of the aggregates in the growth cultures, roughly 3% of the pore space was filled with entrapped air (data not shown). These bubbles were removed completely from the submersed aggregates through vacuum application in a gas-tight bottle for 1–2 min.
Either 100 small or 13 large aggregates were placed into empty 120 ml glass bottles so that in both cases the pore volume inside of the aggregates filled with cell culture was about 830 μl per bottle, with some 10–20% additional liquid adhering to aggregate surfaces by weak capillary forces. After closing the bottles with an air-tight butyl rubber septum, the bottles were purged with helium by applying five cycles of vacuum and He filling. The bottles were immediately spiked with oxygen, to adjust final concentrations (v/v) of 13, 7, 3.5, 2, and 0% O2 in the head space. Hence, the pre-incubation of the cell cultures was aerobic during the entire sample preparation, except for the short intervals of degassing and He purging. Two replicates were prepared for each aggregate size and initial oxygen concentration, resulting in a total of ten treatments and twenty bottles. Finally, the bottles were moved from the ice bath to a water bath kept at 20°C to initiate microbial activity and the overpressure that built up due to spiking with O2 and warming of the bottles was released, before the gas chromatography (GC) measurements started.
2.3. Incubation
The incubations were carried out with a robotized incubation system consisting of an autosampler (GC-PAL, CTC Analytics, Zwingen, Switzerland) connected to a GC (Agilent Model 7890A, Santa Clara, CA, USA) and an NO analyzer (Teledyne T200, San Diego, CA, USA), allowing for repeated headspace analysis of oxygen (O2) and carbon dioxide (CO2) as well as the denitrification products nitric oxide (NO), nitrous oxide (N2O) and dinitrogen (N2) via a peristaltic pump (Molstad et al., 2007). The gas volume (≈1 ml) lost with each sampling was automatically replaced by He, so that the pressure in the bottles was kept at ≈1 atm. The bottles were sampled every 3 h for 45 h. The nitrate () and nitrite () concentrations that remained in the aggregates at the end of the experiment were measured with a colorimetric assay. To do so, all bottles were kept on ice after the experiment and aggregates from each treatment were thoroughly crushed in a mortar and taken up with 0.9% NaCl solution. The turbid fluid containing medium, cells and bead fragments was collected in Eppendorf tubes and centrifuged (10,000 rpm, 5 min) to obtain a clear solution. The protocols for nitrite and nitrite + nitrate quantification were adapted from Keeney and Nelson (1982) and Doane and Horwáth (2003). Nitrate concentrations were obtained through subtraction using two technical replicates per assay. The spectrophotometric measurement was carried out at 540 nm (Tecan infinite F50, Tecan, Männedorf, Switzerland) and converted into concentrations through calibration curves.
3. Results
3.1. Aggregate Size Effects
Aerobic microbial respiration as determined by decrease in O2 and increase in CO2 over time in Figures 2A,B was clearly limited by the carbon substrate in the aerobic cultures. Depletion of succinate was indicated by a slow-down of O2 consumption, which occurred in the small aggregates, depending on initial O2 level, between 15 and 30 h into the incubation. O2 consumption after this period was reduced substantially. The slow-down in O2 consumption and CO2 accumulation occurred synchronously. The added succinate in the fresh growth medium amounted to 68 μmol C/bottle, of which 27–35 μmol/bottle were converted to CO2, which suggests a yield factor between assimilation and total carbon consumption of 0.4–0.5 depending on treatment. However, the absolute accumulation of CO2 in the headspace might have been reduced by an increase in CO2 solubility due to a pH increase caused by the reduction of to . Respiration kinetics in Figures 2A,B show that microbial activity was clearly delayed in the large aggregates as compared to the small aggregates. Irrespective of aggregate size, the onset of substrate depletion as well as the total amount of produced CO2 at the end of the experiment scaled positively with the O2 concentration in the headspace. The higher the amount of external O2, the steeper the gradient between dissolved O2 at the aggregate boundary and in the aggregate center, which in turn results in a larger diffusive flux, a better supply with O2 and eventually a smaller extent of anoxic centers.
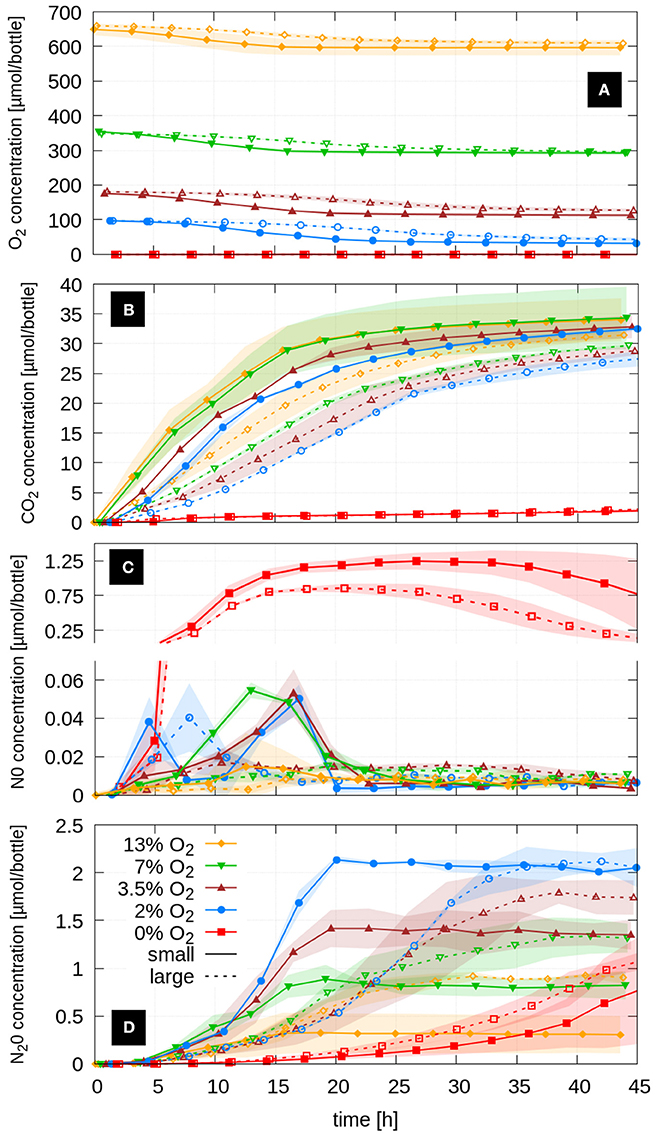
Figure 2. Respiration kinetics of A. tumefaciens in small and large aggregates at five initial oxygen concentrations shown as average headspace concentrations (n = 2) of (A) O2, (B) CO2, (C) NO and (D) the final denitrification product N2O. Shaded areas represent standard deviations.
Note that microbial respiration in the completely anoxic treatments (0% O2) was exceptionally small, irrespective of aggregate size. This effect can be explained by unbalanced kinetics of denitrification associated enzyme induction in A. tumefaciens. Sudden anoxia in growing cultures resulted in pronounced NO release, accumulating NO to more than 1 μmol/bottle, which corresponds to more than 0.5 μM in the liquid medium (Figure 2C). Dissolved NO concentrations >0.3 μM have been shown to repress metabolic activity in A. tumefaciens (Bergaust et al., 2008). In all oxic treatments the NO concentrations were 1–2 orders of magnitude smaller. In the small aggregates the NO peak coincided with the depletion of the primary carbon substrate, after which NO was quickly consumed by the microbes inside the aggregates. The oxic treatment with the lowest oxygen concentration (2% O2) showed an interesting double peak in NO, one at a very early stage in the logarithmic growth phase and another shortly before succinate was depleted. Except for the 2% O2 treatment, large aggregates did not show a clear NO peak but higher steady-state NO concentrations than small aggregates toward the end of the incubation, suggesting different denitrification kinetics in small and large aggregates.
N2O accumulation in the headspace followed a characteristic pattern with respect to initial O2 concentration (Figure 2D). The lower the initial O2 concentration in the headspace, and the less oxygen was available for aerobic growth, the more N2O accumulated as the final denitrification product. In the small aggregates denitrification abruptly stopped after ca. 18 h. At this point all succinate was consumed (as judged from the O2 and CO2 kinetics, Figures 2A,B).
Microbial respiration beyond the point of succinate depletion was small and likely fell below the rate of O2 diffusion into the aggregate so that the anoxic centers vanished. Larger aggregates released N2O more gradually because slower aerobic growth led to less anoxia initially. The point in time when the N2O accumulation in the large aggregates exceeded the value from small aggregates decreased with increasing oxygen concentration in the headspace from 36 h (2% O2) to 28 h (3.5% O2), 21 h (7% O2) to 16 h (13% O2). The total N2O production by large aggregates was either as large (2% O2) or 25% (3.5% O2), 50% (7% O2), and 100% (13% O2) larger than in the small aggregates with comparable oxygen concentrations. Here as well, N2O accumulation leveled off when O2 consumption decreased due to C-limitation. Aggregates incubated without O2 (0 vol-%) exhibited a delayed accumulation of N2O. Only after ≈24 h did NO start to be net consumed and N2O production rates increased.
The recovery of the initially added -N (4.15 μmol per bottle) ranged between 88 and 102% in the oxic treatments with large aggregates (Figure 3). Less N was recovered in the treatments with small aggregates (51–100%) and the mismatch increased with increasing oxygen levels. Presumably, with higher oxygen availability, cell growth exceeded the supply of ammonia contained in the medium so that some nitrate was assimilated. In both anoxic treatments more N was recovered than supplied with the added nitrate when estimated from the internal porosity of the aggregates, but was still within a range that could be explained with surplus of medium by liquid adhering to aggregate surfaces (118–122%). In general, the N-mass balances indicate that negligible amounts of denitrification intermediates (, NO) accumulated, while the partitioning into N still present as nitrate after 45 h incubation and N denitrified to N2O followed a similar pattern over O2 availability for both aggregate sizes.
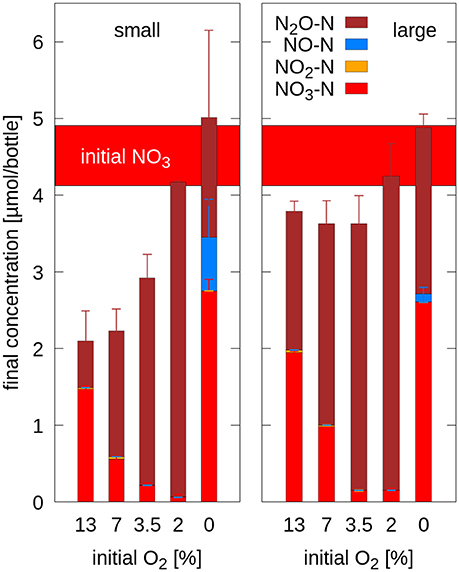
Figure 3. Nitrogen mass balance in small aggregates (Left) and large aggregates (Right) after 45 h of incubation at different initial O2 concentrations depicted as the sum of -N (supplied with the medium), accumulated denitrification intermediates (-N, NO-N) and the final product (N2O-N). The estimated amount of initial -N is depicted as a horizontal bar.
4. Discussion
4.1. Denitrification Kinetics
Denitrifying bacteria fall into different categories denoted as denitrification regulatory phenotypes (Bergaust et al., 2011), depending on how they manage the transition from oxic to anoxic conditions. The optimal switch between respiration strategies is important for two reasons: (1) The ATP yield by aerobic respiration is higher than by denitrification, thus, electrons should be directed toward oxygen when possible. (2) The enzymes for denitrification activity have to be expressed before oxygen is completely depleted, so that cells do not get caught in a situation of metabolic arrest. Batch incubation experiments with stirred cultures with nitrate amendment and the same growth medium have shown that Agrobacterium tumefaciens belongs to a common denitrification regulatory phenotype with a sequential production of denitrification intermediates (Bergaust et al., 2008, 2011). Nitrate reduction is induced while oxygen is still present, whereas nitrite and NO reduction commence after oxygen depletion. In cultures where oxygen depletion was too rapid, NO accumulated to toxic concentrations, resulting in respiratory arrest (Bergaust et al., 2008). This general pattern was confirmed by our study. Indeed, NO production was maximal and growth delayed when the aerobic inoculum was suddenly subjected to 0% oxygen conditions. In the oxic treatments NO and N2O accumulation in the headspace commenced simultaneously. In larger aggregates, the NO peak was widened into a broad plateau at lower levels. Presumably, the oxic aggregate margins were thicker in larger aggregates with more gradual growth, so that a quick NO release was buffered by longer diffusion distances between the production sites in the anoxic aggregate center and the headspace, causing longer residence times which increased the chance for NO reduction along the way.
4.2. Anoxic Aggregate Centers
The purpose of our experiment was to study denitrification kinetics under dynamic growth conditions, in contrast to steady-state conditions which are typically invoked as a simplifying assumption in physically-based denitrification models (Leffelaar and Wessel, 1988; Arah and Smith, 1989). Hence, we needed to account for the different growth rates when comparing the denitrification kinetics in both aggregate sizes, since the cells grew faster in small aggregates due to a better oxygen supply caused by a larger surface-to-volume ratio. A correction for growth effects can be achieved by analyzing N2O/CO2 ratios as depicted in Figure 4A, i.e., the amount of N2O as the final product of denitrification is normalized against CO2 as the final production of respiration. There was hardly any difference in normalized denitrification between the two aggregate sizes at the same initial oxygen level during the first 12 h. Only after the anoxic centers were fully established in the aggregates two consistent trends evolved. First, denitrification was always larger in the large aggregates, irrespective of external O2 concentration, implying that the volume fraction of anoxic centers is smaller in small aggregates. Second, denitrification increased with decreasing external O2 concentration, as the diffusive flux of O2 was driven by the gradient between the oxygen depleted aggregate centers and the dissolved O2 at the aggregate boundary, which is in equilibrium with the concentration of gaseous O2 in the headspace of the bottle. Interestingly, doubling of the aggregate size had roughly the same effect on the final N2O/CO2 ratio as a reduction of external O2 concentration by 50%. The absolute values of the N2O/CO2 ratio, however, should not be taken for granted due to the expected pH increase caused by nitrate reduction that changes CO2 solubility.
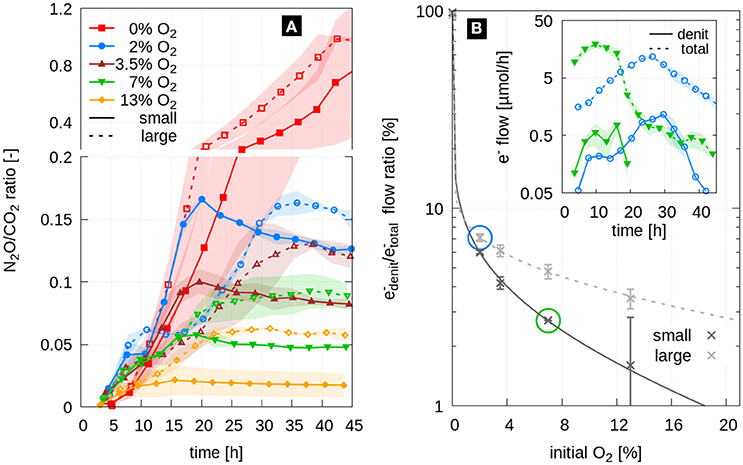
Figure 4. (A) Time series of the N2O/CO2 ratio shown as average (lines) and standard deviation (shaded area) for two replicates of small aggregates (solid) and large aggregates (dashed) at five different initial O2 concentrations. (B) Ratio of electron flow diverted in denitrification and total electron flow both measured and modeled with Equation 1. The inset shows the time series of electron flows for two selected treatments (large aggregates at 2%O2, blue, and small aggregates at 7%O2, green).
A more direct approach to assess denitrification activity is to compute the fraction of electron flow diverted to electron acceptors for anaerobic respiration (, including ,,NO) and total respiration (, including ,,NO and O2) (Bergaust et al., 2011). Time series of these electron flows are shown for selected treatments in Figure 4B, inset. The ratio of cumulative electron flows at the end of incubation exhibited a systematic trend (Figure 4B) that is described by a hyperbolic relationship between the / ratio [%] and the initial oxygen concentration CO2 [%]:
where a and b are dimensionless fitting parameters. The values of the fitting parameters are shown in Table 1. The fit across all investigated oxygen levels was excellent for both aggregate sizes. Note that a similar model of the form was also capable to reproduce the sharp decline in the electron flow ratio with only slightly larger errors, whereas an exponential model resulted in a too smooth decline (data not shown). The good model fit across a wide oxygen range may allow for extrapolation toward higher O2 concentrations. At ambient conditions (21% O2), small aggregates are likely to be devoid of anoxia, whereas large aggregates may still have roughly 2% of electron flow diverted to denitrification. The outer exponent b was roughly increased by a factor of two, as the aggregate diameter was doubled. This consistent scaling of the exponent suggests that predictions for larger aggregates are feasible, but this can not be validated on a set of two different aggregate diameters. Further experiments would be necessary.
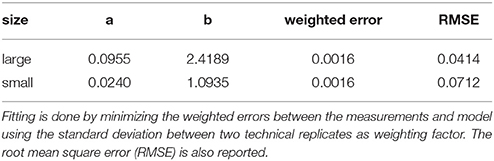
Table 1. Fitting parameters (a,b) for the hyperbolic relationship between initial oxygen concentration and the ratio of electron flows (Equation 1) for large and small aggregates.
4.3. Consequences for Greenhouse Gas Emissions From “Hotspots” in Soil
The delicate balance between growth rates and the transient formation of anoxic centers led to a rich variety of denitrification dynamics which resulted from the interplay of a number of diffusive fluxes summarized in Figure 1A. The diffusive flux of oxygen into the aggregates and the diffusive flux of the final respiration products (CO2 and N2O) out of the aggregates can be considered as uni-directional processes that solely depend on concentration gradients, since the diffusion coefficient does not change at constant (complete) saturation. Likewise, the diffusive flux of the dissolved carbon substrate (succinate) from the less active, anoxic aggregate center into the more substrate-depleted, oxic aggregate margin as well as the diffusive flux of nitrate from the well O2-supplied aggregate margin into the actively denitrifying aggregate center are uni-directional, yet without any exchange with the headspace. Finally, the diffusion of intermediates (, NO) is bi-directional and changing during incubation. Therefore, it might look surprising that a rather simple model with two empirical parameters is able to capture the denitrification behavior for a large range of oxygen concentrations and different aggregate sizes. However, this can be ascribed to the fact that (1) all oxic treatments were equally constrained by electron-donor and not electron-acceptor limitation and (2) that the model describes cumulative electron fluxes and not denitrification kinetics.
There are several reasons why our findings cannot be directly transferred to natural conditions. Natural consortia and a more complex composition of reduced carbon in soil would lead to coexistence and spatially separated niches causing spatial and temporal variability of aerobic respiration and denitrification activity (Vos et al., 2013; Kuzyakov and Blagodatskaya, 2015) as well as other N2O forming processes (e.g., nitrification) to occur simultaneously (Philippot et al., 2007; Stange et al., 2013). While the sudden removal of oxygen that was induced in the anoxic treatments could certainly occur under natural conditions, e.g., after a heavy rainfall, the toxic NO accumulation would not happen in natural consortia with a certain amount of functional redundancy (Schimel and Schaeffer, 2012). Moreover, a mobile carbon substrate like dissolved organic matter is likely to evoke a different spatio-temporal pattern in aerobic respiration and denitrification than a stationary carbon substrate like particulate organic matter (Ebrahimi and Or, 2015). An exponentially growing culture foraging on a low-molecular carbon substrate like in our experiments may also occur under natural conditions, when easily decomposable organic matter is added to the soil (e.g., animal manure, plant residues after harvest or plowing). But this scenario is rather an exception, whereas a steady-state or gradual change in microbial activity typically prevails in soil. Nevertheless, dynamic growth also poses an interesting case for modeling. Even though hotspots of microbial activity are believed to be the dominating sites of denitrification in soil, they cannot readily be investigated in isolation from the surrounding soil matrix, as the varying water content in the soil matrix acts as a major control on the micro-environmental conditions in the hotspots. Changing the external O2 concentration as a substitute for changing water contents is only an indirect analogue as it does not account for dilution of nitrate and carbon substrate as well as the osmotic effects induced by a rewetting event (Fierer and Schimel, 2003; Groffman et al., 2009). Moreover, undisturbed soil structure does typically not manifest itself as isolated, well-sorted aggregates but a coherent soil matrix pervaded with a complex pore network (Rabot et al., 2018). Hence, the aggregate size should rather be interpreted as the typical distance to the closest air-filled pore (Schlüter and Vogel, 2016) and the varying oxygen levels for instance as a depth gradient in the partial pressure of O2 within a soil profile. Finally, experiments in closed systems affect the residence time of gaseous intermediates which increases the chances of soil to act as a sink for NO and N2O (Chapius-Lardy et al., 2007).
Despite those limitations our simplified incubation experiment may serve as an interesting case for studying the dynamics of soil denitrification as an important source of N2O. Thus, the experiments with artificial aggregates may provide a useful benchmark data set for physically-based diffusion-reaction models of microbial activity in model soil aggregates. The pioneering studies of Leffelaar and Wessel (1988) and Arah and Smith (1989), which assumed simplified one-dimensional, radial domains, are gradually superseded by spatially explicit, three-dimensional models of the pore space (Ebrahimi and Or, 2014, 2015; Falconer et al., 2015) that can be directly derived from X-ray CT scans like shown in Figure 1A. These models can inherently take into account the fragmentation of microbial niches under normal hydraulic conditions due to a discontinuous water phase as well as increased microbial dispersal after a rewetting event (Tecon and Or, 2017). They have the potential to explore microscopic biochemical processes, which are impossible to measure directly, in order to inform or improve macroscopic models of greenhouse gas emission, which operate with emergent properties on much larger scales like transient, anoxic soil volumes (Li et al., 2000; Ebrahimi and Or, 2016). The development of a new spatially-explicit, physically-based model of denitrification kinetics based on the modeling framework of Hron et al. (2015) is currently underway, but beyond the scope of the study.
5. Conclusions
This incubation experiment clearly demonstrates how denitrification in fully saturated aggregates is governed by physical constraints that give rise to a transient formation of anoxic aggregate centers. The spatial gradients in dissolved oxygen which drive the diffusive flux are controlled by the aggregate size and the external oxygen concentration in very predictable ways. The better supply with oxygen in small aggregates leads to faster growth and an earlier onset of N2O emission, whereas larger aggregates have a larger N2O accumulation and larger N2O/CO2 production ratio on the long run. The main conclusions for physically-based modeling is that under dynamic growth conditions denitrification activity can only be predicted if both the aggregate size and the oxygen concentration at the aggregate surface are known.
The reduction of external oxygen concentration consistently leads to a reduction in aerobic respiration as well as to an increase in the denitrification activity and the N2O/CO2 production ratio. The cumulative diversion of electrons from reduced carbon to N-oxyanions is perfectly described by a simple, empirical model across a large oxygen concentration range, which confirms the dominant role of physical constraints on N2O emissions from these simplified model aggregates inoculated with a single bacterial strain and a simple growth medium.
Incubation studies with these simplified soil aggregates can be extended toward more realistic soil conditions in several ways. We are currently working with experimental setups, in which aggregates are inoculated with different bacterial strains and embedded in explicit geometries in a sandy soil matrix adjusted to different water contents to account for interactions between hotspots and to explore the role of spatial distribution of hotspots on greenhouse gas emissions.
Author Contributions
SS, H-JV, MH, OI, and PD conceived the experiment. LB provided the bacterial strain. SS, SH, LB, and PD conducted the experiments. SS, SH, JZ, and PD analyzed the data. All authors contributed to writing the manuscript.
Funding
This study was funded by the Deutsche Forschungsgemeinschaft through the research unit DFG-FOR 2337: Denitrification in Agricultural Soils: Integrated Control and Modeling at Various Scales (DASIM).
Conflict of Interest Statement
The authors declare that the research was conducted in the absence of any commercial or financial relationships that could be construed as a potential conflict of interest.
Acknowledgments
We thank two reviewers for their comments that helped to improve the quality of the manuscript.
References
Arah, J. R. M., and Smith, K. A. (1989). Steady-state denitrification in aggregated soils: a mathematical model. J. Soil Sci. 40, 139–149. doi: 10.1111/j.1365-2389.1989.tb01262.x
Baek, S.-H., and Shapleigh, J. P. (2005). Expression of nitrite and nitric oxide reductases in free-living and plant-associated Agrobacterium tumefaciens C58 cells. Appl. Environ. Microbiol. 71, 4427–4436. doi: 10.1128/AEM.71.8.4427-4436.2005
Bakken, L. R., Bergaust, L., Liu, B., and Frostegård, Å. (2012). Regulation of denitrification at the cellular level: a clue to the understanding of N2O emissions from soils. Philos. Trans. R. Soc. Lond. B Biol. Sci. 367, 1226–1234. doi: 10.1098/rstb.2011.0321
Bergaust, L., Bakken, L. R., and Frostegård, Å. (2011). Denitrification regulatory phenotype, a new term for the characterization of denitrifying bacteria. Biochem. Soc. Trans. 39, 207–212. doi: 10.1042/BST0390207
Bergaust, L., Shapleigh, J., Frostegård, Å., and Bakken, L. (2008). Transcription and activities of NOx reductases in Agrobacterium tumefaciens: the influence of nitrate, nitrite and oxygen availability. Environ. Microbiol. 10, 3070–3081. doi: 10.1111/j.1462-2920.2007.01557.x
Chapius-Lardy, L., Wrage, N., Metay, A., Chotte, J.-L., and Bernoux, M. (2007). Soils, a sink for N2O? A review. Glob. Change Biol. 13, 1–17. doi: 10.1111/j.1365-2486.2006.01280.x
Doane, T. A., and Horwáth, W. R. (2003). Spectrophotometric determination of nitrate with a single reagent. Anal. Lett. 36, 2713–2722. doi: 10.1081/AL-120024647
Dörsch, P., Braker, G., and Bakken, L. R. (2012). Community-specific pH response of denitrification: experiments with cells extracted from organic soils. FEMS Microbiol. Ecol. 79, 530–541. doi: 10.1111/j.1574-6941.2011.01233.x
Ebrahimi, A., and Or, D. (2015). Hydration and diffusion processes shape microbial community organization and function in model soil aggregates. Water Resour. Res. 51, 9804–9827. doi: 10.1002/2015WR017565
Ebrahimi, A., and Or, D. (2016). Microbial community dynamics in soil aggregates shape biogeochemical gas fluxes from soil profiles–upscaling an aggregate biophysical model. Glob. Change Biol. 22, 3141–3156. doi: 10.1111/gcb.13345
Ebrahimi, A. N., and Or, D. (2014). Microbial dispersal in unsaturated porous media: characteristics of motile bacterial cell motions in unsaturated angular pore networks. Water Resour. Res. 50, 7406–7429. doi: 10.1002/2014WR015897
Falconer, R. E., Guillaume, B., Sonja, S., Philippe, B., Claire, C., and Wilfred, O. (2015). Microscale heterogeneity explains experimental variability and non-linearity in soil organic matter mineralisation. PLoS ONE 10:e0123774. doi: 10.1371/journal.pone.0123774
Fierer, N., and Schimel, J. P. (2003). A proposed mechanism for the pulse in carbon dioxide production commonly observed following the rapid rewetting of a dry soil. Soil Sci. Soc. Am. J. 67, 798–805. doi: 10.2136/sssaj2003.7980
Firestone, M. (1982). “Biological denitrification,” in Nitrogen in Agricultural Soils, ed F. J. Stevenson (Madison, WI: American Society of Agronomy), 289–326.
Groffman, P., Butterbach-Bahl, K., Fulweiler, R., Gold, A., Morse, J., Stander, E., et al. (2009). Challenges to incorporating spatially and temporally explicit phenomena (hotspots and hot moments) in denitrification models. Biogeochemistry 93, 49–77. doi: 10.1007/s10533-008-9277-5
Højberg, O., Revsbech, N. P., and Tiedje, J. M. (1994). Denitrification in soil aggregates analyzed with microsensors for nitrous oxide and oxygen. Soil Sci. Soc. Am. J. 58, 1691–1698. doi: 10.2136/sssaj1994.03615995005800060016x
Hron, P., Jost, D., Bastian, P., Gallert, C., Winter, J., and Ippisch, O. (2015). Application of reactive transport modeling to growth and transport of microorganisms in the capillary fringe. Vadose Zone J. 14:vzj2014.07.0092. doi: 10.2136/vzj2014.07.0092
Jones, C. M., and Hallin, S. (2010). Ecological and evolutionary factors underlying global and local assembly of denitrifier communities. ISME J. 4, 633. doi: 10.1038/ismej.2009.152
Keeney, D., and Nelson, D. W. (1982). “Nitrogen—inorganic forms,” in Methods of Soil Analysis. Part 2. Chemical and Microbiological Properties, 2nd Edn., eds A. L. Page, R. H. Miller, and D.R. Keeney (Madison, WI: American society of Agronomy), 643–698.
Kolb, S., and Horn, M. A. (2012). Microbial CH4 and N2O consumption in acidic wetlands. Front. Microbiol. 3:78. doi: 10.3389/fmicb.2012.00078
Kuzyakov, Y., and Blagodatskaya, E. (2015). Microbial hotspots and hot moments in soil: concept & review. Soil Biol. Biochem. 83, 184–199. doi: 10.1016/j.soilbio.2015.01.025
Leffelaar, P., and Wessel, W. (1988). Denitrification in a homogeneous, closed system: experiment and simulation. Soil Sci. 146, 335–349.
Li, C., Aber, J., Stange, F., Butterbach-Bahl, K., and Papen, H. (2000). A process-oriented model of N2O and NO emissions from forest soils: 1. Model development. J. Geophys. Res. Atmos. 105, 4369–4384. doi: 10.1029/1999JD900949
Linn, D., and Doran, J. (1984). Effect of water-filled pore space on carbon dioxide and nitrous oxide production in tilled and nontilled soils. Soil Sci. Soc. Am. J. 48, 1267–1272. doi: 10.2136/sssaj1984.03615995004800060013x
Liu, B., Mørkved, P. T., Frostegård, Å., and Bakken, L. R. (2010). Denitrification gene pools, transcription and kinetics of NO, N2O and N2 production as affected by soil pH. FEMS Microbiol. Ecol. 72, 407–417. doi: 10.1111/j.1574-6941.2010.00856.x
Mathieu, O., Lévêque, J., Hénault, C., Milloux, M.-J., Bizouard, F., and Andreux, F. (2006). Emissions and spatial variability of N2O, N2 and nitrous oxide mole fraction at the field scale, revealed with 15N isotopic techniques. Soil Biol. Biochem. 38, 941–951. doi: 10.1016/j.soilbio.2005.08.010
Molstad, L., Dörsch, P., and Bakken, L. R. (2007). Robotized incubation system for monitoring gases (O2, NO, N2O, N2) in denitrifying cultures. J. Microbiol. Methods 71, 202–211. doi: 10.1016/j.mimet.2007.08.011
Myrold, D. D., and Tiedje, J. M. (1985). Diffusional constraints on denitrification in soil. Soil Sci. Soc. Am. J. 49, 651–657. doi: 10.2136/sssaj1985.03615995004900030025x
Parkin, T. B. (1987). Soil microsites as a source of denitrification variability. Soil Sci. Soc. Am. J. 51, 1194–1199. doi: 10.2136/sssaj1987.03615995005100050019x
Philippot, L., Andert, J., Jones, C., Bru, D., and Hallin, S. (2011). Importance of denitrifiers lacking the genes encoding the nitrous oxide reductase for N2O emissions from soil. Glob. Change Biol. 17, 1497–1504. doi: 10.1111/j.1365-2486.2010.02334.x
Philippot, L., Hallin, S., and Schloter, M. (2007). “Ecology of denitrifying prokaryotes in agricultural soil,” in Advances in Agronomy, Vol. 96, Advances in Agronomy. (Academic Press), 249–305.
Philippot, L., Spor, A., Henault, C., Bru, D., Bizouard, F., Jones, C. M., et al. (2013). Loss in microbial diversity affects nitrogen cycling in soil. ISME J 7, 1609–1619. doi: 10.1038/ismej.2013.34
Rabot, E., Wiesmeier, M., Schlüter, S., and Vogel, H.-J. (2018). Soil structure as an indicator of soil functions: a review. Geoderma 314, 122–137. doi: 10.1016/j.geoderma.2017.11.009
Raynaud, X., and Nunan, N. (2014). Spatial ecology of bacteria at the microscale in soil. PLoS ONE 9:e87217. doi: 10.1371/journal.pone.0087217
Röver, M., Heinemeyer, O., Munch, J. C., and Kaiser, E.-A. (1999). Spatial heterogeneity within the plough layer: high variability of N2O emission rates. Soil Biol. Biochem. 31, 167–173. doi: 10.1016/S0038-0717(97)00271-X
Ruser, R., Flessa, H., Russow, R., Schmidt, G., Buegger, F., and Munch, J. (2006). Emission of N2O, N2 and CO2 from soil fertilized with nitrate: effect of compaction, soil moisture and rewetting. Soil Biol. Biochem. 38, 263–274. doi: 10.1016/j.soilbio.2005.05.005
Schimel, J. P., and Schaeffer, S. M. (2012). Microbial control over carbon cycling in soil. Front. Microbiol. 3:348. doi: 10.3389/fmicb.2012.00348
Schlüter, S., and Vogel, H.-J. (2016). Analysis of soil structure turnover with garnet particles and x-ray microtomography. PLOS ONE 11:e0159948. doi: 10.1371/journal.pone.0159948
Sexstone, A. J., Revsbech, N. P., Parkin, T. B., and Tiedje, J. M. (1985). Direct measurement of oxygen profiles and denitrification rates in soil aggregates. Soil Sci. Soc. Am. J. 49, 645–651. doi: 10.2136/sssaj1985.03615995004900030024x
Šimek, M., and Cooper, J. E. (2002). The influence of soil pH on denitrification: progress towards the understanding of this interaction over the last 50 years. Eur. J. Soil Sci. 53, 345–354. doi: 10.1046/j.1365-2389.2002.00461.x
Sistrom, W. R. (1960). A Requirement for sodium in the growth of rhodopseudomonas spheroides. Microbiology 22, 778–785.
Smith, K. A. (1990). Anaerobic Zones and Denitrification in Soil: Modelling and Measurement. Boston, MA: Springer, 229–244.
Stange, C., Spott, O., Arriaga, H., Menéndez, S., Estavillo, J., and Merino, P. (2013). Use of the inverse abundance approach to identify the sources of NO and N2O release from Spanish forest soils under oxic and hypoxic conditions. Soil Biol. Biochem. 57, 451–458. doi: 10.1016/j.soilbio.2012.10.006
Tecon, R., and Or, D. (2017). Biophysical processes supporting the diversity of microbial life in soil. FEMS Microbiol. Rev. 41, 599–623. doi: 10.1093/femsre/fux039
Vos, M., Wolf, A. B., Jennings, S. J., and Kowalchuk, G. A. (2013). Micro-scale determinants of bacterial diversity in soil. FEMS Microbiol. Rev. 37, 936–954. doi: 10.1111/1574-6976.12023
Keywords: greenhouse gas emissions, denitrification kinetics, microbial hotspots, microsites, anoxic aggregate centers, Agrobacterium tumefaciens, physically-based modeling
Citation: Schlüter S, Henjes S, Zawallich J, Bergaust L, Horn M, Ippisch O, Vogel H-J and Dörsch P (2018) Denitrification in Soil Aggregate Analogues-Effect of Aggregate Size and Oxygen Diffusion. Front. Environ. Sci. 6:17. doi: 10.3389/fenvs.2018.00017
Received: 31 January 2018; Accepted: 27 March 2018;
Published: 11 April 2018.
Edited by:
Philippe C. Baveye, AgroParisTech Institut des Sciences et Industries du Vivant et de L'environnement, FranceReviewed by:
Nobuko Katayanagi, National Institute for Agro-Environmental Sciences, JapanSven Marhan, University of Hohenheim, Germany
Copyright © 2018 Schlüter, Henjes, Zawallich, Bergaust, Horn, Ippisch, Vogel and Dörsch. This is an open-access article distributed under the terms of the Creative Commons Attribution License (CC BY). The use, distribution or reproduction in other forums is permitted, provided the original author(s) and the copyright owner are credited and that the original publication in this journal is cited, in accordance with accepted academic practice. No use, distribution or reproduction is permitted which does not comply with these terms.
*Correspondence: Steffen Schlüter, c3RlZmZlbi5zY2hsdWV0ZXJAdWZ6LmRl