 Matías Tagle1*
 Felipe Reyes1Yeanice Vásquez1Samara Carbone2Sanna Saarikoski3Hilkka Timonen3Ernesto Gramsch4Pedro Oyola1
- 1Air Quality Department, Centro Mario Molina Chile, Santiago, Chile
- 2Institute of Agricultural Sciences, Federal University of Uberlândia, Uberlândia, Brazil
- 3Atmospheric Composition Research, Finnish Meteorological Institute, Helsinki, Finland
- 4Department of Physics, University of Santiago de Chile, Santiago, Chile
The chemical composition of submicron particles (aerodynamic diameter Da < 1.0 μm) was investigated at three locations in the Santiago Metropolitan Region (SMR), Chile. Measurements campaigns were conducted in winter and spring 2016, at representative sites of a rural, urban, and urban receptor environment. Instrumentation consisted of an optical analyzer to determine Black Carbon (BC) and the Aerosol Chemical Speciation Monitor (ACSM) to measure concentrations of particulate chloride (Cl−), nitrate (), sulfate (), ammonium (), and non-refractory carbonaceous species (organics). Complementary data, such as ozone concentration and meteorological parameters were obtained from the public air quality network. Results showed that in both the winter and spring seasons the organics predominated in the mass of submicron particles. This fraction was followed in decreasing order by , , BC, , and Cl−. The highest average organics concentrations were measured in winter at the urban (32.2 μg m−3) and urban receptor sites (20.1 μg m−3). In winter, average concentrations of both and were higher at the urban receptor site (12.3 and 4.5 μg m−3, respectively) when compared to the urban site (6.4 and 3.1 μg m−3, respectively). In general, all the measured species were present in higher concentrations during winter, excepting , which was the only one that increased during spring. The transition toward spring was also associated with an acidification of the aerosol at the rural and urban receptor site, while at the urban site the aerosol was observed alkaline. The highest average ozone concentration during both the winter and spring seasons were recorded at the urban receptor site (7.2 and 24.0 ppb, respectively). The study reports data showing that the atmosphere in the SMR has a considerable load of particulate organic compounds, and , which are in higher concentrations at urban sites during the winter season. Based on wind patterns and the hourly profiles of chemical species, the study suggests that during daytime the polluted air masses from the urban center can move to the northeast part of the region (namely urban receptor site) leading to the formation of submicron particles as well as photochemical ozone.
Introduction
Atmospheric particles with an aerodynamic diameter of <1 micrometer play an essential role in the subsistence of the planet. The so-called submicron particles act as condensation nuclei for cloud formation, and depending on their chemical composition, can absorb or disperse solar radiation (IPCC, 2013).
The genesis of new particles begins with molecular clusters smaller than a nanometer, which progressively merge until reaching larger sizes. The subsequent growth is mainly driven by the condensation of gas-phase precursors, such as nitrate, ammonium, sulfate, and low volatility organic molecules that are subjected to different chemical reactions in the atmosphere (Bzdek and Reid, 2017).
In the last two decades, it has been possible to better understand the sources and conformation of these particles through the use of advanced high-resolution techniques. One of the state-of-the-art instruments is the Aerosol Chemical Speciation Monitor (ACSM), which allows the real-time quantitative measurement of the non-refractory submicron aerosol composition. Worldwide data obtained with the ACSM1 indicates that organic species are ubiquitous and generally predominating in the particle. Organic compounds integrating submicron aerosols cover a range of species, including multiple hydrocarbons, aldehydes, alcohols, and carboxylic acids, among many others (Hoffmann et al., 2011).
In Europe and the United States, research involving the ACSM has been extensively conducted in urban and rural locations, nevertheless, there is still little information on the composition of submicron particles in the main cities of the southern hemisphere. To date, measurements in Latin America have been carried out only in Sao Paulo, Brazil (Almeida et al., 2014), Mexico City (Salcedo et al., 2006), and Santiago, Chile (Carbone et al., 2013; Gramsch et al., 2016).
In specific, the Santiago Metropolitan Region (SMR) contains ~7 million inhabitants, which represents 40% of the country's population (INE)2. Critical episodes of air pollution have become frequent during the autumn and winter seasons, due to the combination of a complex terrain and the rapid urban expansion that occurred in the last three decades (Romero et al., 1999).
The geographical and climatic characteristics of the SMR have been associated to a large extent with unfavorable conditions for the dispersion of air pollutants (Rutllant and Garreaud, 1995; Schmitz, 2005; Ragsdale et al., 2013; Muñoz and Corral, 2017). Approximately 85% of the SMR surface is mountainous terrain that blocks the air circulation in the lower atmospheric layers. Further, the continuous arrival of warm-core low-pressure cells from the Pacific Ocean (coastal lows) can intensify the incidence of high-pollution episodes by decreasing the height of the atmospheric boundary layer (Gallardo et al., 2002; Garreaud et al., 2002). The aerosol vertical distribution in the SMR has been described as restricted to a shallow boundary layer that reaches altitudes near 400 m in cold months and above 800 m in spring and summer (Muñoz and Undurraga, 2010; Muñoz and Alcafuz, 2012).
In the SMR, about 1.9 million vehicles circulate every day (INE)3, which generates significant emissions of traffic exhaust gases, i.e., volatile organic compounds (VOCs) and nitrogen oxides (NOx) in the urban centers. Previously, it has been reported that polluted air masses originating in these places are transported to suburban northeastern areas, namely urban receptor sites, where pollutants are subjected to intensive solar radiation and photochemical reactions that result in increased production of atmospheric oxidants, such as ozone (O3), peroxyacetyl nitrate (PAN), and hydroxyl (OH) radical (Rappenglück et al., 2000; Rubio et al., 2004; Rappenglück et al., 2005; Gramsch et al., 2006; Elshorbany et al., 2009).
In 2011, the first study that assessed the submicron aerosol composition in Santiago (Carbone et al., 2013) showed that organic species contributed to more than half of the particle mass (54%). Further, a considerable proportion of this fraction was identified as oxidized, which supported previous studies indicating the strong photochemical potential of the local atmosphere. The following year, the composition of submicron particles during the wintertime pollution episodes was measured, evidencing a notable increase of fresh particles (non-oxidized) during the night, which were associated with recent emissions of vehicular exhaust and biomass burning (Gramsch et al., 2016).
The next article presents the results obtained in the second long-term study conducted with the ACSM in Santiago, although this time in three different locations that represented contrasting environments. The objective was to investigate the composition of submicron particles at sites that characterize a rural, urban, and urban receptor environment, during two seasons that differ in meteorological conditions and ventilation patterns.
Materials and Methods
Study Sites
The SMR is located in central Chile and denotes the administrative division that contains the city of Santiago, the capital of the country. The total area of SMR is 15,400 km2, with most of the population (urban; 97% and rural; 3%) residing in the valley. The latter is an enclosed basin of 80 km long and 35 km wide, placed between the Coastal (~2,000 m.a.s.l) and the Andes mountain ranges (~4,000 m.a.s.l).
The measurements campaigns were conducted during winter and spring of 2016 at a rural, urban, and urban receptor sites (Figure 1). Specific location and details of the sampling campaigns are shown in Table 1.
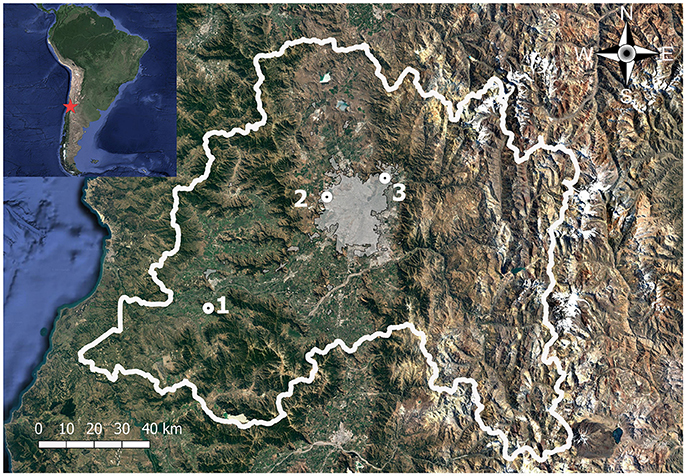
Figure 1. Geographical representation of the Santiago Metropolitan Region (area marked with a white line) and the monitoring sites. (1): Rural; (2): Urban; (3): Urban receptor.
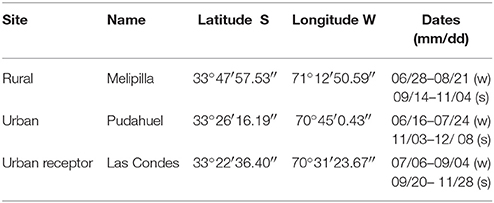
Table 1. Description of the field campaign sites where the measurements were conducted during winter (w) and spring (s) of 2016.
The urban and urban receptor sites were sit in monitoring stations that belong to the public air quality network (http://sinca.mma.gob.cl/). The urban monitoring station (Pudahuel) was located on the west side of the metropolitan area, close to major roads and the international airport. The urban receptor station (Las Condes) was located at a higher altitude on the east side of Santiago, within a residential area that is nearby a secondary roadway. The rural station (Melipilla) was located about 60 km southwest of the downtown, in a rural neighborhood dedicated to agricultural activities.
Aerosol Mass Spectrometry
Submicron particle non-refractory species, such as organics, nitrate, sulfate, ammonium, and chloride, were monitored on a basis of 10-min time resolution using the aerosol chemical speciation monitor (ACSM, Aerodyne Research Inc, USA) and the time-of-flight ACSM (ToF-ACSM, Aerodyne Research Inc., USA). Extensive descriptions of the instruments are presented by Ng et al. (2011), Fröhlich et al. (2013), and Timonen et al. (2016).
The ACSM consists of a sampling inlet with an aerodynamic lens (50% transmission range of the lens is 75–650 nm) that focuses the submicron particles into a beam that enters consecutive vacuum chambers. When passing through the chambers, gaseous molecules are pumped out and the submicron aerosol is concentrated. In the last chamber, the particle beam impacts a tungsten oven where the non-refractory species are flash-vaporized at 600°C. The resulting vapors are ionized (70 eV electron impact ionization) and detected using a quadruple mass spectrometer residual-gas analyzer (Prisma plus RGA, Pfeiffer Vacuum Technology, Germany). The ACSM detection chamber uses an effusive source of naphthalene as an internal calibration. The peak associated with naphthalene (m/z = 128) provides an internal standard to calibrate the mass to charge ratios (m/z) of measured species.
The instrument was subjected to a calibration before the sampling campaigns as described in the protocol presented by Ng et al. (2011). The mass calibration is based on the response of the ACSM to a known concentration of ammonium nitrate (NH4NO3) aerosol particles. For this procedure, 300 nm monodisperse NH4NO3 aerosol was generated by an ultrasonic nebulizer (NE-U17, OMRON), a silica gel diffusion dryer (TOPAS DDU 570/L) and a Hauke-type differential mobility analyzer. The particle number concentration was measured by a condensation particle counter (CPC 3010, TSI). This value was used to estimate the NH4NO3 mass concentration assuming a spherical-particle density and diameter. The generated aerosol was diluted to range from 0 to 1,000 particles cm−3, which corresponded to 0–15 μg m−3 of nitrate detected by the ACSM.
In the ToF-ACSM, the inlet, vaporization and ionization processes are similar to the ACSM, however, in the ToF-ACSM the ions are introduced into a compact time-of-flight mass analyzer (ETOF, TOFWERK AG, Thun, Switzerland) and extracted orthogonally using pulsed extraction for subsequent detection with a discrete dynode detector. The ToF-ACSM was calibrated similarly to ACSM prior to the sampling campaigns. The ionization efficiency (IE) for nitrate was 2.75−11 ions pg−1. Other measured ions were calculated based on the IEnitrate using relative ionization values of 4, 1.2, 1.4, and 1.3 for ammonium, sulfate, organics, and chloride, respectively. The ACSM was used at the rural and urban site while the ToF-ACSM was used at the urban receptor site. Both instruments had a collection efficiency of 0.5.
Black Carbon Analyzer
A continuous optical analyzer (SIMCA, University of Santiago de Chile) was used to measuring the BC concentrations. A detailed description of this instrument can be found elsewhere (Horvath et al., 1997; Gramsch et al., 2000, 2004). Briefly, the SIMCA is based on the Aethalometer principle to estimate the absorption coefficient of light that passes through the particles collected in a filter. The instrument includes a metallic cylinder where is deployed a filter (Nucleopore, 0.2 μm pore), two light-emitting diodes, two photo-detectors and amplifier electronics. A pump entered an air sample every 15 min, which was collected in the filter. Immediately, the absorption of the light was measured and the resulting value was converted to BC mass concentration (as described by Gramsch et al., 2004).
Ozone and Meteorological Data
O3 concentrations were measured using a UV photometric monitor (49i Ozone Analyzer, Thermo Fischer Scientific Inc., USA) in the public air quality monitoring stations located in Las Condes, Pudahuel and Talagante (27 km from Melipilla). One-hour average concentrations were downloaded from the network's webpage (sinca.mma.gob.cl). Meteorological parameters (1-h average wind speed, wind direction, temperature, and relative humidity) were obtained from the same stations. Solar radiation was downloaded from different but closest meteorological stations, as detailed in Supplemental Material (Supplementary Figure 1).
Data Analysis
The ACSM spectrometer data files were analyzed using the IGOR 6.11 software (Wavemetrics, Lake Oswego, USA) and the data analysis packages ACSM Local 1.6.0.1 and Tofware version 2.5.10 (ToF-ACSM; www.tofwerk.com/tofware). The 1-h average species concentrations were analyzed with the R programming language and RStudio statistical software (R Foundation for Statistical Computing, Vienna, Austria). The time series were constructed using the time variation function available in the OpenAir package (Carslaw and Ropkins, 2012). Descriptive statistics, such as the arithmetic mean, standard deviation (SD), and the 95% confidence interval in the mean (95% CI), were used to report meteorological parameters and species concentrations.
Results
Meteorology and Wind Patterns
Previously, it has been reported that the SMR has a characteristic wind pattern defined by easterly winds prevailing at night (after 18:00) and southwesterly winds that predominate during the day (Schmitz, 2005).
Figure 2 shows the distribution of wind speed and wind direction observed in each station during the measurement campaigns. In the rural location, low-speed winds from the southwest were prevalent (in time), both during the winter and spring seasons. At the urban and urban receptor sites, the predominant winds followed an easterly direction in winter but changed to a predominant southwesterly direction in spring.
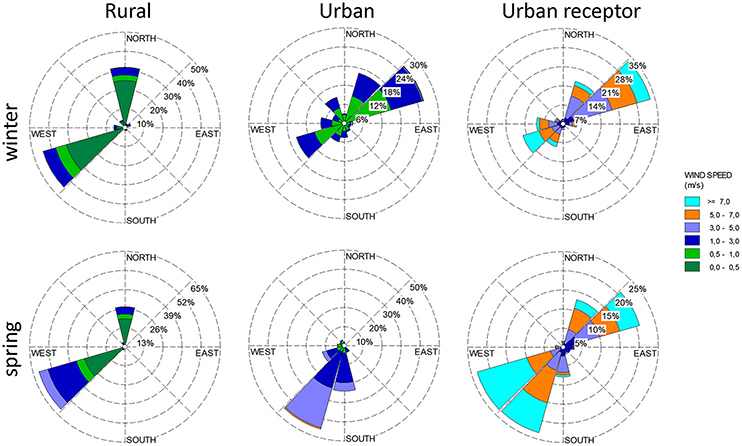
Figure 2. Wind rose plots showing the winds speed (m/s), wind direction, and frequency in time (%) observed at the rural, urban, and urban receptor sites.
Table 2 shows the 1-h average temperature, relative humidity and solar radiation, among the average wind speed and percentage of calm situations, the latter referring to hourly records with low-speed winds (< 1 m s−1). At the urban receptor site, calm situations were barely observed (~1–2%) and the average wind speed was ~five-fold greater than the average wind speed observed at the urban and rural sites. In these stations, a strong atmospheric stability was observed (i.e., little air movement or slow winds), especially during the winter season. The percentage of calms recorded at the rural site during winter reached 82.7% while at the urban site calms situations were observed in 69.1% of the wind records (Table 3).
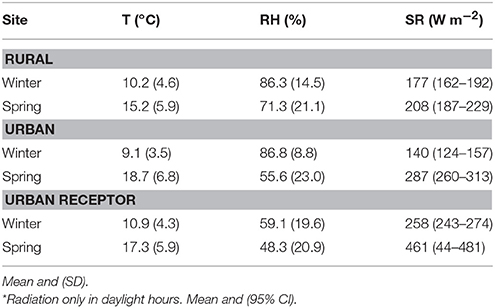
Table 2. Temperature (T), relative humidity (RH), solar radiation* (SR) during the sampling campaign.
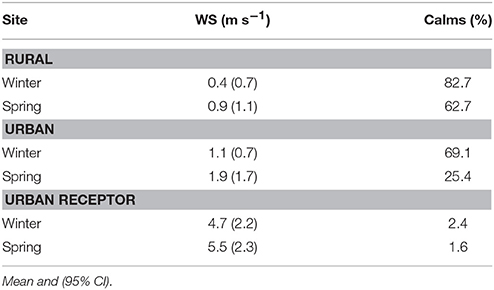
Table 3. Wind speed (WS) and distribution of calm situation (WS < 1 m s−1) during the sampling campaign.
The average temperature was around 10°C in winter and between 15 and 18°C in spring. These are typical values for the Mediterranean-type climate of central Chile. In both seasons, the highest solar radiation was recorded at the urban receptor site, which could support the phenomenon of greater photochemical activity observed earlier by Rappenglück et al. (2005) in the same area.
Ozone Concentration
Ground-level O3 is a highly oxidizing secondary pollutant produced by several complex photochemical reactions that involve solar radiation and gaseous precursors such as carbon monoxide, NOx and VOCs, typically emitted by traffic.
As shown in Table 4, the urban receptor site had the highest average O3 concentrations during both winter (7.25 ppb) and the spring season (24.06 ppb). Lower ozone concentrations were measured at all stations in the winter season. The transition to spring at all sites was associated with an increase in O3 concentrations that are likely explained by the increase in solar radiation.
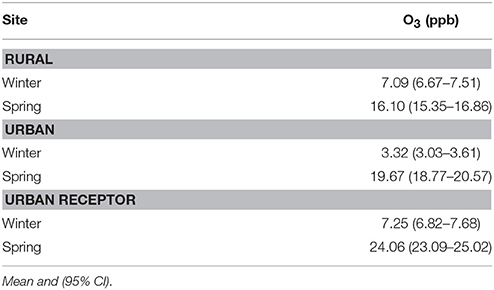
Table 4. One-hour average ozone concentration.
Figure 3 shows the diurnal and weekly ozone cycle recorded at each site. The production of diurnal photochemical O3 varied throughout the day, reaching a maximum concentration approximately at 15:00 in winter and 13:00 in spring. Following these peaks, the O3 levels decreased progressively, suggesting atmospheric removal during the afternoon, which could be related to processes such as dry deposition and the reaction with nitric oxide (NO). Among all sites, the urban receptor was the only that showed a tendency to increase the O3 concentrations at dark hours and over the weekdays as well. The maximum average O3 concentration in the urban receptor site was reached on weekends (Figure 3).
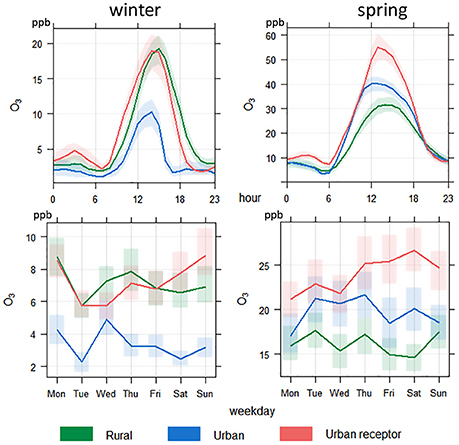
Figure 3. Diurnal and weekly variation of 1-h average O3 concentration (ppb) during winter and spring campaigns. Mean (solid line) and 95% confidence intervals in the mean (darkened area/shadow bars around mean) indicated in plot.
Submicron Particle Species Concentrations
Table 5 and Figure 4 show the concentration of refractory (BC) and non-refractory species of submicron particles at all sites during both measurement campaigns. Non-refractory species refers to chemical compounds that volatilize at temperatures below 600°C, in this article, chloride, sulfate, nitrate, ammonium, and organics.
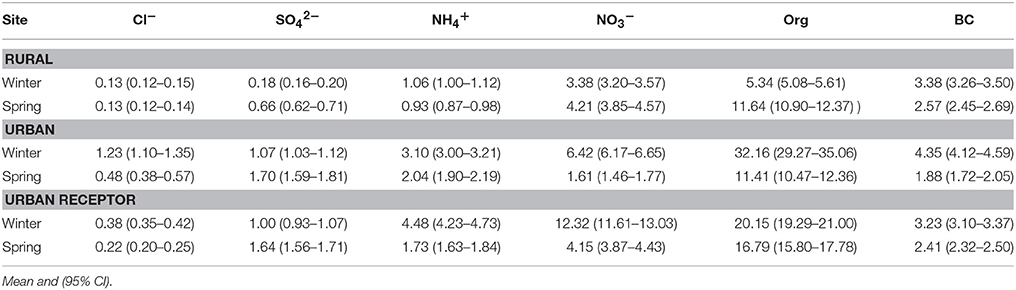
Table 5. One-hour average mass concentrations of BC and non-refractory species (μg m−3).
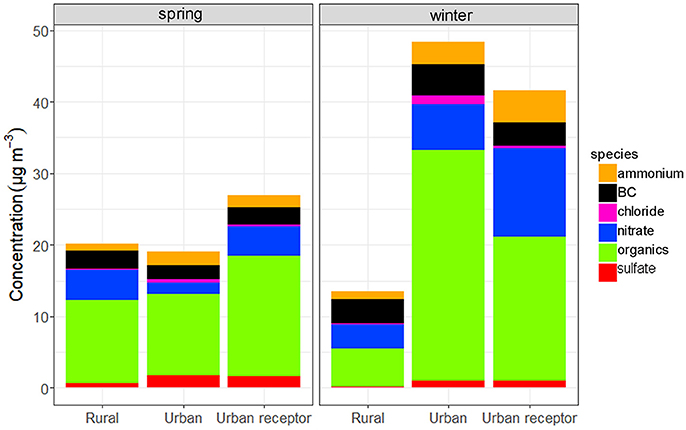
Figure 4. Chemical composition of submicron particle during winter and spring. Seasonal 1-h average concentrations.
Chloride was the non-refractory species in the submicron particle that presented the lowest concentration among all measured. At the rural site, seasonally averaged chloride concentration was nearly similar in winter and spring (0.13 and 0.14 μg m−3, respectively). The highest average chloride concentration was measured during winter at the urban site (1.23 μg m−3), while at the urban receptor the average concentration was close to the level observed in the rural location. In contrast, and despite that the sulfate concentration was low at all sites (< 2 μg m−3), it was the only that increased from winter to spring, diverging from the trend observed for the other species.
In the winter season, average nitrate concentration was significantly higher at the urban receptor site (12.32 μg m−3) compared to the average concentrations measured at the urban (6.42 μg m−3) and rural sites (3.38 μg m−3). During the spring season, the average nitrate concentration decreased at the urban receptor and urban sites, whereas at the rural site increased slightly.
The average ammonium concentration was measured higher at the urban receptor site during winter (4.48 μg m−3), followed by the urban (3.10 μg m−3) and the rural site (1.06 μg m−3). In spring, the urban site was the only one that experienced an increase in ammonium concentrations.
For organics, the highest concentrations were observed at the urban and urban receptor sites during winter (32.16 and 20.15 μg m−3, respectively). These concentrations were significantly reduced in spring (16.79 μg m−3 and 11.41 μg m−3 at the urban receptor site and urban site, respectively). From winter to spring, the average organics concentration increased approximately twice at the rural site (5.34 to 11.64 μg m−3, respectively).
Similarly, average BC concentrations were observed higher during the winter season at all monitoring stations, especially at the urban site (4.35 μg m−3), followed by the rural (3.38 μg m−3) and the urban receptor sites (3.23 μg m−3). In spring, the average BC concentration at the urban site (1.88 μg m−3) was slightly below the averages observed at the rural and urban receptor sites (2.57 and 2.41 μg m−3, respectively).
Considering the total non-refractory species measured in each season, the highest average mass concentration was observed in winter at the urban site (44.0 μg m−3), followed by the urban receptor site (38.3 μg m−3). Several high-pollution episodes, defined as 1-h average concentrations above 100 μg m−3, were observed during winter at both sites (Figure 5).
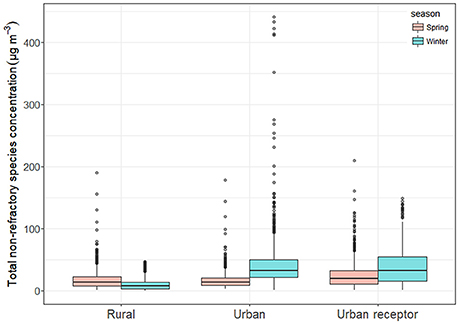
Figure 5. Average concentrations (μg m−3) of total non-refractory species during winter and spring campaigns. The black line at the middle of box represents the average value in each season. The circles represent 1-h concentrations outside the 95% confidence intervals in the mean.
Submicron Aerosol Acidity
The submicron aerosol acidity was determined as the ratio between the measured and predicted ammonium concentration. Predicted ammonium represents the concentration of ammonium needed to neutralize acidic atmospheric species, for example, sulfuric acid (H2SO4), nitric acid (HNO3), and hydrochloric acid (HCl). A ratio of one indicates that all the acidic species were neutralized. The predicted ammonium concentration was estimated using the Equation (1), as described by Carbone et al. (2013).
As shown in Table 6, all sites presented a ratio >1 in winter, suggesting that atmosphere was slightly alkaline during this season. In spring, the ratio increased at the urban site but decreased at the rural and urban receptor site to an average value lower than 1. Lower ratios observed at these sites suggested that transition to spring was associated with aerosol acidification in the rural and urban receptor locations.
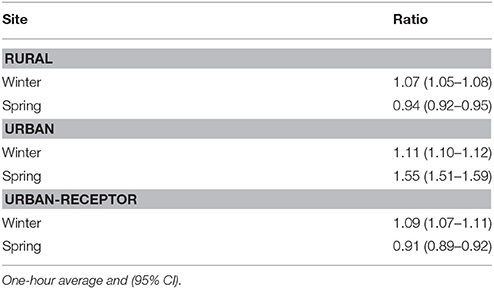
Table 6. Ratio between measured ammonium and predicted ammonium.
The hourly temporal variation of aerosol acidity in both seasons is shown in Figure 6. During the winter at the rural and urban receptor sites, the aerosol significantly increased its alkalinity during the morning and then decreased after 18:00 h. At the urban site, the aerosol remained slightly alkaline (ratio = 1.11), with little variation observed between day and night. At the same site, but in the spring season, the ratio significantly increased to 1.55, suggesting an excess of ammonium in the urban area. This feature diverges from that observed at the rural and urban receptor sites, where an ammonium deficit was noted (ratio = 0.94 and 0.91, respectively).
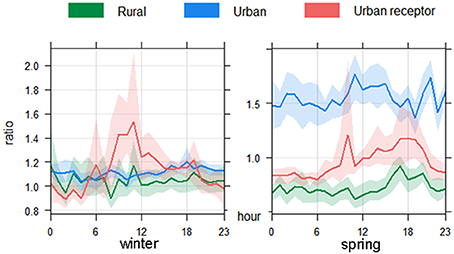
Figure 6. Diurnal variation of the measured vs. predicted ammonium ratio. Mean (solid line) and 95% confidence intervals in the mean (darkened area around mean) indicated in plot.
Spatiotemporal Variation in Submicron Particle Composition
Figures 7, 8 show the hourly profiles of the average species concentrations measured in winter and spring, respectively.
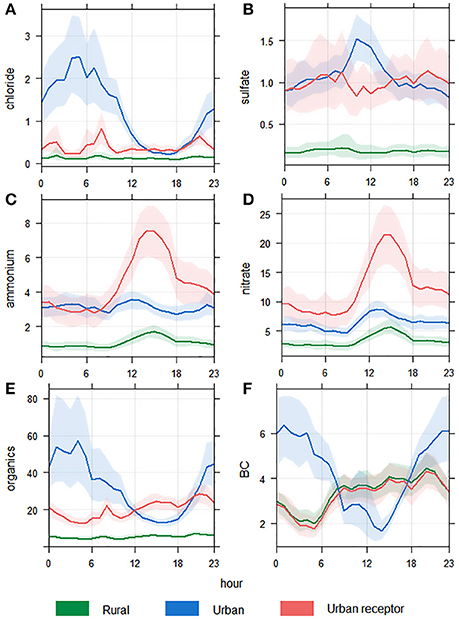
Figure 7. Hourly temporal profile of 1-h average concentrations (μg m−3) during the winter season. (A) chloride, (B) sulfate, (C) ammonium, (D) nitrate, (E) organics, (F) black carbon. Mean (solid line) and 95% confidence intervals in the mean (darkened area).
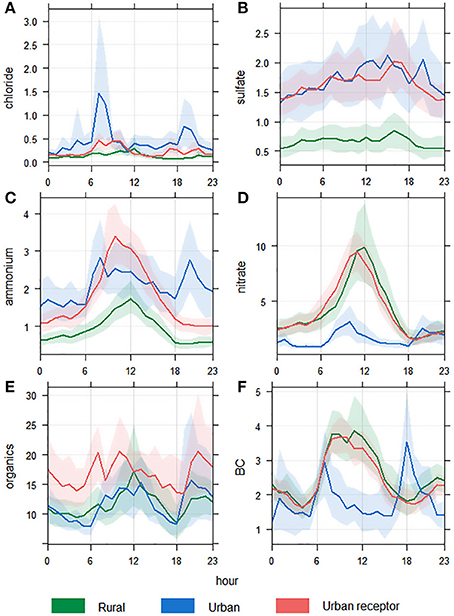
Figure 8. Hourly temporal profile of 1-h average concentrations (μg m−3) during the spring season. (A) chloride, (B) sulfate, (C) ammonium, (D) nitrate, (E) organics, (F) black carbon. Mean (solid line) and 95% confidence intervals in the mean (darkened area).
Chloride was present in low concentration in both the winter and spring seasons at all sites, with the lowest concentrations observed at the rural site. The hourly pattern for chloride (Figures 7A, 8A) showed that the maximum concentrations were recorded at the urban site and during night hours.
Even when sulfate concentrations increased during the spring season, this compound was present in low concentrations at all sites (< 2.0 μg m−3). In winter, the urban site presented the maximum concentrations in the period comprised between 08:00 and 16:00, contrasting the pattern observed at the urban receptor site, where the minimum concentrations were observed at the same time (Figure 7B). During the spring, the hourly profiles between the urban and urban receptor sites were practically coincident at all hours, presenting a slight increase afternoon (Figure 8B).
Ammonium and nitrate presented analogous profiles in winter, with the highest averages concentrations measured at the urban receptor site after 08:00 h (Figures 7C,D). The pattern also suggested that greater generation of ammonium nitrate particles (NH4NO3) occurred at the urban receptor site in winter, approximately at 15:00 h. As same as observed in winter, during the spring season a coincident hourly profile of ammonium and nitrate concentrations was observed at the urban receptor site, however, the maximum concentrations occurred earlier, at ~11:00 h in the morning (Figures 8C,D). Overall, higher nitrate concentrations were observed at the urban receptor site in both seasons, but notoriously at the rural site in spring (Figure 8D).
The organics concentration at the urban site presented a dissimilar hourly pattern between both seasons. In winter, the organics concentration began to increase after 18:00 and remained high during the night (Figure 7E), while during spring the maximum concentrations occurred in the morning (after 07:00) but also in the evening (Figure 8E). In spring, the urban receptor site had the highest concentrations of organic throughout the day, with a trend that resembles the traffic rush hours. A similar hourly pattern was also observed at the rural site during the same season.
The concentration profiles for organics and BC were similar at the urban site during winter (Figures 7E,F). Conversely, the rural and urban receptor sites showed the most coincident temporal variation in spring (Figures 8E,F). In this season, the BC concentration increased during the morning and remained high through the day, suggesting a likely contribution of vehicular sources.
The weekly variation for each species is shown in Figures 9, 10. During winter and at all monitoring sites, a noticeable pattern for nitrate and ammonium was observed; for both species, concentration presented a sustained increase from weekdays to weekend, reaching the maximum on Saturday (Figures 9C,D, respectively). This pattern was largely evident at the urban receptor site, where the trend was coincident with the profile observed for O3 concentrations (Figure 3). Organic species also increased toward the weekend and to a greater extent at the urban site (Figure 9D).
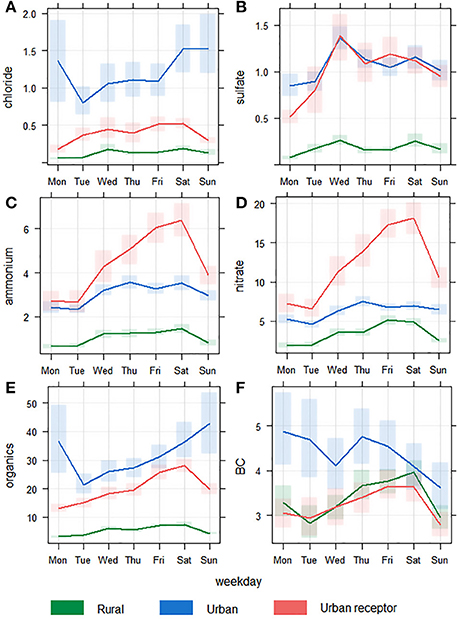
Figure 9. Weekly temporal profile of 1-h average concentrations (μg m−3) during the winter season. (A) chloride, (B) sulfate, (C) ammonium, (D) nitrate, (E) organics, (F) black carbon. Mean (solid line) and 95% confidence intervals in the mean (transparent bar).
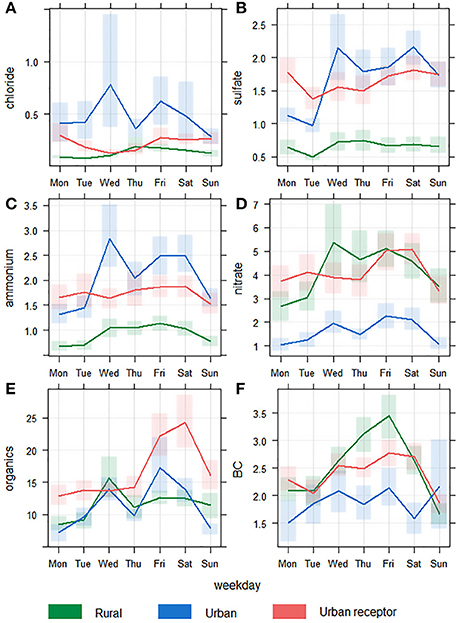
Figure 10. Weekly temporal profile of 1-h average concentrations (μg m−3) during the spring season. (A) chloride, (B) sulfate, (C) ammonium, (D) nitrate, (E) organics, (F) black carbon. Mean (solid line) and 95% confidence intervals in the mean (transparent bar).
During spring, nitrate and organic species showed a similar pattern at the urban receptor site, this means a progressive increase in their concentrations toward the weekend. Again, the pattern coincided with what was observed for O3.
In Supplementary Material, a detailed weekly series is presented for each monitoring site (Supplementary Figure 2), as well as the complete time series for each of the species (Supplementary Figure 3). Based on these profiles, it may be hypothesized that in the SMR an accumulation of gaseous pollutants likely occurs during weekdays, giving a larger production of particles due to the strong photochemical potential and the increase in the concentration of ozone in the local atmosphere. The phenomenon would develop with greater force during the winter when the ventilation conditions decrease considerably.
Discussion
In this study, the average concentrations of species in submicron aerosol were comparable to those reported in previous research. Carbone et al. (2013) reported concentrations for an urban location 6 km east from the actual urban site, which was monitored over 100 days and covered the transition period from winter to spring in 2011. The average non-refractory species concentrations measured at the urban site in 2011 and 2016 (spring), are as follows: organics (10.2 and 11.4 μg m−3), nitrate (2.0 and 1.6 μg m−3), ammonium (2.1 and 2.0 μg m−3), sulfate (2.8 and 1.7 μg m−3), and chloride (0.27 and 0.48 μg m−3).
Results obtained with the ACSM in other large cities, such as Barcelona and Mexico City, showed similarities, for example, that organics are predominant in the mass of the submicron aerosol. In spite of the above, a greater contribution of sulfate was found in both cities, in comparison to that measured in the SMR. In Barcelona, Mohr et al. (2012) reported that the submicron particle was composed of 43% organics, followed by nitrates (18%), sulfate (16%), BC (12%), ammonium (9%), and chloride (1%). In the current study the composition of the submicron particle at the urban site (the average of both seasons) was distributed in 67% organics, 13% nitrates, 2% sulfate, 9% BC, 6% ammonium, and 3% chloride. In Mexico City (Salcedo et al., 2006), a campaign that did not consider BC measurement, reported that organics reached 70%, and was followed by nitrate (12%), sulfate (10%), ammonium (7%), and chloride (1%).
Regarding temporal patterns, the diurnal variation of nitrate and ammonium concentrations at the urban receptor site suggests that submicron particle generation is likely influenced by the greater solar radiation and ozone found in that area. The combination of high solar radiation and accumulation of nitrogen monoxide (NO), emitted to a large extent by vehicular sources, could be the main source of ozone. Considering the high oxidative potential of the atmosphere at the urban receptor site, the NO can rapidly transform into nitrogen dioxide (NO2) and HNO3, causing acidification of the aerosol. Additionally, the increases in SO2 concentration observed in spring at the rural and urban receptor site may contributed to the aerosol acidification as well.
On the other hand, ammonia has been described as highly abundant at the urban site, due proximity to major sources, such as agricultural areas, sewage treatment plants, and industries (Toro Araya et al., 2014a). At this site, the increase in ammonium concentration observed in spring could be related to the greater alkalization observed in the urban aerosol during that season.
According to wind patterns, circulation of polluted air masses follows an easterly direction during the day and then changes to a westerly direction at night. This movement could explain the temporal profile of organics at the urban receptor site, where higher concentrations were observed afternoon. The difference between the wind speed measured at the sampling sites is based on the greater turbulence of air masses produced in the eastern part of the region where the urban receptor site is located. Previous research has shown that higher wind speeds in this area occur when cold air masses begin to descend from the Andes during the evening hours (Muñoz and Corral, 2017).
Even when chloride was present in low concentrations, its origin could be associated with marine salts that reach the SMR. Previously, it has been established that 90% of chloride in the PM2.5 (Da < 2.5 μm) found in Santiago comes from marine aerosols (Barraza et al., 2017). In an atmosphere saturated with HNO3, a reaction between this compound and sodium chloride (NaCl) produces hydrochloric acid (HCl) which is then neutralized by ammonium. The latter reaction results in particulate ammonium chloride (NH4Cl), which was the species measured in the submicron aerosol.
The presence of sulfate in the submicron aerosol can be related to the oxidation of sulfur dioxide (SO2) by the increased concentration of photochemical product OH to form sulfuric acid (H2SO4). The acid is neutralized by ammonium to form a particulate salt (ammonium sulfate). Due to the low sulfur content in vehicular fuel used in the country (<15 parts per million), sulfate in the aerosol have been historically associated with the long-distance industrial SO2 emissions, mainly from the three large copper smelter plants located ~100 km South and ~90 Northwest from the urban center (Olivares et al., 2002). Based on the dissimilar hourly profile between sulfate and ammonium, it can be suggested that the ammonium sulfate measured in the aerosol could be previously formed and transported from a long range. Despite that, it is recognized that the current study does not incorporate a trajectory analysis, and for that reason, this presumption is founded only on dispersion models presented in previous research (Gallardo et al., 2002; Olivares et al., 2002).
The hourly trends of organics and BC registered at the urban and urban receptor sites are coincident with the temporal patterns shown in other studies developed in the same monitoring stations (Toro Araya et al., 2014b). The increase in organic and BC concentrations measured at the urban site during the winter season, could be the effect of a greater number of residential sources burning wood (Gramsch et al., 2014).
The O3 increases during the weekend have been previously described at the urban receptor site by Seguel et al. (2012). As we suggested before, the so-called “weekend effect” could be the result of continued accumulation of nitrate, ammonium, and VOCs during the weekdays. A greater availability of O3 during the weekend, especially Saturdays in winter, likely increase the rate of organic oxidations and, therefore, increase the production of submicron particles.
Although we have presented information obtained with state-of-the-art instrumentation, the data has limitations, as for example, that the mass concentrations were obtained with a detection limit of 0.2 μg m−3 (for 30 min of signal averaging), which supposes uncertainties for species such as chloride and sulfate. Also, the sampling period was not exactly the same at all the sites, however, the representativeness of the measurements for each of the season studied can be assured since the temporal trend does not indicate considerable variations.
Finally, it can be indicated that the study presents, for the second time in Chile, a detailed characterization of the non-refractory species contained in the submicron aerosol. The spatiotemporal analysis presented in this article can be considered useful for stakeholders involved in the design of the next atmospheric decontamination programs in the SMR.
Conclusion
Based on advanced instrumentation, the study reported concentrations of BC and non-refractory submicron aerosol species in the Metropolitan Region of Santiago, Chile. During the winter and spring seasons of 2016, the organics species were the predominant, followed by nitrate and ammonium. The study concludes that at a general level the atmosphere in Santiago contains a large load of organic species and nitrate, which are found in higher concentrations during the winter season. At a temporary level, these species increase in the morning in coincidence with the increase in traffic. Based on the hourly profiles and the prevalent air movement, the study suggests that the polluted air is likely transported to the northeast part of the city, at higher altitudes and near the Andes. This area can be defined as an urban receptor site, which is characterized by a greater photochemical activity that results in an increase in the concentration of ozone and formation of particulate matter as well.
Author Contributions
All authors contributed to the work presented in this paper. FR and YV: designed and conducted the measurement campaigns; MT: analyzed data and prepared the manuscript; SC, SS, and HT: discussed the results and edited the manuscript; EG and PO: corrected the final document.
Conflict of Interest Statement
The authors declare that the research was conducted in the absence of any commercial or financial relationships that could be construed as a potential conflict of interest.
Acknowledgments
The research team thanks the Ministry of the Environment (MMA) for providing space in monitoring stations at Las Condes and Pudahuel. The study was partly funded by the project Characterization of fine and coarse particulate material in the metropolitan region id: 608897-186-LQ15, MMA and Fondecyt Project No 1151117.
Supplementary Material
The Supplementary Material for this article can be found online at: https://www.frontiersin.org/articles/10.3389/fenvs.2018.00027/full#supplementary-material
Footnotes
1. ^Zhang, Q., Parworth, C., Lechner, M., and Jimenez, J. Aerosol Mass Spectrometer Global Database. Available online at: https://sites.google.com/site/amsglobaldatabase
2. ^INE National Institute of Statistics. Final Results: Census 2017. Available online at: http://www.censo2017.cl (Accessed February 12, 2018).
3. ^INE National Institute of Statistics. Yearbooks of Circulating Vehicle Park. Available online at: http://historico.ine.cl/canales/chile_estadistico/estadisticas_economicas/transporte_y_comunicaciones/parquevehiculos.php (Accessed November 11, 2017).
References
Almeida, G., Brito, J., Morales, C., Andrade, M., and Artaxo, P. (2014). Measured and modelled cloud condensation nuclei (CCN) concentration in São Paulo, Brazil: the importance of aerosol size-resolved chemical composition on CCN concentration prediction. Atmos. Chem. Phys. 14, 7559–7572. doi: 10.5194/acp-14-7559-2014
Barraza, F., Lambert, F., Jorquera, H., Villalobos, A. M., and Gallardo, L. (2017). Temporal evolution of main ambient PM2.5 sources in Santiago, Chile, from 1998 to 2012. Atmos. Chem. Phys. 17, 10093–10107. doi: 10.5194/acp-17-10093-2017
Bzdek, B. R., and Reid, J. P. (2017). Perspective: aerosol microphysics: from molecules to the chemical physics of aerosols. J. Chem. Phys. 147:220901. doi: 10.1063/1.5002641
Carbone, S., Saarikoski, S., Frey, A., Reyes, F., Reyes, P., Castillo, M., et al. (2013). Chemical characterization of submicron aerosol particles in Santiago de Chile. Aerosol Air Qual. Res. 13, 462–473. doi: 10.4209/aaqr.2012.10.0261
Carslaw, D. C., and Ropkins, K. (2012). Openair - An r package for air quality data analysis. Environ. Model. Softw. 27–28, 52–61. doi: 10.1016/j.envsoft.2011.09.008
Elshorbany, Y. F., Kurtenbach, R., Wiesen, P., Lissi, E., Rubio, M., Villena, G., et al. (2009). Oxidation capacity of the city air of Santiago, Chile. Atmos. Chem. Phys. 9, 2257–2273. doi: 10.5194/acp-9-2257-2009
Fröhlich, R., Cubison, M. J., Slowik, J. G., Bukowiecki, N., Prévôt, A. S. H., Baltensperger, U., et al. (2013). The ToF-ACSM: a portable aerosol chemical speciation monitor with TOFMS detection. Atmos. Meas. Tech. 6, 3225–3241. doi: 10.5194/amt-6-3225-2013
Gallardo, L., Olivares, G., Langner, J., and Aarhus, B. (2002). Coastal lows and sulfur air pollution in Central Chile. Atmos. Environ. 36, 3829–3841. doi: 10.1016/S1352-2310(02)00285-6
Garreaud, R., Rutllant, J., and Fuenzalida, H. (2002). Coastal lows in north-central Chile: mean structure and evolution. Mon. Weather Rev. 130, 75–88.
Gramsch, E., Catalán, L., Ormeño, I., and Palma, G. (2000). Traffic and seasonal dependence of the light absorption coefficient in Santiago de Chile. Appl Opt. 39, 4985–4901. doi: 10.1364/AO.39.004895
Gramsch, E., Cereceda-Balic, F. L., Ormeño, I., Palma, G., and Oyola, P. (2004). Use of the light absorption coefficient to monitor elemental carbon and PM2.5. Example of Santiago de Chile. J. Air Waste Manage. Assoc. 54, 799–808. doi: 10.1080/10473289.2004.10470956
Gramsch, E., Cereceda-Balic, F., Oyola, P., and von Baer, D. (2006). Examination of pollution trends in Santiago de Chile with cluster analysis of PM10 and ozone data. Atmos. Environ. 40, 5464–5475. doi: 10.1016/j.atmosenv.2006.03.062
Gramsch, E., Reyes, F., Oyola, P., Rubio, M., López, G., Pérez, P., et al. (2014). Particle size distribution and its relationship to black carbon in two urban and one rural site in Santiago de Chile. J. Air Waste Manage. Assoc. 64, 785–796. doi: 10.1080/10962247.2014.890141
Gramsch, E., Reyes, F., Vasquez, Y., Oyola, P., and Rubio, M. (2016). Prevalence of freshly generated particles during pollution episodes in Santiago de Chile. Aerosol. Air Qual. Res. 16, 2172–2185. doi: 10.4209/aaqr.2015.12.0691
Hoffmann, T., Huang, R. J., and Kalberer, M. (2011). Atmospheric analytical chemistry. Anal. Chem. 83, 4649–4664. doi: 10.1021/ac2010718
Horvath, H., Catalan, L., and Trier, A. (1997). A study of the aerosol of Santiago de Chile III: light absorption measurements. Atmos. Environ. 31, 3737–3744. doi: 10.1016/S.1352-2310(97)00215-X
IPCC (2013). Climate Change 2013: The Physical Science Basis (Contribution of Working Group I to the Fifth Assessment Report of the Intergovernmental Panel on Climate Change). Cambridge University Press, New York, NY.
Mohr, C., DeCarlo, P. F., Heringa, M. F., Chirico, R., Slowik, J. G., Richter, R., et al. (2012). Identification and quantification of organic aerosol from cooking and other sources in Barcelona using aerosol mass spectrometer data. Atmos. Chem. Phys. 12, 1649–1665. doi: 10.5194/acp-12-1649-2012
Muñoz, R., and Alcafuz, R. (2012). Variability of urban aerosols over Santiago, Chile: comparison of surface PM10 concentrations and remote sensing with Ceilometer and Lidar. Aerosol Air Qual. Res. 12, 8–19. doi: 10.4209/aaqr.2011.08.0133
Muñoz, R., and Corral, M. (2017). Surface indices of wind, stability, and turbulence at a highly polluted urban site in Santiago, Chile, and their relationship with nocturnal particulate matter concentrations. Aerosol Air Qual. Res. 17, 2780–2790. doi: 10.4209/aaqr.2017.05.0190
Muñoz, R., and Undurraga, A. (2010). Daytime mixed layer over the Santiago Basin: description of two years of observations with a Lidar Ceilometer. J. Appl. Meteorol. Clim. 49, 1728–1741. doi: 10.1175/2010JAMC2347.1
Ng, N. L., Herndon, S. C., Trimborn, A., Canagaratna, M. R., Croteau, P. L., Onasch, T. B., et al. (2011). An Aerosol Chemical Speciation Monitor (ACSM) for routine monitoring of the composition and mass concentrations of ambient aerosol. Aerosol Sci. Technol. 45, 780–794. doi: 10.1080/02786826.2011.560211
Olivares, G., Gallardo, L., Langner, J., and Aarhus, B. (2002). Regional dispersion of oxidized sulfur in Central Chile. Atmos. Environ. 36, 3819–3828. doi: 10.1016/S1352-2310(02)00286-8
Ragsdale, K. M., Barret, B. S., and Testino, A. P. (2013). Variability of particulate matter (PM10) in Santiago, Chile by phase of the Madden-Julian Oscillation (MJO). Atmos. Environ. 81, 304–310. doi: 10.1016/j.atmosenv.2013.09.011
Rappenglück, B., Oyola, P., Olaeta, I., and Fabian, P. (2000). The evolution of photochemical smog in the Metropolitan Area of Santiago de Chile. J. Appl. Meteorol. 39, 275–290. doi: 10.1175/1520-0450(2000)039<0275:TEOPSI>2.0.CO;2
Rappenglück, B., Schmitz, R., Bauerfeind, M., Cereceda-Balic, F., von Baer, D., Jorquera, H., et al. (2005). An urban photochemistry study in Santiago de Chile. Atmos. Environ. 39, 2913–2931. doi: 10.1016/j.atmosenv.2004.12.049
Romero, H., Ihl, M., Rivera, A., Zalazar, P., and Azocar, P. (1999). Rapid urban growth, land-use changes and air pollution in Santiago, Chile. Atmos. Environ. 33, 4039–4047. doi: 10.1016/S1352-2310(99)00145-4
Rubio, M. A., Oyola, P., Gramsch, E., Lissi, E., Pizarro, J., and Villena, G. (2004). Ozone and peroxyacetylnitrate in downtown Santiago, Chile. Atmos. Environ. 38, 4931–4939. doi: 10.1016/j.atmosenv.2004.05.051
Rutllant, J., and Garreaud, R. (1995). Meteorological air pollution potential for Santiago, Chile: towards an objective episode forecasting. Environ. Monit. Assess. 34, 223–244. doi: 10.1007/BF00554796
Salcedo, D., Onasch, T. B., Dzepina, K., Canagaratna, M. R., Zhang, Q., Huffman, J. A., et al. (2006). Characterization of ambient aerosols in Mexico city during the MCMA-2003 campaign with Aerosol mass spectrometry: results from the CENICA supersite. Atmos. Chem. Phys. 6, 925–946. doi: 10.5194/acp-6-925-2006
Schmitz, R. (2005). Modelling of air pollution dispersion in Santiago de Chile. Atmos. Environ. 39, 2035–2047. doi: 10.1016/j.atmosenv.2004.12.033
Seguel, R., Morales, R., and Leiva, M. (2012). Ozone weekend effect in Santiago, Chile. Environ. Pollut. 162, 72–79. doi: 10.1016/j.envpol.2011.10.019
Timonen, H., Cubison, M., Aurela, M., Brus, D., Lihavainen, H., Hillamo, R., et al. (2016). Applications and limitations of constrained high-resolution peak fitting on low resolving power mass spectra from the ToF-ACSM. Atmos. Meas. Tech. 9, 3263–3281. doi: 10.5194/amt-9-3263-2016
Toro Araya, R., Canales, M., Flocchini, R., Morales Segura, R., and Leiva Guzmán, M. A. (2014a). Urban atmospheric ammonia in Santiago City, Chile. Aerosol Air Qual. Res. 14, 33–44. doi: 10.4209/aaqr.2012.07.0189
Keywords: ACSM, air pollution, Chile, particulate matter, submicron
Citation: Tagle M, Reyes F, Vásquez Y, Carbone S, Saarikoski S, Timonen H, Gramsch E and Oyola P (2018) Spatiotemporal Variation in Composition of Submicron Particles in Santiago Metropolitan Region, Chile. Front. Environ. Sci. 6:27. doi: 10.3389/fenvs.2018.00027
Received: 09 January 2018; Accepted: 24 April 2018;
Published: 15 May 2018.
Edited by:
Maurice Millet, Université de Strasbourg, FranceReviewed by:
Ioannis Konstantinos Christodoulakis, National and Kapodistrian University of Athens, GreeceEduardo Landulfo, Instituto de Pesquisas Energéticas e Nucleares (CNEN), Brazil
Maria De Fatima Andrade, Universidade de São Paulo, Brazil
Copyright © 2018 Tagle, Reyes, Vásquez, Carbone, Saarikoski, Timonen, Gramsch and Oyola. This is an open-access article distributed under the terms of the Creative Commons Attribution License (CC BY). The use, distribution or reproduction in other forums is permitted, provided the original author(s) and the copyright owner are credited and that the original publication in this journal is cited, in accordance with accepted academic practice. No use, distribution or reproduction is permitted which does not comply with these terms.
*Correspondence: Matías Tagle, bXRhZ2xlQGNtbW9saW5hLmNs