 Gennadi Milinevsky
 Vassyl Danylevsky
- 1International Center of Future Science, Jilin University, Changchun, China
- 2Space Physics Laboratory, Taras Shevchenko National University of Kyiv, Kiev, Ukraine
- 3Department for Atmospheric Optics and Instrumentation, Main Astronomical Observatory, National Academy of Sciences of Ukraine, Kiev, Ukraine
- 4Astronomical Observatory, Taras Shevchenko National University of Kyiv, Kiev, Ukraine
In this paper the current status of knowledge and research efforts on atmospheric aerosol investigation over Ukraine region are reviewed. Several earlier results of atmospheric extinction, aerosol content and properties studies performed in Ukraine during the second part of the twentieth century are discussed. The recent findings on aerosol optical depth, Ångström exponent, optical and microphysical properties of aerosol particles (single-scattering albedo, size distribution, complex refractive index) and their seasonal variability obtained from both AERONET and portable sun-photometers measurements during the 2008–2016 period are presented and analyzed. Data of POLDER/PARASOL satellite instrument were also involved to study the aerosol properties over Ukraine and neighbor countries. The results showed that aerosol content and properties over Ukraine are very similar to ones over rest European urban regions but considerably lower than over polluted China territories. The first lidar measurements and the air quality evaluations by the PM concentration measurements in Ukraine are also discussed. The aerosol sources in Ukraine and surrounding territories are considered from analysis of the air mass back trajectory and simulation by GEOS-Chem model. The future satellite project Aerosol-UA for global aerosol studies by measurements of the scattered solar radiation polarization is discussed in the article.
Introduction
Atmosphere aerosol influences on the solar radiation flux in the Earth's atmosphere. Aerosol reflects solar radiation and counteracts the greenhouse effect. Absorbing radiation aerosols (ex. black carbon) can act as greenhouse gases heating the atmosphere at the altitudes with large aerosol particle concentration. Aerosols also act as cloud condensation nuclei influencing on clouds properties, such as droplets sizes and number, clouds life time, and albedo. That determines three ways of aerosol influence on the climate system energy balance (Enhalt et al., 2001; Climate Change, 2013). Also aerosol particles in the surface layer of the atmosphere influence on the air quality and can be injurious to human health (Bernstein et al., 2004; Davidson et al., 2005; Anderson et al., 2012; Kim et al., 2015). It is very important to provide monitoring of the aerosols properties and concentration in the atmosphere and accumulate data from as much as possible part of the globe and of the time span. Different ground-based and satellite instruments are used to study the aerosol properties and dynamics on the regional and global scales. The remote sensing techniques: sun-photometers (Holben et al., 1998, 2001; Yoon et al., 2012; Che et al., 2018), lidars (Ansmann and Muller, 2005; Amiridis et al., 2009, and satellite instruments (Remer et al., 2008; Zhao et al., 2008; Tanré et al., 2011; Sayer et al., 2012; Winker et al., 2013; Kokhanovsky et al., 2015), are used or under construction (Marbach et al., 2015; Milinevsky et al., 2016) to study columnar aerosol content and properties. In-situ measurement provides data on the aerosol particles concentrations, formation, and properties in different layers of the atmosphere including surface air. The most effective results can be expected from the synergy of the different measurement techniques and observation results. To study aerosols in specific regions of the world and on the global scale, the special national, regional and global networks of the different instruments have been created. For example, the sun-photometer international networks AERONET (AErosol Robotic NETwork, https://aeronet.gsfc.nasa.gov/, Holben et al., 1998), SKYNET (http://www.skynet-isdc.org/, Hashimoto et al., 2012), Sun-sky radiometer Observation NETwork (SONET) in China (Li et al., 2018), and the China Aerosol Remote Sensing Network (CARSNET) (Che et al., 2018), The NASA Micro-Pulse Lidar Network (MPLNET, https://mplnet.gsfc.nasa.gov/, Welton et al., 2001; Welton and Campbell, 2002), European Aerosol Research Lidar Network (EARLINET, https://www.earlinet.org/, Pappalardo et al., 2014), Latin American Lidar Network (LALINET, http://www.lalinet.org/, Guerrero-Rascado et al., 2016). These ground-based remote sensing techniques are used to study aerosols over land and to validate satellite measurements. To study aerosols and validate satellite measurements over the ocean, the Maritime Aerosol Network (MAN) has been established by NASA as a component of the AERONET (https://aeronet.gsfc.nasa.gov/new_web/maritime_aerosol_network.html, Smirnov et al., 2011).
The different aerosol contents, dynamics and other properties over the globe are obtained from the networks observations. The difference of the aerosol properties in dependence on their origin and the observational site location was revealed in the early study (Dubovik et al., 2002) from analysis of 8-years measurements with the AERONET sun-photometers performed at the different locations worldwide. The main classes of the aerosol particles were established in that study: desert dust, biomass burning, urban-industrial and marine aerosols. The robust models of the corresponding types of aerosol particles were developed. The typical values of the columnar aerosol optical depth (AOD), Ångström exponent (AE), particle single-scattering albedo (SSA), refractive index (RI), and size distribution were determined. Further cluster analysis of the AERONET measurements over the globe has been performed for the development of the satellite data processing algorithms (Omar et al., 2005), and has confirmed the Dubovik et al. (2002) classification with the additional rural background aerosol type. An analysis of the AERONET measurements performed at 15 sites in different worldwide locations during the 1995–2009 period has revealed the different trends of the fine and coarse modes AOD and AE in the different regions (Yoon et al., 2012). Though the study periods were different for each site, it was found that an increase of the aerosols content with fine mode particles dominated over industrial regions of East Asia and over agricultural regions of South Africa with the positive trends more than 6% per year and ~1.9% per year, respectively. Over sites in Western Europe and North America, these trends were insignificant or negative (from +0.25 to −2.3% per year). The decreased and increased trends of the coarse mode dominated aerosols were observed over desert regions depending on the meteorological conditions.
Observations at different regions refine the regional properties of the aerosol particles and dynamics. For example, columnar spectral AOD and AE (440–870 nm) determined from the multi-year (2005–2009) AERONET observations in Southern Italy were analyzed by Boselli et al. (2012). Using cluster analysis of AOD and AE, back trajectories of air mass analysis and aerosol transport models, the authors have found that the atmosphere over the site is polluted by natural aerosols, namely dust from Sahara (37.5%), sea salt from Tyrrhenian, Adriatic, and Ionian Seas (4%), and anthropogenic aerosols from the European continent (41%). The rest (17.5%) comprises mixed aerosols with back-trajectories at different altitudes that did not show the same path and origin. The AOD (440 nm) and AE values ranged from 0.03 to 0.6 and from 0.15 to 3.14, respectively. The mean value of AOD (440 nm) was equal to 0.161 ± 0.004 and mean AE was of 1.44 ± 0.54.
The cluster analysis of AOD and AE, and back trajectory statistics are used by Szkop et al. (2016) to study aerosol properties and classification over Central Europe from analysis of observations at the AERONET sites Belsk (Poland), Leipzig (Germany), Minsk (Belarus), and Moldova (Chisinau, Moldova) during 2001–2012. The MODIS satellite instrument data were used in the discussion of possible sources of aerosols. It was found that the mean values of AOT measured at all these sites do not differ significantly, and all sites affected by similar types of aerosol. Five aerosol types were identified by 2D cluster analysis for studied region: biomass burning aerosols with averaged on the cluster AOD (440 nm) = 0.58 ± 0.23 and AE (440–870 nm) = 1.62 ± 0.18 (approximately 13% of the observational days), predominance by desert dust (AOD (440 nm) = 0.29 ± 0.08, AE = 1.04 ± 0.26, 8.5% of days), urban-industrial (mixed continental and industrial, AOD (440 nm) = 0.28 ± 0.08, AE = 1.66 ± 0.15, 28% of days), polluted continental (AOD (440 nm) = 0.16 ± 0.03, AE = 1.53 ± 0.20, 31.5% of days) and mixed continental and maritime aerosol [AOD (440 nm) = 0.08 ± 0.02, AE = 1.32 ± 0.28, 19% of days]. The polluted continental aerosol originated from Slovakia and northern Hungary, urban-industrial aerosol originated from western Poland and eastern Germany, and continental-maritime aerosols originated from Scandinavia, Baltic Sea and Northern Atlantic, correspondingly, are the main pollutants over Central Europe. The biomass burning aerosol sources are localized around of Belarusian–Ukrainian border (Szkop et al., 2016).
Unlike Europe, the high aerosol content caused mainly by anthropogenic activities observed in the atmosphere over many areas of eastern China. The AERONET observations over the Chinese Yangtze Delta Region during 2007–2008 (Pan et al., 2010) and 2011–2015 (Che et al., 2018) found that the AOD (440 nm) reached values 1.41 ± 0.49 at some sites in July (Pan et al., 2010), but the typical AOD (440 nm) values in the region are approximately 0.71–0.76 and are similar to other urban areas of China, such as Shenyang (0.75), Beijing (0.76), Tianjin (0.74), Shanghai (0.70), and Hefei (0.69) (Che et al., 2018). The AE over the Chinese Yangtze Delta Region typically ranged from 1.1 to 1.6 (Pan et al., 2010). At the rural sites in theYangtze Delta Region the AOD (440 nm) can also be very high, up to ~ 0.68 that is 2–6 times higher than in other rural sites in China, where it ranges typically from 0.11 to 0.35 over southwest and northeast of China, respectively (Che et al., 2018). The aerosol classification is more complicated over China comparing to Europe. However it was found that the fine mode is the major contribution of the particles in the classification scheme based on SSA, fine-mode fraction and extinction Angström exponent (Che et al., 2018).
The latest measurements of the aerosol optical properties were performed over Lumbini, Nepal, with the AERONET sun-photometer (Rupakheti et al., 2018). The site is located near the northern edge of the central Indo-Gangetic Plains (IGP) and before the Himalayan foothills (and Himalayas) to its north. Average AOD (500 nm) value was found of 0.64 ± 0.38 during January 2013–December 2014, and 0.72 ± 0.44 during the post-monsoon season. More than 80% of the daily averaged AOD (500 nm) values were above 0.3 during the monitoring period. The levels of aerosol load observed over Lumbini are comparable to those observed at several heavily polluted sites in the IGP. It was found from analysis of the AOD and AE, that anthropogenic, biomass burning, and mixed aerosols are the most prevalent aerosol types. The aerosol volume-size distribution was bi-modal during a year with modes centered at 0.1–0.3 and 3–4 μm.
The ground-based sun-photometer observations are used in the modeling of the aerosol properties, spatial-temporal distribution and dynamics on the global and regional scales, (e.g., Omar et al., 2005; Yu et al., 2012; Menut et al., 2013; Chin et al., 2014) and also to validate the satellite data on aerosol properties (e.g., Holben et al., 1998; Fan et al., 2008; Goloub et al., 2008; Bréon et al., 2011; Smirnov et al., 2011; Xiao et al., 2016).
The current article is aimed to review results of the aerosol study in the Earth's atmosphere over Ukraine due to their substantial influence on the air pollution and climate. The layout of the region discussed in the review is shown in Figure 1. Several earlier results of atmospheric extinction, aerosol content and properties studies performed during second part of twentieth century are discussed in the article. In recent years the atmospheric research in Ukraine is developed in cooperation with international programs of climate change studies using up to date techniques. In Ukraine, atmospheric aerosol measurements by the AERONET technique have been provided since 2006 in Sevastopol and since 2008 in Kyiv. The recent findings on aerosol optical depth, Ångström exponent values, optical and microphysical properties of aerosol particles (size distribution, single-scattering albedo, complex refractive index) obtained from AERONET measurements, are discussed in the paper.
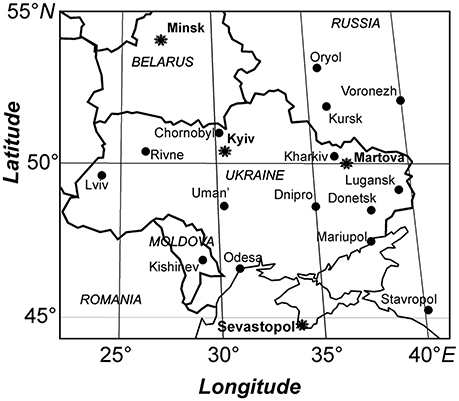
Figure 1. Ukraine territory and other adjusted investigated regions for aerosol study discussed in the paper. The sun-photometer AERONET sites location is shown by stars.
The data from satellite instruments (ex. POLDER, MODIS) have also discussed, and the short campaign of lidar measurements in Kyiv carried out during August–September of 2015. The development of the space radiometer/polarimeter instruments for the Aerosol-UA project for atmospheric aerosols global monitoring is discussed in the review as well. These instruments will investigate microphysical properties of aerosol particles. The air quality evaluations by PM2.5/PM10 measurements in Ukraine, GEOS-Chem modeling and localization of aerosol sources in East-European region by back-trajectory statistics are also discussed in the review.
Earlier Data on Aerosol Content and Properties in the Atmosphere Over Ukraine
Estimations of the aerosols content and properties in the atmosphere over several regions of Ukraine since 1955 were performed from measurements of the direct solar irradiation. The observations were carried out with actinometers of the former Soviet Union State Meteorological Network and later in Ukraine (Russak, 1990; Abakumova et al., 1996; Climate of Ukraine, 2003). In that technique, the aerosols considered as one of the main contributors to the atmosphere extinction. Aggregated data on the aerosol influence on the atmosphere transparency in the 1955–1995 period over urban regions of Ukraine (Poltava, Odessa, Kherson cities), and over rural regions (Bolgrad and Ascania Nova) are analyzed in Climate of Ukraine (2003). The time span of 30 years observations is divided into three periods that differ by natural and anthropogenic factors. These periods are 1955–1970, 1971–1985, and 1986–1995. The tendency of the atmospheric transparency decreasing was found in both urban and rural regions for each of these periods due to increasing of the aerosol extinction which was larger at urban regions. Aerosols contribution to the atmosphere extinction at Ascania Nova was 33% in the first period and 38% in the third one, but at Odessa, it was 38% and 43%, respectively. These results were considered as a tendency of aerosols content increase in the atmosphere over Ukraine due to the strengthening of the anthropogenic factor. Larger aerosols contribution was observed during summer months with the maximum in June–July whereas in winter the aerosol contribution was small.
In addition, the remote measurements of the spectral AOD and Ångström exponent determination had been carried out in the former USSR with special photometers M-83 (Gushchin, 1988). To determine AOD, M-83 photometer was provided by the glass filters with spectral bands that were centered at 344, 369, 463, 530, 572, 627 nm wavelengths with a full width at half maximum (FWHM) equal to 31, 22, 17, 60, 33, and 32 nm respectively. The Ångström exponent value was determined using 369 and 530 nm wavelengths. The several observational sites were located in Ukraine, for example, in Kyiv, Odessa, Lviv, Feodosia (Karadag, Crimea). Instrument design, the procedure of the aerosol properties measurements and summary of results of data analysis published in Gushchin (1988). The aerosol measurement results in Ukraine during 1972–1984 are shown in Figure 2. In Figure 2A the number of measurement years for Lviv is total 6, for Odessa - total/warm period 7/10, for Feodosia/Karadag - total/warm period 10/11.
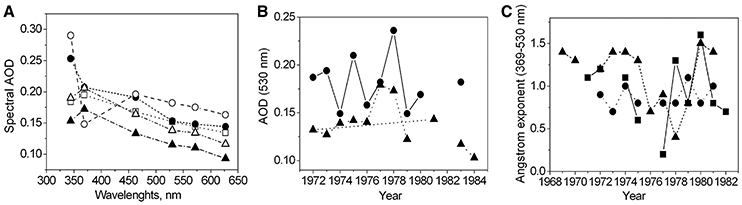
Figure 2. Spectral AOD and Ångström exponent at Lviv, Odessa, and Feodosia/Karadag sites in Ukraine multiyear averaged over the period 1972–1984. (A) Spectral AOD solid symbols—total AOD, open symbols—warm period AOD, (B) AOD (530 nm) at Odessa and Feodosia/Karadag sites of Ukraine averaged over warm part of a year for the 1972–1984 period, (C) yearly averaged Ångström exponent (369–530 nm) for at Lviv, Odessa, and Feodosia/Karadag sites in Ukraine in the period of 1969–1982. In figures: Lviv (square), Odessa (circle), Feodosia/Karadag (triangle). Plots have been created by data from Gushchin (1988).
The measurements of the atmosphere extinction in the Crimea Peninsula have the longest history in Ukraine. First observations were started in 1924 at the Feodosia Central Hydrometeorological Station (Karadag) with the Michelson actinometer. Then, measurements were continued at the new station in Simferopol from 1926 to 1932 (the first observational period) with Michelson actinometer provided with optical glass filters in U (wavelength λ < 520 nm), R (λ > 625 nm), and V (λ = 520–625 nm) spectral bands. The second observational period lasted in 1972–1990 in Feodosia. The observations were carried out with M-83 photometer. Measurements of the spectral extinction of the atmosphere have been performed during 1996–2000 using the sun tracking sun-photometer (Terez and Terez, 2002). The photometer provided the measurements in five spectral bands extracted by interference filters centered at 357, 401, 448, 512, and 750 nm. Results of the observations were compared with the data of earlier studies in 1924–1932 and 1972–1990. From these measurements, conclusion follows: the atmosphere transparency in Crimea in 1924–1932 can be considered as a background level, during 1972–1990 the atmosphere transparency decreased, presumably because of anthropogenic influences and the El Chichon volcano eruption, and during 1996–2000 the atmosphere transparency returned to the background level (Terez and Terez, 2002). More detailed information about aerosols content and optical and microphysical properties in the atmosphere over several regions of Ukraine were obtained after 2006 using AERONET sun-photometers technique (Holben et al., 1998; Goloub et al., 2008).
Aerosol Remote Sensing Over Ukraine by AERONET Technique
Aerosol remote sensing measurements by AERONET sun-photometers have been started in Ukraine in 2006 at Sevastopol (Yakovleva and Tolkachenko, 2008). The measurements in Kyiv permanent site by the AERONET sunphotometer CIMEL CE318 started at the end of March 2008 (Danylevsky et al., 2011a,b) and are still in progress. The measurements by the AERONET sunphotometer at the Martova permanent site, located approximately at 70 km eastward of Kharkiv city, has been set in November 2013, and previously the measurements with sun-photometer CIMEL CE318-EDPS9 were performed at Lugansk AERONET site from November 2011 to November 2013. These two sites have produced the data on aerosol amount and properties over the Eastern part of Ukraine. The Sevastopol AERONET site is located in a coastal zone quite distantly from continental part of country and aerosols type is slightly different from ones over continental Ukraine. All AERONET aerosol sites in Ukraine, besides Sevastopol site, are operated and calibrated under the AERONET/PHOTONS responsibility (Goloub et al., 2008).
Three temporary AERONET sites—Donetsk, Yevpatoria, and Kyiv-AO—have been established during 2011–2013 in Ukraine. The measurements at these three sites were carried out during short time intervals—from several days to 3 months as at Kyiv-AO site, using CE318-EDPS9 sun-photometer as a mobile site, which traveled over Ukraine regions. In addition, short series of measurements were carried out using Microtops II portable sun-photometers at certain sites in Ukraine from time to time (Odessa, Rivne, Chornobyl Exclusion zone) and during trip campaigns such as in June 19–20, 2009 through the central region of Ukraine (Kremenchuck, Dnipro, Zhovti Vody, Kirovohrad, which was recently renamed to Kropyvnytskyi) and through the east region (Donetsk, Mariupol, Zaporizhia, Yevpatoriya) or along Kyiv–Odessa road in 2009–2012 (Milinevsky et al., 2012; Bovchaliuk V. et al., 2013). The measurements at Kyiv site provides the most complete study on aerosol properties over continental part of Ukraine because of the longest set of data, and most detailed results of the Kyiv site data analysis is presented in the review.
Kyiv AERONET Site Description and Conditions of Observations
The Kyiv AERONET site is located on the roof of the building of Main Astronomical Observatory of the National Academy of Science of Ukraine, at Golosiiv forest, 10 km southward of the city center. The site is equipped with the CIMEL CE-318 sun-photometer in different modifications. In Table 1 the different models of the CIMEL sun-photometers used at Kyiv site during the period of measurements are listed.
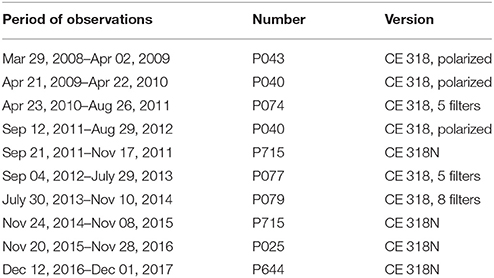
Table 1. List of sun-photometers which used for aerosol measurements at the Kyiv AERONET site.
The data of measurements are sent via the Internet to the AERONET database twice a day, processed and displayed on the Kyiv AERONET web-page on the same day, including various aerosol optical properties. The landscape around the Kyiv site allows perform the celestial hemisphere scans by sun-photometer and the location ensures good conditions for measurements. The weather condition allows direct Sun measurements during each month of each year, but warm part of the year is the most favorable period for observations.
In the period of 2008–2016 the measurements were performed on the average during 83–87% of days in June and July, 79–77% in May and August, 50–60% days in March, April, September, and October. The worst weather conditions are during the cold period—only 15–17% of observation days in December and January and 22–24% in November and February.
AOD and Ångström Exponent Data Analysis for the Kyiv AERONET Site
The most representative data on aerosols pollution from AERONET optical remote sensing technique are AOD at 440 nm because (1) all types of aerosol particles efficiently scatter solar light at this wavelength and (2) each model of sun-photometers has this spectral channel.
Analysis of AOD (440 nm) Level 2.0 data measured at Kyiv AERONET site over all time of observations showed that the most probable values are in interval 0.05–0.30 for each year, which is 70% during 2008–2014 (except 2010 when it was 63% only owing to intensive wildfire influences in the Summer), 77% in 2012 and 80–83% during 2013–2014.
The value of AOD (440 nm) = 0.3 corresponds to atmosphere transparency decreasing at this wavelength to 75%. It means that in most of the cases the aerosols diminished the atmosphere transparency over Kyiv during 2008–2014 approximately to 75%. But sometimes the special events occur like in summer 2010, when the higher AOD (440 nm) about 1.5 over all time of measurements was observed on August 15, 2010 that caused by the influence of intensive wildfire over west regions of Russia and the southeast of Ukraine (Galytska et al., 2018).
Analysis of other sets of AOD (440 nm) measurements performed at temporal AERONET sites and with Microtops II portable sun-photometer, as it mentioned above, resulted in the conclusion that atmosphere contamination by aerosol over other regions of Ukraine do not differ significantly from one over Kyiv and Kyiv site data are representative for aerosols amount and properties for Ukraine continental part.
Comparison of yearly averaged AOD (440 nm) over Kyiv site and some other sites in the world shows that aerosols amount and optical properties over Kyiv are very similar to ones over AERONET sites located in neighboring countries (Minsk, Moldova, Moscow sites) and in Europe (Munich site) but aerosols amount over Kyiv site are approximately three times as much as at Canberra site (Australian coastal zone) and approximately ten times as much as at Mauna Loa oceanic site, but are approximately three or four times less than at China's sites Beijing and Taihu (Figure 3).
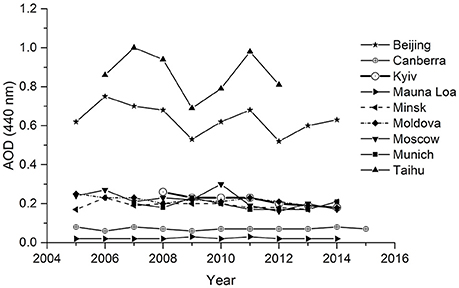
Figure 3. Comparison of aerosol amount by AERONET measurements over various sites over the world.
Also, there is a tendency to decrease AOD over Kyiv during 2008–2015 (see Figure 4): yearly averaged AOD (440 nm) decreasing to 0.09 from 2008 to 2015, but there is the increase in 2016. As Ångström exponent did not change significantly at least from 2010 to 2014, it can be concluded that AOD decreased without changing the particles optical properties. This means that aerosol particles amount diminished in the atmosphere over Kyiv at that time, which could be the effect of industrial activity decreasing in Ukraine.
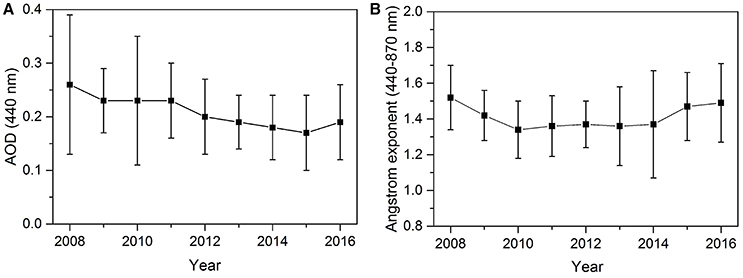
Figure 4. Yearly averaged (A) AOD (440 nm) and (B) Ångström exponent (440–870 nm) at Kyiv site, data level 2.0.
Following seasonal changes of the particles amount and properties in the atmosphere over Kyiv were found: AOD maximums are observed in the spring (mainly in April) and in the late summer (mainly in August), see Figure 5A. Ångström exponent also has the largest value in the spring (April) and in the summer (July–August) (Figure 5B). The Ångström exponent seasonal variations suggest that in the aerosol particles amount increasing prevail fine mode particles over coarse mode. More seasonal properties of aerosols over Ukraine can be found in the subsequent section of the review and in Milinevsky et al. (2014).
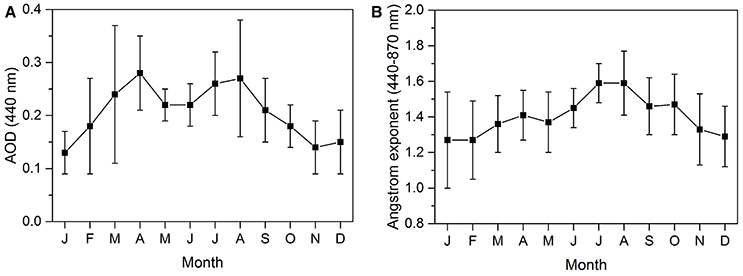
Figure 5. Seasonal changes (A) of the AOD and (B) Ångström exponent over Kyiv site. Data level 2.0 averaged over 2008–2016.
Kyiv and Kyiv-AO Sites Data Comparison
To estimate spatial nonuniformity of the aerosol layer over Kyiv, the simultaneous measurements at the Kyiv and Kyiv-AO AERONET sites have been performed during Summer–Autumn 2012. Temporary Kyiv-AO AERONET site is located at the Astronomical Observatory of the Taras Shevchenko National University of Kyiv in the center of the city, approximately 10 km northward from permanent Kyiv AERONET site.
Comparisons of Level 2.0 daily averaged AOD (440 nm) and Ångström exponent at 440–870 nm revealed discrepancies of these parameters at several days between observational sites exceeding the measurements uncertainties which are approximately ± 0.02 for AOD and ± 0.2 for Ångström exponent (Figure 6). The analysis in details has to be applied to data of each those days to reveal causes of the discrepancies. As possible sources of discrepancy, the real differences between optical aerosol particles properties over these sites can be considered. Specifically, in some cases, the Ångström exponent at Kyiv site exceeds ones at Kyiv-AO site, which suggests the fine-mode particles prevail over Kyiv site at these days. The differences between particles optical properties as well as their amount in the atmosphere over the big city can be nonuniform on the scales of several kilometers and hours due to the variability of the particles sources.
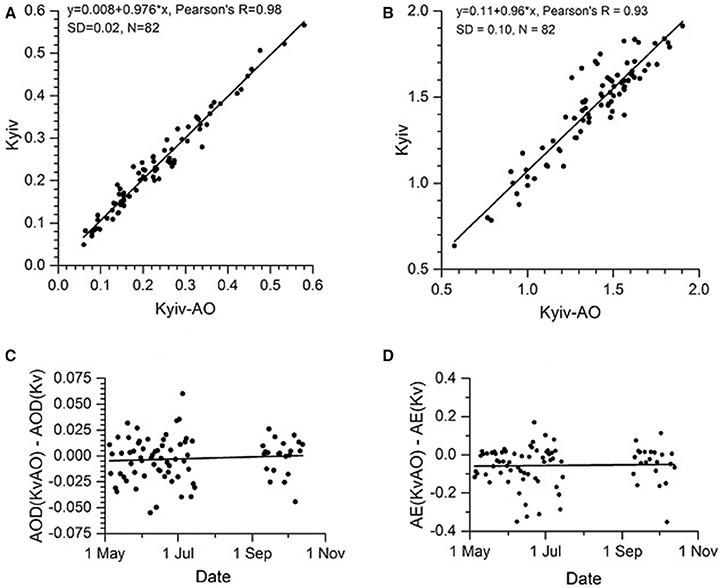
Figure 6. Comparison (A) of the AOD (440 nm), and (B) Ångström exponent (440–870 nm) for Golosiiv forest (Kyiv AERONET site) and center of the city (Kyiv-AO AERONET site). The difference (C) of AODs and the difference (D) of Ångström exponents between Kyiv-AO and Kyiv sites, correspondingly.
To eliminate the sun-photometer properties influences on the results, the simultaneous intercalibration measurements by both instruments were performed at Kyiv site during September 10–13, 2012. The daily AOD (440 nm) differences not exceeded 0.01 and Ångström exponent daily differences not exceeded 0.1 at low values of AOD (Table 2).
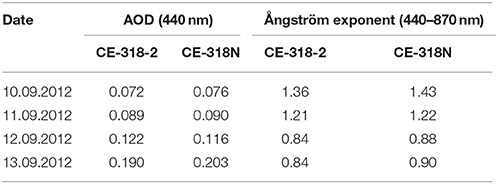
Table 2. Results of Kyiv and Kyiv-AO sun-photometers comparison.
AERONET Sun-Photometer Measurements in the East of Ukraine
Two AERONET sites were established in the east region of Ukraine. The site at Lugansk was located in the city and operated during November 2011–August 2013. The permanent Martova AERONET site is operating from December 2011 and measurements are ongoing. The Martova site located at the Low-Frequency Observatory of the Radio Astronomy Institute of National Academy of Sciences of Ukraine at Martove village situated in the rural environment approximately in 70 km eastward from Kharkiv city.
According to the measurements at the Lugansk site, the most probable Level 2.0 values are AOD (440 nm) 0.1–0.3; Ångström exponent (440–870 nm) 1.3–1.7; the effective radius of the aerosol particles Reff is 0.2–0.3 μm. Measurements at the Martova site have been started from December 11, 2013. The most probable Level 2.0 values over the period 2013–2014 were: AOD (440 nm) 0.1–0.2, Ångström exponent 1.4–1.8, Reff is in 0.2–0.3 μm range. It follows from these data that the content and main properties of the aerosol particles in the eastern part of Ukraine are more or less uniform and practically are similar to measured at the Kyiv site, especially if results are compared with other parts of the world (see Figure 3).
Aerosol Optical Properties From Microtops II Measurements in Several Regions of Ukraine
The spectral AOD at 340–1020 nm spectral range were measured with a portable Microtops II sun-photometer in some other regions of Ukraine and the Ångström exponent values have also been determined from the observations (Bovchaliuk V. et al., 2013). The measurements in Kyiv city regions were also carried out during the four-year period. The Microtops II data simultaneous measurements with CIMEL sun-photometer at Kyiv AERONET site were performed regularly for data validation. The observations with Microtops II sun-photometer gave the opportunity to estimate aerosol pollution of the atmosphere over different regions of Ukraine.
Measurements with Microtops II photometer were carried out in June 2009 during the trip along the road from Kyiv to Dnipro (Central Ukraine). The AOD (675 nm) changed from 0.1 to 0.16, and the Ångström exponent (675–870 nm) of 1.3–1.7 was calculated from those observations. Other transect measurements were made during the trip through the East and South of Ukraine on August 16–21, 2011. Large AOD (440 nm), approximately equal to 0.5–0.7, was observed in Lugansk at that time. On the contrary, in Zaporizhia, and in Kryviy Rih the AOD (440 nm) was less than 0.2. However, these small AOD were observed after rainfall and thunderstorm, and do not represent the average aerosol load in this region. The Ångström exponent was also decreased from 1.7 to 1.3 those days, which corresponded to the reduction of fine-mode aerosol particles as a result of the rain (Bovchaliuk V. et al., 2013).
Three field campaigns of observation have been provided in the Chornobyl Exclusion Zone region in the spring–summer season of 2011–2012 (Bovchaliuk V. et al., 2013). Upon the average AOD and Ångström exponent were similar in all periods of spring observations: AOD (440 nm) was equal approximately to 0.18–0.20 and Ångström exponent (440–870 nm) was 1.55–1.92. AOD slightly decreased at all wavelengths, while the Ångström exponent increased at the end of June.
Observations in Rivne city (the western part of Ukraine) during two summers and one autumn short periods in 2011–2012 found the AOD (440 nm) values approximately equal to 0.21–0.30, and Ångström exponent (440–870 nm) was approximately 1.48–1.63. AOD and Ångström exponent values were larger in summer period than in autumn.
Several observational campaigns were performed in Odessa city from July 2009 to August 2011 with different models of Microtops II sun-photometer, see Table 3. The highest AODs were observed in August 2010. It corresponds to the special event of the atmosphere pollution over most of the Ukraine territory from intensive wildfires in Russia (Galytska et al., 2018). Rest of the data has shown relatively low aerosol pollution of the atmosphere over Odessa. Approximately the same spectral AODs were observed in Odessa during earlier observational periods 1972–1984, see Figure 2B.
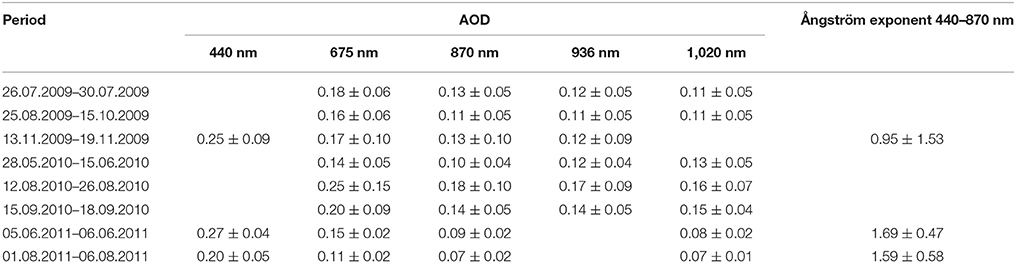
Table 3. Aerosol characteristics in the atmosphere over Odessa.
The interesting result was obtained during the trip from Odessa to Kyiv on November 21, 2009. The AOD value was relatively low in Odessa in the morning, when AOD (440 nm) was approximately 0.17, and Ångström exponent was high (approximately 1.5). AOD decreased slowly with driving away from Odessa and after minimum near Uman' town with values AOD (440 nm) 0.12, then it grew significantly in the approach of Kyiv city up to AOD (440 nm) 0.32. At the same time Ångström exponent was approximately the same from Odessa to Uman' and then decreased significantly (became less than 0.32) with the approach of Kyiv city (Bovchaliuk V. et al., 2013). These measurements have shown relatively uniform aerosol pollution of the atmosphere over Ukraine, and Ångström exponent values close to 1.5–1.6 suggested the dominance of fine-mode particles.
Aerosol Radiative Forcing Analysis by Kyiv AERONET Site Data
Direct radiative forcing caused by aerosols (ARF) depends on AOD and other aerosol optical parameters. Aerosol contamination over Kyiv site in average is small in comparison to the sites where AOD is much higher, for example, over the China sites, and is approximately the same as over other sites located in neighboring countries and in other European countries (see Figure 3). Retrieved from AERONET website yearly mean ARF values are negative for each year from 2008 to 2014. However, ARF averaged for each month over all years is positive during December–March that probably caused by bright surface reflection by snow at the Kyiv site (see Derimian et al., 2016). Yearly ARF value at Kyiv site vary from −10 W/m2 in 2008 and 2014, to −3 W/m2 in 2011, and the seasonal variation range is approximately from −15 W/m2 in August to + 15 W/m2 in February.
The ARF value determined from AERONET website by observations at Kyiv site suggests that aerosols over Kyiv and Ukraine mainly contribute to the cooling of the atmosphere, though during a year the contributions vary from positive in snowing winter months to negative in the rest of a year. Therefore, aerosols contribute to reduce the difference of the weather conditions between cold and warm parts of a year in Ukraine.
To estimate regional radiative forcing in Kyiv area we apply also the model GAME (Global Atmospheric ModEl) that allows including aerosol altitude distribution measured by lidar (Dubuisson et al., 2006; Garcia et al., 2012; Derimian et al., 2016). Lidar aerosol altitude profiles in Kyiv have been measured in the campaign in 2015 (see next Section). Using the case with atmosphere that most contaminated by aerosols when AOD is 0.8 and real lidar aerosol height distribution, the radiative forcing by the GAME model is −62 W/m2. In the case when AOD = 0.3, by GAME model ARF = −26 W/m2, which corresponds to ARF values determined from AERONET data.
Lidar Aerosol Measurements
Ground-based radiometric measurements are providing high-quality data on aerosol optical parameters in the atmosphere column (Holben et al., 1998; Kim et al., 2011). However, altitude aerosol profile is also important for modeling of aerosol transfer and radiative forcing estimation (ex. Garcia et al., 2008). Lidar aerosol measurements are the most suitable tool to retrieve the aerosol altitude profiles. To increase the efficiency of the measurements, data processing methods, and spatial coverage by lidar observations, the network of similar lidar instruments are created. In East European region lidar networks are EARLINET (European Aerosol Research Lidar Network, www.earlinet.org) and CIS-LiNet (Atmosphere aerosol and ozone monitoring in CIS regions through lidar stations network, (www.cis-linet.basnet.by). The East European region includes 5 lidar stations operated in Minsk, Warsaw, Belsk, Bucharest, and Moscow. However, in the vast area of those regions—Ukraine territory—lidar measurements have not been provided until 2015.
The first lidar observations of aerosol in Ukraine have been carrierd out in 2015 (Yatskiv and Milinevsky, 2015; Bovchaliuk et al., 2017). The single-wave mini-lidar CIMEL CE370-2 (http://www.cimel.fr/) has been borrowed by the Laboratory Atmosphere Optics (LOA) of University Lille1 for joint collaboration aerosol study in Ukraine. The CIMEL CAML (Cloud and Aerosol Micro-Lidar) CE370-2 lidar is a monochromatic eye-safe and weatherproof instrument, which allows continuous measurements of aerosol spatial distribution on detection range 15–24 km (day-night). The CAML CE370-2 laser is the frequency doubled Nd:YAG at 532 nm wavelength with the pulse energy about 20 μJ, width <15 ns and rate 5 kHz (http://www.cimel.fr/). The CE370-2 lidar obtains data on the extinction and backscatter coefficients which are processed together with time series of AOD and Ångström exponent values measured by the AERONET sun-photometer.
The lidar measurements campaign in Ukraine has been performed from the mid-August until the end of September 2015. Using these data the altitudes and thickness of aerosol layers, dynamics and height aerosol distribution in that region were calculated. The event of strong smoke at the beginning of September has been investigated in details by lidar and sun-photometer measurements (Bovchaliuk et al., 2017).
The simultaneous observations were provided by the AERONET Kyiv site sun-photometer and lidar located at the same place. The analysis of specific optical and microphysical aerosol properties and their altitudinal distribution in the atmosphere over Kyiv city suburb has been made using lidar and sun-photometer observations (Bovchaliuk et al., 2017).
MODIS maps of detected wildfires and back-trajectory analysis have been used for air mass investigation over the Kyiv for the lidar observation campaign period. It was shown that the air masses arrived in Kyiv mostly from the north-west and the western parts of Ukraine in the period of the lidar measurements. On September 1–2, 2015, before the event of the strong smoke intrusion, the typical atmosphere with small aerosol content was measured at the Kyiv AERONET site. The significant increase of aerosols pollution of the atmosphere started in the evening of September 2. It was recognized by using back trajectory calculations and MODIS data (http://modis.gsfc.nasa.gov/) that the forest fire smoke was transported to Kyiv area by air mass from north-west regions of Ukraine. Measured mean values of AOD (440 nm) increased during the event from 0.1 to 0.4–0.8 and Ångström exponent at 440–870 nm changed from 1.6 to 1.8 indicating the redistribution of particle size to fine mode aerosols. The example of rapid arrival of the smoke cloud, as a product of biomass burning, over lidar at Kyiv site in September 2, 18:20UT is shown in Figure 7.
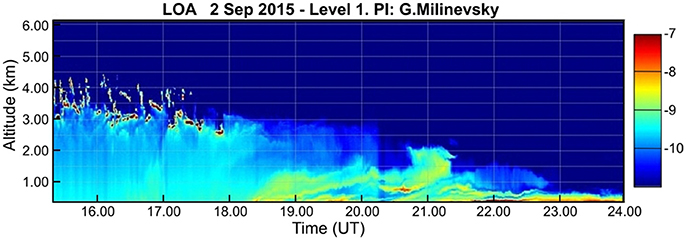
Figure 7. Corrected by altitude lidar signal in logarithmic scale shows arrival in the area at 18:20UT of the strong aerosol smoke altitude distribution and dynamics over Kyiv AERONET site by lidar measurements.
Newly developed GARRLiC (Generalized Aerosol Retrieval from Radiometer and LiDAR Combined Data) algorithm has been used for data analysis (Lopatin et al., 2013; Bovchaliuk et al., 2016). The lidar data have been corrected for the incomplete overlap effect using the overlap function. The overlap is reached 50% at altitude 1,440 m and 80% at altitude 2,960 m. We also measure the afterpulse signal and apply this correction saving the afterpulse profile. The background noise and range correction have been applied as the regular lidar quality check. More about the lidar quality check and data processing methods used to develop the measurements during the Kyiv lidar campaign can be found in Bovchaliuk et al. (2016, 2017).
Six cases of coincident lidar and sun/sky-photometer have been processed for the period of lidar campaign (Bovchaliuk et al., 2017). The some examples of retrieved aerosol optical and microphysical properties for September 3 are presented in Figure 8. Biomass burning aerosol includes mostly two components: black carbon (BC), and organic carbon (OC). The first, BC, mostly absorbs solar radiation, while OC mainly scatters solar radiation. Both have a strong fine mode fraction (see Figure 8A). Particles of OC are generated during decaying vegetation, bacterial growth and other natural processes and BC are mainly formed from fossil fuels and other burning processes. Black carbon originated as long non-spherical sequences, which crashed and joined to other organic matters that coated collapsed BC sequences. Hence, particle properties of both OC and BC are strongly varied depending on the burning process or the processes during the transport (hygroscopic growth, coagulation or photochemical mechanisms, etc.). Consequently, aerosol particles which have been transported to Kyiv have modified particle properties depending on the processes during the transport. According to Dubovik et al. (2002) main optical properties of biomass burning particles varies from place to place. The lidar ratio (LR) of less absorbing urban aerosol particles varies in rage 35–70 sr, while LR of biomass burning particles has higher values 70–100 sr at 532 nm wavelength (Ansmann and Muller, 2005).
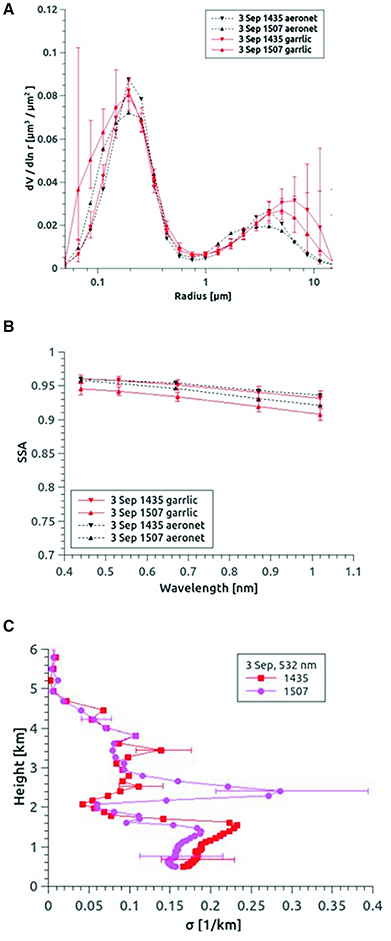
Figure 8. Aerosol parameters from lidar and sun-photometer data of September 3: (A) size distribution, (B) single scattering albedo, (C) extinction profile. Lidar ratio at 532 nm wavelength of each retrieved case.
Size distribution indicated the increase of fine mode particles during the investigated event in Kyiv. Retrieved SSA during the event in comparison to the day before has lower spectral dependence, but all SSA retrieved on 1–3 September have high values which are varying from 0.96 to 0.88. Refractive index (RI) real part and RI imaginary part retrieved by the GARRLiC algorithm are equal 1.45 and 0.007 respectively. Lidar ratio for that aerosol at 532 nm wavelength varies from 62 to 72 sr (Bovchaliuk et al., 2017). In general, retrieved aerosol optical and microphysical properties indicate on the mixture of urban and biomass burning particle presence over the Kyiv city during the period of 1–3 September 2015.
The short lidar campaign of 2015 in Ukraine shows significant advantages for study aerosol properties and dynamics. Simultaneous lidar and AERONET sun-photometer observation results make it clear the need to install at least one lidar station in Ukraine and join to EARLINET network.
Analysis of Aerosol Distribution in the Atmosphere Using Satellite Data
The satellite observation allows studying the atmosphere pollution over the large territory. Since a number of the AERONET sites over vast Ukraine territory is a few, it is very important to use satellite data to study aerosols in that region. Data of the POLDER satellite instrument have been used to analyze the aerosols properties in the atmosphere over Ukraine and adjacent regions through the period of 2003–2011 in Bovchaliuk A. et al. (2013). The POLDER instrument had measured intensity and polarization of the solar radiance scattered by the surface and terrestrial atmosphere, and the inversion algorithm (Deuzé et al., 2001) retrieved at that time AOD simulating the particles with log-normal size distribution, effective radius from 0.075 to 0.225 μm and refractive index m = 1.47–0.01i. These properties correspond to the fine mode aerosols produced mainly by biomass burning and other anthropogenic sources (Dubovik et al., 2002). The inversion algorithm determined AOD at 865 nm and 670 nm with spatial resolution 6 × 6 km, and aerosol parameters were estimated with resolution 3 × 3 pixels, i.e., approximately 18 × 18 km over cloud-free regions. The Ångström exponent values are calculated for spectral range 670 to 865 nm using POLDER data.
The AOD (865 nm) monthly averaged values retrieved for April-May, and August-September month in 2003–2011, have been used for analysis in Bovchaliuk A. et al. (2013). Previously the comparison of the POLDER AOD (865 nm) and AERONET sites AOD (870 nm) has been performed using a methodology similar to described in Su et al. (2010). The sites which have been used for comparison were Sevastopol, Moldova, Kyiv, Belsk, Minsk, and Moscow. The AOD (870 nm) have been computed for data Level 2.0 correspond to fine mode particles with size < 0.3 μm. The AODs measured within ± 30 min of the satellite overpass times were selected due to the condition that AOD variation did not exceed 25% of the daily mean. Also, zero POLDER AOD values were excluded from analysis. The correlation coefficient between POLDER and AERONET AOD value varies from 0.63 (Sevastopol) to 0.93 (Kyiv) with the standard deviation of the points less than 0.02 for AOD between 0.01 and 0.25.
The AOD (865 nm) usually ranged from 0.05 to 0.20 over investigated territories in the summertime during 2003–2011, except 2004 when observations were not fulfilled. The increased AOD (865 nm) observed in April–May, and in August–September, which agreed with AERONET data at least over Ukraine, Moldova and the south of Russia (Bovchaliuk A. et al., 2013). The AOD (865 nm) values were larger over the central Ukraine, Belarus, Moldova, and over Moscow region of Russia, than over other studied regions, but this values decreased progressively since 2008. The AOD (865 nm) values increased up to 0.2–0.5 was observed in August 2010 (Figure 9) over entire investigated region due to the intensive wildfires in July–August of 2010 and fire products transboundary transport (Konovalov et al., 2011; Witte et al., 2011; Chubarova et al., 2012; Galytska et al., 2018).
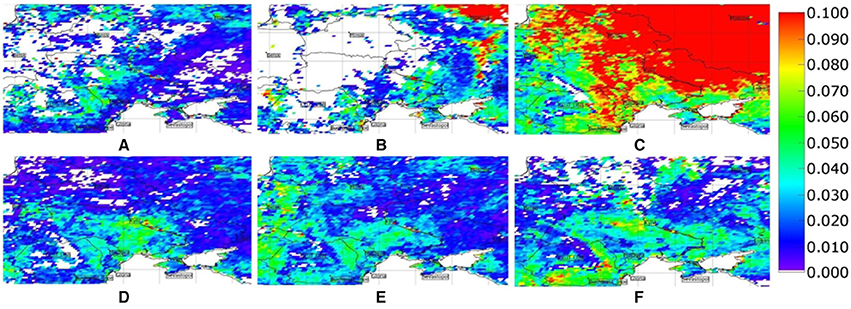
Figure 9. Maps of monthly mean aerosol AOD at 865 nm retrieved for the investigated area from measurements of POLDER/PARASOL for April, July, and August in 2010 (A–C) and in 2011 (D–F). Note the intensive wildfire aerosol products from Moscow region started in July 2010 and rapidly increased in August 2010. Data credit: CNES/LOA/ICARE.
Seasonal Variability of Aerosol Properties in Ukraine
The seasonal aerosol variations over Ukraine regions were considered in Milinevsky et al. (2014) on the base of AERONET and POLDER measurements. In this review we also extended the consideration of seasonal features over Ukraine by using recent available data at AERONET database shown in Figures 10, 12. The POLDER data have been used to retrieve the aerosol seasonality over the several Ukraine cities where the aerosol load is comparably large (Dnipro, Donetsk, Kharkiv, Kyiv, Lugansk) and small (Lviv, Rivne). For comparison, seasonal peculiarities in Ukraine and Belarus from the data for Minsk AERONET site, as well as POLDER overpass, were analyzed. Some seasonal features of aerosol AOD can be extracted from the results of the Sevastopol AERONET site observations in Yakovleva and Tolkachenko (2008).
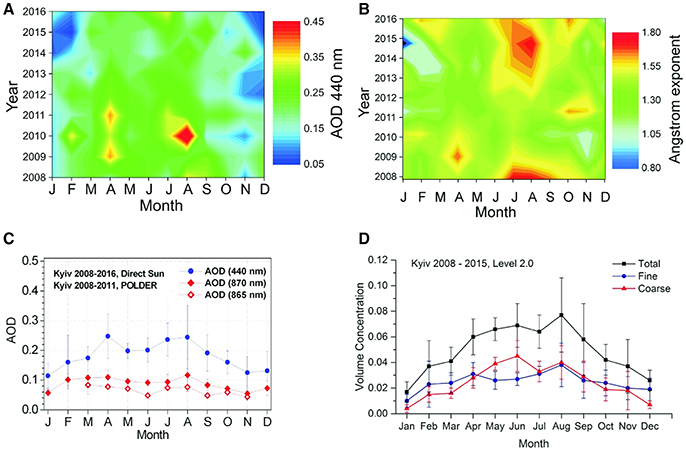
Figure 10. (A) The seasonal variations of AOD (440 nm), and (B) Ångström exponent (440–870 nm) in the atmosphere over the Kyiv site during 2008–2016 period. (C) The averaged over 2008-2016 AERONET AOD (440 nm and 870 nm) and POLDER AOD (865 nm) seasonal behavior over the Kyiv site. (D) Aerosol volume concentration separated to total values, fine- and coarse-mode values at the Kyiv AERONET site. Monthly mean standard deviations from averaged values are shown by vertical bars. Capital letters on X-axes are the first letters of January–December month.
Monthly mean values of AOD at 440 and 870 nm, Ångström exponent (AE) at 440–675 nm and 440–870 nm wavelengths were retrieved from data of the Kyiv AERONET site. The other aerosol parameters as volume concentration, size distribution, refractive index RI (real and imaginary part), both absorption and extinction AODs, the single scattering albedo SSA have been extracted from AERONET database and used for analysis of aerosol variations over the Kyiv site. The POLDER monthly averaged AOD (865 nm) and the AE (670–865 nm) were analyzed over the Kyiv site. The AERONET and POLDER measurements were collated and comparison shows that the POLDER AOD (865 nm) values are regularly under AERONET AOD (870 nm), see Figure 10C. Authors Milinevsky et al. (2014) explained that difference by the diverse range of particles size that included in AOD evaluation in AERONET and POLDER algorithms, where POLDER values consider mainly fine-mode particles while AERONET AOD retrieval includes fine mode and coarse mode aerosols. Interesting that seasonal behavior of AOD and volume concentration (Vol-Con) values is different. When the AOD (440 nm) variation shows the clear double peak, the one maximum in total Vol-Con data is seen only in August (Figure 10D). The two maxima in Vol-Con are noticed in fine-mode Vol-Con only, but not in coarse mode. Authors of Milinevsky et al. (2014) interpret two peaks in AOD by the influence of fine-mode particles in spring on AOD formation.
The difference in aerosol characteristics variations is seen also in the western and central Ukraine areas. In the spring AOD reached maximum earlier in the west part of Ukraine and the same in the summer. The comparison of that type of aerosol variation with results of other authors, studied East European aerosols (Lund Myhre et al., 2007; Pietruczuk and Chaikovsky, 2012; Sayer et al., 2012), shows good agreement in seasonal variations. The investigations make it clear that biomass burning is the main process, which responsible for the spring AOD maximum (Figure 10). In general, the average aerosol characteristics show maxima in April–May and in August. The minimum AOD values are noticed in December–January according to AERONET and POLDER data (Figure 11).
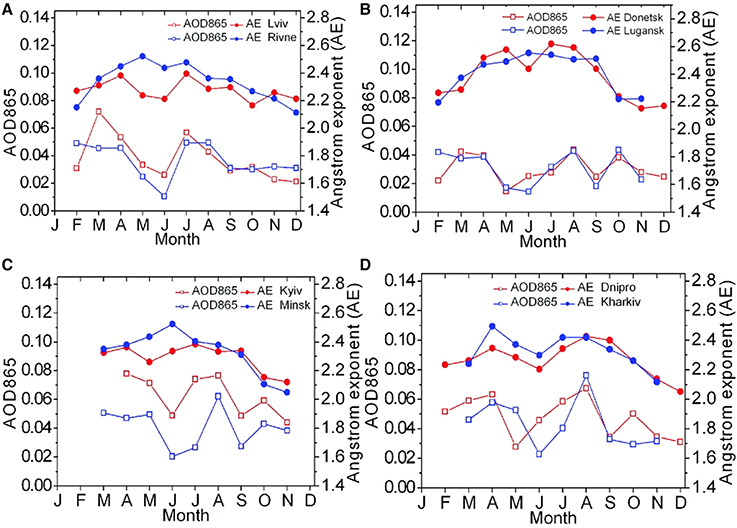
Figure 11. AOD (865 nm) and Ångström exponent AE (670–865 nm) seasonal variations. The values are averaged over 2008–2011 for cities: Kyiv, Minsk, Donetsk, Lugansk, Dnipro, Kharkiv, Lviv, and Rivne areas on the base of POLDER data. The figure is modified after (Milinevsky et al., 2014).
In the paper (Milinevsky et al., 2014) the seasonal aerosol variations in Ukraine and Belarus have been compared. The comparison results in the larger aerosol load in Ukraine than in Belarus in the summer month and in the autumn (August). However, the fine-mode aerosol amount in the atmosphere over the Minsk site exceeds that over the Kyiv site throughout the year.
The aerosol microphysics seasonal variation was investigated using the SSA and RI AERONET parameters with analyzed period 2008–2017. To increase the number of available observations we use Level 1.5 data. It was shown in Milinevsky et al. (2014), the features of Level 2.0 data are very similar to Level 1.5 data. However, Level 1.5 data allow comparing the SSA and RI values in cold and warm period, while sufficient Level 2.0 data exist for the warm period only. The monthly mean SSA and RI imaginary part is divided into two groups: in warm (April–October) and cold (November–March) month (see Figures 12A,C). In the warm period imaginary RI is lower which correspond to less absorbing particles, but in cold period imaginary RI is larger (Figure 12C) which could explain increasing of carbon aerosols amount due to coal burning for heating in winter. In general, the microphysical aerosol property behavior corresponds to mixture biomass burning (in spring and especially in early autumn), dust and urban-industrial aerosols according to classification in Dubovik et al. (2002); Giles et al. (2012); Penning de Vries et al. (2015). Interesting that coarse-mode aerosol amount in warm period is twice larger than in cold period, which authors (Milinevsky et al., 2014) explained by appearance steppe dust in the atmosphere over Ukraine from the south and south-east of Ukraine region where dust storms in summer time observed frequently. In the cold period, these regions are covered by snow, which protects from the dust storm. On the base of observations in Yakovleva and Tolkachenko (2008), the aerosol seasonality at this maritime AERONET Sevastopol site follows, in general, the usual two maxima pattern. The monthly mean AOD (500 nm) value is highest in August, however, the spring maximum is not so clear and smoothed during April–June. We have to note that this result obtained from 17th-month observation in 2006–2007.
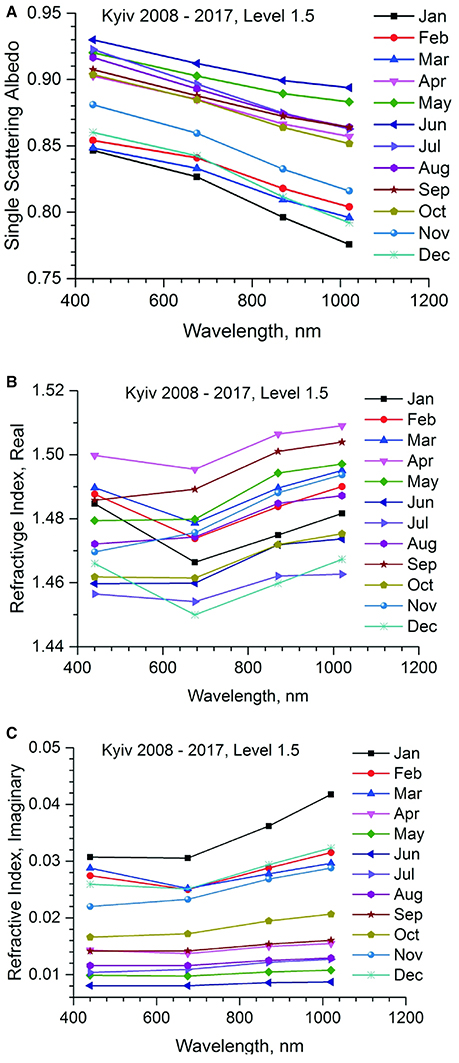
Figure 12. Seasonal variations of (A) single-scattering albedo, and (B,C) refractive index spectral dependences according to data from the Kyiv AERONET site.
The scatter plots for some aerosol characteristics and relations on the example of Kyiv site measurements have been studied in order to estimate the aerosol types. The general scatter plots pattern corresponds to aerosol classification from Yoon et al. (2012), where during winter the coarse mode (steppe dust) particles amount is much smaller than urban (car traffic) or industrial aerosol which is mostly fine-mode particles. According to scatter plots in Milinevsky et al. (2014) the urban-industrial aerosol is mostly measured in spring month including some aerosol biomass burning from wildfires and dust over the central part of Ukraine. During summer urban and industrial aerosols are prevailing along with combustion of biomass products, which are mostly fine-mode particles. The small AOD values in autumn/winter and large ones in spring/summer are corresponding to scatter plot data. The eastern countries of Europe are additional sources of industrial aerosols by air mass transport due to stable western winds in the spring and summer and according back-trajectory analysis.
The Saharan dust over the central part of Ukraine (AERONET Kyiv site observations) can appear as the secondary transport by air mass from the Mediterranean. The SSA and RI spectral aerosol parameters corresponded to the dust type particles could serve as the indirect confirmation of Saharan dust transport to that distance (Kim et al., 2011; Pavese et al., 2012). Consider the results of Israelevich et al. (2012) the Saharan dust can be seen in the atmosphere over central Ukraine in the spring (April) and late summer/autumn (August–September).
As the result of (Milinevsky et al., 2014) analysis and of the extended consideration by recent data in this review, the increasing aerosol concentration in the atmosphere over Ukraine in the spring and autumn is explained mostly by natural and agricultural fires, however these spikes are faded by other pollution sources like cars exhaust (Kyiv), industry and mining (Donetsk, Dnipro, Kharkiv). The air mass transportation of aerosol from remote areas (ex. from Moscow region in 2010 or steppe dust storm in 2007) also influenced on increasing of aerosol concentration (Birmili et al., 2008; Chubarova et al., 2012), which clear seen on the Ångström exponent (440–870 nm) vs. AOD (440 nm) scatter plot in Milinevsky et al. (2014).
Aerosol Sources in the Ukraine Region by Back-Trajectory Statistics and GEOS-Chem Modeling
One of an important goal of aerosols study is the determination of sources polluting the atmosphere with aerosols. It is important to estimate the contribution of aerosols from different sources to the total aerosol content over the observational site. The ground-based measurements with sun-photometers and satellite POLDER instrument data analysis showed relatively low pollution of the atmosphere over Ukraine by aerosols during the time of study excepting special events which occur from time to time (see above). We assume that the events of increased aerosol content over certain places specifically over Kyiv AERONET site are causing from distant aerosol sources. Therefore, we tried to study the paths of air mass over the territory of Ukraine and especially over Kyiv and to determine the localization of main areas contributing to the aerosol content here (Kabashnikov et al., 2014). The main technique to study of aerosol particles transport with air mass is global chemical transport models, for example, GEOS-Chem (Goddard Earth Observing System-Chemistry model; Bey et al., 2001), which are used widely to find the sources of aerosol loading to the atmosphere. As the alternative technique, the trajectory statistics method and the cluster analysis of the back trajectories can be used to determine the prevailing direction of particles transport over investigated territories and aerosol sources localization (Dorling et al., 1992; Schoeberl and Newman, 1995; Stohl, 1996, 1998; Kabashnikov et al., 2011).
The cluster analysis of the back trajectories (Dorling et al., 1992) was used to determine the prevailing direction of particles transport over investigated territories (see Figure 1) and aerosol sources localization (Kabashnikov et al., 2014). The method of trajectory statistics known as a concentration-weighted trajectory (CWT) method based on joint statistical analysis of aerosol column volume concentrations and back-trajectory data (Hsu et al., 2003) was used. To reveal the aerosol source in the region under study, three-dimensional back-trajectories were extracted from the AERONET website for AERONET sites Belsk, Moldova, Minsk, and Sevastopol. The back-trajectories for the Kyiv site were calculated with meteorological data supplied by Republican Hydrometeorological Center of the Republic Belarus (www.hmc.by). All trajectories were computed for arrival times at 00 and 12 h GMT and for eight pressure levels between 950 and 200 hPa. For each part of the area around the monitoring site, the volume mean aerosol concentration was calculated. Concerning Kyiv site it was found, the aerosol sources responsible for increasing of the coarse-mode aerosol volume concentration are located to the southeast from the Kyiv. The largest part of coarse-mode aerosols is transported to Kyiv from the direction of the Krasnodar region of Russia Federation (RF). Much smaller but significant part of coarse-mode particles arrives at the Kyiv site from the Stavropol region (RF), the Black Sea and from Balkans region (Serbia). The fine-mode aerosols concentrations increasing over the Kyiv site are caused mainly by the air mass from the east direction, namely from Voronezh and Orel (RF) and Kharkov cities, and from the south direction (Stavropol, RF). The main sources that produced the increased aerosols content over other sites were determined as well (see Kabashnikov et al., 2014). The summary is that the events of increased coarse-mode aerosol concentration at these sites have been caused by sources at regions around Donetsk, Rostov-on-Don, and Kharkiv cities, the fine-mode aerosols originated from areas of Tambov, Voronezh, and Kharkiv cities.
The potential influences of air mass transport on seasonal behavior of aerosols content at the Kyiv and Minsk AERONET sites has been considered in details by Milinevsky et al. (2014). The 3-D back-trajectories were computed at the height of 1.5 km (850 hPa) during the 48 h prior to observation. To determine the most probable directions of air mass transport and cluster analysis was applied to these sites. Five prevailing directions were determined for each of the sites during each season. For the Minsk site the most prevalent directions are northeast in winter (relative trajectory number is approximately 29% from all directions), northwest in the spring (28%), west in the summer (26%), and east in the autumn (36%). For the Kyiv site the most prevalent directions are north in winter (29%), west in spring and summer (30 and 24%, respectively), and south (39%) in autumn (Milinevsky et al., 2014).
The spatial-temporal distribution of specific aerosol types in the atmosphere over Ukraine and Belarus has been simulated by using the GEOS-Chem model (Miatselskaya et al., 2016). GEOS-Chem is a global 3-D chemical transport model (http://www.geos-chem.org/) which uses detailed inventories for fossil fuel, biomass burning, biofuel burning, biogenic, and aerosol emissions. The GEOS-Chem model computes the spatial-temporal distribution of atmospheric species concentrations, including major aerosol types such as sulfate, nitrate, ammonium, black carbon, organic aerosol, mineral dust, and sea salt. Simulation of monthly mean aerosol content and types ratio over the period 2010–2013 showed that mineral dust is the dominant in the atmosphere over the region, 75% in Ukraine and 60.1% in Belarus. Nitrates, sulfates, organic aerosol, and ammonia also constitute significant fractions in the region, but sea salt and inorganic carbon are minor components, 1.6, 0.8% and 1.0, 0.6% respectively. The spatial distribution of aerosol volume concentration (in μm3μm−2) for fine-mode and coarse-mode aerosols in the atmosphere over Belarus and Ukraine simulated by the GEOS-Chem model and averaged over the period 2010–2013 was studied in Miatselskaya et al. (2016). The fine-mode particles are distributed over the region more or less uniformly, due to their relatively long lifetime in the atmosphere. The coarse-mode aerosol particles concentration distributed less uniformly and located close to source areas due to the relatively short lifetime. The coarse-mode aerosol is mainly concentrated over southern and eastern regions of Ukraine, and over the Black Sea and nearby terrains (Miatselskaya et al., 2016). It is known, that steppe regions in the south-east of Ukraine often become a sources of mineral dust, up to 3 10−4 kg m−2, which transported by strong winds on the far distance (Birmili et al., 2008), particularly to Belarus (Miatselskaya et al., 2016). Sources of mineral dust are negligible in Belarus. Seasonal variations of coarse, fine, and total aerosol are partly retrieved by the model except for some strong aerosol events as during wildfires in summer 2010. Particularly, dust loading in the atmosphere over the investigated region is more significant in summer than in winter.
The AERONET inversion algorithm (Dubovik and King, 2000) calculates volume concentration of fine (with radius 0.05–0.60 μm) and coarse (with radius 0.60–15 μm) modes of aerosol particles and total particles volume concentration from observed spectral AOD. The results of the simulation were evaluated using data of observations at Kyiv and Minsk AERONET sites. In general, aerosol columnar volume concentrations simulated by the GEOS-Chem and determined from AERONET sun-photometer measurements coincide to an order of magnitude only. Important sources of discrepancy are uncertainties and irregularity of AERONET measurements.
Air Quality Evaluations by PM2.5/PM10 Measurements
Ukraine historically as well as recently is a major source of aerosol and POP pollution associated with industrial infrastructure and transport. Some Ukrainian cities can be considered as most air-polluted cities in Europe. The additional source of aerosol pollution including small particles PM2.5 is military activity in the East of Ukraine. Recently Ukraine was recognized as the most polluted country in Europe, although this opinion is based on data extrapolation obtained in the studies conducted by other countries. It is well known that European Environment Agency (EEA) operates by monitoring stations of PM2.5 in 15 countries with data submitted to the AirBase database (see http://acm.eionet.europa.eu/databases/airbase/). This database comprises data on air quality in European area which submitted by AirBase stations throughout the Europe. On the base of these data, the annual mean map of Particulate Matter (PM2.5) concentration in Europe is produced. Unfortunately, in Ukraine PM2.5 monitoring is currently not providing, therefore, Ukraine territory on these maps looks like the white area where no data on PM2.5. According to United States, Environmental Protection Agency (EPA, http://www.epa.gov) control standards has been applied to PM10 and PM2.5. Latter is a more respirable toxic particle size. The 24-h PM2.5 standard was reduced to 35 μg/m3 in 2006, and the PM10 annual values standard was lowered as well. Later, in 2012, the standard 12 μg/m3 was applied for annual value of PM2.5.
These figures serve for us as the target for comparison with Ukrainian PM2.5 data. According to Central Geophysical Observatory (CGO) of Ukraine, the measurements of the mean value an archaic regulatory measure total suspended particles (TSP) in the air of Ukrainian cities is equal to 120 μg/m3 with peak values reached 1,800 μg/m3 in 2016. For example, in Kyiv city daily mean TSP values vary from 100 to 200 μg/m3 (http://www.cgo.kiev.ua/). Therefore the establishment of PM measurements in Ukraine and, particularly, in Kyiv with the appropriate informing network will be the important step toward control of air pollution.
The first attempt to estimate particulate matter pollution in Ukraine atmosphere has been undertaken by comparison of POLDER/PARASOL measurements over Europe with AirBase PM2.5 data (Bovchaliuk, 2013). The results of analysis of the monthly averaged PM2.5 concentration throughout Europe by AirBase data in the 2005–2013 period (including Ukraine territory) presented in Bovchaliuk (2013). The relation between daily PM2.5 concentrations measured in-situ at AirBase network and the aerosol optical depth (AOD) retrieved from POLDER data has been derived. The PM2.5 vs. AOD regression relation was retrieved from observations in 2007 (Bovchaliuk, 2013). It was shown that PM2.5 concentration over 20 in-situ monitoring sites correlates with the POLDER AOD (865 nm) overpass values having correlation coefficient R = 0.62 with RMS = 3.26. Fron this correlation the PM2.5 values were calculated as PM2.5 = 73.4AOD 865 + 9.6. The significant offset in 9.6 μg/m3 Bovchaliuk (2013) explained by usage of monthly mean AOD threshold 0.01 for PM2.5 assessment. Therefore, by this method, the PM2.5 values larger than 10.3 μg/m3 can be retrieved only.
According to results of Bovchaliuk (2013), the monthly averaged PM2.5 concentrations in 2005–2013 period in the ground-level atmosphere over Europe were less than 12 μg/m3, however, values 12–18 μg/m3 were measured in the industrial regions, especially in Poland, Northern Italy, and Romania. Over Ukraine, the largest PM2.5 data (55 μg/m3) have been observed upon wildfires event in August 2010, which is classified by EEA as unhealthy for sensitive groups. Similar investigation on comparison ground-based PM2.5 measurements with PARASOL AOD data over China reported in Guo et al. (2016). Using the much larger interval of PM2.5 measurements (3–1,000 μg/m3) with mean value 56 μg/m3, authors Guo et al. (2016) retrieved correlation coefficient between PM2.5 and POLDER AOD data R = 0.57–0.64, which is close to R obtained by Bovchaliuk (2013).
For preliminary evaluations of PM2.5/PM10 mass concentration in Kiev and several other cities in Ukraine we use laser monitor SDL607 for measurements in the period 08.2016–08.2017. This instrument has been compared with the PM2.5/PM10 HORIBA Analyser by simultaneous PM measurements and shows reasonable agreement. The results of the PM2.5/PM10 amount evaluation in Kyiv, Kharkiv and Lviv cities shows that PM values during the cold period of a year are often higher than maximum permissible level according to EEA standards (25 μg/m3). Mean PM2.5 values in Kyiv city varies in different locations within 33–45 μg/m3, mean PM10 values are within 29–71 μg/m3. From the measurements in other cities of Ukraine in cold period, the PM2.5 values vary (min-max) in Lviv within 11–38 μg/m3, in Kharkiv within 10–120 μg/m3.
To determine most PM contaminated sites in Kyiv city the measurement transects were organized when PM monitor SDL607 has been installed on the roof of the car and provided continuous measurements along city roads. Two examples of these transects are shown in Figure 13, where spikes of PM contamination exceed background values in five times from 15–20 μg/m3 to 85–95 μg/m3 in crowdy roads and traffic jam places.
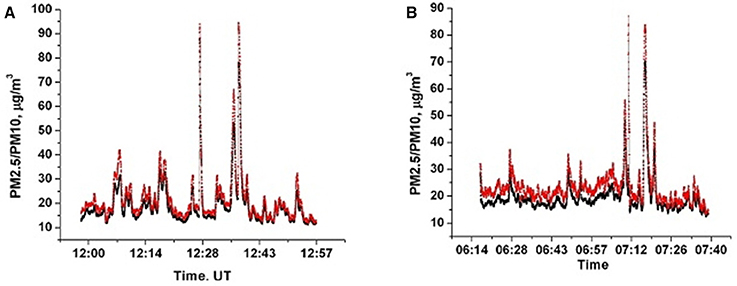
Figure 13. Continuous recording of PM2.5 (black) and PM10 (red) measurements along Kyiv city roads. Spikes correspond to high-level contamination in (A) central part of the city and road intersections; (B) ring road around the city and entry road.
For comprehensive monitoring of PM2.5/PM10 the HORIZON2020 Project SMURBS (SMart URBan Solutions for air quality, disasters, and city growth, http://www.era-planet.eu/index.php/calls/smurbs-strand-1/) has been recently started with particular scientific aims: (1) to establish an infrastructure to measure PM2.5/PM10 particulate loading of Kyiv city atmosphere, including meteorology, and using up-to-date monitoring instruments; (2) to create information tools and network for informing Kyiv city community on the state of PM pollution. It is planned that new infrastructure will be created at the existing air quality monitoring stations, which operated by the CGO, providing long-term PM2.5/PM10 observations potentially to be included in the AirBase.
Polarimetric Satellite Project Aerosol-UA Developed in Ukraine
An idea to develop satellite instrument in Ukraine for the study of aerosols in the terrestrial atmosphere from space (Yatskiv et al., 2012) has arisen after the failed launch of Glory mission (Mishchenko et al., 2007) on March 4, 2011. Satellite instruments became effective tools for the study of the Earth's atmosphere and particularly aerosols during last decades (Lee et al., 2009; Su et al., 2010; Sayer et al., 2012). Especially, measurements of polarization of light scattered by the atmosphere and surface were recognized as effective techniques to study aerosol particles optical, microphysical and chemical properties from space (Mishchenko and Travis, 1997; Nadal and Bréon, 1999; Deuzé et al., 2001; Mishchenko et al., 2007; Kokhanovsky et al., 2015). The POLDER instrument was the first device that used multi-wavelength and multi-angle measurements of polarization to study aerosols from space (Deuzé et al., 2001). Instrument APS of Glory mission (Mishchenko et al., 2007) possessed larger ranges and more measurable wavelengths and angles than POLDER and could obtain much more accurate data on aerosols particles properties (Mishchenko and Travis, 1997; Mishchenko et al., 2007; Kokhanovsky et al., 2015).
After Glory failure and termination of POLDER/PARASOL mission in 2013 there are no like those space instruments in operation and study of aerosols global distribution and properties are not so effective. Though several new space missions are planned to study aerosols with instruments similar to POLDER, they were scheduled to launches at least for 2019 and later (Marbach et al., 2015; Milinevsky et al., 2015, 2016). On the other hand, Ukrainian scientists contributed greatly to the development of polarimetric techniques in remote sensing (see e.g., Videen et al., 2004; Mishchenko et al., 2010, 2011). Also, there are the intellectual asset and industrial structures in Ukraine to develop and produce the space instruments and facility. These are the reasons that we started to work on the space project for study aerosols by measuring intensity and polarization of light scattered by terrestrial surface and atmosphere. The project was named Aerosol-UA (Yatskiv et al., 2012; Milinevsky et al., 2015, 2016). The Aerosol-UA instruments are scanning polarimeter (ScanPol) and multispectral imager-polarimeter (MSIP). The instruments destined to receive data on the spatial and temporal distribution of the aerosols in the Earth's atmosphere and to determine chemical, microphysical, and optical properties of aerosol particles.
Design of the ScanPol instrument is very similar to APS instrument of the Glory mission (Mishchenko et al., 2007; Peralta et al., 2007). It is designed to measure Stokes parameters I, Q, U of scattered light within the wide spectral range from the ultraviolet (UV) to the shortwave infrared radiance (SWIR). The spectral channels of the ScanPol are centered at 370, 410, 555, 865, 1,378, 1,610 nm with a full width at half maximum (FWHM) from 10 to 40 nm. These spectral channels will be used to study the tropospheric aerosol properties over the ocean and the land surface, the color of the ocean, the cirrus clouds, stratospheric aerosols, which can be caused by volcanic eruptions, and the Earth's surface reflectance. The instrument will perform measurements in a wide range of scattering angles +50° to −60° from nadir with the instantaneous field of view (FOW) approximately 0.5° at about 200 viewing directions over each observed scene (Milinevsky et al., 2016). The required accuracy of polarization degree measurements is approximately 0.2%, and accuracy of light intensity measurements has to be better than 4% approximately. The prototype instrument ScanPol has already been manufactured, assembled and laboratory test is ongoing.
The multispectral wide-angle imager–polarimeter MSIP is designed to measure three Stokes parameters I, Q, U of scattered light in FOW 60° × 60° with spatial resolution 0.25° × 0.25°. The MSIP instrument consists of five optical channels: three channels intended for polarization measurements and two for photometric. Polarimetric channels will measure Stokes parameters at wavelengths 410, 555, and 865 nm with FWHM 20 nm. The first photometric channel has wavelengths centered at 410, 443, 470, and 490 nm, with FWHM 20 nm, and the second photometric channel has wavelengths centered at 555, 670, 865, and 910 nm with FWHM from 20 to 40 nm (Milinevsky et al., 2016).
In the MSIP channels, the image is the splitting by a special prism-splitter to produce four images at the CCD matrix detector. That allows measuring four polarization components 0°, 45°, 90°, and 135° in each of three polarization channels and four wavelengths intensity in each of photometric channels in the field-of-view. One of the special advantages of ScanPol/MSIP concept is inter-calibration of the ScanPol and MSIP instruments, which the first one is continuously calibrated onboard. In that way, the MSIP polarization accuracy expected as 1% or less. The one channel of the MSIP instrument has been produced on the base of optical and construction design computation, and used for laboratory measurements (Figure 14).
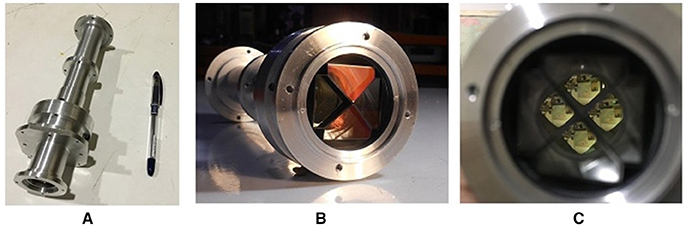
Figure 14. The channel of multispectral imager-polarimeter MSIP prepared for laboratory test. (A) MSIP channel without matrix unit, (B) prism splitter, (C) four images after prism splitter.
Physical and logical structures of the facility are developed for data processing of measured by the ScanPol and MSIP polarimeters. It is planned to use the software on the base of the GRASP algorithm (Dubovik et al., 2011, 2014; Torres et al., 2017) for data analysis and aerosol properties retrieval. The synthetic data simulations using the GRASP algorithm have been fulfilled for mimic measurements of ScanPol and MSIP as overpasses at the AERONET Kyiv site. Obtained synthetic Aerosol-UA data compared to AERONET and POLDER measurements are in reasonable agreement.
It is planned to validate the Aerosol-UA data on global and regional scales by aerosol ground-based remote sensing measurements employing AERONET, mobile and portable sun-photometers, particularly Microtops II sun-photometer, which is the main instrument for the Maritime Aerosol Network (Smirnov et al., 2011). The columnar properties of the aerosol particle characteristics will be retrieved from ScanPol and MSIP data using the GRASP algorithm calculations combining with the ground-based measurements.
Advantages of the Aerosol-UA project will be provided by several features: (1) polarization is a relative measurement that can be made accurately; (2) polarimetric ScanPol measurements can be calibrated on the orbit; (3) polarization change with scattering angle and wavelength gives information on size, refractive index, and shape of aerosol; (4) synergy of scanner and imager will produce the new quality of data on aerosol properties. The project Aerosol-UA will be launched at the new YuzhSat satellite platform has been recently developed by Yuzhnoye State Design Office.
Conclusions
Estimations of the aerosols content and properties in the atmosphere over several regions of Ukraine for the second part of the twentieth century were found from measurements of the direct solar irradiation with actinometers. In addition, remote measurements of the spectral AOD and Ångström exponent had been carried out at several observational sites in Ukraine [Kyiv, Odessa, Lviv, Feodosia (Karadag, Crimea)] with special photometers M-83. The monitoring of atmospheric transmission has been provided in the Crimea region of Ukraine since 1996 with the sun-tracking photometer. The tendency of the atmosphere transparency decreasing was found in both urban and rural regions at the expense of aerosol extinction increasing. This tendency was various in different regions and time spans; it was larger at urban regions. However, the credibility of the earlier data needs validation.
Participation in the AERONET program and collaboration with LOA of University Lille 1 gave a good chance to study aerosols in the atmosphere over the large area of Ukraine and to contribute to the international database. Up-to-date techniques are used to measure and to analyze aerosols properties, such as sun-photometers, lidar, and satellite data. Also, we started to use modeling of the aerosol particles properties, concentration, and transport over the territory of Ukraine and adjacent countries. The current study has shown that contamination of the atmosphere over Ukraine with aerosols is similar to others areas of Eastern Europe and the aerosols properties are very similar too. Aerosol spatial distribution over Ukraine is approximately uniform spatially but special events of aerosol loading occur from time to time associated with fires and aerosol particles transport by the air flows. Observations over Kyiv AERONET site suggest on the negative trend of the AOD during 2008–2015. The seasonal behavior of AOD exhibits the pattern with two maxima, one in spring and second in the end of summer. Particles microphysical properties (SSA, RI and size distribution) differ for warm (April–October) and cold (November–March) parts of a year. Study of aerosols spatial distribution and transport over East European region suggests that main sources of aerosols are situated in the eastern and east-southern regions of Ukraine and correspond to industrial areas and steppe fields.
Aerosols radiative forcing at the Top-of-Atmosphere determined by observations at Kyiv site on the average is negative during the year and mainly contributes to cooling of the atmosphere over Kyiv and Ukraine, but it is positive in snowing winter months and negative in the rest of a year contributing to lessening difference of the climate conditions between cold and warm parts of a year in Ukraine. To improve estimation of radiative forcing it is reasonable to introduce lidar monitoring of aerosol in the area. Estimation of PM2.5 values in big cities of Ukraine shows reasonably good air quality during summer month and acceded EPA threshold values in cold period of the year. Newly developed satellite project Aerosol-UA for aerosol distribution and microphysics study should provide valuable data for climate modeling.
Author Contributions
GM coordinated and led all the efforts for this manuscript. VD and GM conducted measurements and data analysis, have joint general and specific discussions for the manuscript.
Conflict of Interest Statement
The authors declare that the research was conducted in the absence of any commercial or financial relationships that could be construed as a potential conflict of interest.
Acknowledgments
This work was supported by the Special Complex Program for Space Research 2012–2017 of the National Academy of Sciences of Ukraine (the NASU), projects (1/16-2016) and (1/17-2017), by Taras Shevchenko National University of Kyiv, projects (16BF051-02) and (16BF023-01), by the Ukrainian State Fund for Fundamental Research, grant (F73/36-2017). The authors extend special thanks to Philippe Goloub, Natallia Miatselskaya, Anatoly Kabashnikov, Anatoli Chaikovsky, Andrii Bovchaliuk, Valentin Bovchaliuk, Michael Mishchenko, Ivan Synyasky, Oleg Dubovik, Luk Blarel, Thierry Podvin, Yuliia Yukhymchuk, and Mikhail Sosonkin for the support in providing observations and discussions on the topic of this paper. We thank Brent Holben (NASA/GSFC) for managing the AERONET program and its sites. The high quality of AERONET/PHOTONS data was provided by CIMEL sun-photometer calibration performed at LOA using the AERONET-EUROPE calibration center, supported by the European Union's Horizon 2020 research and innovation program under grant agreement No 654109. Authors also thank GEOS-Chem Model developments team for access to model resources. Part of this research was performed at the International Center of Future Science, Jilin University (JLU), Changchun, China, under contract with the JLU. The POLDER/PARASOL data are originally provided by CNES. Products and images produced and distributed by ICARE Data and Services Center (http://www.icare.univ-lille1.fr). Authors also thank Tom L. Kucsera (GESTAR/USRA) at NASA/Goddard for back-trajectories available at the aeronet.gsfc.nasa.gov.
References
Abakumova, G. M., Feigelson, E. M., Russak, V., and Stadnik, V. V. (1996). Evaluation of long-term changes in radiation, cloudiness, and surface temperature on the territory of former Soviet Union. J. Clim. 9, 1319–1327. doi: 10.1175/1520-0442(1996)009<1319:EOLTCI>2.0.CO;2
Amiridis, V., Balis, D. S., Giannakaki, E., Stohl, A., Kazadzis, S., Koukouli, M. E., et al. (2009). Optical characteristics of biomass burning aerosols over Southeastern Europe determined from UV-Raman lidar measurements. Atmos. Chem. Phys. 9, 2431–2440. doi: 10.5194/acp-9-2431-2009
Anderson, J. O., Thundiyil, J. G., and Stolbach, A. (2012). Clearing the air: a review of the effects of particulate matter air pollution on human health. J. Med. Toxicol. 8, 166–175. doi: 10.1007/s13181-011-0203-1
Ansmann, A., and Muller, D. (2005). “Atmospheric aerosol particles,” in Lidar Range-Resolved Optical Remote Sensing of the Atmosphere, ed C. Weitkamp (Singapore: Springer Series in Optical Sciences), 105–141.
Bernstein, J. A., Alexis, N., Barnes, C., Bernstein, I. L., Bernstein, J. A., Nel, A., et al. (2004). Health effects of air pollution. J. Allergy Clin. Immunol. 114, 116–123. doi: 10.1016/j.jaci.2004.08.030
Bey, I., Jacob, D. J., Yantosca, R. M., Logan, J. A., Field, B. D., Fiore, A. M., et al. (2001). Global modeling of tropospheric chemistry with assimilated meteorology: model description and evaluation. J. Geophys. Res. 106, 23073–23095. doi: 10.1029/2001JD000807
Birmili, W., Schepanski, K., Ansmann, A., Spindler, G., Tegen, I., Wehner, B., et al. (2008). A case of extreme particulate matter concentrations over central Europe caused by dust emitted over the Southern Ukraine. Atmosph. Chem. Phys. 8, 997–1016. doi: 10.5194/acp-8-997-2008
Boselli, A., Caggiano, R., Cornacchia, C., Madonna, F., Mona, L., Macchiato, M., et al. (2012). Multi year sun-photometer measurements for aerosol characterization in a Central Mediterranean site. Atmosph. Res. 104, 98–110. doi: 10.1016/j.atmosres.2011.08.002
Bovchaliuk, A. (2013). The spatial variability of PM2:5 over Europe using satellite POLDER-3/PARASOL data. Adv. Astron. Space Phys. 3, 102–108. Available online at: http://aasp.kiev.ua/volume3/102-108-BovchaliukA.pdf
Bovchaliuk, A., Milinevsky, G., Danylevsky, V., Goloub, P., Dubovik, O., Holdak, A., et al. (2013). Variability of aerosol properties over Eastern Europe observed from ground and satellites in the period from 2003 to 2011. Atmosph. Chem. Phys. 13, 6587–6602. doi: 10.5194/acp-13-6587-2013
Bovchaliuk, V., Bovchaliuk, A., Milinevsky, G., Danylevsky, V., Sosonkin, M., and Goloub, P. H. (2013). Aerosol microtops II sunphotometer observations over Ukraine. Adv. Astron. Space Phys. 3, 46–52. Available online at: http://aasp.kiev.ua/volume3/046-052-BovchaliukV.pdf
Bovchaliuk, V., Goloub, P., Podvin, T., Veselovskii, I., Tanre, D., Chaikovsky, A., et al. (2016). Comparison of aerosol properties retrieved using GARRLiC, LIRIC, and Raman algorithms applied to multi-wavelength lidar and sun/sky-photometer data. Atmos. Meas. Tech. 9, 3391–3405. doi: 10.5194/amt-9-3391-2016
Bovchaliuk, V., Milinevsky, G., Danylevsky, V., Goloub, P. H., Sosonkin, M., Yukhimchuk, Y. U., et al. (2017). Aerosol properties in atmosphere over Kyiv using lidar and sun-photometer observations. Kosm. Nauka Tehnol. 23, 37–47. doi: 10.15407/knit2017.06.034
Bréon, F.-M., Vermeulen, A., and Descloitres, J. (2011). An evaluation of satellite aerosol products against sunphotometer measurements. Remote Sens. Environ. 115, 3102–3111. doi: 10.1016/j.rse.2011.06.017
Che, H., Qi, B., Zhao, H., Xia, X., Eck, T. F., Goloub, P., et al. (2018). Aerosol optical properties and direct radiative forcing based on measurements from the China aerosol remote sensing network (CARSNET) in eastern China. Atmos. Chem. Phys. 18, 405–425. doi: 10.5194/acp-18-405-2018
Chin, M., Diehl, T., Tan, Q., Prospero, J. M., Kahn, R. A., Remer, L. A., et al. (2014). Multi-decadal aerosol variations from 1980 to 2009: a perspective from observations and a global model. Atmos. Chem. Phys. 14, 3657–3690. doi: 10.5194/acp-14-3657-2014
Chubarova, N., Nezval', Y., Sviridenkov, I., Smirnov, A., and Slutsker, I. (2012). Smoke aerosol and its radiative effects during extreme fire event over Central Russia in summer 2010. Atmos. Meas. Tech. 5, 557–568. doi: 10.5194/amt-5-557-2012
Climate Change (2013). The Physical Science Basis. Contribution of Working Group I to the Fifth Assessment Report of the Intergovernmental Panel on Climate Change, eds T. F. Stocker, D. Qin, G.-K. Plattner, M. Tignor, S. K. Allen, J. Boschung, A. Nauels, Y. Xia, V. Bex, and P. M. Midgley (Cambridge; New York, NY: Cambridge University Press), 1535.
Danylevsky, V., Ivchenko, V., Milinevsky, G., Grytsai, A., Sosonkin, M., Goloub, P. H., et al. (2011a). Aerosol layer properties over Kyiv from aeronet/photons sunphotometer measurements during 2008–2009. Int. J. Remote Sens. 32, 657–669. doi: 10.1080/01431161.2010.517798
Danylevsky, V., Ivchenko, V., Milinevsky, G., Sosonkin, M., Goloub, P. H., Li, Z., et al. (2011b). “Atmospheric aerosol properties measured with aeronet/photons sun-photometer over Kyiv during 2008-2009,” in Use of Satellite and In-Situ Data to Improve Sustainability, eds F. Kogan, A. Powell, and O. Fedorov (Dordrecht: NATO Science for Peace and Security Series C: Environmental Security; Springer), 285–294. doi: 10.1007/978-90-481-9618-0_32
Davidson, C. I., Phalen, R. F., and Solomon, P. A. (2005). Airborne particulate matter and human health: a review. Aerosol Sci. Technol. 39, 737–749. doi: 10.1080/02786820500191348
Derimian, Y., Dubovik, O., Huang, X., Lapyonok, T., Litvinov, P., Kostinski, A. B., et al. (2016). Comprehensive tool for calculation of radiative fluxes: illustration of shortwave aerosol radiative effect sensitivities to the details in aerosol and underlying surface characteristics. Atmos. Chem. Phys. 16, 5763–5780. doi: 10.5194/acp-16-5763-2016
Deuzé, J.-L., Bréon, F.-M., Devaux, C., Goloub, P., Herman, M., Lafrance, B., et al. (2001). Remote sensing of aerosols over land surfaces from POLDER/ADEOS-1 polarized measurements. J. Geophys. Res. 106, 4913–4926. doi: 10.1029/2000JD900364
Dorling, S. R., Davies, T. D., and Pierce, C. E. (1992). Cluster analysis: a technique for estimating the synoptic meteorological controls on air and precipitation chemistry – method and applications. Atmos. Environ. 26A, 2575–2581. doi: 10.1016/0960-1686(92)90110-7
Dubovik, O., Herman, M., Holdak, A., Lapyonok, T., Tanré, D., Deuzé, J. L., et al. (2011). Statistically optimized inversion algorithm for enhanced retrieval of aerosol properties from spectral multi-angle polarimetric satellite observations. Atmos. Meas. Tech. 4, 975–1018. doi: 10.5194/amt-4-975-2011
Dubovik, O., Holben, B., Eck, T., Smirnov, A., Kaufman, Y. J., King, M. D., et al. (2002). Variability of absorption and optical properties of key aerosol types observed in worldwide locations. J. Atmos. Sci. 59, 590–608. doi: 10.1175/1520-0469(2002)059<0590:VOAAOP>2.0.CO;2
Dubovik, O., and King, M. D. (2000). A flexible inversion algorithm for retrieval of aerosol optical properties from Sun and sky radiance measurements. J. Geophys. Res. 105, 20673–20696. doi: 10.1029/2000JD900282
Dubovik, O., Lapyonok, T., Litvinov, P., Herman, M., Fuertes, D., Ducos, F., et al. (2014). GRASP: aversatile algorithm for characterizing the atmosphere. SPIE Newsroom doi: 10.1117/2.1201408.005558
Dubuisson, P., Roger, J. C., Mallet, M., and Dubovik, O. (2006). “A code to compute the direct solar radiative forcing: application to anthropogenic aerosols during the Escompte experiment,” in Proceedings of IRS 2004: Current Problems in Atmospheric Radiation, 23–28 August 2006 (Busan), 127–130.
Enhalt, D., Prather, M., Dentener, F., Derwent, R., Dlugokencky, E., Holland, E., et al. (2001). “Atmospheric chemistry and greenhouse gases,” in Climate Change 2001: The Scientific Basis. Contribution of Working Group I to the Third Assessment Report of the Intergovernmental Panel on Climate Change, eds J. T. Houghton, Y. Ding, D. J. Griggs, M. Noguer, P. J. van der Linden, X. Dai, K. Maskell, and C. A. Johnson (Cambridge; New York, NY: Cambridge University Press), 239–288.
Fan, X. H., Goloub, P., Deuze, J. L., Chen, H. B., Zhang, W. X., Tanre, D., et al. (2008). Evaluation of PARASOL aerosol retrieval over North East Asia. Remote Sens. Environ. 112, 697–707. doi: 10.1016/j.rse.2007.06.010
Galytska, E., Danylevsky, V., Hommel, R., and Burrows, J. P. (2018). Increased aerosols content in the atmosphere over Ukraine during summer 2010. Atmos. Meas. Tech. 11, 2101–2118. doi: 10.5194/amt-11-2101-2018
Garcia, O. E., Diaz, J. P., Exposito, F. J., Diaz, A. M., Dubovik, O., Derimian, Y., et al. (2012). Shortwave radiative forcing and efficiency of key aerosol types using AERONET data. Atmos. Chem. Phys. 12, 5129–5145. doi: 10.5194/acp-12-5129-2012
Garcia, O. E., Diaz, J. P., Exposito, F. J., Diaz, A. M., Dubovik, O., Dubuisson, P., et al. (2008). Validation of AERONET estimates of atmospheric solar fluxes and aerosol radiative forsing by ground-based broadband measurements. J. Geophys. Res. 113, D21207-1–D21207-16. doi: 10.1029/2008JD010211
Giles, D. M., Holben, B. N., Eck, T. F., Sinyuk, A., Smirnov, A., Slutsker, I., et al. (2012). An analysis of AERONET aerosol absorption properties and classifications representative of aerosol source regions. J. Geophys. Res. 117:D17203. doi: 10.1029/2012JD018127
Goloub, P., Li, Z., Dubovik, O., Blarel, L., Podvin, T., Jankowiak, I., et al. (2008). “PHOTONS/AERONET sunphotometer network overview. description, activities, results,” in Proceedings of SPIE (Buryatia), 69360V. doi: 10.1117/12.783171
Guerrero-Rascado, J. L., Landulfo, E., Antu-a, J. C., Barbosa, H. M. J., Barja, B., Bastidas, A. E., et al. (2016). Latin American Lidar Network (LALINET) for aerosol research: diagnosis on network instrumentation. J. Atmos. Sol. Terr. Phys. 138–139, 112–120. doi: 10.1016/j.jastp.2016.01.001
Guo, H., Cheng, T., Gu, X., Chen, H., Wang, Y., Zheng, F., et al. (2016). Comparison of four ground-level PM2.5 estimation models using Parasol Aerosol optical depth data from China. Int. J. Environ. Res. Public Health. 13:180. doi: 10.3390/ijerph13020180
Gushchin, G. P. (1988). The Methods, Instrumentation and Results of Atmospheric Spectral Measurements. Leningrad: Gidrometeoizdat. (in Russian).
Hashimoto, M., Nakajima, T., Dubovik, O., Campanelli, M., Che, H., Khatri, P., et al. (2012). Development of a new data-processing method for SKYNET sky radiometer observations. Atmos. Meas. Tech. 5, 2723–2737, doi: 10.5194/amt-5-2723-2012
Holben, B. N., Eck, T. F., Slutsker, I., Tanré, D., Buis, J. P., Setzer, A., et al. (1998). AERONET–A federated instrument network and data archive for aerosol characterization. Remote Sens. Environ. 66, 1–16. doi: 10.1016/S0034-4257(98)00031-5
Holben, B. N., Tanré, D., Smirnov, A., Eck, T. F., Slutsker, I., Abuhassan, N., et al. (2001). An emerging ground-based aerosol climatology: aerosol optical depth from AERONET. J. Geophys. Res. 106, 12067–12097. doi: 10.1029/2001JD900014
Hsu, Y.-K., Holsena, T., and Hopke, P. (2003). Comparison of hybrid receptor models to locate PCB sources in Chicago. Atmos. Environ. 37, 545–562. doi: 10.1016/S1352-2310(02)00886-5
Israelevich, P., Ganor, E., Alpert, P., Kishcha, P., and Stupp, A. (2012). Predominant transport paths of Saharan dust over the Mediterranean sea to Europe. J. Geophys. Res. 117:D02205. doi: 10.1029/2011JD016482
Kabashnikov, V., Milinevsky, G., Chaikovsky, A., Miatselskaya, N., Danylevsky, V., Aculinin, A., et al. (2014). Localization of aerosol sources in East-European region by back-trajectory statistics. Int. J. Remote Sens. 35, 6993–7006. doi: 10.1080/01431161.2014.960621
Kabashnikov, V. P., Chaikovsky, A. P., Kucsera, T. L., and Metelskaya, N. S. (2011). Estimated accuracy of three common trajectory statistical methods. Atmos. Environ. 45, 5425–5430. doi: 10.1016/j.atmosenv.2011.07.006
Kim, D., Chin, M., Yu, H., Eck, T. F., Sinyuk, A., Smirnov, A., et al. (2011). Dust optical properties over North Africa and Arabian peninsula derived from the AERONET dataset. Atmos. Chem. Phys. 11, 10733–10741. doi: 10.5194/acp-11-10733-2011
Kim, K.-H., Kabir, E., and Kabir, S. (2015). A review on the human health impact of airborne particulate matter. Environ. Int. 74, 136–143. doi: 10.1016/j.envint.2014.10.005
Kokhanovsky, A. A., Davis, A. B., Cairns, B., Dubovik, O., Hasekamp, O. P., Sano, I., et al. (2015). Space-based remote sensing of atmospheric aerosols: the multi-angle spectro-polarimetric frontier. Earth Sci. Rev. 145, 85–116. doi: 10.1016/j.earscirev.2015.01.012
Konovalov, I. B., Beekmann, M., Kuznetsova, I. N., Yurova, A., and Zvyagintsev, A. M. (2011). Atmospheric impacts of the 2010 Russian wildfires: integrating modelling and measurements of an extreme air pollution episode in the Moscow region. Atmos. Chem. Phys. 11, 10031–10056. doi: 10.5194/acp-11-10031-2011
Lee, K. H., Li, Z., Kim, Y. J., and Kokhanovsky, A. (2009). “Atmospheric aerosol monitoring from satellite observations: a history of three decades,” in Atmospheric and Biological Environmental Monitoring, eds Y. J. Kim, U. Platt, M. B. Gu, and H. Iwahashi (Dordrecht; Heidelberg; London; New York, NY: Springer Science+Business Media B.V), 13–38.
Li, Z., Xu, H., Li, K., Li, D., Xie, Y., Li, L., et al. (2018). Comprehensive study of optical, physical, chemical and radiative properties of total columnar atmospheric aerosols over China: an overview of Sun-sky radiometer Observation NETwork (SONET) measurements. Bull. Amer. Meteor. Soc. 2018, 739–755. doi: 10.1175/BAMS-D-17-0133.1
Lopatin, A., Dubovik, O., Chaikovsky, A., Goloub, P., Lapyonok, T., Tanre, D., et al. (2013). Enhancement of aerosol characterization using synergy of lidar and sun-photometer coincident observations: the GARRLiC algorithm. Atmos. Meas. Tech. 6, 2065–2088. doi: 10.5194/amt-6-2065-2013
Lund Myhre, C., Toledano, C., Myhre, G., Stebel, K., Yttri, K. E., Aaltonen, V., et al. (2007). Regional aerosol optical properties and radiative impact of the extreme smoke event in the European Arctic in spring 2006. Atmos. Chem. Phys. 7, 5899–5915. doi: 10.5194/acp-7-5899-2007
Marbach, T., Riedi, J., Lacan, A., and Schlüssel, P. (2015). “The 3MI mission: multi-viewing -channel -polarisation imager of the EUMETSAT polar system - second generation (EPS-SG) dedicated to aerosol and cloud monitoring,” in Proceedings of SPIE (San Diego, CA), 9613, 961310-1–961310-8. doi: 10.1117/12.2218026
Menut, L., Bessagnet, B., Khvorostyanov, D., Beekmann, M., Blond, N., Colette, A., et al. (2013). CHIMERE 2013: a model for regional atmospheric composition modelling. Geosci. Model Dev. 6, 981–1028. doi: 10.5194/gmd-6-981-2013
Miatselskaya, N., Kabashnikov, V., Milinevsky, G., Chaikovsky, A., Danylevsky, V., and Bovchaliuk, V. (2016). Atmospheric aerosol distribution in the Belarus-Ukraine region by the GEOS–Chem model and AERONET measurements. Int. J. Remote Sens. 37, 3181–3195. doi: 10.1080/01431161.2016.1194541
Milinevsky, G., Danylevsky, V., Bovchaliuk, V., Bovchaliuk, A., Goloub, P.h., Dubovik, O., et al. (2014). Aerosol seasonal variations over urban–industrial regions in Ukraine according to AERONET and POLDER measurements. Atmos. Meas. Tech. 7, 1459–1474. doi: 10.5194/amt-7-1459-2014
Milinevsky, G. P., Danylevsky, V. O., Grytsai, A. V., Evtushevsky, O. M., Kravchenko, V. O., Bovchaliuk, A. P., et al. (2012). Recent developments of atmospheric research in Ukraine. Adv. Astron. Space Phys. 2, 114–120. Available online at: http://aasp.kiev.ua/volume2/114-120-Milinevsky.pdf
Milinevsky, G., Yatskiv, Y., Degtyaryov, O., Syniavskyi, I., Ivanov, Y., Bovchaliuk, A., et al. (2015). Remote sensing of aerosol in the terrestrial atmosphere from space: new missions. Adv. Astron. Space Phys. 5, 11–16. doi: 10.17721/2227-1481.5.11-16
Milinevsky, G., Yatskiv, Y., Degtyaryov, O., Syniavskyi, I., Mishchenko, M., Rosenbush, V., et al. (2016). New satellite project aerosol-UA: remote sensing of aerosols in the terrestrial atmosphere. Acta Astronaut. 123, 292–300. doi: 10.1016/j.actaastro.2016.02.027
Mishchenko, M. I., Cairns, B., Kopp, G., Schueler, C. F., Fafaul, B. A., Hansen, J. E., et al. (2007). Accurate monitoring of terrestrial aerosol and total solar irradiance: introducing the GLORY mission. Bull. Am. Meteorol. Soc. 80, 2229–2259. doi: 10.1175/BAMS-88-5-677
Mishchenko, M. I., Rosenbush, V. K., Kiselev, N. N., Lupishko, D. F., Tishkovets, V. P., Kaydash, V. G., et al. (2010). Polarimetric Remote Sensing of Solar System Objects. Kyiv, Akademperiodyka.
Mishchenko, M. I., and Travis, L. D. (1997). Satellite retrieval of aerosol properties over the ocean using measurements of reflected sunlight: effect of instrumental errors and aerosol absorption. J. Geophys. Res. 102, 13543–13553. doi: 10.1029/97JD01124
Mishchenko, M. I., Yatskiv, Y., Rosenbush, V., and Videen, G. (eds.). (2011). Polarimetric Detection, Characterization, and Remote Sensing. Dordrecht: Springer.
Nadal, F., and Bréon, F.-M. (1999). Parameterization of surface polarized reflectance derived from POLDER spaceborne measurements. IEEE Trans. Geosci. Remote Sens. 37, 1709–1718. doi: 10.1109/36.763292
Omar, A. H., Won, J.-G., Winker, D. M., Yoon, S.-C., Dubovik, O., and McCormick, M. P. (2005). Development of global aerosol models using cluster analysis of Aerosol Robotic Network (AERONET) measurements. J. Geophys. Res. 110:D10S14. doi: 10.1029/2004JD004874
Pan, L., Che, H., Geng, F., Xia, X., Wang, Y., Zhu, C., et al. (2010). Aerosol optical properties based on ground measurements over the ChineseYangtze Delta Region. Atmosph. Environ. 44, 2587–2596. doi: 10.1016/j.atmosenv.2010.04.013
Pappalardo, G., Amodeo, A., Apituley, A., Comeron, A., Freudenthaler, V., Linné, H., et al. (2014). EARLINET: towards an advanced sustainable European aerosol lidar network. Atmos. Meas. Tech. 7, 2389–2409. doi: 10.5194/amt-7-2389-2014
Pavese, G., Calvello, M., Esposito, F., Leone, L., and Restieri, R. (2012). Effects of Saharan dust advection on atmospheric aerosol properties in the West-Mediterranean area. Adv. Meteorol. 2012:730579. doi: 10.1155/2012/730579
Penning de Vries, M. J. M., Beirle, S., Hörmann, C., Kaiser, J. W., Stammes, P., Tilstra, L. G., et al. (2015). A global aerosol classification algorithm incorporating multiple satellite data sets of aerosol and trace gas abundances. Atmos. Chem. Phys. 15, 10597–10618. doi: 10.5194/acp-15-10597-2015
Peralta, R. J., Nardell, C., Cairns, B., Russell, E. E., Travis, L. D., Mishchenko, M. I., et al. (2007). Aerosol polarimetry sensor for the glory mission. Proc. of SPIE 6786, 1–17. doi: 10.1117/12.783307
Pietruczuk, A., and Chaikovsky, A. (2012). Variability of aerosol properties during the 2007–2010 spring seasons over central Europe. Acta Geophys. 60, 1338–1358. doi: 10.2478/s11600-012-0017-9
Remer, L. A., Kleidman, R. G., Levy, R. C., Kaufman, Y. J., Tanré, D., Mattoo, S., et al. (2008). Global aerosol climatology from the MODIS satellite sensors. J. Geophys. Res. 113:D14SD07. doi: 10.1029/2007JD009661
Rupakheti, D., Kang, S., Rupakheti, M., Cong, Z., Tripathee, L., Panday, A. K., et al. (2018). Observation of optical properties and sources of aerosols at Buddha's birthplace, Lumbini, Nepal: environmental implications. Environ. Sci. Pollut. Res. Int. 25, 14868–14881. doi: 10.1007/s11356-018-1713-z
Russak, V. (1990). Trends of solar radiation, cloudiness and atmospheric transparency during recent decades in Estonia. Tellus 42B, 206–210. doi: 10.3402/tellusb.v42i2.15205
Sayer, A. M., Hsu, N. C., Bettenhausen, C., Jeong, M.-J., Holben, B. N., and Zhang, J. (2012). Global and regional evaluation of overland spectral aerosol optical depth retrievals from SeaWiFS. Atmos. Meas. Tech. 5, 1761–1778. doi: 10.5194/amt-5-1761-2012
Schoeberl, M. R., and Newman, P. A. (1995). A multiple-level trajectory analysis of vortex filaments. J. Geophys. Res. 100, 25801–25816. doi: 10.1029/95JD02414
Smirnov, A., Holben, B. N., Giles, D. M., Slutsker, I., O'Neil, N. T., Eck, T. F., et al. (2011). Maritime aerosol network as a component of AERONET – first results and comparison with global aerosol models and satellite retrievals. Atmos. Meas. Tech. 4, 583–597. doi: 10.5194/amt-4-583-2011
Stohl, A. (1996). Trajectory statistics – a new method to establish source-receptor relationship of air pollutants and its applications to the transport of particulate sulfate in Europe. Atmos. Environ. 30, 579–587. doi: 10.1016/1352-2310(95)00314-2
Stohl, A. (1998). Computation, accuracy and applications of trajectories – a review and bibliography. Atmos. Environ. 32, 947–966. doi: 10.1016/S1352-2310(97)00457-3
Su, X., Goloub, P., Chiapello, I., Chen, H., Ducos, F., and Li, Z. (2010). Aerosol variability over East Asia as seen by POLDER space-borne sensors. J. Geophys. Res. 115:D24215. doi: 10.1029/2010JD014286
Szkop, A., Pietruczuk, A., and Posyniak, M. (2016). Classification of aerosol over Central Europe by cluster analysis of aerosol columnar optical properties and backward trajectory statistics. Acta Geophysica 64, 2650–2676. doi: 10.1515/acgeo-2016-0112
Tanré, D., Bréon, F. M., Deuzé, J. L., Dubovik, O., Ducos, F., François, P., et al. (2011). Remote sensing of aerosols by using polarized, directional and spectral measurements within the A-Train: the PARASOL mission. Atmos. Meas. Tech. 4, 1383–1395. doi: 10.5194/amt-4-1383-2011
Terez, E. I., and Terez, G. A. (2002). Investigation of atmospheric transmission in the crimea (Ukraine) in the twentieth century. J. Appl. Meteorol. 41, 1060–1063. doi: 10.1175/1520-0450(2002)041<1060:IOATIT>2.0.CO;2
Torres, B., Dubovik, O., Fuertes, D., Schuster, G., Cachorro, V. E., Lapyonok, T., et al. (2017). Advanced characterisation of aerosol size properties from measurements of spectral optical depth using the GRASP algorithm. Atmos. Meas. Tech. 10, 3743–3781. doi: 10.5194/amt-10-3743-2017
Videen, G., Yatskiv, Y., and Mishchenko, M. (2004). Photoplarimetry in Remote Sensing. Dordrecht: Kluver Academic Publishers.
Welton, E. J., and Campbell, J. R. (2002). Micropulse lidar signals: uncertainty analysis. J. Atmos. Oceanic Technol. 19, 2089–2094. doi: 10.1175/1520-0426(2002)019<2089:MLSUA>2.0.CO;2
Welton, E. J., Campbell, J. R., Spinhirne, J. D., and Scott, V. S. (2001). “Global monitoring of clouds and aerosols using a network of micro-pulse lidar systems,” in Lidar Remote Sensing for Industry and Environmental Monitoring, eds U. N. Singh, T. Itabe, N. Sugimoto (Proceedings of SPIE), 151–158.
Winker, D. M., Tackett, J. L., Getzewich, B. J., Liu, Z., Vaughan, M. A., and Rogers, R. R. (2013). The global 3-D distribution of tropospheric aerosols as characterized by CALIOP. Atmos. Chem. Phys. 13, 3345–3361. doi: 10.5194/acp-13-3345-2013
Witte, J. C., Douglass, A. R., da Silva, A., Torres, O., Levy, R., and Duncan, B. N. (2011). NASA A-train and terra observations of the 2010 Russian wildfires. Atmos. Chem. Phys. 11, 9287–9301. doi: 10.5194/acp-11-9287-2011
Xiao, Q., Zhang, H., Choi, M., Li, S., Kondragunta, S., Kim, J., et al. (2016). Evaluation of VIIRS, GOCI, and MODIS Collection 6 AOD retrievals against ground sunphotometer observations over East Asia. Atmos. Chem. Phys. 16, 1255–1269. doi: 10.5194/acp-16-1255-2016
Yakovleva, D. V., and Tolkachenko, G. A. (2008). Optical features of atmosphere aerosol over Black Sea since May 2006 to September 2007. Radiophys. Electr. 13, 185–189. Available online at: http://dspace.nbuv.gov.ua/handle/123456789/10570. (in Russian).
Yatskiv, Y. S., Mishchenko, M. I., Rosenbush, V. K., Shakhovskoy, D. N., Sinyavsky, I. I., Milinevsky, G. P., et al. (2012). Satellite project “AEROSOL-UA”: remote sensing of aerosols in the Earth's atmosphere. Kosm. Nauka Tehnol. 18, 3–15. doi: 10.15407/knit2012.04.003
Yatskiv, Y. A., and S Milinevsky, G. P. (2015). Information About Fire Smoke in Kyiv Atmosphere. Report of National Academy of Sciences of Ukraine. 10, 25–30. Available online at: ftp://ftp.nas.gov.ua/akademperiodyka/Downloads/Visnyk_NANU/downloads/2015_10/Visn_10_2015_6.pdf
Yoon, J., von Hoyningen-Huene, W., Kokhanovsky, A. A., Vountas, M., and Burrows, J. P. (2012). Trend analysis of aerosol optical thickness and Ångström exponent derived from the global AERONET spectral observations. Atmos. Meas. Tech. 5, 1271–1299. doi: 10.5194/amt-5-1271-2012
Yu, F., Luo, G., and Ma, X. (2012). Regional and global modeling of aerosol optical properties with a size, composition, and mixing state resolved particle microphysics model. Atmos. Chem. Phys. 12, 5719–5736. doi: 10.5194/acp-12-5719-2012
Keywords: aerosol, AERONET, sun-photometer, remote sensing, lidar, PM2.5, GEOS-chem
Citation: Milinevsky G and Danylevsky V (2018) Atmospheric Aerosol Over Ukraine Region: Current Status of Knowledge and Research Efforts. Front. Environ. Sci. 6:59. doi: 10.3389/fenvs.2018.00059
Received: 28 November 2017; Accepted: 04 June 2018;
Published: 25 June 2018.
Edited by:
Ralph A. Kahn, Goddard Space Flight Center, United StatesReviewed by:
Eduardo Landulfo, Instituto de Pesquisas Energéticas e Nucleares (CNEN), BrazilJuan Luis Guerrero-Rascado, Universidad de Granada, Spain
Copyright © 2018 Milinevsky and Danylevsky. This is an open-access article distributed under the terms of the Creative Commons Attribution License (CC BY). The use, distribution or reproduction in other forums is permitted, provided the original author(s) and the copyright owner are credited and that the original publication in this journal is cited, in accordance with accepted academic practice. No use, distribution or reproduction is permitted which does not comply with these terms.
*Correspondence: Gennadi Milinevsky, Z2VubWlsaW5ldnNreUBnbWFpbC5jb20=