 Denise Neilsen1*
 Matthew Bakker2
 Ted Van der Gulik3Scott Smith1
 Alex Cannon4Istvan Losso1Anna Warwick Sears5
- 1Agriculture and Agri-Food Canada, Summerland, BC, Canada
- 2School of Resource and Environment Management, Simon Fraser University, Burnaby, BC, Canada
- 3Partnership for Water Sustainability, Abbotsford, BC, Canada
- 4Climate Research Division, Environment and Climate Change Canada, Victoria, BC, Canada
- 5Okanagan Basin Water Board, Kelowna, BC, Canada
Regional water managers face challenges managing water demand and supply in response to climate change. In British Columbia (BC), < 5% of the total land surface is suitable for cultivation and consequently, urban development and agriculture co-exist on lower elevation sites and compete for water. Surface and ground water supply all uses, affecting in-stream habitats and aquifer levels. To assess water needs, we used a GIS-based water demand model for agricultural water use, with layers for detailed land use, soils, a digital elevation model, sub-basins, aquifers, and socio-political jurisdictional boundaries. The model was driven by gridded daily minimum and maximum temperatures and precipitation at a 500 m spatial resolution using historical data (1961–2010) and downscaled climate scenarios (1961–2100) derived from five CMIP5 climate models under two greenhouse gas concentration scenarios (RCP4.5 and RCP8.5). Two case studies were examined:
1. Changes in water use were determined for scenarios of climate change and expanded cropping within the BC Agricultural Land Reserve for 17 agricultural regions. Potential increases in irrigation water demand (IWD) in response to climate change ranged from 21 to 58 and 30 to 114% under low and high emissions scenarios respectively. Land use change scenarios resulted in very large potential increases in water demand, up to 2,400%. Output from this work forms the basis for a web-based agricultural water license calculator.
2. Effects of crop production systems on IWD were examined in the Okanagan region. Combinations of pasture and forage crops with inefficient irrigation systems were most vulnerable to drought as indicated by two indices: relative vulnerability index (IWD/ETo) and allocation vulnerability index (IWD/Maximum annual water allocation). In drought years, up to 70% of the irrigated area was vulnerable. A comparison of detailed land use surveys made in 2006 and 2014 indicated a large shift to highly efficient irrigation systems in the horticultural sector from 38 to 68% of the irrigated acreage. Similar shifts for other agricultural sectors may require financial support. On-going development of regional drought management will require collaborative decision making by water suppliers and users.
Introduction
Concerns about freshwater water availability and use have risen in recent years as regions have experienced ongoing droughts and water shortages. Notable droughts have occurred in California, northern China, Australia, and the Canadian prairies. However, water stress is not limited to these areas. It was estimated that 36% of the world population lived in water stressed areas in 2011 (Grebmer et al., 2012). These conditions are likely to persist, with the proportion of the world population living in water stressed areas predicted to increase to as much as 66% by 2025 (Kjellen and McGranahan, 1997). This trend is being driven by continued population growth, environmental degradation, and increasing overall water demand (Arnell, 1999).
The challenges around water availability and use will be further complicated by future climate change as variation in temperature and precipitation, decease the reliability of water resources (Jiménez Cisneros et al., 2014) and significantly affect water use (Wang et al., 2014). Broadly speaking, there is a consensus that some regions will receive greater precipitation while others less, and long-term seasonal, or short-term water shortages will likely result from greater variability of precipitation and reduced snow and ice storage, but how these changes will interact with demographic and economic factors is still unclear (Jiménez Cisneros et al., 2014).
Changes to water availability are particularly important to agriculture. Globally, agriculture is the largest user of water and that which is required to satisfy irrigation requirements, or irrigation water demand (IWD), accounts for ~70% of global water use (Raskin et al., 1997), and 90% of global consumptive water use (Shiklomanov and Rodda, 2003). This demand is projected to increase in response to population growth and greater demand for agricultural production but at the same time, research suggests that agriculture will face a disproportionate level of water stress resulting from climate change compared to other water uses (Wang et al., 2014). As precipitation becomes more unreliable, rain-fed agricultural regions will become more vulnerable to poor production, increasing the need for irrigation. In general, irrigated systems are more efficient than rain-fed systems as ~40% of the world's food production is estimated to come from the 17% of agricultural land that is irrigated (Postel, 2000). However, the poor quality of some irrigation water may lead to problems with salination both of soils and groundwater resources in some parts of the world.
The far-reaching implications of climate change for agriculture have led to a substantial body of research into future IWD. Most notably, modeling efforts that employ Global Climate Models (GCMs) and Earth Systems Models (ESMs) have contributed significantly to our understanding of future water demand. These studies examine a range of climate change scenarios that vary in projected global warming. Assessments at the global scale range from projections of a slight decrease of IWD (Zhang and Cai, 2013), to no change (Konzmann et al., 2013), to increases of 14–45% (Fischer et al., 2007; Wada et al., 2013) by 2080. While this variation in projections highlights substantial uncertainty at a global scale, the majority of scenarios predict that certain regions will experience >20% increase in IWD (Jiménez Cisneros et al., 2014). For example, there is high confidence that IWD will increase in Europe, USA, and parts of Asia, while other regions, such as India and Pakistan, will likely experience decreases in IWD.
The interregional variation seen in global IWD models is supported by studies at smaller spatial scales. Regional IWD models based on GCMs and ESMs have projected a wider range of future IWD. Annual IWD has been projected to increase by 9–24% by 2100 in the Arkansas River Basin (Elgaali et al., 2007), by 54–645% by 2095 in Bhadra, India (Rehana and Mujumdar, 2013), and by 2,000% by 2080 in North Rhine-Westphalia, Germany (Kreins et al., 2015), although current irrigation water use is very low in this last region. The interregional variability in projected IWD seen in global studies and supported by the projections of regional studies highlights the significant influence of localized climatic conditions on IWD. As a result, while global and regional models offer insights into future IWD, they are often of limited benefit to regional water management efforts outside the area of study.
The Province of British Columbia (BC) has an abundance of water resources but the amount of agricultural land (~4.5%) and access to water are limited by the complex, mountainous terrain (Walker and Sydneysmith, 2008). Agricultural land in the province is protected by an Agricultural Land Reserve (ALR) which comprises 4.599 m ha of which 53% falls within agricultural capability class 1–4, considered suitable for crop production (https://www.alc.gov.bc.ca.) Agricultural water supply includes surface flows from rainfall, snowmelt, glacier melt and groundwater. Annual precipitation ranges from >3,000 mm in coastal regions to < 300 mm in Interior rain-shadow valleys. Summers are dry and low summer flows restrict water availability for both withdrawals and ecological requirements. British Columbia has experienced increasing stress on its water resources in recent years with seasonal droughts in 2003, 2009, 2015, and 2017 resulting in extremely low late summer and fall stream flows in southern interior and coastal regions. Additionally, many municipalities implement watering restrictions for all outdoor uses in response to decreasing water availability and increasing demand. Water stress in BC is likely to worsen in response to climate change. Seasonal mean air temperatures at most observing stations in B.C. have increased by at least +0.5 to +2.5°C since 1950 (Bush et al., 2014). Over B.C. as a whole, climate model projections indicate further increases of +1.0 to +3.8°C for the summer season and +1.1 to +3.9°C for the winter season by the middle of the twenty-first century (ECCC, 2016). Accompanying regional increases in air temperatures, changes in the intensity and seasonal distribution of precipitation are also projected to occur, although there is large uncertainty on the sign and magnitude of changes by mid-century; over B.C., projected changes range from −2.8% to +17.8% in summer and +1.5% to +17.9% in winter precipitation. Southern and northern BC are likely to experience greater rates of warming, while central BC is likely to experience a greater increase in precipitation (Pacific Climate Impacts Consortium, 2013). Taken together, changes in temperature and precipitation are projected to affect regional freshwater hydrologic regimes (Zwiers et al., 2011). In western Canada, projections show that existing glaciers will shrink 60–80% in volume, with some disappearing by 2100 (Clarke et al., 2015). Nivo-glacial hydrologic regimes will shift toward pluvio-glacial, altering the timing and quantity of downstream freshwater supply. Along the coast, minimum losses of 50% of glacial volume are anticipated for even the lowest emissions scenario. Snow-melt dominant regimes will shift to be rainfall-dominant, leading to reductions to both winter snowpack and late summer flows and increases in winter flooding and summer drought, especially in the south (Merritt et al., 2006; Mantua et al., 2010; Shrestha et al., 2012).
Withdrawals from groundwater and the limits to groundwater supply are not well-recorded in the province. Until the advent of the Water Sustainability Act in 2016 (https://www2.gov.bc.ca/gov/content/environment/air-land-water/water/laws-rules/water-sustainability-act), licensing of groundwater was not required. Also under the Water Sustainability Act, there is increased emphasis on maintaining adequate stream flows to meet eco-system requirements which were not in place when many agricultural water licenses were granted. Moreover, there are additional pressures on water resources from fracking operations within the province (Parfitt, 2017). In fact, there is a lack of reliable information on water use data from all sectors which greatly undermines management of water resources (Parfitt et al, 2012). Adding to these challenges overall water demand in southern BC is projected to increase as the population is expected to grow by 1.4 million by 2025 (BC Ministry of Environment, 2008).
The projected changes to water availability in BC will have serious implications for agriculture. Currently, agriculture accounts for 70% of consumptive water use in some areas of the province.) Reduced water availability may lead to crop failures and place an extreme financial burden on farmers (Crawford and Beveridge, 2013). Similarly, changes in climate may necessitate a transition to crops better suited to the climate, the costs of which can be prohibitive. These challenges arise at a time when the emphasis on BC agriculture has never been higher. Approximately 50% of BC's agricultural products are supplied by local farmers and the importance placed on growing local food is increasing. At the same time, agriculture faces pressures from competing land uses and volatile international markets (Crawford and Beveridge, 2013). There is an immediate need to understand future water availability and water demand in order to support BC agriculture, and the integration of climate science, climate model projections and agricultural water management has been recommended as an important step toward a resilient agricultural sector (Crawford and McNair, 2012). It is clear then that greater understanding of climate change and its impacts on water demand is required to effectively manage BC's agricultural water resources for the future.
The most detailed studies on water supply and demand for multiple uses have been undertaken in the Okanagan Basin in S. British Columbia. Consequently, in this paper we examine the Okanagan Basin in more detail. It is one of the few watersheds that is not glacier fed and that also does not have any major hydro-electricity developments. The Okanagan R. is a tributary of the Columbia with 8,000 km2 of the basin lying in Canada. The climate in the lower elevations is semi-arid and crops require irrigation. The region has a mixture of high–value horticultural crops (wine-grapes and tree fruits) and beef and dairy production. There is a growing urban and rural-residential population, and earlier studies have indicated that outdoor water use through irrigation of agricultural and non-agricultural lands will potentially increase in response to climate change and urban development. Estimates for the period 1995–2006 indicated that agricultural irrigation accounted for 54%, non-agricultural irrigation for 24% of total water use and the remaining 22% accounted for domestic, industrial, commercial and institutional indoor use (Van der Gulik et al., 2010). Around 72% of irrigation water came from surface supplies, 23% from groundwater and 5% from reclaimed water (Okanagan Basin Water Board, 2011). Agricultural water use was predicted to increase by 50% between 2010 and 2040 in response to climate change and agricultural expansion and urban water use by 300% in response to climate change and growth (http://obwb.ca/wsd/wp-content/uploads/2014/07/OWSD_Phase3_Scenarios.pdf). In addition, the Okanagan provides a large portion of the breeding habitat for the Columbia River sockeye salmon population, and there has been considerable effort by the Okanagan Nation Alliance (ONA, www.syilx.org) and Partners to restore the sockeye salmon run including the development of a decision support system for managing Okanagan lake flows for fish (Hyatt et al., 2015).
Supplying water to all of these needs plus those for other ecosystem requirements is potentially conflict ridden considering that supply is dependent on highly variable annual snowpack (https://www2.gov.bc.ca/gov/content/environment/air-land-water/water/water-science-data/water-data-tools/snow-survey-data). Since the drought of 2003, there have been several initiatives to avoid conflicts among water users (particularly agricultural, domestic users and government departments protecting environmental flow needs) and to plan for the future through dialogue (Cohen et al., 2006; Melnychuk et al., 2016) and scientific assessment of water resources (Merritt et al., 2006; Neilsen et al., 2006; Okanagan Basin Water Board, 2011). Much of the dialogue has been led by the Okanagan Basin Water Board (OBWB) and its Stewardship Council, with a commitment to provide scientifically informed decision making (Melnychuk et al., 2016). As a result there has been an increase in drought planning, although the efforts are varied. Of the 19 major water purveyors in the basin, 16% have a full sub-watershed plan taking into account environmental flow requirements with staged water restriction; 21% have a drought plan, water conservation plan and staged water restrictions; 16% have a drought plan with staged water restriction, 42% have stage water restriction and 5% have no plan at all. Staged water restrictions are frequently imposed as a percentage water reduction to all users yet for agricultural users vulnerabilities differ depending on crop, soil and irrigation system type. However, there is some potential for adaptation to water shortages by changes in crop and irrigation practices.
The BC/Canada irrigation water demand model (IWDM) addresses the need for greater information regarding climate change and BC's water resources. This model defines the spatial boundaries of agricultural production taking into account the physical landscape—soil and terrain characteristics, and the managed landscape—agricultural land use. The IWDM was initially developed to measure and predict agricultural IWD for the Okanagan Basin and has since been extended, to incorporate non-agricultural outdoor water use and indoor water use (Van der Gulik et al., 2010). The results from the IWDM can be generated for an entire study region or for any number of sub-regions, for periods ranging from daily to annual. IWD projections can be assembled for agencies such as municipal governments and water purveyors, as well as geographic areas such as watershed sub-basins. This allows for the monitoring of future water demand over a range of spatial scales, acknowledges and presents the influence of local climatic conditions, and ultimately provides local decision-makers with site-specific IWD projections. The success of the Okanagan Basin Water Supply and Demand Study (OBWB, 2010) has lead to requests from local governments for the IWDM to be run in other BC regions. To date, the IWDM has been used to calculate current water demand in a 17 regions across BC (The Partnership for Water Sustainability in BC, 2015). With this information local water managers and stakeholders are better able to plan strategically for the future of BC's water.
Given the need for a regional understanding of the implications of climate change on future IWD, two case studies are presented:
1. A comprehensive review of projected IWD in BC's agricultural regions from 2000 to 2100, including the uncertainty surrounding projected IWD and the implications of developing additional land for agricultural uses.
2. An analysis of vulnerabilities and adaptation in water use in the Okanagan Basin in response to agricultural land use and irrigation management.
Methods
Study Areas
The study focuses on 17 regions in BC where agriculture is prominent or has the potential to be prominent in the future (Figure 1). The dimensions of the study regions examined in this paper evolved through previous applications of the IWDM. It was initially developed for the Okanagan Basin and its successful application in the Okanagan Basin Water Supply and Demand Study resulted in requests from other municipalities and regional districts. The nature of subsequent studies and the dimensions of the modeling regions were thus defined by the requesting administrative or civic organization. Thus some regions conform to regional district boundaries and others to river basins (Figure 1; Table 1). The Cariboo region as represented in the current study is just a small fraction of the Cariboo Regional District area. Regardless of the motivations behind their origins, the study regions are all host to significant agricultural activity. The Agricultural Land Reserve (ALR) in the study regions ranges between ~2,200 ha (S. Gulf Islands) to ~195,000 ha (S. Thompson) of which only a small fraction is irrigate, between < 1% (Cariboo) and 32% (Cowichan) (Table 1). Agricultural capability class (1–4) land, considered suitable for crop cultivation, also varies among regions. Generalized information (https://www.alc.gov.bc.ca) indicates that, within the ALR, coastal regions have ~74%, and interior regions have ~55–60% class (1–4) land, with the exception of the Cariboo region which has around 37%. Much of the remaining ALR area is in pasture and range. The source of water for irrigation was identified by linking agricultural lots to surface water licenses (Table 1). Lots not linked to surface water licenses were, by default, assigned to groundwater sources, and where possible specific aquifers. Details on specific subbasins and aquifers sources are available in the IWDM reports for specific regions (https://www2.gov.bc.ca/gov/content/industry/agriculture-seafood/agricultural-land-and-environment/water/water-management/agriculture-water-demand-model). The Okanagan region also has a small supply ~5% of reclaimed water. However, it should be noted that the production of fresh fruits and vegetables requires potable water, so reclaimed water is only a possibility for non-food crops (https://www.canadagap.ca/). The regions cover most of Southern British Columbia which has a widely varied landscape, characterized by coastal valleys, high mountain ranges and inter-montane plateaus and basins. Climate is also highly variable resulting in vegetation types ranging from coastal temperate rainforests to dry interior forests, sage brush and grasslands. Growing season effective precipitation (EP) (rainfall > 5 mm) and potential evapotranspiration (ETo) (Table 1) were derived from the climate data sets used to run the IWDM (see below for details). Growing season mean EP ranged between 59 mm (N. Thompson) and 265 mm (Fraser Valley) and mean ETo between 400 mm (Cariboo) and 634 mm (Okanagan) with the largest moisture deficits (ETo-EP) occurring in the Okanagan region.
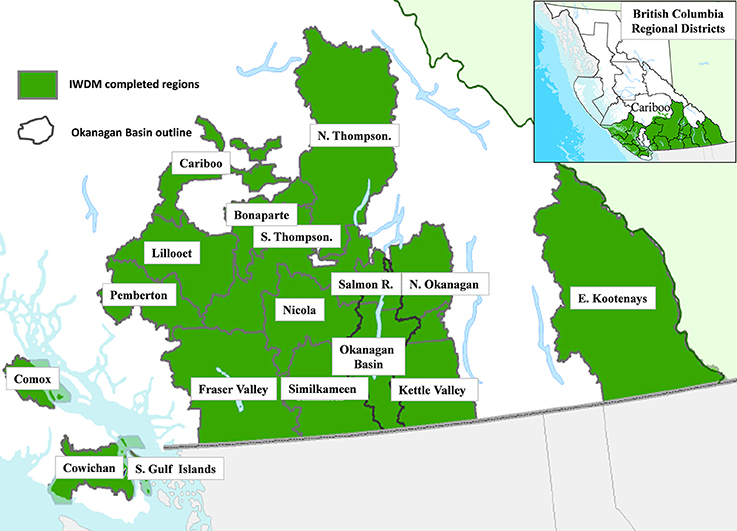
Figure 1. Map of British Columbia regional districts and IWDM study regions.
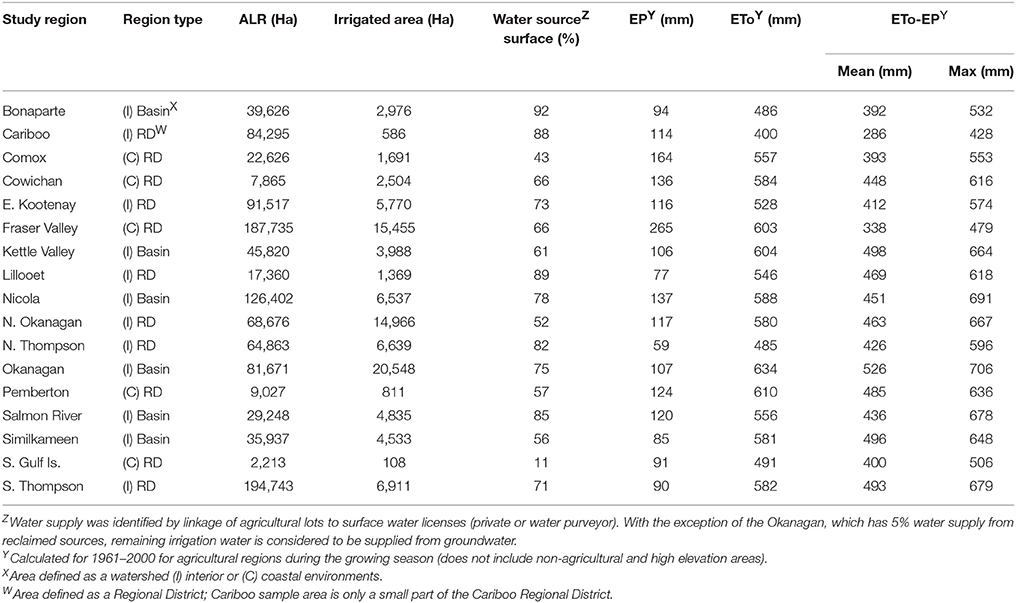
Table 1. Regional characteristics: agricultural land reserve (ALR), irrigation water source, mean growing season effective precipitation (EP) and potential evapotranspiration (ETo).
IWDM
The IWDM is driven by detailed land use data and gridded precipitation and temperature data. Land use information comprised of mapped crop type, irrigation system, and soil type, was collected for all study regions and stored in a GIS database (Van der Gulik et al., 2010). Land use was represented as cadastral parcels that denoted property boundaries. These parcels were divided into polygons according to crop, irrigation and soil texture. The IWDM calculates IWD for each polygon for each day within the modeling period (Van der Gulik et al., 2010; Neilsen et al., 2015). Daily temperature data were used to calculate potential evapotranspiration in each climate grid cell using a modified Penman–Monteith method (Allen et al., 1998). Daily crop water use was calculated from potential ET modified by specific crop coefficients, crop rooting depth and rooting efficiency. After accounting for surface evaporation, available water stored in the soil and daily effective precipitation (>5 mm), IWD was calculated based on the daily crop water use, modified by irrigation system efficiency and losses to deep water percolation. Available water storage capacity and surface evaporation were determined by soil texture and losses to deep percolation by combinations of soil texture and irrigation system type. Details of coefficients used in the model are found in Van der Gulik et al. (2010). The IWDM was validated using pump data from a major water purveyor in the Okanagan Region, South East Kelowna Irrigation District. Because both agricultural irrigation and all other out water uses (domestic outdoor, parks and recreation outdoor, domestic, commercial, industrial and institutional indoor), were supplied through the same distribution system, output from the full version of the water demand model, which accounts for all of these uses (Van der Gulik et al., 2010), was used in the validation (Supplementary Figure 1). Weekly modeled and measured water use for the years 1995 to 2006 were well-correlated (R2 = 0.91; p < 0.01).
IWDM Specifications
Agricultural Land Development
With a changing climate and a predicted increase in demand for agricultural products in the future, there is the potential for the expansion of land used for agricultural purposes. Land currently regarded as unsuitable may become suitable with warming temperatures and changing precipitation patterns (Neilsen et al., 2017). Further, increased demand for agricultural products may make agriculture more economically attractive. Accordingly, land that was determined to be suitable for irrigated agriculture was included in the simulations. Criteria included slope, elevation, current use, distance to water source, and presence in the Agricultural Land Reserve with an agricultural capability class of 1–4 (Supplementary Table 1). Depending on local factors, parcels of suitable land were assigned alfalfa or apple as their crop type.
Seasonality of Irrigation Water Demand
Within the IWDM, the start and end of each crop's growing season are determined by internal temperature-based rules driving crop phenology (Van der Gulik et al., 2010). This allows the start, end, and length of the growing season to change in relation to the influences of climate change. For example, the growing season may begin earlier or end later as the result of warmer temperatures. However, it must be noted that this approach also potentially challenges the current legislated irrigation season boundaries developed in response to previous climate normals.
Climate Data
The IWDM was run with both historical and future climate data. Observed daily historical climate data was based on the 300 arc second (~10 km) gridded ANUSPLIN dataset (1961–2010) (McKenney et al., 2011). To model past and project future IWD for each region in BC, simulated temperature and precipitation (1961–2100) from an ensemble of climate models under historical and two future global socio economic development scenarios were used as input to the IWDM. Daily temperature and precipitation data were obtained from archived Coupled Model Intercomparison Project Phase 5 (CMIP5) simulations by GCMs and ESMs driven by scenarios representing potential future paths of global socio-economic development. These scenarios, Representative Concentration Pathways (RCPs), differ according to the concentration of greenhouse gas emissions (GHG) that may result from different development paths (Meinhausen et al., 2011). Four RCP scenarios, 2.6, 4.5, 6.0, and 8.5 indicate possible radiative forcing values (W·m−2) in 2100 relative to pre-industrial values. For the purposes of this study, the RCP2.6 scenario was excluded as it seemed unlikely that its assumptions would be borne out. It assumes that global GHG emissions will peak between 2010 and 2020, with emissions declining after that. Additionally, RCP6.0 was omitted as it represents a middle-ground between RCP4.5 and RCP8.5, and offered comparatively less insight into the range of potential changes in IWD.
Previous research has recommended using a multi-model and multi-climate forcing approach to represent uncertainty in IWD projections (Gosling et al., 2011). Accordingly, data from a subset of five climate models (Table 2), selected from the CMIP5 ensemble to span the range of projected temperature and changes in the region (Cannon, 2015), was used to drive the IWD for the RCP4.5 and RCP8.5 scenarios, with outputs from each scenario condensed into an ensemble mean. To complement the ensemble mean, which reduces variability, smoothing out projected values, the range, standard deviation, and coefficient of variation of projected values were also calculated. This workflow is described in Supplementary Figure 2.
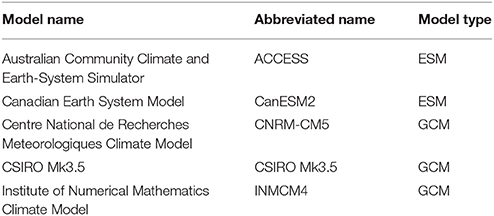
Table 2. Global Climate Models (GCMs) and Earth System Models (ESMs) used in this study.
Downscaling
To accommodate the effects of complex terrain in the region on climate conditions, fine-scaled (500 m) gridded datasets of daily minimum, maximum temperature and precipitation were downscaled from the historical ANUSPLIN and future GCM climate data. The 300 arc second (~10 km) historical ANUSPLIN dataset for 1951–2010 (McKenney et al., 2011) was spatially-disaggregated using a local lapse rate upsampling algorithm (Wang et al., 2006) and then bias corrected so that climatological monthly means matched the Pacific Climate Impact Consortium PRISM climatology https://www.pacificclimate.org/data/prism-climatology-and-monthly-timeseries-portal. This produced historical daily climate surfaces for 1961–2010. GCM and ESM outputs for British Columbia (Table 2) were statistically downscaled onto the ANUSPLIN grid using the Bias-Corrected Constructed Analogs with Quantile mapping reordering (BCCAQ) algorithm (Werner and Cannon, 2016) to produce daily climate surfaces for 1961–2100. http://www.pacificclimate.org/data/statistically-downscaled-climate-scenarios. Outputs were then spatially disaggregated and bias corrected in the same manner as the historical ANUSPLIN dataset.
Data Analysis
The ensemble means of projected IWD were summarized as annual totals and presented for 2000–2100 for each region. Simple linear regression using the least squares approach was applied to the projected IWD to show the average rate of increase over the study period for each region. Additionally, the range of potential IWD-values for each year in each region is presented. Uncertainty was captured through absolute and relative uncertainty. Absolute uncertainty was calculated as the standard deviation of the five model outputs for each year, for each scenario. As with the IWD, simple linear regression was applied to the standard deviation to show the trend in standard deviation over the study period. Relative uncertainty was represented as the coefficient of variation for the first and last year of the study period for each region, and each scenario. This illustrates the change in uncertainty over the study period. Finally, IWD that may result from the development of agricultural land was also summarized annually and presented for 2010–2040.
Okanagan Basin Case Study
Two detailed land use data sets were assembled for the Okanagan Basin, one surveyed in 2005–2006 (Van der Gulik et al., 2010) and the second in 2013–2014 according to the same methodology. Both land use datasets (labeled 2006 and 2014), were run through the IWDM using the historical climate data allowing comparisons of land use, irrigation system use and water use. Thirty-two crop production systems were identified in 2006 and 40 in 2014. In each case there were 18 different types of irrigation management system resulting in a potential 536 crop × irrigation combinations in 2006 and 720 combinations in 2014. Because of the large number of combinations, results are presented for grouped data: 6 crop classes reflecting rooting depth and function; 5 soil texture classes reflecting available water storage capacity and 4 irrigation system classes reflecting efficiency (Supplementary Table 2). The region has the highest in-season water deficits (ETo-EP) in Southern BC (Table 1). Water shortages can occur because of (1) low spring mountain snowpack (SWE) causing low reservoir storage; (2) low in-season precipitation (EP) and (3) high in-season potential ET (ETo) (Supplementary Figure 3) These do not necessarily coincide with provincially declared hydrologic droughts associated mainly with low late summer flows in unregulated streams. Mountain snow pack is highly variable, ranging between 212 and 775 mm in April and 13–775 mm in May (Supplementary Figure 3A). The most notable water shortages have occurred when low in-season EP coincides with high in-season ETo as in 2003 for example (Supplementary Figure 3B). These occurrences lead to high in-season water deficits (707 mm in 2003) and the low EP also results in low stream flows and an increased dependence on storage resulting in greater vulnerability for agriculture. Two indices of vulnerability were created. The first index was a ratio of IWD to potential evapotranspiration (IWD/ETo) which indicated the relative vulnerability of crop/irrigation system/soil combinations to water demand. The second index was a ratio of IWD to the maximum allocations for selected water purveyors which usually would be reduced in response to drought. In all cases, the selected purveyors have water storage in high elevation reservoirs which supply irrigation needs in the growing season. Drought management tools are based on “trigger” graphs related to reservoir levels throughout the year usually with five stages, 0–4. Restriction on agricultural producers vary and may call for a reduction in water use in July and August to 50–70% of maximum allocation for stage 3 to a complete restriction of irrigation for stage 4. The water allocation vulnerability index compared estimated water use with maximum allocation values (550, 686, and 800 mm/yr respectively), for three irrigation districts from the North, Central and South Okanagan.
Results
Irrigation Water Demand (IWD) in British Columbia Agricultural Regions
Water use from 1961 to 2010 was calculated using both historical climate data and the suite of downscaled climate models (Table 2). Historical IWD varied widely among region, ranging between median values of 0.6 MCM (m3 × 106) for the Southern Gulf Islands region and 115 MCM for the Okanagan Region (Figure 2). In general, similar median results were found for the climate model simulations over the historical time period (1961–2010), although the range was greater for the ensemble model outputs due to sampling multiple realizations of natural climate variability by the five different CMIP5 climate models. The inter-annual range for the historic data set falls within the extreme values generated by the five CMIP5 models and within the 95% confidence interval of the ensemble mean. There is a slight upward trend in the ensemble mean that is not evident in the historic data.
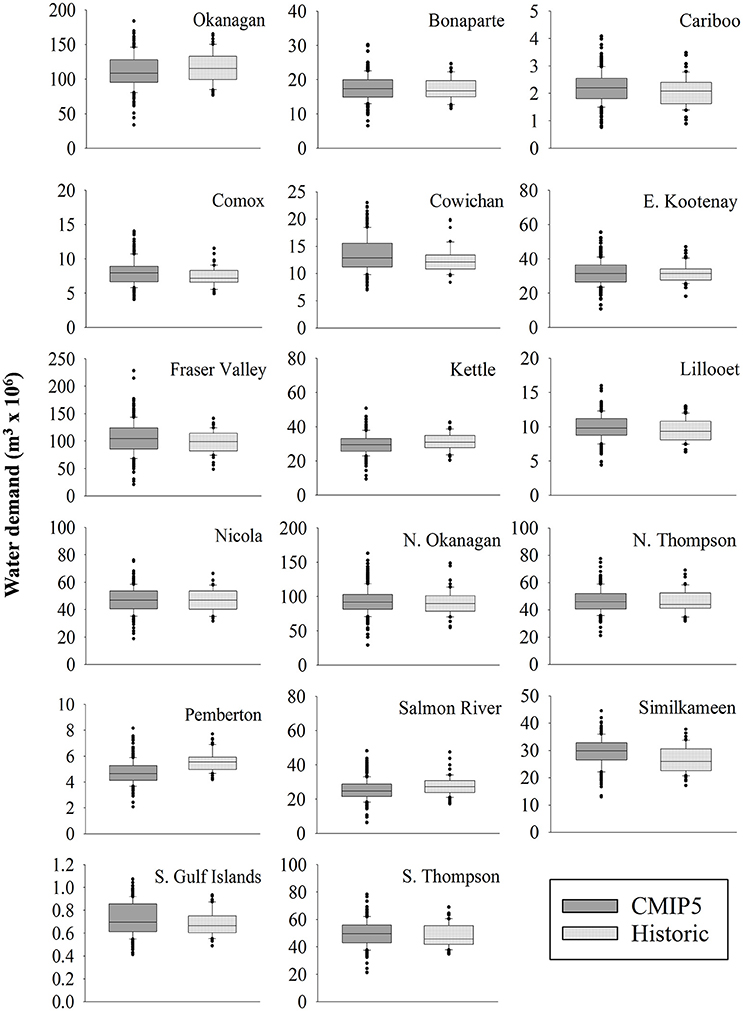
Figure 2. Boxplots of modeled annual IWD for 16 agricultural regions in British Columbia in response to greenhouse gas emissions (RCP 8.5) and historical climate data for the period 1961–2010. Greenhouse gas emission scenarios data include output from five climate models ACCESS, CanESM2, CNRM-CM5, CSIRO Mk3.5, INMCM4.
Trends in IWD between 2000 and 2100 were derived from linear regression lines fitted to the annual ensemble means. In all study regions IWD was projected to increase between 2000 and 2100 (Table 3). For the RCP4.5 scenario increases in IWD ranged from 21.3 to 63.7%, with 14 of the 17 regions expected to see increases >30%. Under the RCP8.5 scenario, every region was projected to have greater IWD relative to the RCP4.5 scenario. Projected increases in IWD under RCP8.5 ranged from 29.8 to 114.1%, with 14 of the 17 regions experiencing >40% increase in IWD. Increases in IWD were highly variable among regions. In both scenarios the Cariboo and S. Thompson regions were projected to see the greatest increases in IWD. Conversely, the regions on or adjacent to Vancouver Island (Comox, Cowichan, and S. Gulf Islands) were projected to see the smallest increases in IWD. Increases in IWD were also highly variable among scenarios in each region. The difference between the RCP4.5 and RCP8.5 scenarios was most pronounced for the Cariboo, Kootenay, and S. Thompson regions. Those regions near the south coast (Comox, Cowichan, S. Gulf Islands, Fraser Valley) had the least variation between scenarios.
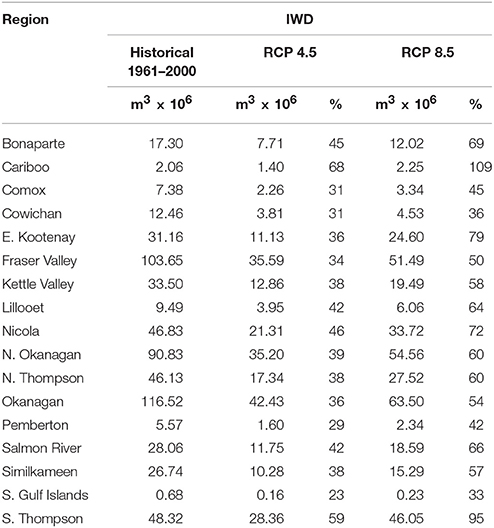
Table 3. Historical average IWD (1961–2000) and projected increase in demand (2000–2100) in response to two greenhouse gas scenarios.
To clarify the reasons for the differences between coastal and interior regional responses, changes in ETo and seasonal water deficits (ETo-EP) were examined for CanESM2 RCP8.5 scenarios for the S. Gulf Islands and Cariboo regions. In the coastal example, there was relatively little change in either ETo or ETo-EP throughout the century (Supplementary Figure 4A). The larger spread in ETo-EP than ETo was due to the range in EP data. In the Interior example, both ETo and ETo-EP increased linearly over time, and again the range in EP data increased the spread for the water deficit calculation (Supplementary Figure 4B). In both cases, there was no trend in precipitation data.
Uncertainty
Absolute uncertainty (σ) increased over the study period (2000–2100) for all regions in both scenarios (Table 4). It was also greater in RCP8.5 than RCP4.5 scenarios in all regions at the end of the study period. In some regions, the difference in absolute uncertainty between the two scenarios in 2100 was substantial (e.g., Kootenays, North Okanagan) while in others the difference was minimal (Southern Gulf Islands).
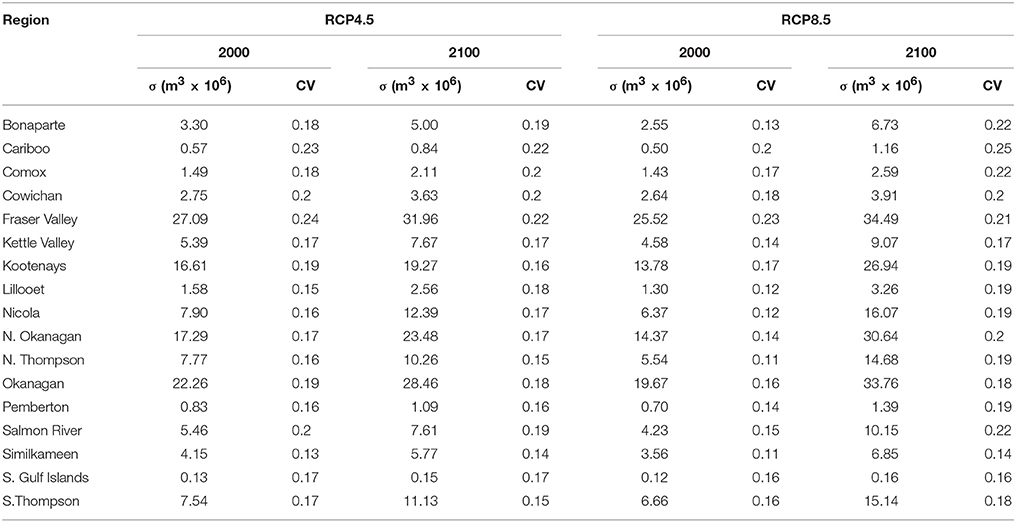
Table 4. Uncertainty in projected IWD 2000–2100.
A comparison of relative uncertainty (CV) at the beginning and end of the study period shows that uncertainty in the RCP4.5 scenario was generally stable. Relative uncertainty remained the same or slightly decreased in 12 of 17 regions in the RCP4.5 scenario. In contrast, relative uncertainty in the RCP8.5 scenario increased in every region other than the Fraser Valley and S. Gulf Islands. Comparing the two scenarios, RCP8.5 had lower relative uncertainty in all 17 regions in 2000, but a slightly greater relative uncertainty in 11 of 17 regions in 2100.
Agricultural Land Development
As would be expected, projected IWD increased as additional agricultural land was developed (Table 5). Projected increases for scenario RCP4.5 and RCP8.5 were nearly identical in response to development relative to their respective baselines. Just as in the non-development scenarios, interregional variation in IWD was considerable, ranging from a projected ~10–2,477% increase in both scenarios. It is important to note that a region's increased IWD is dependent on the amount of potential agricultural land available in conjunction with the effects of climate change. Thus, in this case interregional variation was less influenced by local climatic conditions and more by differences in the amount of agricultural land available.
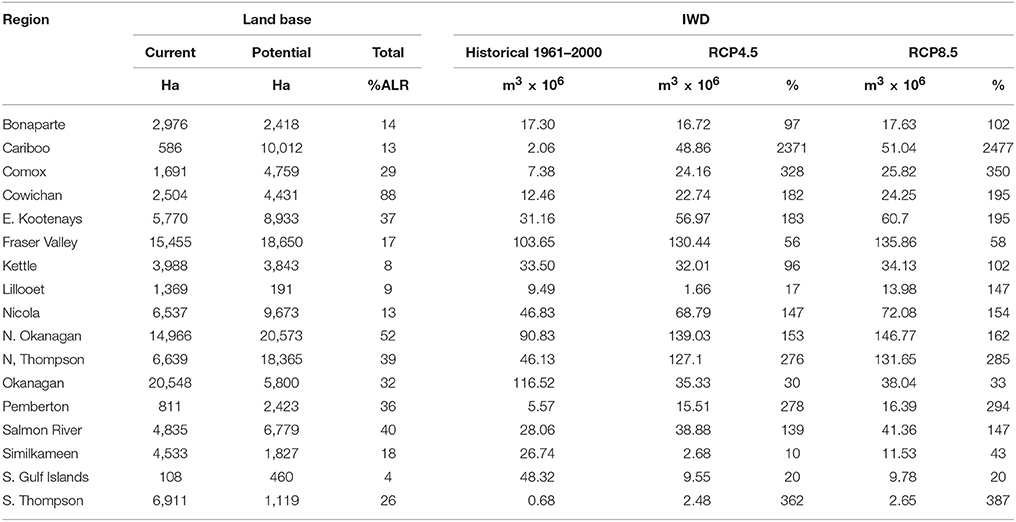
Table 5. Current and potential (additional) land base and projected additional IWD in response to 100% increase in agricultural land development and two greenhouse gas scenarios for BC agricultural regions by 2100.
Okanagan Basin Case Study
Land Use Characteristics
Due to slight shifts in crop area and crop type, there were slight differences in the texture of irrigated soils between the 2006 and 2014 surveys (Table 6) and over 50% of the irrigated area had medium textured soils which were predominantly sandy loams (Supplementary Table 2). Use of sprinkler irrigation systems were dominant in both land use surveys but had decreased by 10% in 2014 with a concomitant increase in more efficient micro-irrigation and drip systems. The area under grapes and other deep rooted crops (primarily forage crops) increased in the 2014 survey while the area under medium and shallow rooted crops decreased. Efficient irrigation systems (drip and micro-irrigation) were associated with horticultural production as they are best adapted to crops grown in rows (Figure 3A). The choice of irrigation systems is more limited for pasture and forage crops although there was some evidence of change from less efficient gun to sprinkler systems in 2014. Between 2006 and 2014 there was a large shift to efficient irrigation systems in horticultural crops with 68% of the horticultural area under drip and micro-irrigation in 2014 compared with 38% in 2006 (Figure 3B).
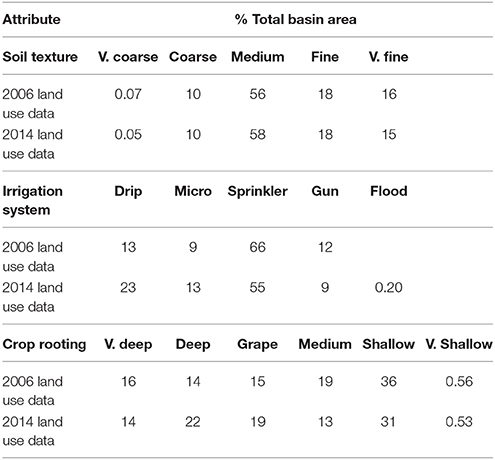
Table 6. Areal distribution of grouped soil texture, irrigation system, and crop rooting attributes for the Okanagan basin in 2006 and 2014.

Figure 3. Areal distribution of (A) Okanagan Basin major cropping and irrigation systems and (B) horticultural irrigation systems in 2006 and 2014.
Relative Vulnerability Index (IWD/ETo)
There was considerable annual variation in the overall relative vulnerability index (Figure 4A) which was related to growing season temperatures and precipitation. The magnitude of the relative vulnerability index varied annually and was largest in 1998, 2002, and 2003 (hottest and driest years) and lowest in 1997 (coolest and wettest year). In hot dry years, between 60 and 70% of the basin irrigated area had a relative vulnerability index>1.0 which fell to < 5% in wet cool years (Figure 4B). Crops grown on finer textured soils had lower relative vulnerability indices than those grown on coarser soils, and in general shallow rooted crops grown on coarse textured soils the highest relative vulnerability indices (Figures 5A,B). Irrigation system also greatly affected the relative vulnerability index with gun and flood irrigation giving rise to high relative vulnerability indices, even for deep rooted crops, and drip irrigation resulting in low relative vulnerability indices (Figures 5C,D).
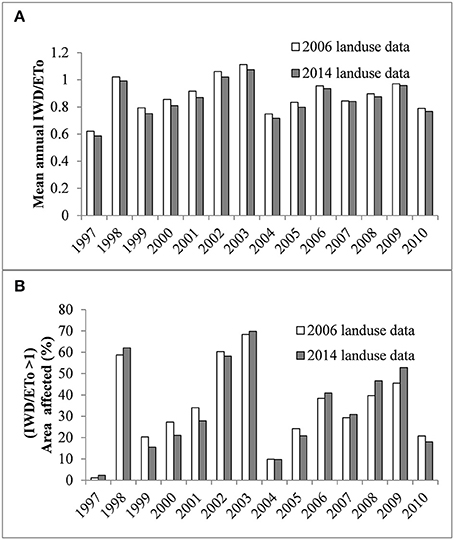
Figure 4. Annual climatic effects on (A) the relative vulnerability index (IWD/ETo) and (B) the area with IWD/ETo>1 in the Okanagan Basin for land use data collected in 2006 and 2014.
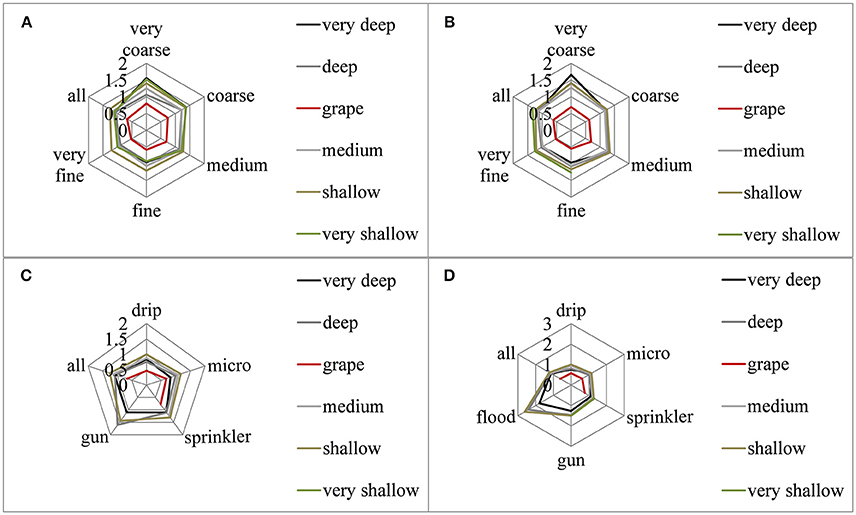
Figure 5. Relative vulnerability index (IWD/ETo) for Okanagan Basin cropping systems in 2003, in response to crop rooting depth and (A) soil texture for 2006 landuse data, (B) soil texture for 2014 land use data, (C) irrigation systems for 2006 land use data and (D) irrigation system for 2014 land use data.
Water Allocation Vulnerability Index (IWD/Maximum Water Allocation)
Estimated annual IWD was compared with maximum allocation values (550, 686, and 800 mm/yr., respectively), for three irrigation districts from the North, Central and South Okanagan. All three regions had over 50% of their area in medium textured soils, mainly sandy loams (Table 7). The Central Okanagan had more coarse textured soils than the other two regions. The three irrigation districts had different cropping profiles, with the N. Okanagan dominated by pasture and forage crops, which can be both deep and shallow rooted (Supplementary Table 2), and inefficient irrigation systems, when compared to the Central and S. Okanagan. Between 2006 and 2014, the area in wine grapes had doubled in all three regions and the amount of drip irrigation had increased five-fold in the Central Okanagan. Maximum allocations were exceeded in all regions with the area affected depending on year and region (Figure 6). There were slight differences in vulnerability for the two land use surveys. For the 1996 survey, between 1997 and 2010, allocations were exceeded in more than 50% of the area in 11 years for the N. Okanagan, in 5 years for the Central Okanagan and in 1 year for the S. Okanagan. For the 2014 survey, allocations were exceeded in more than 50% of the area in 8 years (N. Okanagan), 4 years (Central Okanagan) and 0 years (S. Okanagan) In 2003, one of the hottest, driest years, maximum allocations for the 2006 land use data were exceeded for 93%), 84% () and 53% (of the irrigated area respectively North, Central and South Okanagan districts and for the 2014 land use data they were exceeded for 91, 85, and 47% of the irrigated area for the three districts respectively. These results indicate an imbalance between expected maximum irrigation requirements and maximum allocation. The magnitude of the water allocation vulnerability index ranged between 0.55 and 2.26 for the North Okanagan, between 0.46 and 1.94 for the Central Okanagan and between 0 and 1.38 for the South Okanagan. In all locations, crops irrigated with inefficient systems (gun and sprinkler) were most affected regardless of rooting depth and those irrigated with drip and micro sprinklers were usually minimally affected. Wine grape crops were rarely affected, mainly because the IWD model accounts for the lower water requirements for their production. The effects of crop production system, soil texture and irrigation system on the magnitude of the water allocation vulnerability index are illustrated for the North Okanagan in 2003 (Figure 7). Crops grown on very coarse or coarse textured soils had the highest vulnerability indices regardless of rooting depth (Figures 7A,B). Greatest vulnerability was associated with crops grown with inefficient irrigation systems, flood and gun, and least vulnerability was associated with crops grown with drip and micro-irrigation (Figures 7C,D).
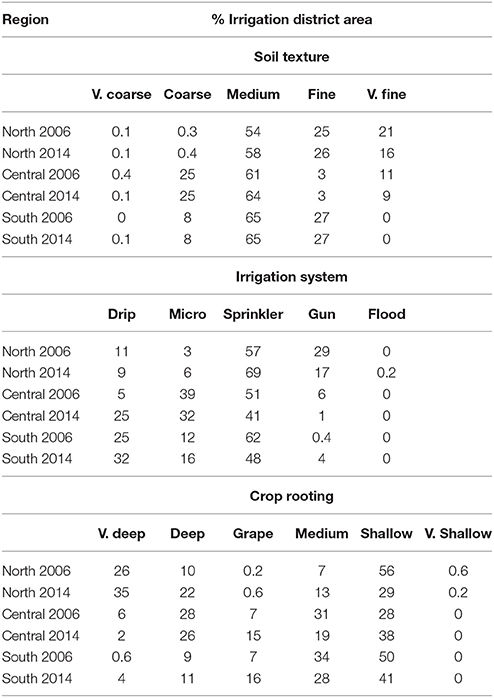
Table 7. Areal distribution of soil texture groups, irrigation system groups and crop rooting groups for three Okanagan irrigation districts (North, Central, South) in 2006 and 2014.
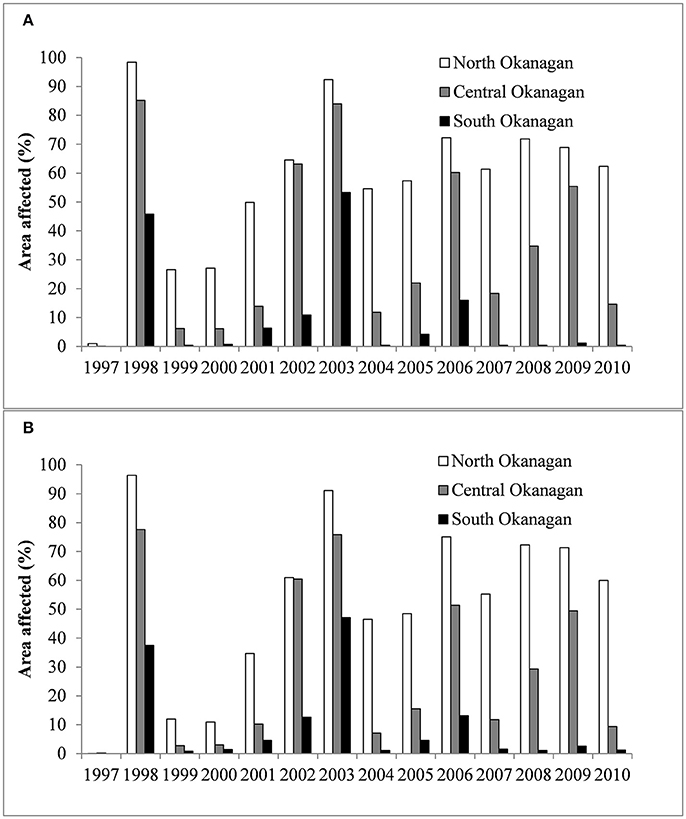
Figure 6. Area of irrigated land where IWD exceeded annual allocations in three irrigation districts from the Okanagan basin in response to (A) 2006 and (B) 2014 land use data.
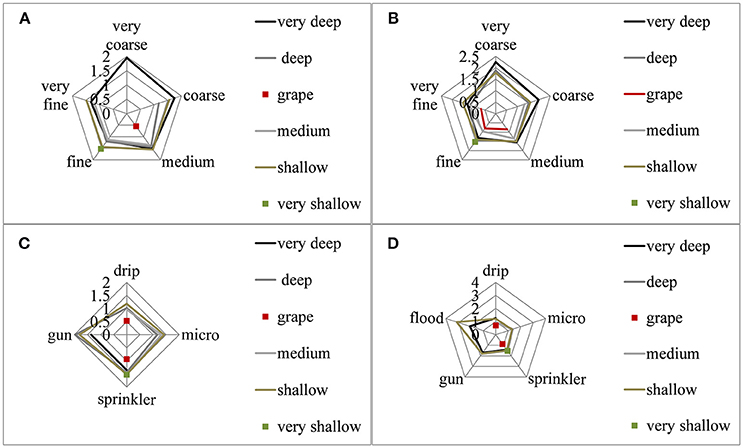
Figure 7. Allocation vulnerability index (IWD/Maximum water allocation) for cropping systems in 2003 in the North Okanagan, in response to crop rooting depth and (A) soil texture for 2006 landuse data, (B) soil texture for 2014 land use data, (C) irrigation systems for 2006 land use data, and (D) irrigation system for2014 land use data.
Discussion
Irrigation Water Demand (IWD) in British Columbia Agricultural Regions
The findings of this paper indicated that climate change alone will likely lead to significant increases in IWD in BC. Under the RCP4.5 scenario, which assumes emissions will peak around 2040 and decline thereafter, IWD in every region was projected to increase >20%, while for the majority of regions a >30% increase in IWD is expected. In the higher GHG emissions scenario (RCP8.5) every region in BC was projected to experience a >30% increase in IWD, while the majority will face a >40% increase. These findings project significant increases in agricultural IWD in BC, and align with previous research on the Okanagan Basin (Neilsen et al., 2006). Past studies at the regional scale have projected dramatic increases in IWD as a result of climate change (Fischer et al., 2007; Rehana and Mujumdar, 2013; Wada et al., 2013). The increases projected in IWD for BC reiterate the need to enhance water infrastructure and decision-making processes and the projections included in this paper can be incorporated into future decision-making to address these challenges. However, the uncertainty associated with future water supply in the region (Merritt et al., 2006; Shrestha et al., 2012; Clarke et al., 2015) highlights the need to integrate climate science and future water demand with changes in water supply at the basin and sub-basin scale in order to develop sound decisions. This is currently of increasing importance as BC moves to license groundwater. The results of these regional water demand model runs have been incorporated into a new web-based tool which allows applicants for either groundwater or surface water licenses to calculate the agricultural water demand for their properties (http://www.bcagriculturewatercalculator.ca/), While substantial in all regions, the projected increases in IWD were not uniform across the province. Our findings illustrate that the relationship between GHG emissions and IWD is unique to each region. Interregional variation in projected IWD highlights the significant influence of local climatic conditions. Under both scenarios the range of projected increases was large (RCP4.5 ~20–60%, RCP8.5 ~30–115%). Changes in temperature affecting potential ETo appeared to be the major driver of increased water demand, as there were no apparent trends in precipitation data. These temperature effects were greater for Interior than for Coastal regions. This stresses the need for a localized and regional approach to water management in BC (Cohen et al., 2006; Melnychuk et al., 2016) as the policies and regulations put in place for one region may not work in another.
The course of global socio-economic development will also have an uneven impact on BC's IWD. Projected IWD did not increase uniformly between the RCP4.5 and RCP8.5 scenarios in all regions. This suggests that different regions have different sensitivities to climate change drivers. In certain regions, a future where GHG emissions grow exponentially may lead to a near doubling of IWD relative to a future where emissions decline after 2040. However, in other regions the trend in GHG emissions has a limited effect on future IWD. Whether future GHG emissions follow a RCP4.5 or RCP8.5 path will have serious implications for the climate sensitive regions in the province. Accordingly, the integration of climate science and water resource planning should be an ongoing process. Only through continued research and reporting on rates of GHG emissions and IWD will local decision-makers have access to the most up-to-date information necessary for sound decision-making.
Ongoing research into future water demand will also help to address the uncertainty surrounding projected IWD. While relative uncertainty can be regarded as low, absolute uncertainty would be regarded as considerable for regional water purveyors. In the majority of regions the absolute uncertainty surrounding projected IWD in 2100 was comparable to the projected increase in IWD. Further, the uncertainty grew when comparing RCP8.5 to RCP4.5. Uncertainty in projected IWD is related to the level of understanding of our climate's response to increasing GHG emissions (Figure SPM.10 of https://www.ipcc.ch/pdf/assessment-report/ar5/wg1/WG1AR5_SPM_FINAL.pdf; Figure SPM.10 of https://www.ipcc.ch/pdf/assessment-report/ar5/wg1/WG1AR5_SPM_FINAL.pdf). As the climate moves away from historical norms, our understanding of the climate's response becomes weaker, and uncertainty increases. This explains the greater increase in both absolute and relative uncertainty found in the RCP8.5 scenario. While we can say with relative confidence that IWD will increase in the coming decades, the uncertainty of projected IWD emphasizes the need for a flexible and adaptive approach to water resource planning.
Similar to projected IWD, the contribution of agricultural land development to IWD will vary region to region. For some regions it could far exceed the increases brought by climate change alone, while for others agricultural development would contribute relatively little to increased IWD. This is contingent on the level of development, the amount of land available for development, and the region's sensitivity to climate change. Some regions, for example the Cariboo Region, have a large potential for increases in irrigated agriculture as much of the Agricultural Land Reserve is currently used for dry land ranching. However, the region is very remote, sparsely populated and poorly served by transportation networks, which may provide a substantial barrier to development. On the other hand, there may be increased opportunities for the production of high value horticultural crops in this region, particularly as minimum winter temperatures moderate. Neilsen et al. (2017), using phenology modeling and terrain analysis, showed that areas of the S. Cariboo region, particularly in the terraces adjacent to the Fraser R, would become suitable for sweet cherry production by the 2040s. At the other extreme, a region such as the S. Gulf Islands, has little potential available agricultural land and is also constrained by ground-water availability. These relationships have important implications for land use management: first, they again highlight the unevenness of projected IWD and the need for regional decision-making; second, they stressed that the benefits that may be brought by expanding the agricultural land base must be weighed against the potential costs and risks associated with increasing IWD. These might include the costs of new infrastructure; the costs of monitoring and modeling surface and groundwater source; environmental risks from reducing in-stream flows and aquifer levels; risks to producers if planting crops at their climatic limits etc. Accordingly, water resource planning should be undertaken at a regional level and adopt a long-term perspective.
Okanagan Basin Case Study
Considerable attention has been focused on incorporating science based decision making into water resource planning in the Okanagan Basin (Melnychuk et al., 2016) and there is on-going interest in pursuing both basin-wide drought and flood management strategies. The Okanagan water stewardship council, which is a long-standing committee of water professionals includes representives of As much of the region is supplied by large water purveyors, who have storage licenses for large upland reservoirs and/or withdrawal licenses from large valley bottom lakes, drought management strategies are largely aimed at retaining sufficient storage for winter and early spring withdrawals for non-irrigation purposes and instream flow requirements. Thus the likelihood of “drought” under these circumstances is increased by a combination of low winter snowpack, high in-season ET and low in-season precipitation. This type of drought differs from a hydrologic drought, declared by the Province, when low river flows threaten environmental flow needs in un-regulated streams. Projected increases in agricultural water demand due to climate change (up to 54%), while likely within the licensed volume for agricultural purposes (Neilsen et al., 2006) may not be met by future water supply (Merritt et al., 2006). Moreover, the findings of this study indicated that even within the recent historical climatic range, allocation of water resources may not be adequate to meet agricultural needs in some areas. In the N. Okanagan irrigation district, the area potentially vulnerable to under-allocation was >50% in all but the coolest and wettest years which was due to both a low maximum allocation value and to the crop profile in the region. Forage and pasture production systems which rely on less efficient irrigation systems (sprinklers, irrigation guns and flood irrigation) are the most vulnerable to under-allocation and comprise 73% of the irrigated area in the N. Okanagan, compared to around 50% in the basin as a whole. In contrast, the irrigation district in the S. Okanagan which had a much lower potential for under-allocation was characterized by a higher allocation value and only around 25% of the irrigated area in pasture and forage crops.
Unfortunately, the majority of irrigation districts and water purveyors in the basin have not defined maximum water allocations, so this type of analysis was not possible. However, there was a strong relationship between the relative vulnerability index (IWD/ETo) and the water allocation vulnerability index (IWD/max water allocation) with R2-values varying between 0.82 and 0.92 for the three irrigation districts (n = 10,000–124,722 land use polygons × 4 years). Taking this into consideration, if maximum allocations are imposed across the basin as drought planning continues, there is potential for considerable vulnerability to insufficient water availability for some production systems. That these vulnerabilities are already evident for historic climatic conditions before the 34–54% increase projected in response to climate change, or potential 30% potential increase in irrigable land, emphasizes the need for adaptive measures both in water use and drought planning.
Adaptation to potential shortfalls in water supply due to current production methods can best be achieved through changes in irrigation management. Conversion to low pressure irrigation systems (drip, micro-sprinkler, LP-center pivot) increases irrigation efficiency to 78% and greater. Such changes are already underway in the horticultural sector in the region where water was supplied to 38% of the irrigated area through micro-sprinklers or drip in 2006 and to 68% of the irrigated area in 2014. This provides a number of benefits to producers including the ability to target water spatially and temporally to meet plant demand; to produce plants which are tolerant of partially dry soils and to allow maintenance of the same irrigation practice under mild drought conditions if water use is well below maximum allocations. There are also options to increase efficiency within pasture and forage crops. Low pressure center pivot irrigation has been widely adopted in many regions. A recent study of Alberta irrigation districts indicated that 76% of the irrigated area was in the process of change to more efficient management and that mostly was due to the use of LP-center pivot systems (Wang et al., 2015). In the Okanagan basin, the small area of pivot irrigation increased from 442 to 484 ha between 2006 and 2014 with LP-center pivot from 1 to 67%. The extent to which the size of land holdings and topography limit the adoption of center pivot technology in this region is unclear and requires further study. The use of sub-surface drip (95% efficient) has also been adopted for forage corn, alfalfa and grass pasture in regions with severe water shortages including the US Great Plains (Lamm et al., 2012a) and Australia (Wood and Finger, 2006) and is gaining in popularity due to improved technology and crop production (Lamm et al., 2012b), despite some concerns about the economics of installation (Heard et al., 2012). There has been little adoption of this technology in the Okanagan region with a decrease from 43 to 3.2 ha between 2006 and 2014.
Other irrigation adaptation strategies include the use of deficit irrigation. In addition to the inherent efficiency found in deep-rooted grape vines, water use for wine-grape production is often controlled through planned deficits which reduce canopy development and enhance fruit quality (Keller, 2010). Use of small deficits, without detrimental effect has been reported for tree fruits (Marsal et al., 2009, 2010; Neilsen et al., 2016), but there is insufficient evidence for adoption as practical management tool to enhance fruit value and further research is required.
Adaptation to water shortages may also be addressed by drought planning, which requires the development of watershed supply information and models in addition to water demand modeling. Forecasting droughts on a seasonal basis is aided to some degree in regulated watersheds by understanding the role of storage, in particular the switch from stream to storage use and the requirements until the next freshet. Early use of stored water will often determine the imposition of watering restrictions and with early warnings producers may have some options to offset water shortages (Marsal et al., 2009, 2010; Neilsen et al., 2016). Drought planning is frequently approached by universal application of percentage reductions in water allocations in response to declared drought stages and this is often interpreted as a percentage reduction in current producer use. Cropping systems which have a low vulnerability index are already using less than the maximum allocation and likely have little room for further reductions in water use. Similarly, some systems, particularly in pasture/forage production may be chronically under-supplied unless the most efficient irrigation technology is adopted. Thus drought planning may need to take into account both a realistic development of water allocation thresholds and incentives for changes in irrigation management that go beyond the use of water pricing as the major mechanism for change (Melnychuk et al., 2016). A further option is the development of more water storage if there is sufficient water supply to fill new reservoirs.
In summary, future IWD will vary regionally across the province and in response to different GHG emission scenarios. These findings stress the importance of regional, adaptive decision-making undertaken with a long-term perspective that incorporates the latest climate science. A detailed analysis of the Okanagan Region illustrates the complexity of drought management issues. Vulnerability to a potential under-supply of water has been identified, particularly for the pasture/forage systems underpinning high value animal production which are typical of many agricultural regions in the province and may require economic support for farmers in the adoption of more efficient irrigation systems. In addition more research is required into the adoption of efficient water use practices by all water users Boland et al. (2005) documented considerable resistance to new irrigation practices in Australia for example, but the comparative land use surveys in the Okanagan region documented in this paper have shown widespread adoption of efficient irrigation systems by some sectors.
The current paper deals only with changes in annual demands in response to climate and expanded agricultural land use. To add to our understanding of future IWD, the IWDM can be used to track seasonal shifts in IWD as changes in the timing and volume of water demand have been highlighted as important not only to BC farmers, but also to the maintenance of stream flows for ecological requirements. Additionally, the IWDM could be used to examine the shifting composition of BC agriculture in response to climate change. It is unlikely that this will remain static over the coming decades as temperature and precipitation patterns shift.
The scope of this study was restricted to current and future agricultural IWD in relation to environmental changes brought about by climate change. These cannot be separated from climate change effects on water supply and other ecosystem requirements. Any decision regarding water management will also need to address requirements to provide ecosystem services as well as economic, demographic, and social drivers of water demand. Additionally, the impacts of non-agricultural water demand for both outdoor irrigation and indoor uses should also be factored into water management decisions. Such discussions necessarily will require input from both stakeholders and decision makers. A successful model for collaborative decision making is the Okanagan Water Stewardship Council (Melnychuk et al., 2016), which has a membership of local, regional, provincial, federal and First Nations planners and technical experts. In addition there are members from academia, professional associations and sector groups (forestry, agriculture, tourism). The group provides technical support, develops policy and participates in water science projects for the regional Okanagan Basin Water Board, a regional political entity with local government members. A recent collaborative project of this group with the Okanagan Nation Alliance on environmental flow needs highlights the importance of incorporating First Nations knowledge in collaborative decision making. Beyond the regions we have reported on in this paper, there is also major competition for both agricultural land and water resources from other industries. For example, the Peace River region in Northern BC will lose land to hydro-electric power generation after the construction of the site-C dam and considerable water resources are also being used by the oil and gas industry.
Author Contributions
DN and MB wrote the first draft of the article. DN and TV developed the IWDM. DN developed the vulnerability indices and analysis. SS and MB provided the GIS support. MB and IL ran the models and summarized the data. AC provided the downscaled climate data and interpretation. AW supported the land-use data collection and coordinated the Okanagan Basin Water Supply and Demand study.
Conflict of Interest Statement
The authors declare that the research was conducted in the absence of any commercial or financial relationships that could be construed as a potential conflict of interest.
Acknowledgments
We would like to acknowledge funding from AAFC for supporting the development of the IWDM and co-op student support. We also acknowledge the contributions of the BC Ministry of Agriculture, the Partnership for Water Sustainability and The Okanagan Basin Water Board for funding land use data collection and climate analysis. Wenda Mason BC Ministry of Environment oversaw the funding and execution of the Okanagan Basin Water Supply and Demand study. Ron Fretwell, RHF Systems Ltd. coded the IWDM.
Supplementary Material
The Supplementary Material for this article can be found online at: https://www.frontiersin.org/articles/10.3389/fenvs.2018.00074/full#supplementary-material
References
Allen, R. G., Pereira, L. S., Raes, D., and Smith, M. (1998). Crop Evapotranspiration Guidelines For Computing Crop Water Requirements. FAO Irrigation and Drainage Paper 56. United Nations Food and Agriculture Organization, Rome.
Arnell, N. W. (1999). Climate change and global water resources. Global Environ. Change 9, S31–S49. doi: 10.1016/S.0959-3780(99)00017-5
BC Ministry of Environment (2008). Living Water Smart: British Columbia's Water Plan. Victoria, BC: British Columbia Ministry of Environment. Available online at: http://www.livingwatersmart.ca/docs/livingwatersmart_book.pdf
Bush, E. J., Loder, J. W., James, T. S., Mortsch, L. D., and Cohen, S. J. (2014). An overview of Canada's changing climate. Canada in a Changing Climate,” in Sector Perspectives on Impacts and Adaptation, eds F. J. Warren and D. S. Lemmen (Ottawa, ON: Government of Canada), 23–64.
Cannon, A. J. (2015). Selecting GCM scenarios that span the range of changes in a multimodel ensemble: application to CMIP5 climate extremes indices. J. Clim. 28, 1260–1267. doi: 10.1175/JCLI-D-14-00636.1
Clarke, K. C., Jarosch, A. H., Anslow, F. S., Radic, V., and Menounos, B. (2015). Projected deglaciation of western Canada in the twenty-first century. Nat. Geosci. 8, 372–377. doi: 10.1038/ngeo2407
Cohen, S., Neilsen, D., Smith, S., Neale, T., Taylor, B., Barton, M., et al. (2006). Learning with local help: expanding the dialogue on climate change and water management in the Okanagan Region, British Columbia, Canada. Clim. Change 75, 331–358. doi: 10.1007/s10584-006-6336-6
Crawford, E., and Beveridge, R. (2013). Strengthening BC's Agriculture Sector in the Face of Climate Change. Victoria, BC: Pacific Institute for Climate Solutions. Available online at: http://pics.uvic.ca/sites/default/files/uploads/publications/Strengthening%20BC's%20Agriculture%20Sector_0.pdf
Crawford, E., and McNair, E. (2012). BC Agriculture Climate Change Adaptation Risk and Opportunity Assessment – Provincial Report. Victoria, BC: BC Agriculture and Food Climate Action Initiative. Available online at: http://pics.uvic.ca/sites/default/files/uploads/publications/BC%20Agriculture_summary.pdf
Environment and Climate Change Canada (ECCC) (2016). Climate Data and Scenarios for Canada: Synthesis of Recent Observation and Modelling Results. Gatineau, QC.
Elgaali, E., Garcia, L. A., and Ojima, D. S. (2007). High resolution modeling of the regional impacts of climate change on irrigation water demand. Clim. Change 84, 441–461. doi: 10.1007/s10584-007-9278-8
Fischer, G., Tubiello, F. N., Velthuizen, H., and Wiberg, D. A. (2007). Climate change impacts on irrigation water requirements: effects of mitigation, 1990–2080. Tech. Forecast. Soc. Change 74, 1083–1107. doi: 10.1016/j.techfore.2006.05.021
Gosling, S. N., Taylor, R. G., Arnell, N. W., and Todd, M. C. (2011). A comparative analysis of projected impacts of climate change on river runoff from global and catchment-scale hydrological models. Hydrol. Earth Syst. Sci. 15, 279–294. doi: 10.5194/hess-15-279-2011
Grebmer, K., Ringler, C., Rosegrant, W., Olofinbiyi, T., Wiesmann, D., Fritchel, H., et al. (2012). 2012 Global Hunger Index. The Challenge of Hunger: Ensuring Sustainable Food Security Under Land, Water, and Energy Stress. Washington, DC: International Food Policy Research Institute (IFPRI). Available online at: http://ebrary.ifpri.org/utils/getfile/collection/p15738coll2/id/127150/filename/127
Heard, J. W., Porker, M. J., Armstrong, D. P., Finger, L., Ho, C. K. M., Wales, W. J., et al. (2012). The economics of subsurface drip irrigation on perennial pastures and fodder production in Australia Agric. Water Manage. 11, 68–78. doi: 10.1016/j.agwat.2012.05.005
Hyatt, K. D., Alexander, C. A. D., and Stockwell, M. M. (2015). A decision support system for improving “fish friendly” flow compliance in the regulated Okanagan Lake and River System of British Columbia. Can. Water Resour. J. 40, 87–110. doi: 10.1080/07011784.2014.98551
Jiménez Cisneros, B. E. T., Oki, N. W., Arnell, G., Benito, J. G., Cogley, P., Döll, T., et al. (2014). “Freshwater resources,” in Climate Change 2014: Impacts, Adaptation, and Vulnerability. Part A: Global and Sectoral Aspects. Contribution of Working Group II to the Fifth Assessment Report of the Intergovernmental Panel on Climate Change, eds C. B. Field, V. R. Barros, D. J. Dokken, K. J. Mach, M. D. Mastrandrea, T. E. Bilir, et al. (Cambridge; New York, NY: Cambridge University Press), 229–269.
Keller, M. (2010). Managing grapevines to optimise fruit development in a challenging environment: a climate change primer for viticulturists. Aust. J. Grape Wine Res. 16, 56–69. doi: 10.1111/j.1755-0238.2009.00077.x
Kjellen, M., and McGranshan, G. (1997). “Comprehensive assessment of the freshwater resources of the world,” in Urban Water - Towards Health and Sustainability. Available online at: https://books.google.ca/books/about/Urban_Water.html?id=uygoAQAAMAAJ&redir_esc=y
Konzmann, M., Gerten, D., and Heinke, J. (2013). Climate impacts on global irrigation requirements under 19 GCMs, simulated with a vegetation and hydrology model. Hydrol. Sci. J. 58, 88–105. doi: 10.1080/02626667.2013.746495
Kreins, P., Henseler, M., Anter, J., Herrmann, F., and Wendland, F. (2015). Quantification of climate change impact on regional agricultural irrigation and groundwater demand. Water Resourc. Manage. 29, 3585–3600. doi: 10.1007/s11269-015-1017-8
Lamm, F. R., Bordovsky, J. P., Schwankl, L. J., Grabow, G. L., Enciso-Medina, J., Peters, R. T., et al. (2012b). Subsurface drip irrigation: status of the technology in 2010. Trans. ASABE 55, 483–491.
Lamm, F. R., Harmoney, K. R., Aboukheira, A. A., and Johnson, S. K. (2012a). Alfalfa production with subsurface drip irrigation in the Central Great Plains. Trans. ASABE 55, 1203–1212. doi: 10.13031/2013.42258
Mantua, N., Tohver, I., and Hamlet, A. (2010). Climate change impacts on streamflow extremes and summertime stream temperature and their possible consequences for freshwater salmon habitat in Washington State. Clim. Change 102, 187–223. doi: 10.1007/s10584-010-9845-2
Marsal, J., Lopez, G., Arbones, A., Mata, M., Vallverdu, X., and Girona, J. (2009). Influence of post-harvest deficit irrigation and pre-harvest fruit thinning on sweet cherry (cv. New Star) fruit firmness and quality. J.Hortic. Sci. Biotech. 84, 273–278. doi: 10.1080/14620316.2009.11512516
Marsal, J., Lopez, G., del Campo, J., Mata, M., Arbones, A., and Girona, J. (2010). Postharvest regulated deficit irrigation in ‘Summit' sweet cherry: fruit yield and quality in the following season. Irrig. Sci. 28, 181–189. doi: 10.1007/s00271-009-0174-z
McKenney, D. W., Hutchinson, M. F., Papadopol, P., Lawrence, K., Pedlar, J., Campbell, J., et al. (2011). Customized spatial climate models for North America. Bull. Amer. Meteor. Soc. 92, 1611–1622. doi: 10.1175/2011BAMS3132.1
Meinhausen, M., Smith, S. J., Calvin, K., Daniel, J. S., Kainuma, M. L. T., Lamarque, J.-F., et al. (2011). The RCP greenhouse gas concentrations and their extensions from 1765 to 2300. Clim. Change 109, 213–241. doi: 10.1007/s10584-011-0156-z
Melnychuk, N., Jatel, N., and andWarwick Sears, A. L. (2016). Integrated water resource management and British Columbia's Okanagan Basin Water Board. Int. J. Water Resour. Dev. 33, 408–425. doi: 10.1080/07900627.2016.121490
Merritt, W. S., Alila, Y., Barton, M., Taylor, B., Cohen, S., and Neilsen, D. (2006). Hydrologic response to scenarios of climate change in sub watersheds of the Okanagan Basin, British Columbia. J. Hydrol. 326, 79–108. doi: 10.1016/j.jhydrol.2005.10.025
Neilsen, D., Neilsen, G. H., Guak, S., and Forge, T. (2016). Consequences of deficit irrigation and crop load reduction on plant water relations, yield and quality of 'Ambrosia' apple. Hortscience 51, 98–106.
Neilsen, D., Smith, S., Bourgeois, G., Qian, B., Cannon, A., Neilsen, G., et al. (2017). Modelling changing suitability for tree fruits in complex terrain. Acta Hortic. 1160, 207–214. doi: 10.17660/ActaHortic.2017.1160.30
Neilsen, D., Van Der Gulik, T., Cannon, A., Taylor, B., and Fretwell, R. (2015). Modeling future water demand for current and future climate in the Okanagan basin, B.C, Canada. Acta Hort. 1068, 211–218.
Neilsen, D., Smith, S., Frank, G., Koch, W., Alila, Y., Merritt, W., et al. (2006). Potential impacts of climate change on water availability for crops in the Okanagan Basin, British Columbia. Can. J. Soil Sci. 86, 909–924. doi: 10.4141/S05-113
Okanagan Basin Water Board (2011). Okanagan Basin Water Supply and Demand Project. Final summary report. Available online at: http://www.obwb.ca/wsd/
Pacific Climate Impacts Consortium (2013). Regional Climate Summaries. Available online at: https://www.pacificclimate.org/resources/publications/summaries?tid%5B%5D=54&keys
Parfitt, B. (2017). Fracking, First Nations and Water. Vancouver, BC: Canadian Centre for Policy Alternatives. Available online at: www.policyalternatives.ca
Parfitt, B., Baltutis, J., and Brandes, O. M. (2012). From Stream to Steam: Emerging Challenges for BC's Interlinked Water Energy Resources. Vancouver, BC: Canadian Centre for Policy Alternatives. Available online at: www.policyalternatives.ca
Postel, S. L. (2000). Entering an era of water scarcity: the challenges ahead. Ecol. Appl. 10, 941–948. doi: 10.1890/1051-0761(2000)010[0941:EAEOWS]2.0.CO;2
Raskin, P., Gleick, P., Kirshen, P., Pontius, G., and Strzepek, K. (1997). Water Futures: Assessment of Long-Range Patterns and Problems. Background Report for the Comprehensive Assessment of the Freshwater Resources of the World. Stockholm: Stockholm Environment Institute. Available online at: http://www.sei-nternational.org/publications?pid=360
Rehana, S., and Mujumdar, P. P. (2013). Regional impacts of climate change on irrigation water demands. Hydrol. Process. 27, 2918–2933. doi: 10.1002/hyp.9379
Shiklomanov, I. A., and Rodda, J. C. (2003). World Water Resources at the Beginning of the Twenty-First Century. Cambridge: Cambridge University Press. Available online at: http://catdir.loc.gov/catdir/samples/cam034/2002031201.pdf
Shrestha, R. R., Schnorbus, M. A., Werner, A. T., and Berland, A. J. (2012). Modelling spatial and temporal variability of hydrologic impacts of climate change in the Fraser River basin, British Columbia, Canada. Hydrol. Process. 26, 1840–1860. doi: 10.1002/hyp.9283
The Partnership for Water Sustainability in BC (2015). Agriculture Water Demand Model. Available online at: http://waterbucket.ca/aw/2015/03/05/agriculture-water-demand-model/
Van der Gulik, T., Neilsen, D., and Fretwell, R. (2010). Agriculture Water Demand Model: Report for the Okanagan Basin. Kelowna, BC: Okanagan Basin Water Board. Available online at: http://www2.gov.bc.ca/assets/gov/farming-natural-resources-and-industry/agriculture-and-seafood/agricultural-land-and-environment/water/agriculture-water-demand-model/500300-3_agric_water_demand_model-okanagan_report.pdf
Wada, Y., Wisser, D., Eisner, S., Flörke, M., Gerten, D., Haddeland, I., et al. (2013). Multimodel projections and uncertainties of irrigation water demand under climate change. Geophys. Res. Lett. 40, 4626–4632. doi: 10.1002/grl.50686
Walker, I. J., and Sydneysmith, R. (2008). “British Columbia,” in From Impacts to Adaptation: Canada in a Changing Climate, eds D. S. Lemmen, F. J. Warren, J. Lacroix, and E. Bush (Ottawa, ON: Government of Canada), 334–391.
Wang, J., Klein, K. K., Bjornlund, H., and Zhang, L. Zhang, W. (2015) Adoption of improved irrigation scheduling methods in Alberta: An empirical analysis. Can. Water Resourc. J. 40, 47–61. doi: 10.1080/07011784.2014.975748
Wang, T., Hamann, A., Spittlehouse, D. L., and Aitken, S. N. (2006). Development of scale-free climate data for Western Canada for use in resource management. Int. J. Climatol. 26, 383–397. doi: 10.1002/joc.1247
Wang, X., Zhang, J., Shamsuddin, S., Guan, E., Wu, Y., Gao, J., et al. (2014). Adaptation to climate change impacts on water demand. Mitigation Adapt. Strat. Global Change 21, 1–19. doi: 10.1007/s11027-014-9571-6
Werner, A. T. and Cannon, A. J. (2016) Hydrologic extremes - an intercomparison of multiple gridded statistical downscaling methods. Hydrol. Earth Syst. Sci. 20, 1483–1508. doi: 10.5194/hess-20-1483-2016.
Wood, M. L., and Finger, L. (2006). Influence of irrigation method on water use and production of perennial pastures in northern Victoria. Aust. J. Exp. Agric. 46, 1605–1614. doi: 10.1071/EA05197
Keywords: irrigation water demand (IWD), climate change, agricultural land reserve, water management tool, land use
Citation: Neilsen D, Bakker M, Van der Gulik T, Smith S, Cannon A, Losso I and Warwick Sears A (2018) Landscape Based Agricultural Water Demand Modeling—A Tool for Water Management Decision Making in British Columbia, Canada. Front. Environ. Sci. 6:74. doi: 10.3389/fenvs.2018.00074
Received: 02 March 2018; Accepted: 20 June 2018;
Published: 03 August 2018.
Edited by:
Louis Kouadio, University of Southern Queensland, AustraliaReviewed by:
Nidhi Nagabhatla, United Nations University Institute for Water Environment and Health, CanadaCarmen De Jong, Université de Strasbourg, France
Copyright © 2018 Her Majesty the Queen in Right of Canada, as represented by the Minister of Agriculture and Agri-Food Canada. This is an open-access article distributed under the terms of the Creative Commons Attribution License (CC BY). The use, distribution or reproduction in other forums is permitted, provided the original author(s) and the copyright owner(s) are credited and that the original publication in this journal is cited, in accordance with accepted academic practice. No use, distribution or reproduction is permitted which does not comply with these terms.
*Correspondence: Denise Neilsen, ZGVuaXNlLm5laWxzZW5AYWdyLmdjLmNh