- 1Soils and Substrates Group, Land-Nature-Environment Institute, University of Applied Science of Western Switzerland (hepia), Jussy, Switzerland
- 2Centre de Formation Professionnelle Nature et Environnement, Jussy, Switzerland
- 3Department of Agroecology and Environment, Agroscope, Zurich, Switzerland
- 4Department of Soil and Environment, Swedish University of Agricultural Sciences, Uppsala, Sweden
Degraded soil structure recovery is much less documented than structure degradation and in particular compaction. In this field experiment, the effects of rotary spade tillage followed by Sorghum cover crop (cover-crop treatment) on the degraded structure of the soil from an orchard were evaluated on undisturbed soil samples collected at 5–10 cm and 20–25 cm depth, respectively, using CoreVESS visual scoring of structure quality and shrinkage analysis. The cover-crop treatment took place from April to September and despite a particularly dry climate, the development of Sorghum was good. A large and significant improvement of the structure quality scores were obtained at both depths. Similar recovery trends in the physical properties were observed at the two depths, however the changes were significant at 5–10 cm depth only and were associated with a small increase of soil organic carbon (SOC) content. Analysis of covariance revealed a significant impact of the tillage and root development on the structure recovery, larger than the effect of SOC content. The structure recovery showed an increase of the positive role of SOC content on the physical properties. This structural change pattern was similar to those reported from other structure degradation or compaction studies. The slopes of the relationship between physical properties and SOC is an indicator of structure quality in general. Though the observed final structure quality of the top layer was good, we assume that its vulnerability remains large due to its small SOC to clay ratio. Our results are in close agreement with previous studies highlighting the relationships between SOC to clay ratio and structure quality.
Introduction
The degradation of arable soil structure due to intense trafficking and loss of organic matter has become a major concern because all soil functions are impacted (Eswaran et al., 2001; Hamza and Anderson, 2005; Toth et al., 2008). At farm level, many issues and limitations are associated with the degradation of the soil structure, such as limitation of infiltration, water storage and soil aeration, increased erosion, and decrease in soil fertility and crop growth. Farmers are seeking operational solutions to recover degraded structure and to promote a good structure, however there is a general lack of quantitative knowledge on the associated mechanisms and their relative contribution in different soils and climates, and the rate of recovery that can be expected.
Soil structure is the spatial arrangement of solid particles at a given time, which results in the arrangement of soil pores between them. The soil pores can be arbitrarily classed into size classes (Perret et al., 1999). Two pore systems which cannot be strictly distinguished by size, however, were long ago recognized due to their different origin and behavior. The structural pores consist of biopores, cracks and packing voids (Brewer, 1964), and the soil plasma, made of the soil colloids bound together (Soil Science Society of America, 2017). The plasma pores are inter-colloid voids that remain saturated for most of the soil water content range. Both pore systems are changing in volume and pore sizes with water, and this change of volume represents the well-known shrink-swell properties of the soils, which is modulated by the clay content and clay type (Boivin et al., 2004).
Structure resilience is defined as the ability of the soil to recover its structural integrity after disturbance, while resistance to stress as the ability of the soil to resist an applied stress (structural) change (Seybold et al., 1999). The vulnerability of the structure is defined as the combined effect of resilience and stability (Kay, 1998). The quality and vulnerability of soil structure is strongly dependent of the soil organic carbon (SOC) content (Kay, 1998). Contrary to structure recovery, structure degradation has been widely studied (e.g., Lipiec and Håkansson, 2000; Horn and Fleige, 2009; Alaoui et al., 2011), in particular compaction. Compaction is primarily affecting the larger pores by occlusion, disruption or reduction of their size (Schäffer et al., 2008a; Bottinelli et al., 2014).
Visual evaluation of soil structure in combination with shrinkage analysis may be promising to study degradation and recovery of soil structure. Visual Evaluation of Soil Structure (VESS) (Ball et al., 2017) is based on the evaluation of the structural pores, their nature and distribution in the soil aggregates and clods from a spade test. VESS is fast, inexpensive and easy to perform. It attributes a score of structure quality which was found to be well correlated to physical measurements (Guimarães et al., 2013; Johannes et al., 2017b). Johannes et al. (2017b) adapted the technique to the scoring of undisturbed soil cores, referred to as CoreVESS.
Shrinkage analysis (ShA) typically includes the modeling of the soil shrinkage curve (ShC), either with equations fitted to the simple S-shape (Peng and Horn, 2005) or assuming a dual porosity comprising plasma porosity (also referred to as textural or clay matrix porosity) and structural porosity (Braudeau et al., 2004; Chertkov, 2012). In the second case, ShA allows quantifying the structural and plasma pore volumes, their air and water content and their deformation upon changes in water content (i.e., shrinkage and swelling). This allows for the characterization of the compaction stages and their modulation by the soil content in colloids (Boivin et al., 2006; Schäffer et al., 2008b; Goutal-Pousse et al., 2016). These studies showed that the two pore systems showed different changes in volume under traffic depending on the contents of SOC and clay. Furthermore, it was shown that the slopes of the relationships between the specific volume or the structural pores volume and SOC decreased with compaction. On a large series of structure-degraded soils characterized with both CoreVESS and shrinkage analysis, Johannes et al. (2017b) showed that structure degradation followed the same patterns described for compaction in Goutal-Pousse et al. (2016) and Schäffer et al. (2008b, 2013), namely a decrease in structural pore volume, and a decrease in the slope of the relationship of structural pore volume vs. SOC. Moreover, it was found that a SOC:clay ratio of 10% was the average ratio corresponding to the limit between degraded structure (VESS score >3) and acceptable or good structure (VESS score <3) (Johannes et al., 2017a).
Although recovery is not simply the inverse function of degradation, we expect that recovery shows similar patterns as degradation. This study aimed at comparing structure recovery patterns to the previously reported structure degradation patterns. It was conducted on a compacted orchard soil were a cover-crop was installed to restore the soil structure, and the soil structure recovery was quantified with CoreVESS scoring and shrinkage analysis.
Materials and Methods
The experiment took place in the horticultural center of Lullier, Geneva canton, Switzerland, in a 0.6 ha field that has been under intensive orchard since 1990. The field was planted with apple trees, with 4 m spacing between the lines. The soil developed on a compact carbonated morain with 35% clay content. The soil was classified as a calcisol according to IUSS Working Group WRB (2006), with partial decarbonatation at 50 cm depth, and showed temporary water logging below that depth. In 2014, the 13 years-old apple-trees were removed. Because of root diseases and the observed degraded structure of A and B horizons, a cover-crop was planted during spring and summer 2015 before re-planting. The cover-crop was Sorghum biocolor (L.) Moench var. Hayking, which is commonly used in Orchards for its ability to restore the structure.
The experiment was designed as follows. Undisturbed core samples of 150 cm3 were collected in April before seeding of the cover-crop, to characterize the initial state, and in September to characterize the final state. Moreover, the soil from a neighboring permanent ungrazed pasture which was never cropped nor trafficked was sampled to serve as a reference condition representing the potential quality of the cultivated soil. In May, the soil was prepared with a rotary spade (20 cm depth) and a harrow (5 cm depth) before seeding of the Sorghum. This (i.e., tillage plus the following cover crop) is referred to as “cover-crop” treatment in the remainder of this paper. Almost no rainfall occurred during the experiment and a total deficit of 200 mm was recorded compared to the local averages, however, the Sorghum was not irrigated until the end of the experiment. The estimated biomass of 6.5 t ha−1 met the expectations for this variety and environmental conditions as recorded by others (Ćupina et al., 2011).
Before harrowing (initial state) and after harvest (final state), the soil was sampled under the former wheel tracks at 24 randomly distributed locations. At each sampling point undisturbed soil samples were collected at 5–10 cm and 20–25 cm depth. Three samples were collected in the neighboring permanent ungrazed pasture representing reference conditions at the same depths. The Sorghum root profile was described on a small trench at each sampling location at the final sampling.
Soil Analyses
The physical properties of the undisturbed soil samples were first characterized on the full water content range (from −8 hPa to air dry) using shrinkage analysis. The physical parameters used in the following are: soil specific volume (V) in cm3.g−1 and its inverse soil bulk density (Bd, g.cm−3), specific structural pore volume (Vstr, cm3.g−1) and specific plasma pore volume (Vpl, cm3.g−1), gravimetric water content (W in g.g−1), and specific air volume (Air in cm3.g−1). We focused on these parameters (i) at the shrinkage transition points (namely SL: limit of shrinkage of the plasma, AE: air entry in the plasma, ML: dry point of the structural pores and MS: maximum swelling of the plasma (Figure 1); (ii) at the wet end (taken at −10 hPa), and (iii) at the dry end (Dry) of the ShC. The corresponding parameters are denoted with the considered state in subscript, for instance specific volume at −10 hPa and at ML are denoted V−10 and VML, respectively.
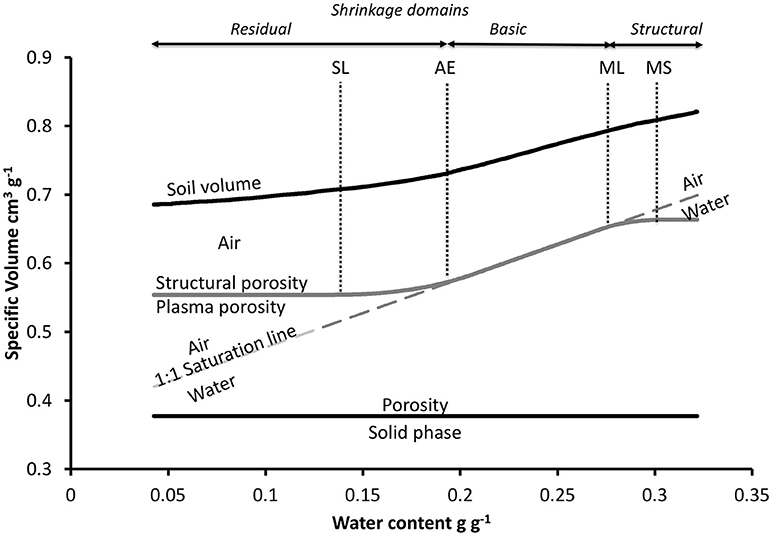
Figure 1. Example of experimental shrinkage curve with fitted XP model (Braudeau et al., 1999), showing the different shrinkage domains, their transition points, and the partitions of the porosity into air and water (load line, dashed gray), and plasma and structural pores (solid gray). SL, plasma shrinkage limit; AE, air entry in the plasma; ML, dry point of the structural porosity; MS, maximum plasma swelling.
The undisturbed soil samples equilibrated at −8 hPa water content were placed on the shrinkage measuring bench described in Boivin et al. (2004). Changes in soil height (linear transducer), matric potential (micro ceramic cup), and weight (balance) were monitored simultaneously and recorded quasi continuously while the soil water evaporated slowly until the height and weight of the soil remained constant, which took approximately 5 days. We calculated the changes in the sample water content, W, from the recorded weight and the oven-dry sample weight after removing the coarse (>2 mm) fraction weight. We measured the saturated and air-dried volumes by the plastic bag method (Boivin et al., 1990) and converted the recorded changes in height to changes in volume after removing the coarse fraction volume as described by Schäffer et al. (2008b).
We fitted the XP-model (exponential) (Braudeau et al., 1999) to our experimental data with a non-linear fitting simplex algorithm (Chen et al., 1986) to estimate the shrinkage parameters. This model describes the shrinkage curve as several successive linear and curvilinear domains separated by transition points (Figure 1). The linear and curvilinear part close to water saturation in Figure 1 form the structural shrinkage domain. The opposite part (dry end) is the residual shrinkage domain controlled by the plasma properties (Braudeau et al., 1999). The fitting of XP model provides estimates of the structural and plasma pore volumes, air and water content over the whole range of water content (Braudeau et al., 2004).
After shrinkage analysis, the air-dried soil samples were rewetted to a matric potential of −100 hPa and scored for their structure quality using CoreVESS as described in Johannes et al. (2017b). The samples received a score of structure quality (Sq) ranging from 1 to 5, 3 being the limit between good (<3) and degraded (>3) structure.
The soils were then sieved to 2 mm, analyzed for pH in 1:2.5 soil to water extract, total soil organic carbon content (SOC) by oxidation according to Walkley and Black (1934), for effective cation exchange capacity (CEC) with cobalt-hexamine method (Ciesielski and Sterckeman, 1997), and their particle size distribution (5 fractions: 0–2, 2–20, 20–50, 50–200 and 200–2,000 μm) by the pipette method. The dry mass of the >2 mm fraction at 105°C and the dry mass and volume of the coarse fraction were then measured. All results in this paper are reported per gram (or volume) of the <2 mm fraction.
Statistical Analyses
The significance of the difference between the properties of the soil at initial and final state, respectively, was determined with the Welch's unequal variances t-test (Welch, 1947).
Because of the dependence of the soil pore volumes to SOC and to quantify the effect of the treatment—namely spade tillage followed by Sorghum development, we analyzed the difference in the physical properties from initial to final state using Ancova (Cochran, 1957). We used a linear model with SOC as covariable and treatment as factor similar to compaction—recovery experiments conducted by Goutal-Pousse et al. (2016) and Schäffer et al. (2008b). Contrary to these previous studies, however, we did not include clay as covariable since (i) the site was quite homogeneous in clay content and (ii) preliminary data exploration showed that the variance of the physical properties was explained mostly by SOC.
Results and Discussion
The structure quality scores are presented in Figure 2. In good agreement with the field observations, the average Sq value significantly decreased from 3.7 (degraded structure) to 2.1 (fair) in the 5–10 cm depth layer, and from 4.1 (degraded) to 3.5 (slightly degraded) in the 20–25 cm depth layer. The reference condition (RC) showed Sq of 1.7 and 2.1 (good structure) in both layers. At the end of the experiment, the roots of Sorghum had densely penetrated the top layers down to 35 cm depth, and roots were observed until the moraine bedrock at 80 cm depth. The soil structure of the top 20 cm was made of small (<1 cm) rounded aggregates easy to crumble, and the clods formed by the rotary spade (observed directly after tillage) could no longer be identified.
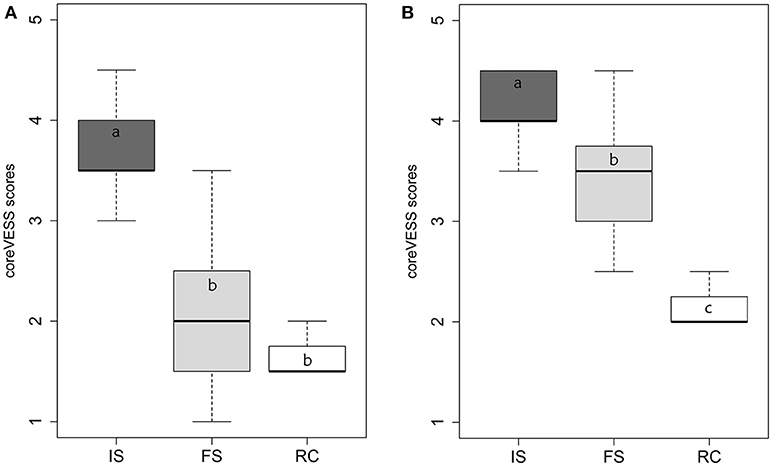
Figure 2. Boxplots of the structure quality scores at initial (IS) and final (FS) states, and of the reference condition (RC), for (A) 5–10 cm depth and (B) 20–25 cm depth. Letters a, b, c indicate significant differences at the p < 0.05 level.
The average pH, CEC, SOC, and texture of the collected samples at the two depths are presented in Table 1. The only significant change was the increase of SOC from 1.8 to 2.1% at 5–10 cm depth. In this layer the SOC:clay ratio increased from 0.06 to 0.07. In their large-scale study, Johannes et al. (2017a) found that Sq 4 corresponded in average to a SOC:Clay ratio of 0.07. This is far below the 0.1 SOC:clay ratio separating acceptable from degraded structure (Sq 3) according to these authors. The reference condition showed a SOC of 3% and a SOC:clay ratio of 0.09, slightly below 0.1. Dexter et al. (2008) analyzed soils from northern France and found that most pastures had a SOC to clay ratio >0.1 while arable soils had a SOC to clay ratio <0.1.
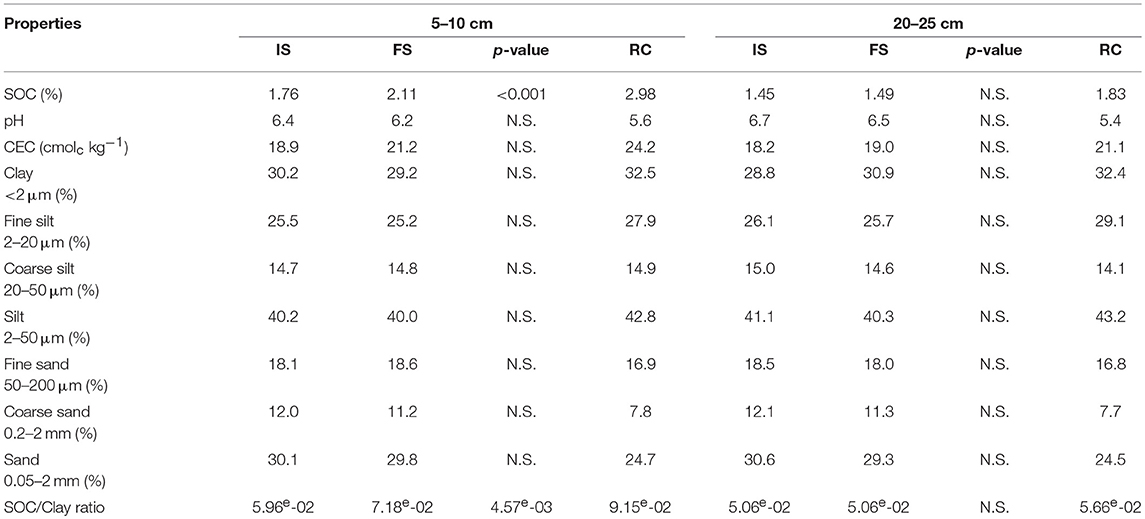
Table 1. Mean soil characteristics, at initial state (IS), final state (FS), and reference condition (RC) for the 5–10 and 20–25 depths, and level of significance of the difference between IS and FS (p-value).
The shrinkage curves determined at 5–10 cm depth are presented in Figure 3. The average values of the physical parameters determined after modeling of the shrinkage curves are reported in Table 2. Only the physical properties of the 5–10 cm depth showed significant changes (Table 2), which are also revealed in Figure 3. The soil specific volume significantly increased, particularly at large water contents. For example, V−10 increased by 0.106 cm3 g−1, and 50% of this increase corresponded to an increase in air content by 0.059 cm3 g−1, corresponding to structural pores with equivalent radius larger than 150 μm according to Jurin-Laplace's law. The structural domain was more affected than the residual domain. The plasma porosity increased by 20% and structural porosity increased by 2-fold, namely 0.067 cm3 g−1. This volume is higher than those of the structural pores with an equivalent radius >150 μm, which means that in addition to large pores, structural pores smaller than 150 μm in equivalent radius also contributed to the volume increase. Small structural pores were found to be strongly enhanced by root development (Milleret et al., 2009; Kohler-Milleret et al., 2013). The water content at −10 hPa corresponding to pores smaller than 150 μm in equivalent radius increased by 0.048 cm−3 g−1. The larger the water content, the larger the increase in pore volumes from initial to final states (Table 2), which means that all pore sizes were increased but that a larger increase was observed for larger pores. At −10 hPa, the structural pore specific volume increase represented 60% of the total specific volume increase, and increased swelling of the plasma with water represented 40% of the specific volume increase. Similar trends were observed at 20–25 cm depth, but the changes were not significant (Table 2). The increases, however, suggest signs of recovery, which is encouraging and in accordance with the observed root development and the significant increase of structure quality revealed from the visual evaluation (Figure 2B).
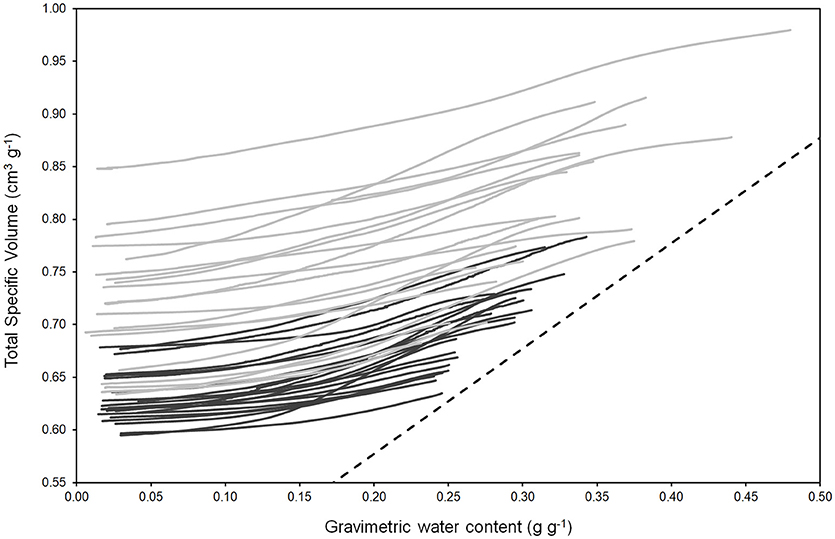
Figure 3. Shrinkage curves determined on the undisturbed samples at initial (black solid) and final state (gray solid), 5–10 cm depth.
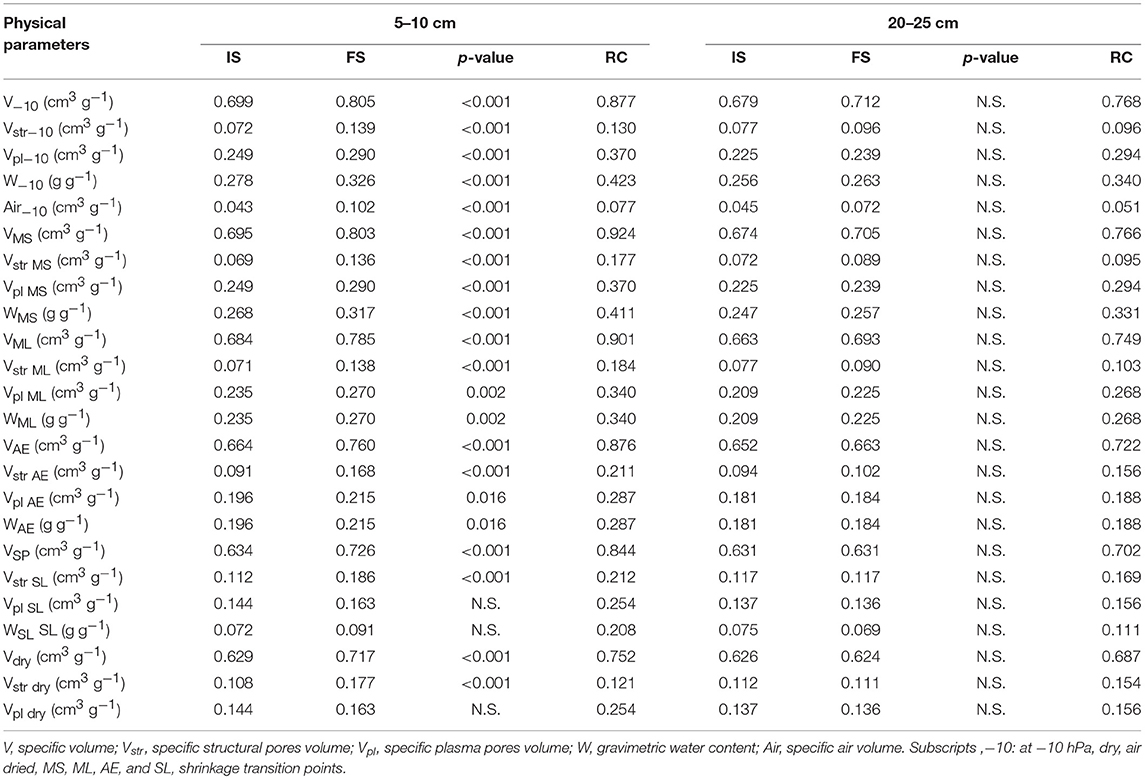
Table 2. Average values of the parameters determined by shrinkage analysis before (IS) and after (FS) the experiment, and in the reference condition (RC) at the two sampling depths.
The SOC increase was surprisingly high (Table 1). The increase was most likely caused by the tillage physical turning of upper layer and burying it beneath the surface before seeding the cover crop. The soil was covered with grass in the orchard, likely resulting in a higher SOC in the uppermost few centimeters that the spade tillage incorporated into the plowed layer. Another reason could be the slightly different sampling depths before and after the cover crop when considering the mass balance. Since the specific volume of the 5–10 cm layer increased during the experiment, the depth at which the soil was sampled after the cover crop was slightly shallower than the depth at the initial sampling. This may bias the estimation of SOC change, since the SOC profile is generally decreasing with depth. Correcting the depth of sampling at the end of the experiment with the changes in bulk density leads to a corrected depth of sampling at final state of 4.25 cm instead of 5 cm.
The observed structure recovery can be attributed to two effects: (i) the direct effect of SOC, and (ii) the root development after tillage. The Ancova using SOC as covariable and treatment (=tillage and roots) as factor allowed to quantify the significance and respective roles of SOC and tillage/cover-crop on the physical parameters (Table 3 and Figure 4). We found a significant impact of SOC on the soil specific volume, the structural pore volume, the plasma pore volume, and the water content and the air content of the soil except for the plasma pore volume when the soil was dry (namely at AE, SL and air-dry state). The relationships between SOC and (i) the specific soil volumes, (ii) the structural pore volumes and (iii) the water contents are significantly changed by the soil treatment. The positive slope of the linear relationship between SOC and these properties increased due to the tillage/cover crop treatment as illustrated for the −10 hPa results in Figure 4, which means that not only the pore volumes are increased by the cover-crop, but also the positive effect of SOC on the pore volumes is increased.
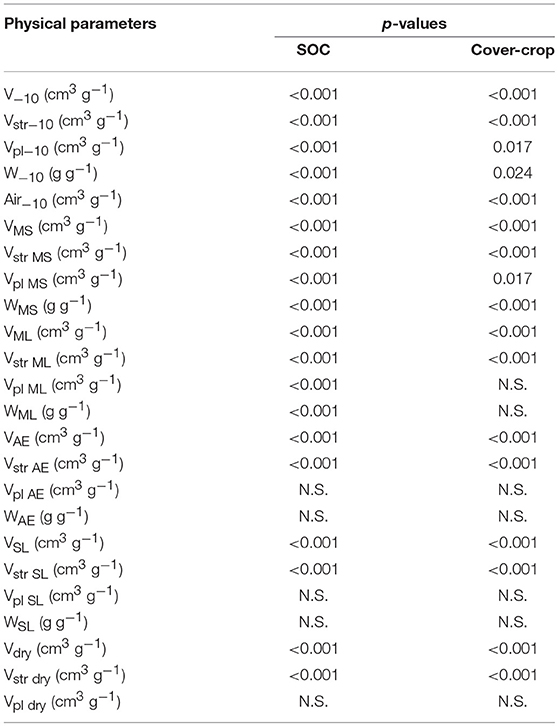
Table 3. Results of the Ancova: significance of the effects of SOC and cover-crop treatment on the main physical parameters.
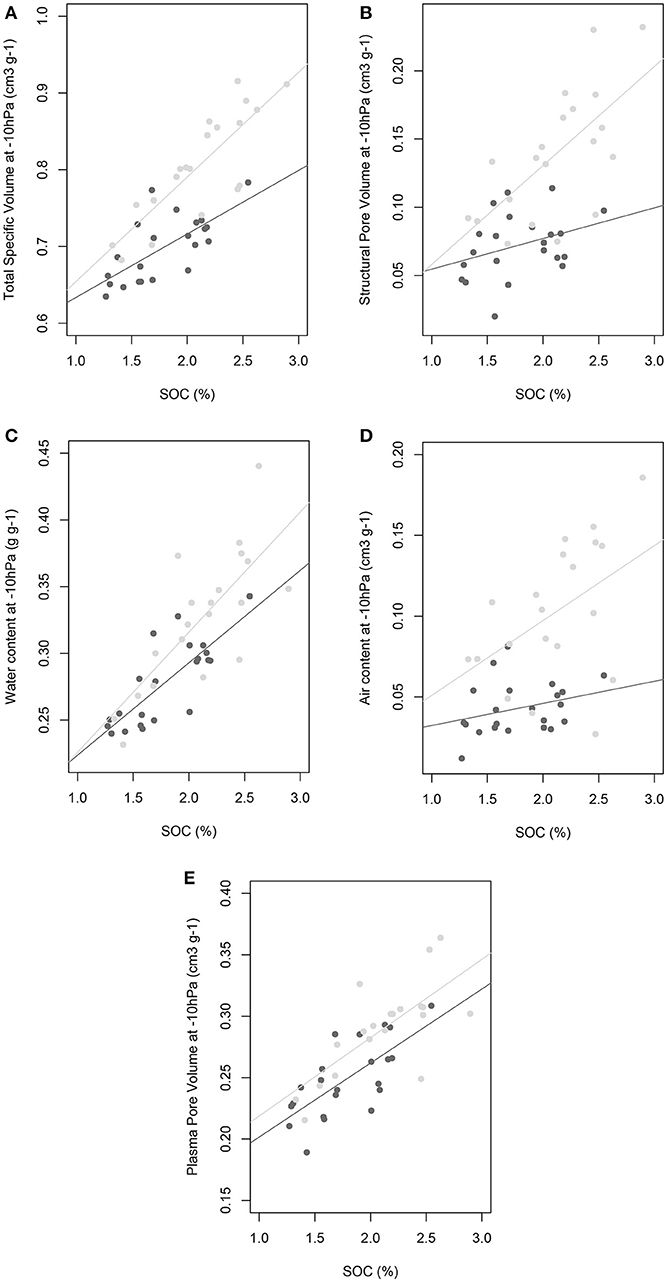
Figure 4. Changes in the relationships between the soil properties at −10 hPa and SOC during the experiment. Experimental observations and linear regressions. Changes in regressions slopes are significant except for plasma pore volume. Initial state in dark gray and final state in light gray: (A) specific volume; (B) Structural pore volume; (C) water content; (D) air content; (E) plasma pore volume.
The change in slope of the relationship between soil physical property and SOC content was also reported by Goutal-Pousse et al. (2016) and Schäffer et al. (2008b) for compaction experiments. In their studies, structure degradation resulted in a decrease in the pore volumes, and in a decrease in the slope of the relationship between total and structural pore volume and SOC. Conversely, structure recovery is indicated by an increase in these volumes, and an increase in the slope of the volumes-SOC relationships (Figure 4). Hence, the change in the slope of the volume-SOC relationship seems to be an indication of soil structure dynamics, and the slope could be used as an indicator of soil structural quality. The relationship between plasma pore volume and SOC was not changed during degradation (Schäffer et al., 2008b; Goutal-Pousse et al., 2016) nor recovery of soil structure (this study). The volume-SOC relationships at the other shrinkage points show similar patterns, i.e., an increase in the slope with recovery (not shown), except for the plasma pore volume from air dry state to AE transition point.
The ShCs of the initial state (Figure 3) show a sigmoidal shape. Although the soil was compact and depleted in SOC, it showed some structural porosity and shrinkage, which is favorable for structure recovery as discussed in Goutal-Pousse et al. (2016). Air can enter the structural porosity, and the soil shrinkage will produce cracks, which is considered one of the main process of structure formation (Kay, 1998). The structure recovery of our soil was rapid, highlighting a good structure resilience. In a single season, although meteorological conditions were not favorable for cover-crop growth, the structure improved from degraded (Sq 4) to fair (Sq 2) in the top layer. At the 20–25 cm depth, the root development and the changes in physical showed a similar trend but only the scores of visual evaluation (CoreVess) showed a significant change in average.
The structure recovery can be attributed to three factors, namely the increase in SOC, the tillage and the biological activity associated with root development. The respective roles of tillage and root development cannot be separated in our study, although the crumbly structure and the absence of tillage-induced clods may suggest a major role of roots. Roots developed well down to 35 cm depth, but the small changes observed in the 20–25 cm depth (i.e., below tillage depth) may suggest that the two effects, namely tillage and root development, work in synergy. Indeed, some form of tillage is necessarily associated with cover-crop seeding in practice.
However, the respective effects of SOC and cover-crop cultivation can be distinguished. We will illustrate that with help of Figure 5, which shows the relationships between SOC and bulk density (at −10 hPa) at the initial (compacted, before tillage) and final (remediated) state. The solid square 1 represents the initial state, i.e., the initial bulk density and initial SOC, and is located on the initial relationship between bulk density and SOC (dark gray solid line). Square 3 represents the final state, i.e., the final bulk density and final SOC, and is located on the final relationship between bulk density and SOC (light gray solid line). Square 5 represents the reference condition, i.e., the average bulk density and SOC content of the control (permanent ungrazed pasture that was never cropped nor trafficked). If we consider that the tillage/cover crop treatment only increased SOC but not the bulk density vs. SOC relationship, the final state would have been characterized by the bulk density and SOC indicated by square 2. Hence, we can clearly see two effects of the tillage/cover crop treatments: (i) an increase in SOC, represented by the path from square 1 to square 2, and resulting in a decrease in bulk density from 1.44 to 1.38, and a change in the bulk density vs. SOC relationship, indicated by the path from square 2 to square 3, and resulting in an additional decrease in bulk density from 1.38 to 1.25. The latter had a larger effect on bulk density than the effect of SOC increase alone. In order to obtain a similar bulk density with only an increase in SOC (i.e., without a change in the bulk density vs. SOC relationship), the SOC would need to be 2.8%, as indicated by square 4 in Figure 5.
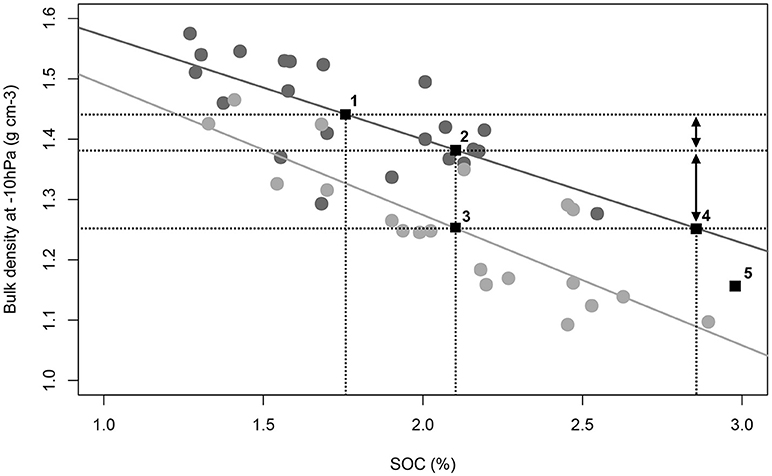
Figure 5. Changes in soil bulk density in the 5–10 cm layer during the experiment. Solid dark gray dots and line: observations at initial (trafficked) state and corresponding linear regression (trafficked soil). Solid light gray dots and line: observations final (remediated) state and linear regression (remediated soil). Solid square 1: average initial state. Solid square 2: final average SOC content and corresponding bulk density according to the trafficked SOC-bulk density relationship. Solid square 3: average final state. Solid square 4: final observed bulk density and corresponding SOC content on the trafficked SOC-bulk density relationship. Solid square 5: reference condition (neighboring permanent ungrazed pasture). Distinction of the effects of SOC increase (from solid square 1 to 2) and cover-crop (from solid square 2 to 3).
SOC is a driver of structure quality in the field and contributes to structure resilience and resistance. However, rather than the absolute value of SOC, it has been shown that the ratio of SOC to clay content is important for the physical quality of soil (Feller and Beare, 1997; Dexter et al., 2008; Johannes et al., 2017a). In this experiment, the SOC:clay ratio was very low, and only increased from 0.06 to 0.07. These ratios correspond in average to a structure quality score of 4 (degraded soil, poor structural quality) based on an extensive survey of cultivated fields in Switzerland (Johannes et al., 2017a), which was indeed the average observed Sq before the experiment. Because the SOC to clay ratio is still low and unsatisfactorily after the tillage/cover crop treatment, the improved structure is vulnerable and will probably poorly withstand any future trafficking in the orchard. A rapid degradation to Sq 4 under orchard cultivation may be expected. This corresponds to a degradation path from square 3 (back) to square 2 with respect to Figure 5. Interestingly, the solid square 4 in Figure 5 indicates a SOC:clay ratio of 0.1. According to Johannes et al. (2017a), this ratio corresponds in average to an acceptable structure (Sq 3). This strongly suggests that a SOC content of 2.8% should be reached to keep the final observed bulk density if the same stresses are applied in the future (no change in the orchard management). Continuing with cover cropping and incorporating organic material, however, would allow improving the structure and decrease its vulnerability, i.e., standing on a “remediated” structure quality to SOC relationship. The reference condition (square 5) shows a low bulk density and the highest SOC content. However, its SOC:clay ratio was 0.09 only, due to a higher clay content, which may explain its relatively large bulk density compared to the remediated soil. The field was available for this experiment one season only, before it was replanted. Therefore, we did not examined changes in the deeper layers, which should be done in the future using cover crops that are compatible with orchard management.
Conclusion
Farmers seek for solutions to recover degraded soils, but our knowledge of recovery rates is limited. Here we observed a rapid recovery of the structure of a compacted soil under tillage followed by cover-crop. Within just a few months, the structure of the top layer improved from damaged (Sq 4) to fair (Sq 2) in the top layer. This was in good agreement with the shrinkage behavior of the soil before the experiment, which suggested a fair resilience potential of the structure. The changes that occurred in the physical properties, namely increase in structural and plasma pore volumes and water content, could be well quantified by shrinkage analysis. The structural improvement was accompanied with a small but significant increase in SOC. Analysis of covariance allowed to make a distinction between the pure SOC effect and an additional impact of the tillage/cover-crop treatment revealed by the change in the relationship between SOC and soil physical properties. Most physical properties showed a linear relationship with SOC but the slope of the relationship increased after recovery except for plasma porosity, corresponding to an enhanced positive effect of SOC on the physical properties. Similarly, but conversely, earlier compaction studies have shown a decrease in the slope between soil physical properties and SOC. Hence, we suggest that soil structural changes are accompanied by a change in the slope between soil physical properties and SOC, and that this slope could be an indicator of soil physical quality. Our analysis showed that the effect due to the change of this slope was larger than the effect that would be expected solely from a SOC increase. However, the SOC:clay ratio still indicated a high vulnerability after recovery, which suggests a poor resistance of the soil to further cultivation. The observed properties were in close agreement with relationships between the SOC:clay ratio and structure quality revealed at Swiss-scale in a previous study, and underline the need to reach a SOC:clay ratio of at least 0.1 for good structure resistance.
Author Contributions
VF performed the experiment and its interpretation. AM coached the shrinkage, performed additional measurements, and data interpretation. TK contributed to the interpretation and redaction. PB directed the work and redaction.
Conflict of Interest Statement
The authors declare that the research was conducted in the absence of any commercial or financial relationships that could be construed as a potential conflict of interest.
References
Alaoui, A., Lipiec, J., and Gerke, H. H. (2011). A review of the changes in the soil pore system due to soil deformation: a hydrodynamic perspective. Soil Till. Res. 115–116, 1–15. doi: 10.1016/j.still.2011.06.002
Ball, B. C., Guimarães, R. M. L., Cloy, J. M., Hargreaves, P. R., Shepherd, T. G., and McKenzie, B. M. (2017). Visual soil evaluation: a summary of some applications and potential developments for agriculture. Soil Till. Res. 173, 114–124. doi: 10.1016/j.still.2016.07.006
Boivin, P., Brunet, D., and Gascuel-Odoux, C. (1990). Densité apparente d'échantillon de sol: méthode de la poche plastique (in french). Milieux Poreux Trans. Hydriques Bull. GFHN 28, 59–71.
Boivin, P., Garnier, P., and Tessier, D. (2004). Relationship between clay content, clay type and shrinkage properties of soil samples. Soil Sci. Soc. Am. J. 68, 1145–1153. doi: 10.2136/sssaj2004.1145
Boivin, P., Schaeffer, B., Temgoua, E., Gratier, M., and Steinman, G. (2006). Assessment of soil compaction using shrinkage curve measurement and modeling. Experimental data and perspectives. Soil Till. Res. 88, 65–79. doi: 10.1016/j.still.2005.04.008
Bottinelli, N., Hallaire, V., Goutal, N., Bonnaud, P., and Ranger, J. (2014). Impact of heavy traffic on soil macroporosity of two silty forest soils: initial effect and short-term recovery. Geoderma 217–218, 10–17. doi: 10.1016/j.geoderma.2013.10.025
Braudeau, E., Costantini, J. M., Bellier, G., and Colleuille, H. (1999). New device and method for soil shrinkage curve measurement and characterization. Soil Sci. Soc. Am. J. 63, 525–535. doi: 10.2136/sssaj1999.03615995006300030015x
Braudeau, E., Frangi, J.-P., and Mohtar, R. H. (2004). Characterizing nonrigid aggregated soil–water medium using its shrinkage curve. Soil Sci. Soc. Am. J. 68, 359–370. doi: 10.2136/sssaj2004.3590
Chen, D. H., Saleem, Z., and Grace, D. W. (1986). A new Simplex procedure for function minimization. Int. J. Model. Simul. 6, 81–85. doi: 10.1080/02286203.1986.11759961
Chertkov, V. Y. (2012). An integrated approach to soil structure, shrinkage, and cracking in samples and layers. Geoderma 173–174, 258–273. doi: 10.1016/j.geoderma.2012.01.010
Ciesielski, H., and Sterckeman, T. (1997). A comparison between three methods for the determination of cation exchange capacity and exchangeable cations in soils. Agronomie 17, 9–15. doi: 10.1051/agro:19970102
Cochran (1957). Analysis of covariance: its nature and uses. Biometrics 13, 261–281. doi: 10.2307/2527916
Ćupina, B., Manojlović, M., Krstić, D., Čabilovski, R., Mikić, A., Ignjatović-Cupina, A., et al. (2011). Effect of winter cover crops on the dynamics of soil mineral nitrogen and yield and quality of Sudan grass [Sorghum bicolor (L.) Moench]. Aust. J. Crop Sci. 5, 839–845.
Dexter, A. R., Richard, G., Arrouays, D., Czyz, E. A., Jolivet, C., and Duval, O. (2008). Complexed organic matter controls soil physical properties. Geoderma 144, 620–627. doi: 10.1016/j.geoderma.2008.01.022
Eswaran, H., Lal, R., and Reich, P. F. (2001). “Land degradation: an overview,” in Responses to Land Degradation. Proceedings of the 2nd International Conference on Land Degradation and Desertification, eds E. M. Bridges, I. D. Hannam, L. R. Oldeman, F. W. T. Pening de Vries, S. J. Scherr and S. Sompatpanit (Khon Kaen; New Delhi: Oxford Press). Available online at: https://www.nrcs.usda.gov/wps/portal/nrcs/detail/soils/use/?cid=nrcs142p2_054028
Feller, C., and Beare, M. H. (1997). Physical control of soil organic matter dynamics in the tropics. Geoderma 79, 69–116. doi: 10.1016/S0016-7061(97)00039-6
Goutal-Pousse, N., Lamy, F., Ranger, J., and Boivin, P. (2016). Structural damage and recovery determined by the colloidal constituents in two forest soils compacted by heavy traffic. Eur. J. Soil Sci. 67, 160–172. doi: 10.1111/ejss.12323
Guimarães, R. M. L., Ball, B. C., Tormena, C. A., Giarola, N. F. B., and da Silva, Á. P. (2013). Relating visual evaluation of soil structure to other physical properties in soils of contrasting texture and management. Soil Till. Res. 127, 92–99. doi: 10.1016/j.still.2012.01.020
Hamza, M. A., and Anderson, W. K. (2005). Soil compaction in cropping systems - a review of the nature, causes and possible solutions. Soil Till. Res. 82, 121–145. doi: 10.1016/j.still.2004.08.009
Horn, R., and Fleige, H. (2009). Risk assessment of subsoil compaction for arable soils in Northwest Germany at farm scale. Soil Till. Res. 102, 201–208. doi: 10.1016/j.still.2008.07.015
IUSS Working Group WRB (2006). World Reference Base For Soil Resources 2006. A framework for international classification, correlation and communication. Rome: FAO, Food and Agriculture Organization of the United Nations.
Johannes, A., Matter, A., Schulin, R., Weisskopf, P., Baveye, P. C., and Boivin, P. (2017a). Optimal organic carbon values for soil structure quality of arable soils. Does clay content matter? Geoderma 302, 14–21. doi: 10.1016/j.geoderma.2017.04.021
Johannes, A., Weisskopf, P., Schulin, R., and Boivin, P. (2017b). To what extent do physical measurements match with visual evaluation of soil structure? Soil Till. Res. 173, 24–32. doi: 10.1016/j.still.2016.06.001
Kay, B. D. (1998). “Soil structure and organic carbon: a review,” in Soil Processes and the Carbon Cycle Advances in Soil Science, ed J. M. K. R. Lal (Boca Raton, FL. CRC Press), 169–197.
Kohler-Milleret, R., Bayon, R.-C. L., Chenu, C., Gobat, J.-M., and Boivin, P. (2013). Impact of two root systems, earthworms and mycorrhizae on the physical properties of an unstable silt loam Luvisol and plant production. Plant Soil 370, 251–265. doi: 10.1007/s11104-013-1621-4
Lipiec, J., and Håkansson, I. (2000). Influences of degree of compactness and matric water tension on some important plant growth factors. Soil Till. Res. 53, 87–94. doi: 10.1016/S0167-1987(99)00094-X
Milleret, R., Le Bayon, C., Lamy, F., Gobat, J. M., and Boivin, P. (2009). Impact of root, mycorrhiza and earthworm on soil physical properties as assessed by shrinkage analysis. J. Hydrol. 373, 499–507. doi: 10.1016/j.jhydrol.2009.05.013
Peng, X., and Horn, R. (2005). Modeling soil shrinkage curve accross a wide range of soil types. Soil Sci. Soc. Am. J. 69, 584–592. doi: 10.2136/sssaj2004.0146
Perret, J., Prasher, S. O., Kantzas, A., and Langford, C. (1999). Three-dimensional quantification of macropore networks in undisturbed soil cores. Soil Sci. Soc. Am. J. 63, 1530–1543. doi: 10.2136/sssaj1999.6361530x
Schäffer, B., Mueller, T. L., Stauber, M., Müller, R., Keller, M., and Schulin, R. (2008a). Soil and macro-pores under uniaxial compression. II. Morphometric analysis of macro-pore stability in undisturbed and repacked soil. Geoderma 146, 175–182. doi: 10.1016/j.geoderma.2008.05.020
Schäffer, B., Schulin, R., and Boivin, P. (2008b). Changes in shrinkage of restored soil caused by compaction beneath heavy agricultural machinery. Eur. J. Soil Sci. 59, 771–783. doi: 10.1111/j.1365-2389.2008.01024.x
Schäffer, B., Schulin, R., and Boivin, P. (2013). Shrinkage properties of repacked soil at different states of uniaxial compression. Soil Sci. Soc. Am. J. 77, 1930–1943. doi: 10.2136/sssaj2013.01.0035
Seybold, C. A., Herrick, J. E., and Brejda, J. J. (1999). Soil resilience: a fundamental component of soil quality. Soil Sci. 164, 224–234. doi: 10.1097/00010694-199904000-00002
Soil Science Society of America (2017). Glossary of Soil Science Terms. Available online at: https://www.soils.org/publications/soils-glossary (Accessed September 29, 2017).
Toth, G., Montanarella, L., and Rusco, E. (2008). Threats to Soil Quality in Europe, ed G. Tóth, L. Montanarella and E. Rusco. EUR 23438 EN – Joint Research Centre – Institute for Environment and Sustainability.
Walkley, A., and Black, I. A. (1934). An examination of the Degtjareff method for determining soil organic matter, and a proposed modification of the chromic acid titration method. Soil Sci. 37, 29–38. doi: 10.1097/00010694-193401000-00003
Keywords: soil structure, recovery, tillage, cover-crop, compaction, orchard
Citation: Fell V, Matter A, Keller T and Boivin P (2018) Patterns and Factors of Soil Structure Recovery as Revealed From a Tillage and Cover-Crop Experiment in a Compacted Orchard. Front. Environ. Sci. 6:134. doi: 10.3389/fenvs.2018.00134
Received: 03 June 2018; Accepted: 24 October 2018;
Published: 13 November 2018.
Edited by:
David Montagne, AgroParisTech Institut des Sciences et Industries du Vivant et de L'environnement, FranceReviewed by:
Dominique Arrouays, Institut National de la Recherche Agronomique (INRA), FranceMarine Lacoste, Institut National de la Recherche Agronomique (INRA), France
Copyright © 2018 Fell, Matter, Keller and Boivin. This is an open-access article distributed under the terms of the Creative Commons Attribution License (CC BY). The use, distribution or reproduction in other forums is permitted, provided the original author(s) and the copyright owner(s) are credited and that the original publication in this journal is cited, in accordance with accepted academic practice. No use, distribution or reproduction is permitted which does not comply with these terms.
*Correspondence: Pascal Boivin, cGFzY2FsLmJvaXZpbkBoZXNnZS5jaA==
 Victor Fell1,2
 Adrien Matter
 Thomas Keller
 Pascal Boivin