 Mariam M. Allam1*
 Elfatih A. B. Eltahir2
- 1Hydrosystems Group, Civil and Environmental Engineering Department, University of Massachusetts Amherst, Amherst, MA, United States
- 2Ralph M. Parsons Laboratory, Massachusetts Institute of Technology, Civil and Environmental Engineering, Cambridge, MA, United States
The Nile basin ecosystem is under stress due to rapid population growth, inefficient utilization of resources, climate change, and persistent conflicts among riparian countries. The Blue Nile is a major tributary of the Nile River and contributes about 60% of the total annual flow. This paper presents a framework for optimal allocation of land and water resources in the upper Blue Nile (UBN) basin. This framework consists of two optimization models that aim to: (a) allocate land and water resources optimally to rain-fed and irrigated agriculture, and (b) allocate water to agriculture and hydropower production while maximizing the total net benefits. The optimal agricultural expansion is expected to reduce the UBN flow by about 7.6 cubic kilometers, impacting the downstream countries Egypt and Sudan. Optimal operation rules for the Grand Ethiopian Renaissance dam (GERD) are identified to maximize annual hydropower generation from the dam while achieving a relatively uniform monthly production rate. Trade-offs between agricultural expansion and hydropower generation are analyzed in an attempt to define scenarios for cooperation that would achieve win-win outcomes for the three riparian countries sharing the basin waters.
Introduction
Water, food, and energy are basic human needs with many interactions between them. These interactions define the water-food-energy nexus. In order to produce food, water, and energy are primary inputs (Khan and Hanjra, 2009; Mushtaq et al., 2009; UN-DESA, 2011). Similarly, in order to produce energy, water is mostly either a direct input for hydropower generation or an indirect one through bio-fuels and oil excavation, and last but not least in order to use water, energy is needed. This highlights the complexity of the interactions between the three elements and the importance of considering them together in decision-making while considering the trade-offs and synergies that result from different basin-wide management scenarios of the three resources. This study looks into the water-food-energy nexus in the Upper Blue Nile (UBN) basin within the Ethiopian borders. The UBN basin covers more than half of the Blue Nile basin's area. The Blue Nile basin is a transboundary system shared by three countries facing water-scarcity problems which escalated the Nile water conflict.
The Blue Nile contributes about 60% of the total Nile River flow at Aswan and is shared by the three countries: Egypt, Ethiopia, and Sudan. In 2011, Ethiopia announced the construction of the Grand Ethiopian Renaissance dam (GERD) at the outlet of the UBN basin, right at the border between Ethiopia and Sudan. The GERD construction was announced suddenly and without prior consultation with neighboring countries (Hammond, 2013; Sanyanga, 2014; Salman, 2016). The dam, currently under construction, is relatively large compared to the border dam and the millennium dam which were previously proposed and designed at the same location (USBR, 1964; IPOE, 2013). The GERD has been a source of controversy between Ethiopia and Egypt. On one hand, Egypt fears the risks of reducing its Nile water flows and the potential loss of its fertile lands and hydropower production from the High Aswan Dam. On the other hand, the Ethiopian government is expecting the GERD to help meet its increasing domestic electricity demands, export electricity to neighboring countries, and fishery development (Pottinger, 2013). However, uniform flows downstream the GERD will provide some benefits for Sudan which include: protection from high floods, providing an opportunity for agricultural expansion, reducing reservoirs' siltation, and enhancing hydropower output from the existing hydropower plants (Whittington et al., 2014).
The Upper Blue Nile basin (UBN) extends from Lake Tana in the Ethiopian highlands to the Sudanese border at Diem and has a drainage area of 176,000 square kilometers. The UBN's climatology varies from humid to semiarid. The annual precipitation increases from northeast to southwest and ranges from 1,200 to 1,600 mm (Conway, 1997, 2000; Tafesse, 2001; UNESCO, 2004; Kim et al., 2008). The mean annual temperature is about 18.5°C (Kim et al., 2008), and the annual potential evapotranspiration is estimated to be about 1,100 mm (Gamachu, 1977; Kim et al., 2008).
There are several optimization studies that evaluate the impacts of the basin's agricultural and hydropower potential development on downstream countries, based on the recommendations of the 1964 United States Bureau of Reclamation (USBR) study. Guariso and Whittington (1987) applied a linear programming model to maximize hydropower production in Ethiopia and agricultural expansion in Egypt and Sudan. They concluded that the irrigation development of the UBN basin would reduce the downstream flows and the High Aswan Dam (HAD) storage. Whittington et al. (2005) have developed the Nile Economic Optimization Model (NEOM), a deterministic non-linear model that optimizes the entire Nile basin water resources development. This study finds that the total direct economic benefits are relatively evenly distributed among Ethiopia, Egypt, and Sudan. However, they found that irrigation benefits would be mainly reaped in the downstream countries Sudan and Egypt from a system-wide perspective to capture the hydroelectric power generation along the Blue Nile gorge upstream. They conclude that abstracting irrigation water upstream results in significant losses in hydro-electric power generation which is the main source of economic benefits for the upstream countries Ethiopia and Uganda. Several network flow optimization models have been used for optimal basin-wide water allocation (McBride, 1985; Kuczera and Diment, 1988; Hsu and Cheng, 2002). However, since these modeling efforts were in network form, they were not capable of capturing the spatial variability in the basin land use, slope, soil, and climatology.
There are several studies on the optimal spatial allocation of water resources (McKinney and Tsai, 1996; Watkins et al., 1996; McKinney and Cai, 2002; Whiteaker et al., 2007). These studies have only analyzed agriculture using the data for the proposed irrigation projects in Ethiopia's masterplan and the outputs of the USBR study without revisiting the agricultural potential of the UBN basin lands and how to optimally allocate the lands between rain-fed and irrigated agriculture. Alemayehu et al. (2010) used the WEAP model to simulate irrigation water demand, hydropower and environmental flows under four scenarios: baseline, ongoing development, likely future development, and full potential development. They showed that if all the planned development occurs, on average 2,198 GWh/year power could be generated, 677 Mm3/year of water supplied to irrigation schemes, and the mean annual water level of Lake Tana May be lowered by 0.44 m.
Simulation-based optimization models have also been used to solve large-scale river basin problems (Loucks, 1979; Wurbs, 1993; Loucks et al., 2005; Rani and Moreira, 2010). This combined approach utilizes an optimization model for screening purposes and a simulation model to evaluate the optimum alternatives. Extensive research has been done on the optimal allocation of water in agricultural lands using different procedures including: stochastic-dynamic programming (Ghahraman and Sepaskhah, 2002), simulated annealing (Georgiou and Papamichail, 2008), real-time modeling (Delavar et al., 2011; Ramezani Etedali et al., 2013), fuzzy programming (Safavi and Alijanian, 2010), genetic algorithm (Haq and Anwar, 2010), and particle swarm optimization (Nagesh Kumar and Janga Reddy, 2007; Khashei and Bijari, 2011). Evolutionary algorithms and multi-objective programming have been applied as well-related classes of problems, such as deficit irrigation (Ganji et al., 2006), cropping patterns (Nagesh Kumar et al., 2006; Sarker and Ray, 2009; Zeng et al., 2010; Bergez, 2013), water resource systems (Nagesh Kumar and Janga Reddy, 2007; Sulis and Sechi, 2013), irrigation planning (Haq and Anwar, 2010; Gurav and Regulwar, 2012; Anwar and Haq, 2013), and economic optimization (Alvarez et al., 2004; Groot et al., 2012; Singh and Panda, 2012).
Several studies have investigated the impacts of the initial filling of the GERD on the downstream Nile River flows (King and Block, 2014; Zhang et al., 2016). Different conclusions were reported on the method and years of filling, for different scenarios of the Blue Nile flow ranging from dry, up to wet years. Wheeler et al. (2016) concluded that with effective communication and coordination between the three countries and an agreed annual release from the GERD, increased benefits and reduced downstream risks can be achieved. Similarly, Jeuland et al. (2017) investigated the long-term impacts of the GERD on Ethiopia, Sudan, and Egypt and found that through maximizing the overall economic benefit of the three countries, the annual economic benefit to Ethiopia would increase from 253 to 1,465 million US$ from hydropower generation, but the annual economic benefit to Sudan would decrease from 1,691 to 1,595 million US$ as a result of maximizing hydropower from all Nile dams and promoting downstream agricultural production in Egypt.
The objective of this paper is to provide an integrated approach to optimally allocate water and land resources between rain-fed and irrigated agriculture and hydropower to address the water-food-energy nexus in the UBN basin and find win-win opportunities to resolve the ongoing Nile water conflict. However, we would like to acknowledge that although this modeling exercise provides great insight to aid political decision makers, cooperation among riparian countries sharing an international river basin is usually very rare. This study will show how cooperation among the riparian countries can yield higher benefits for the river basin system as a whole which is often hindered by domestic politics, uncertainty of future supply and demand and the corresponding transaction costs.
Approach
Our approach to analyze the food-water-energy nexus in the UBN basin consists of three main stages. The first stage is identifying the agricultural potential in the UBN basin through delineating the lands suitable for rain-fed and irrigated agriculture. After identifying the basin's agricultural potential, we delineate them into different suitability classes and calculate the quantity required of soil treatment inputs to improve the UBN soils from one suitability class to a class with higher agricultural productivity and corresponding costs. The arability maps and the assimilated basin hydrology obtained in our previous research (Allam et al., 2016) are then used as input data to a land-water allocation model that optimally allocates the water and land resources between rain-fed and irrigated agriculture. Finally, a hydropower operation model is constructed to maximize the hydropower production from the GERD.
Delineation of Potential Arable Lands
A land evaluation analysis is conducted by applying the FAO Framework for land evaluation (FAO, 1976) through a GIS Multi-Criteria Decision Making (MCDM) platform to delineate the potential arable lands in the UBN basin. After screening several topography and soil properties datasets, it was found that the 90 m resolution SRTM DEM (Farr et al., 2007) and the African Soil Information Service (AFSIS) (Leenaars et al., 2014) are the most representative datasets for the UBN basin. The UBN basin lands are classified according to their degree of suitability; namely highly suitable (S1), moderately suitable (S2), marginally suitable (S3), and physically unsuitable for agriculture (N) based on the crop soil properties requirements according to Sys et al. (1985, 1993). Furthermore, a temperature suitability analysis is conducted using the 0.5- degree resolution globally available CRU temperature dataset (CRU TS 2.0) (Harris et al., 2014). This analysis is done for five crop groups: (a) Cereals: including teff, sorghum, millet, wheat, and barley, (b) Legumes: including peas, beans, lentils, and pulses, (c) Oilseeds: including sesame, sunflower, safflower, and cotton, (d) Coffee and (e) Sugarcane. These crop groups were chosen based on the atlas of agriculture in Ethiopia prepared by both the Cental Statistical Agency (CSA) and the International Food Policy Research Institute (IFPRI) for the period 2006/07 to 2010/11.
Land-Water Allocation to Rain-Fed and Irrigated Agriculture
The optimal water and land allocation in the UBN is investigated using an optimization model that maximizes the agricultural net-benefits from rain-fed and irrigated agriculture in the upper Blue Nile basin. The inputs to the model are the long-term average basin hydrology for the duration of 2002-2013, assimilated using a monthly data assimilation model (Allam et al., 2016) and the delineated arable lands. The model is constrained with mass and energy balance equations, crop production functions and relevant hydrologic thresholds. Data on production costs such as soil treatments, fertilizers, transportation costs, and the crop market prices and crop production were collected from several global data sources such as Faostat (2016) and USDA (2016) and local data sources obtained from a collaborator from local studies that were done within the basin or in nearby areas (Ibrahim, personal communication). Soil treatments such as limestone and sulfur application rates are obtained from several studies on the soil acidity and alkalinity (Spies and Harms, 1988; Everhart, 1994; Mitchell and Huluka, 2008; Anderson et al., 2013). The decision variables are the size of cropped and natural vegetation areas, flow routing through the basin, and crop yields. The model allocates land to different crop groups and allows for improving the land from one suitability class to another in order to achieve higher yields at an incurred cost for soil enhancement inputs. Eleven potential irrigation reservoirs are identified from Ethiopia's master plan—all of them are considered here as an input for the optimization model. The model decides on the ones that are best to invest in and their optimal capacity. Table 1 summarizes the 11 proposed projects and their costs.
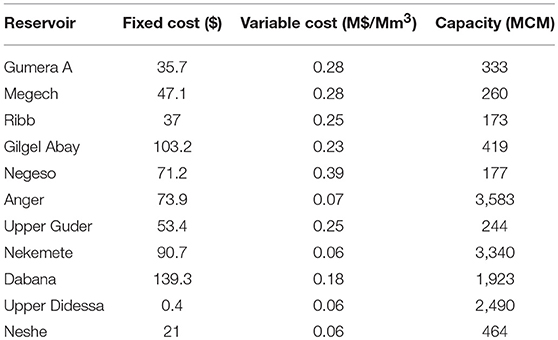
Table 1. A summary of the proposed irrigation reservoirs, their proposed capacity, and their costs.
The objective function of the optimization model is:
Where:
pcrop: crop market price in ($ per ton) for a production of a crop
ccrop: crop inputs costs in ($ per ton) for a unit production of a crop
Ycrop: crop production in Tons
FCRES VCRES, FCIRR and VCIRR: The Fixed and Variable costs for the reservoir and irrigation infrastructure, respectively.
yRES: binary variable to decide whether or not to build an irrigation reservoir and the corresponding irrigated areas.
VRES:Model decision on a reservoir volume.
AIRR: Model decision on the irrigated area.
d: discounting factor calculated as:: where r = 5% and T = 40 years.
The model is formulated on a regular grid of quarter degree (~25 km) pixels (Figure 1) and describes temporal changes over a typical year, using a monthly time step along with the following constraints.
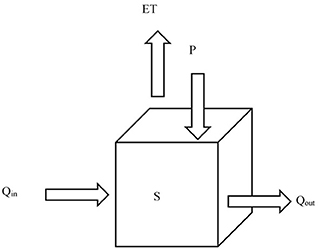
Figure 1. A schematic diagram of a typical grid cell with hydrologic variables used in the data assimilation procedure.
The water budget (or mass balance) constraint for each pixel:
Where;
ΔSn, m: The change in the monthly storage of pixel n (km3/month), time step m
Qin: The flow into the pixel from tributary pixels contributing into it
Qout: The outflow from the pixel as shown in Figure 1
Pn, m: The pixel long-term average monthly precipitation for the period 2002-2013 (km3/month) and
ETn, m: The pixel monthly evapotranspiration (km3/month).
The inflow to pixel n is the sum of all contributions from upstream pixels:
The storage in each pixel is limited by the soil water holding capacity with a root zone of depth 1.5 m which depends on the soil type in each pixel. If storage exceeds the capacity, the excess water contributes to runoff toward a downstream pixel:
The change in storage in each pixel is constrained by the soil infiltration and exfiltration capacities as follows:
Where:
Sthreshold: The storage water holding capacity in pixel (km3) using the HWSD dataset (FAO/IIASA/ISRIC/ISS-CAS/JRC, 2012)
ΔSmin&ΔSmax: The infiltration and exfiltration capacity rates of the basin's soil which vary from pixel to pixel based on the soil type based on HWSD dataset (FAO/IIASA/ISRIC/ISS-CAS/JRC, 2012).
The monthly pixel actual evapotranspiration is divided into three components; evaporation from water bodies ETlaken, m, crop evapotranspiration ETcropn, m and evaporation from natural vegetation and soils ETnatvegn, m as follows:
Where;
Kcropn, m: The crop factor, FAO I&D No. 33 (Doorenbos and Kassam, 1979).
PETn, m: The pixel monthly long-term average potential evaporation for the period 2002-2013 cubic kilometers.
The crop area fraction of pixel n.
Knatvegn, m: The implicit natural vegetation crop factor (Allam et al., 2016).
: The natural vegetation area fraction of pixel n.
Evapotranspiration is constrained by the energy balance as follows:
Where;
Rnetn, m: The monthly available net radiation for pixel n (W/m2)
λ: The latent heat of vaporization (kJ/kg)
CF: Unit conversion factor
C: A constant parameter to account for the sensible and ground heat fluxes
ΔTn, m: The monthly change in temperature at pixel n.
The land constraints ensure that the pixel area is solely divided between cropland and natural vegetation, the crop area is less than the delineated arable area to that crop and that the crop area is left fallow after the season ends as follows:
The last two equations ensure that if an area is allocated as cropland it is seen through from plant date to harvest without changing the crop during the season. They prevent the optimization program from gaining an unrealistic advantage by switching crops when a crop demands less water or from changing the size of the plot devoted to cropland.
A crop can be allocated to a cropland if and only if the available water depth in the root zone is greater than the crop water requirement:
Where;
Srootn, m: The soil moisture in the root zone.
AWn, m: The monthly available water depth in the root zone in pixel n.
yrainn, crop & yrainsn, crop: The binary variables that take the value of one when the available water is greater than the crop water requirement and zero if otherwise.
A constraint to allow for some water-stressed crop production from rain-fed agriculture with a crop yield reduction corresponding to the water stress according to the FAO Irrigation and Drainage Paper No. 33 (Doorenbos and Kassam, 1979).
Where:
The crop production constraint for non-water-stressed and water-stressed crops is formulated as follows:
Where;
LGPcrop: The length of growing period for the corresponding crop group.
Production constraints for staple crops such as teff, legumes, and cereals were included in the model to account for the national use of crops for food security purposes. This constraint was calculated as follows:
Such that:
PEth: Population in Ethiopia
cons: Per capita consumption if crop
PSharebasin: The share of the country's total production grown in the UBN basin.
Population data was extracted from landscan database (Bright et al., 2017), per capita consumption and shares grown in the basin data were obtained from the IFPRI report “The structural transformation in Ethiopia: Evidence from cereal markets”.
The equations below describe the model constraints for the irrigation reservoirs capacity, water balance, and the irrigation water requirements:
Where;
SRes, m: is the reservoir water storage for month m and reservoir Res.
Qi n Res, m: is the monthly inflow into Reservoir Res.
Qou t Res, m: is the monthly outflow from Reservoir Res.
IrrDivIrr, m: is the irrigation diversion for the irrigation area corresponding to Reservoir Res.
The GERD Operation Model
A non-linear optimization model is formulated to identify the optimal operations for the GERD through minimizing the deviation between the GERD monthly hydropower production and the maximum installed turbines capacity. The objective function is formulated as follows:
Such that:
HPMax: GERD max hydropower capacity calculated as: NdaysmNhoursdPCAPPF
Ndaysm: The Number of operating days in month m
Nhoursd: The Number of operating hours per day
PCAP: The total installed power plant capacity (6,000 MW)
PF: Plant factor (0.62).
The GERD operation model is based on a set of constraints that describe the reservoir capacity, the turbines capacity, the spillway capacity, the storage depth relationship, water balance, and hydropower production. The Reservoir, turbine, and spillway capacity equations are described as:
The Mass balance equations for the GERD are represented as:
The hydropower production is formulated as:
Such that:
SGERDm: Reservoir Storage for month m (km3)
dGERDm: Reservoir depth for month m (m)
Qspillwaym: Spillway discharge during month m (km3/month)
QTurbinesm: Flow through the GERD turbines during month m (km3/month)
γ: Specific weight of water (KN/m3).
Results and Discussion
Evaluation of L and Arability
The main factors constraining the UBN basin lands suitability for agriculture are steep slopes and soil pH. The analysis shows that soil pH and, specifically, the soil acidity in the central areas of the UBN basin greatly limits the basin arability to cereals, legumes, and oilseeds. Coffee, however, is more tolerant to the acidic soils in the central areas of the basin unlike the other crops but more sensitive to the soil limestone content (alkalinity) which limits about 5% of the basin's arability to coffee. Table 2 shows the fractions of the UBN basin lands that are excluded from the different suitability classes and constrained only by slope, or by both slope and/or soil pH. Figure 2 shows the spatial distribution of the UBN basin's suitable lands for growing cereals. In general, temperature is not a limiting factor for agriculture in the basin except for growing arabica coffee, which requires lower temperatures. Hence, 28% of the basin area in the lower western lands is not suitable for growing coffee especially during the dry season (March through May).
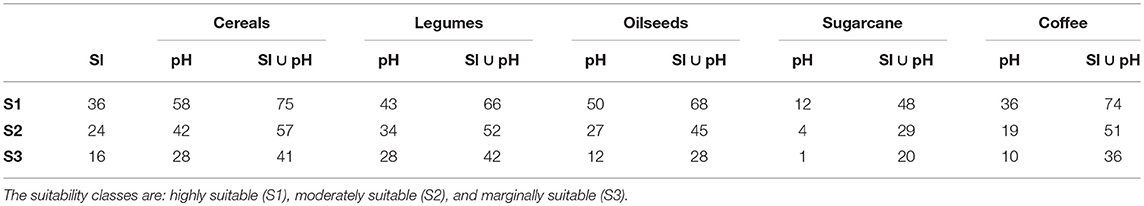
Table 2. A summary of the fraction of the UBN basin lands limited by slope (%), soil pH, and both slope and/or pH for different land suitability classes and for different crop groups.
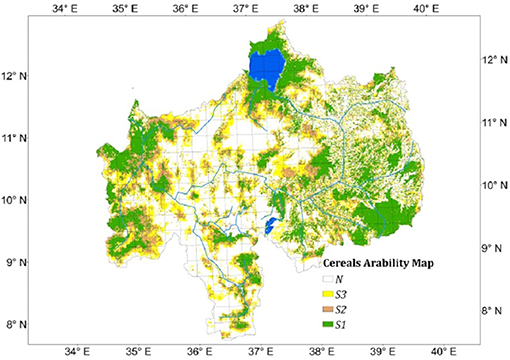
Figure 2. Delineated suitable lands for agriculture at different land suitability levels for cereals.
Land-Water Allocation Model
The land-water allocation model finds that 50 percent of the basin area could be converted from the current land-use, which consists mainly of savanna and shrublands, to rain-fed agriculture; maximizing the revenues of rain-fed grown crops adding up to 5,000 Million USD for the average flow year. It should be mentioned that the current population density in these areas is less than 20 people for each square kilometer of area (Bright et al., 2017) due to the spread of the tsetse fly in these areas, which leads to death of young cattle and the abortion of cows which drove away the grazing communities from this region. Figure 3 shows a comparison between the basin areas defined as cropped lands according to the 2009 MODIS land use dataset and the optimal cropland allocation model. Most of the croplands are allocated to grow teff, with an area of about eight and a half million hectares, and a corresponding yield of nine million tons. Teff is an important food grain and an economically superior staple crop that accounts for about quarter the cereal production in Ethiopia and is used to make injera (Gabre-Madhin, 2001). Teff is priced twice as high as Sorghum, the cheapest cereal in the country (Figure 4). The UBN basin currently supplies Ethiopia with 70 percent of its total consumption of teff (Minten et al., 2012). The rest of the allocated croplands grow legumes and oilseeds with areas of 160 thousand and two thousand hectares, respectively. The reduction in the basin run-off corresponding to the optimal land-water allocation is expected to be about 7.55 cubic kilometers. Figure 5 shows a comparison between the current monthly run-off and the run-off with the rain-fed agricultural expansion that maximizes net-benefits.
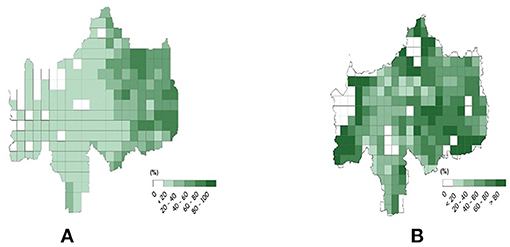
Figure 3. A comparison between (A) the existing cropland using 2009 MODIS land use dataset and (B) the model optimal cropland that maximizes the rain-fed agriculture Net Benefits.
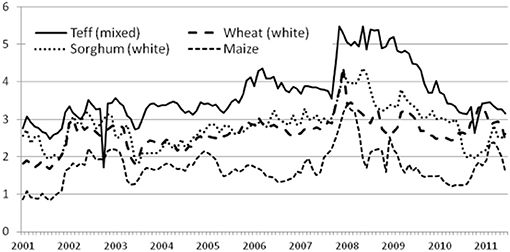
Figure 4. A comparison of cereal prices in Addis, 2001-2011 compiled based on Ethiopian Grain Trade Enterprise (EGTE) wholesale prices (in ETB per kg) (Minten et al., 2012).
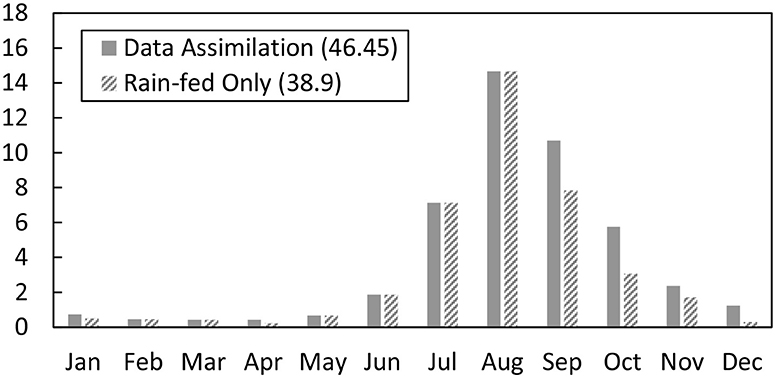
Figure 5. A comparison between the long-term average basin runoff and the resulting runoff after allocating water and land resources to rain-fed agriculture.
The model is also run for the minimum and the maximum precipitation years within the available remotely sensed precipitation data from 1998 to 2015 to test for the sensitivity of the optimal allocation to rainfall variability. The annual precipitation depth averaged over the basin varies from 1,100 mm for the driest year to 1,310 mm for the wettest year. Table 3 summarizes the net benefits from rain-fed agriculture for the dry, average and wet years, the incurred costs for agriculture inputs and the total revenue. The maximum net benefits from agriculture vary between 1,280 and 2,300 Million USD for the dry and wet years. The cropland area varies between 31 percent of the total basin area for the dry year scenario to 51 percent for the wettest year scenario, and the annual production of teff varies between 5.1 and 9.4 M tons.
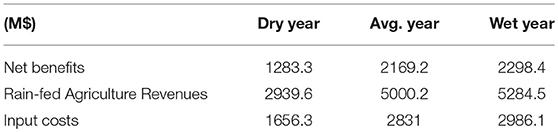
Table 3. The maximized net benefits from rain-fed agriculture, the crops revenues, and the input costs for the dry, average, and wet years.
The annual production of legumes does not vary significantly between the driest and the wettest years, but a drop occurs in the average flow year. This drop is due to the conversion of lands that were dedicated to grow legumes in the driest year to grow teff instead since teff is more water consumptive which limits its growth in the dry-year scenario yet it is more profitable which makes it more desirable economic-wise as more water becomes available in the average flow year. Similarly, the oilseeds production decreases with the increase in rainfall.
For irrigated agriculture, the model finds that only three out of the 11 proposed irrigation reservoirs are economically attractive. The three reservoirs are Ribb, Gilgel Abay, and Dabana. The model builds both Ribb and Gilgel Abay up to their design capacities proposed in the master plan, while Dabana is built to about half of the proposed design capacity, as shown in Figure 6. The model allocates most of the irrigated lands to sugarcane due to its high productivity and revenues. For the three irrigation projects the sugarcane yield is about four million tons, with a production value of about 500 Million USD. The coffee yield, however, varies between 18,000 tons in the dry year and 26,000 tons in the wet year with a corresponding production value that varies from 75 to 104 Million USD.
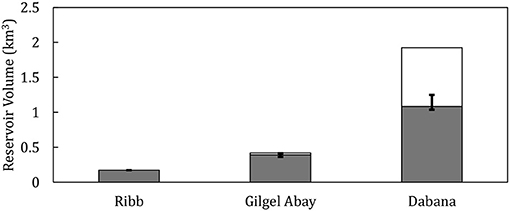
Figure 6. The model reservoir capacity compared to the master plan (the red error bar shows the model built reservoir capacities for the dry and wet years).
The GERD Operation Model
The optimal GERD reservoir operation can be achieved by maintaining a monthly flow through the turbines of about three to four cubic kilometers. The corresponding hydropower production is mostly uniform with higher hydropower generation during the summer where the electricity demands usually peak. Figure 7 shows the monthly hydropower production for the dry, average, and wet year scenarios. The model estimates the maximum uniform monthly hydropower that can be generated from the GERD to be about 700, 800, and 1,100 GWh for the dry, average, and wet year scenarios, respectively. However, an extra 1,000 GWh can be generated annually if the water is allocated to hydropower rather than expanding rain-fed agriculture upstream of the GERD in the three scenarios. This highlights the trade-off between allocating water for agriculture upstream of the GERD and saving the water for hydropower production. In order to test the sensitivity of the optimal allocation to teff price changes, the model is run using a range of teff market prices. Figure 8 shows the Teff market price according to the national bank of Ethiopia and the Ethiopian Revenues and Customs Authority (ERCA), and the local Teff market price in Addis Ababa according to the Ethiopian Grain Trade Enterprise (EGTE). The price of 550 USD per ton is used to reflect the average market price of Teff in the model, which is below the lower end of the export prices of Teff from Ethiopia.
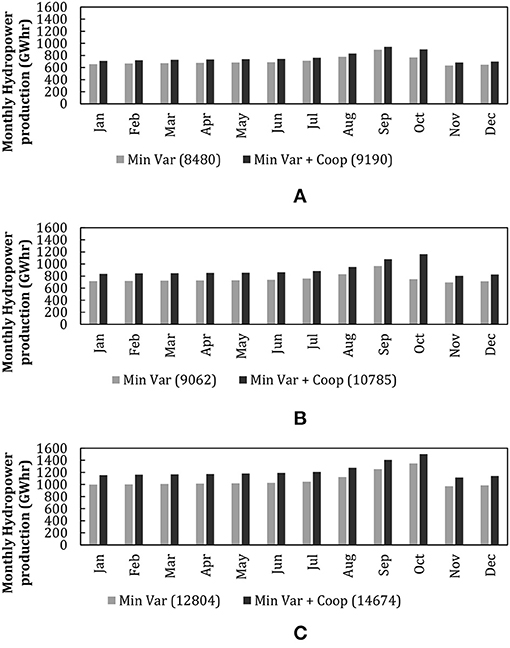
Figure 7. Maximum monthly hydropower Production for (A) dry year scenario, (B) average year rainfall scenario, and (C) wet year scenario. For each precipitation scenario two operation scenarios are modeled: (i) Min Var: Operating the GERD such that a uniform hydropower production is maintained with minimum variability from month to month (ii) Min Var + Coop: Operating the GERD such that a uniform hydropower production is maintained with minimum variability from month to month and assuming the three stakeholder countries would cooperate in efficient agricultural investment with the agreement that historical flows of the UBN basin will be maintained.
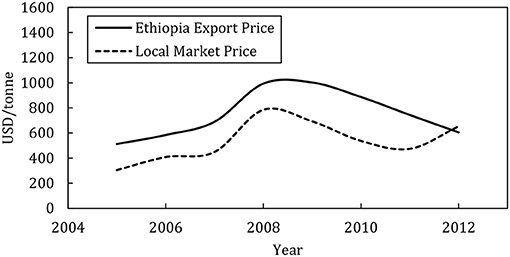
Figure 8. A time series of Ethiopia's Teff export price and the local market price in Addis Ababa for the years 2005-2012 (Source: The national bank of Ethiopia and ERCA and EGTE).
The land water allocation model finds that only when the price drops to half of the current market price or below, i.e., 225 USD per ton, the model chooses not to grow teff, since its market price becomes lower than the costs of inputs required to grow it. In this case, saving water for hydropower generation through the GERD becomes more economically attractive than growing oil crops and legumes upstream of the dam. However, if the teff market price exceeds 300 USD per ton, then teff agriculture becomes more valuable than hydropower generation through the GERD.
Figure 9 shows the total net benefits from both agriculture and hydropower plotted against the ratio between hydropower pricing and teff market price for two different scenarios:
a) The No-cooperation scenario: in this scenario, we assume that the only interest is maximizing the total net-benefits of Ethiopia with no regards to impacts on downstream countries sharing the UBN basin waters. In this case, rain-fed agriculture is expanded to maximize the agricultural net-benefits.
b) The Cooperation scenario: in this scenario, we assume that the three stakeholder countries are cooperating in expanding the agriculture in the UBN basin efficiently such that the downstream flows are not impacted, and historical flows are maintained at the UBN basin outlet. In this case, all the UBN water flow is allocated for hydropower generation through the GERD.
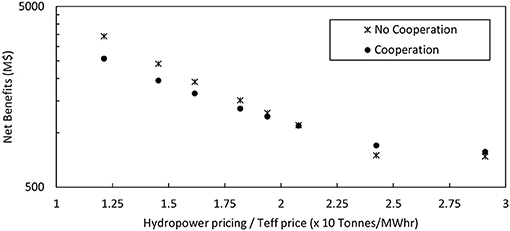
Figure 9. The total net benefits plotted against the ratio of the hydropower pricing to Teff market price for cooperation and no-cooperation scenarios.
The intersection of the total net-benefit plots of those two scenarios gives the ratio at which both hydropower and teff become equally profitable. This ratio is found to be around 0.21 Ton/MWH, above which saving water for hydropower production becomes more profitable than growing teff.
The allocation models are used here to illustrate the impact of constraining the outflow at the outlet of the UBN basin. We first assume the price of teff to be about $550 per ton to represent the current teff market price, and the price of electricity to be about 8 cents per kwh. In Figure 10, as the magnitude of the reduction in annual water flow is constrained to vary from 0 to 12 cubic kilometers per year, the additional net benefits from agriculture increases from 0 to about 600 Million USD. At the same time, the reduction in net benefits from hydropower production increases almost linearly from 0 to about 200 Million USD. As illustrated by Figure 10, if the current agricultural water consumption in the UBN basin is reduced to increase the historical UBN basin flow by about two cubic kilometers, that would generate about 10 Million USD hydropower net benefits but would at the same time reduce the agricultural net benefits by about 800 Million USD, which reduces the total net benefits significantly. This is due to the large potential for expanding the production of profitable crops such as teff, which makes the marginal value of a unit of water consumed in agriculture high. As agriculture is expanded further and the teff arable lands are exploited to their capacity, lower value crops such as legumes are expanded, and that is when the marginal value decreases until the slope becomes flat; when the total agricultural potential has been tapped. In order to find the optimal water allocation that maximizes the total net benefits, the added net benefits to agriculture should be maximized while minimizing the net benefits lost from hydropower as much as possible, which occurs at an additional water consumption of about 7.6 cubic kilometers. These results illustrate the tradeoff between agriculture and hydropower in the UBN basin.
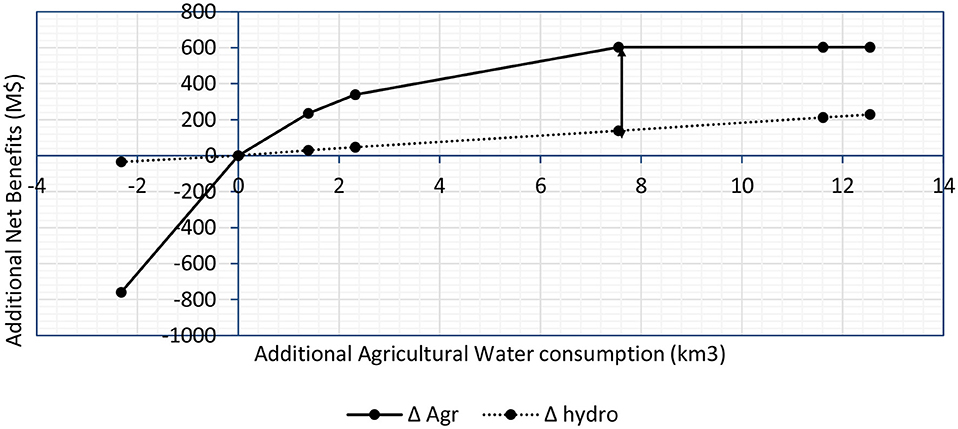
Figure 10. Illustration of the trade-off between agriculture and hydropower and the optimal allocation in the UBN basin. The horizontal axis shows the additional agricultural water consumption compared to the current water land use, while the vertical axis shows the additional benefits either added to agriculture or lost from hydropower corresponding to that consumption. The green curve shows the net benefits added to agriculture if additional water is allocated to agriculture while the blue line shows the net benefits lost from hydropower corresponding to this extra water allocation to agriculture.
Figure 11 shows an alternative plot that shows the optimal hydropower pricing corresponding to a range of teff market prices at which the trade-off between agriculture and hydropower is neutralized. The figure is divided into two zones: a teff dominating zone where allocating the water to grow teff is more profitable, and a hydropower dominating zone where saving water for hydropower purposes is more profitable. The cross shows that the current teff market price and the proposed hydropower pricing by Ethiopia fall into the teff dominating zone at which the total net-benefits are not maximized. In order for Ethiopia to maximize its total net benefits, the hydropower sold to the neighboring regions needs to be priced to be at least 13 cents per kwhr, which is relatively high and almost equivalent to the price of electricity generated using fossil fuels.
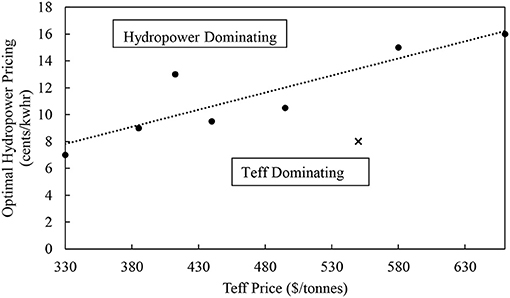
Figure 11. The optimal hydropower pricing at different teff market prices (The red cross indicates the current market price for teff and the hydropower pricing set by Ethiopia). The horizontal axis shows different Teff market prices while the vertical axis shows the corresponding electricity price that should be set by Ethiopia to not lose benefits due to potential agricultural expansion. The cross corresponds to the nominal prices of $550 per ton for teff and $0.08 per kwh for electricity. This figure was calculated using on the long-term average UBN basin hydrology.
This summarizes the water-food-energy nexus in the UBN basin. The optimal allocation to maximize the total net-benefits of the UBN basin land and water resources at the current crop prices is to allocate about half of the basin area to grow rain-fed teff with a corresponding water consumption of about 7.55 cubic kilometers. This water consumption is deducted from the water flowing through the GERD turbines, which reduces the annual hydropower production by a thousand GWh from the potential production if the hydropower production is to be maximized. The question here becomes whether to generate energy for meeting the country's demands is more important than maximizing the total net-benefits from using the basin resources. This analysis can be easily extended using long stochastic time-series to study the year to year rainfall variability and climate models projections forcing data to study the impact of climate change.
Conclusions
This paper presents a framework for optimal allocation of a river basin's land and water resources between rain-fed and irrigated agriculture and hydropower. This framework is applied on the UBN basin as a case study of a water-scarce transboundary basin with escalated conflicts between the stakeholder countries sharing its waters to help find win-win opportunities. The land-water allocation model finds significant potential for expanding rain-fed agriculture covering up to half of the basin area by adding soil enhancements. This agricultural expansion is expected to reduce the annual flow of the Blue Nile river by about 7.55 cubic kilometers. The model also finds that only three of the 11 irrigation schemes proposed in Ethiopia's master plan make economic sense and grow mostly sugarcane in these irrigated areas. The optimal operation for the GERD involves regulating the monthly releases through the turbines to be about three to four cubic kilometers, and fluctuating the storage to be slightly reduced before the rainy season and filled up during the rainy season. There is a clear trade-off between expanding the rain-fed agriculture potential in the UBN basin and saving the water for hydropower production at the GERD. This trade-off can offer an opportunity for a win-win solution for the Nile conflict if the countries decide to cooperate in investing in an efficient rain-fed agricultural expansion in the basin and sharing the benefits and costs.
Data Availability Statement
All the datasets used for hydrology, soil, and topography are global publically available and all were properly cited online.
Author Contributions
MA has made a substantial contribution to the conception and design of the work, analysis and interpretation of the data for the work. She has also drafted the work and agrees to be accountable for all aspects of the work in ensuring that questions related to the accuracy and integrity of the work are appropriately investigated and resolved. EE and MA have made a substantial contribution to the conception and design of the work.
Conflict of Interest Statement
The authors declare that the research was conducted in the absence of any commercial or financial relationships that could be construed as a potential conflict of interest.
Acknowledgments
This is to acknowledge the contribution of Dr. Yossif A. Ibrahim who helped us greatly with data on irrigation projects in the Ethiopia master plan. Data on project specs and crops and construction costs. This data was crucial to address irrigated agriculture in the basin.
References
Alemayehu, T., McCartney, M., and Kebede, S. (2010). The water resource implications of planned development in the Lake Tana catchment, Ethiopia. Ecohydrol. Hydrobiol. 10, 211–221. doi: 10.2478/v10104-011-0023-6
Allam, M. M., Jain Figueroa, A., McLaughlin, D. B., and Eltahir, E. A. B. (2016). Estimation of evaporation over the upper Blue Nile basin by combining observations from satellites and river flow gauges. Water Resour. Res. 52, 644–659. doi: 10.1002/2015WR017251
Alvarez, J. F. O., de Juan Valero, J. A., Martín-Benito, J. M. T., and Mata, E. L. (2004). MOPECO: an economic optimization model for irrigation water management. Irrig. Sci. 23, 61–75. doi: 10.1007/s00271-004-0094-x
Anderson, G. C., Peverill, K. I., and Brennan, R. F. (2013). Soil sulfur—crop response calibration relationships and criteria for field crops grown in Australia. Crop Pasture Sci. 64, 523–530. doi: 10.1071/CP13244
Anwar, A. A., and Haq, Z. U. (2013). Genetic algorithms for the sequential irrigation scheduling problem. Irrig. Sci. 31, 815–829. doi: 10.1007/s00271-012-0364-y
Bergez, J. E. (2013). Using a genetic algorithm to define worst-best and best-worst options of a DEXi-type model: application to the MASC model of cropping-system sustainability. Comput. Electron. Agric. 90, 93–98. doi: 10.1016/j.compag.2012.08.010
Bright, E. A., Rose, A. N., Urban, M. L., and McKee, J. J. (2017). LandScan 2016 High-Resolution Global Population Data Set. Computer software. Vers. 00. Oak Ridge, TN: USDOE.
Conway, D. (1997). A water balance model of the Upper Blue Nile in Ethiopia. Hydrol. Sci. J. 42, 265–286. doi: 10.1080/02626669709492024
Conway, D. (2000). The climate and hydrology of the Upper Blue Nile River. Geogr. J. 166, 49–62. doi: 10.1111/j.1475-4959.2000.tb00006.x
Delavar, M., Moghadasi, M., and Morid, S. (2011). Real-time model for optimal water allocation in irrigation systems during droughts. J. Irrig. Drainage Eng. 138, 517–524. doi: 10.1061/(ASCE)IR.1943-4774.0000440
Doorenbos, J., and Kassam, A. H. (1979). Yield response to water. Irrigation and Drainage Paper, 33, 257.
Everhart, E. (1994). How To Change Your Soil's pH. Available online at: https://hortnews.extension.iastate.edu/1994/4-6-1994/ph.html
Faostat, F. (2016). Agriculture Organization of the United Nations Statistics Division 2014. Available online at: http://faostat3.fao.org/browse/Q/QC/S [Accessed April 2015].
Farr, T. G., Rosen, P. A., Caro, E., Crippen, R., Duren, R., Hensley, S., et al. (2007). The shuttle radar topography mission. Rev. Gepphys. 45.doi: 10.1029/2005RG000183
Gabre-Madhin, E. Z. (2001). Market Institutions, Transaction Costs, and Social Capital in the Ethiopian Grain Market. Washington, DC: International Food Policy Research Institute.
Gamachu, D. (1977). Aspects of Climate and Water Budget in Ethiopia. Addis Ababa: Addis Ababa University Press.
Ganji, A., Ponnambalam, K., Khalili, D., and Karamouz, M. (2006). A new stochastic optimization model for deficit irrigation. Irrig. Sci. 25, 63–73. doi: 10.1007/s00271-006-0035-y
Georgiou, P. E., and Papamichail, D. M. (2008). Optimization model of an irrigation reservoir for water allocation and crop planning under various weather conditions. Irrig. Sci. 26, 487–504. doi: 10.1007/s00271-008-0110-7
Ghahraman, B., and Sepaskhah, A. R. (2002). Optimal allocation of water from a single purpose reservoir to an irrigation project with pre-determined multiple cropping patterns. Irrig. Sci. 21, 127–137. doi: 10.1007/s002710100040
Groot, J. C., Oomen, G. J., and Rossing, W. A. (2012). Multi-objective optimization and design of farming systems. Agric. Syst. 110, 63–77. doi: 10.1016/j.agsy.2012.03.012
Guariso, G., and Whittington, D. (1987). Implications of Ethiopian water development for Egypt and Sudan. Int. J. Water Resour. Dev. 3, 105–114. doi: 10.1080/07900628708722338
Gurav, J. B., and Regulwar, D. G. (2012). Multi objective sustainable irrigation planning with decision parameters and decision variables fuzzy in nature. Water Resour. Manage. 26, 3005–3021. doi: 10.1007/s11269-012-0062-9
Hammond, M. (2013). The Grand Ethiopian Renaissance Dam and the Blue Nile: implications for transboundary water governance. Canberra, ACT: Global Water Forum.
Haq, Z. U., and Anwar, A. A. (2010). Irrigation scheduling with genetic algorithms. J. Irrig. Drainage Eng. 136, 704–714. doi: 10.1061/(ASCE)IR.1943-4774.0000238
Harris, I., Jones, P. D., Osborn, T. J., and Lister, D. H. (2014). Updated high-resolution grids of monthly climatic observations–the CRU TS3. 10 Dataset. Int. J. Climat. 34, 623–642. doi: 10.1002/joc.3711
Hsu, N. S., and Cheng, K. W. (2002). Network flow optimization model for basin-scale water supply planning. J. Water Resour. Plan. Manage. ASCE 128, 102–112. doi: 10.1061/(ASCE)0733-9496(2002)128:2(102)
IPOE (2013). International Panel of Experts on the Grand Ethiopian Renaissance Dam Project Final Report. Addis Ababa.
Jeuland, M., Wu, X., and Whittington, D. (2017). Infrastructure development and the economics of cooperation in the Eastern Nile. Water Int. 42, 121–141. doi: 10.1080/02508060.2017.1278577
Khan, S., and Hanjra, M. A. (2009). Footprints of water and energy inputs in food production - Global perspectives Food Policy 34, 130–140. doi: 10.1016/j.foodpol.2008.09.001
Khashei, M., and Bijari, M. (2011). A novel hybridization of artificial neural networks and ARIMA models for time series forecasting. Appl. Soft Comput. 11, 2664–2675. doi: 10.1016/j.asoc.2010.10.015
Kim, U., Kaluarachchi, J. J., and Smakhtin, V. U. (2008) Generation of Monthly Precipitation Under Climate Change for the Upper Blue Nile River Basin, Ethiopia. JAWRA J. Am. Water Resour. Assoc. 44, 1231–1247. doi: 10.1111/j.1752-1688.2008.00220.x
King, A., and Block, P. (2014). An assessment of reservoir filling policies for the Grand Ethiopian Renaissance Dam. J. Water Clim. Change 5, 233–243. doi: 10.2166/wcc.2014.043
Kuczera, G., and Diment, G. (1988). General water supply system simulation model: WASP. J. Water Resour. Plan. Manage. 114, 365–382. doi: 10.1061/(ASCE)0733-9496(1988)114:4(365)
Leenaars, J. G. B., Van Oostrum, A. J. M., and Ruiperez Gonzalez, M. (2014). Africa Soil Profiles Database, version 1.2. A Compilation of Geo-referenced and Standardized Legacy Soil Profile Data for Sub-saharan Africa (with dataset). ISRIC report 2014/01. Africa Soil Information Service (AFSIS) project. ISRIC- World Soil Information, Wageningen.
Loucks, D. P. (1979). Water resources systems. Rev. Geophys. 17, 1335–1351. doi: 10.1029/RG017i006p01335
Loucks, D. P., Van Beek, E., Stedinger, J. R., Dijkman, J. P., and Villars, M. T. (2005). Water Resources Systems Planning and Management: An Introduction to Methods, Models and Applications. Paris: Unesco.
McBride, R. D. (1985). Solving embedded generalized network problems. European J. Oper. Res. 21, 82–92. doi: 10.1016/0377-2217(85)90091-8
McKinney, D. C., and Cai, X. (2002). Linking GIS and water resources management models: an object-oriented method. Environ. Model. Softw. 17, 413–425. doi: 10.1016/S1364-8152(02)00015-4
McKinney, D. C., and Tsai, H. L. (1996). Multigrid methods in GIS grid-cell–based modeling environment. J. Comput. Civil Eng. 10, 25–30. doi: 10.1061/(ASCE)0887-3801(1996)10:1(25)
Minten, B., Stifel, D. C., and Tamru, S. (2012). “Structural transformation in Ethiopia: evidence from cereal markets,” in ESSP II Working Paper 39 (Addis Ababa: International Food Policy Research Institute/Ethiopia Strategy Support Program II).
Mitchell, C., and Huluka, G. (2008). Lowering Soil pH. Auburn, AL: Alabama Cooperative Extension System, S-04–08.
Mushtaq, S., Maraseni, T. N., Maroulis, J., and Hafeez, M. (2009). Energy and water trade-offs in enhancing food security: a selective international assessment. Energy Policy 37, 3635–3644. doi: 10.1016/j.enpol.2009.04.030
Nagesh Kumar, D., and Janga Reddy, M. (2007). Multipurpose reservoir operation using particle swarm optimization. J. Water Resour. Plan. Manage. 133, 192–201. doi: 10.1061/(ASCE)0733-9496(2007)133:3(192)
Nagesh Kumar, D., Raju, K. S., and Ashok, B. (2006). Optimal reservoir operation for irrigation of multiple crops using genetic algorithms. J. Irrig. Drainage Eng. 132, 123–129. doi: 10.1061/(ASCE)0733-9437(2006)132:2(123)
Pottinger, L. (2013). A Tale of Two Dams: Comparing Ethiopia's Grand Renaissance to Hoover. International Rivers, [online]. Available online at: https://www.internationalrivers.org/blogs/229/a-tale-of-two-dams-comparing-ethiopia%E2%80%99s-grand-renaissance-to-hoover (Accessed July 20, 2013).
Ramezani Etedali, H., Liaghat, A., Parsinejad, M., Tavakkoli, A. R., Bozorg Haddad, O., and Ramezani Etedali, M. (2013). Water allocation optimization for supplementary irrigation in rainfed lands to increase total income case study: upstream Karkheh River Basin. Irrig. Drainage 62, 74–83. doi: 10.1002/ird.1700
Rani, D., and Moreira, M. M. (2010). Simulation–optimization modeling: a survey and potential application in reservoir systems operation. Water Resour. Manage. 24, 1107–1138. doi: 10.1007/s11269-009-9488-0
Safavi, H. R., and Alijanian, M. A. (2010). Optimal crop planning and conjunctive use of surface water and groundwater resources using fuzzy dynamic programming. J. Irrig. Drainage Eng. 137, 383–397. doi: 10.1061/(ASCE)IR.1943-4774.0000300
Salman, S. M. (2016). The Grand Ethiopian Renaissance Dam: the road to the declaration of principles and the Khartoum document. Water Int. 41, 512–527. doi: 10.1080/02508060.2016.1170374
Sanyanga, R. (2014). Grand Ethiopian Renaissance Dam. International Rivers. Available online at: http://www.fao.org/faostat/en/
Sarker, R., and Ray, T. (2009). An improved evolutionary algorithm for solving multi-objective crop planning models. Comput. Electron. Agric. 68, 191–199. doi: 10.1016/j.compag.2009.06.002
Singh, A., and Panda, S. N. (2012). Development and application of an optimization model for the maximization of net agricultural return. Agric. Water Manage. 115, 267–275.
Spies, C. D., and Harms, C. L. (1988). Soil Acidity and Liming of Indiana Soils. Indiana: Purdue Extension publication AY-267–W.
Sulis, A., and Sechi, G. M. (2013). Comparison of generic simulation models for water resource systems. Environ. Model. Softw. 40, 214–225. doi: 10.1016/j.envsoft.2012.09.012
Sys, C., Van Ranst, E., Debaveye, J., and Beernaert, F. (1985). Land Evaluation. State University of Ghent, International Training Centre for post-graduate soil scientists.
Sys, C., Van Ranst, E., Debaveye, J., and Beernaert, F. (1993). Land Evaluation Part III, Crop Requirements. Brussels: Agricultural Publication.
Tafesse, T. (2001). The hydropolitical assessment of the Nile Question: an ethiopian perspective. Water Int. 26, 1–11. doi: 10.1080/02508060108686945
UNESCO (United Nations Educational Scientific, and Cultural Organization) (2004). National Water Development Report for Ethiopia, UN-WATER/WWAP/2006/7. World Water Assessment Program, Report, MOWR, Addis Ababa.
USBR, US Department of Interior. (1964). Land and Water Resources of Blue Nile Basin: Ethiopia. Main Report and Appendices I-V. Washington, DC: Government Printing Office.
Watkins, D. W., McKinney, D. C., Maidment, D. R., and Lin, M. D. (1996). Use of geographic information systems in ground-water flow modeling. J. Water Resour. Plann. Manage. 122, 88–96. doi: 10.1061/(ASCE)0733-9496(1996)122:2(88)
Wheeler, K. G., Basheer, M., Mekonnen, Z. T., Eltoum, S. O., Mersha, A., Abdo, G. M., et al. (2016). Cooperative filling approaches for the Grand Ethiopian Renaissance Dam. Water Int. 41, 611–634. doi: 10.1080/02508060.2016.1177698
Whiteaker, T. L., Maidment, D. R., Gopalan, H., Patino, C., and McKinney, D. C. (2007). Raster-network regionalization for watershed data processing. Int. J. Geogr. Inform. Sci. 21, 341–353. doi: 10.1080/13658810600965255
Whittington, D., Waterbury, J., and Jeuland, M. (2014). The Grand Renaissance Dam and prospects for cooperation on the Nile. Water Policy 16:595. doi: 10.2166/wp.2014.011
Whittington, D., Wu, X., and Sadoff, C. (2005). Water resources management in the Nile basin: the economic value of cooperation. Water Policy 7, 227–252. doi: 10.2166/wp.2005.0015
Wurbs, R. A. (1993). Reservoir-system simulation and optimization models. J. Water Resour Plan. Manage 119, 455–472. doi: 10.1061/(ASCE)0733-9496(1993)119:4(455)
Zeng, X., Kang, S., Li, F., Zhang, L., and Guo, P. (2010). Fuzzy multi-objective linear programming applying to crop area planning. Agric. Water Manage. 98, 134–142. doi: 10.1016/j.agwat.2010.08.010
Keywords: UBN basin, optimal resource allocation, irrigation, hydropower, water-food-energy nexus, the Nile conflict, GERD, rainfed agriculture
Citation: Allam MM and Eltahir EAB (2019) Water-Energy-Food Nexus Sustainability in the Upper Blue Nile (UBN) Basin. Front. Environ. Sci. 7:5. doi: 10.3389/fenvs.2019.00005
Received: 26 June 2018; Accepted: 09 January 2019;
Published: 30 January 2019.
Edited by:
Jill A. Engel-Cox, National Renewable Energy Laboratory (DOE), United StatesReviewed by:
Richard Meissner, Council for Scientific and Industrial Research (CSIR), South AfricaClaudia Ringler, International Food Policy Research Institute, United States
Copyright © 2019 Allam and Eltahir. This is an open-access article distributed under the terms of the Creative Commons Attribution License (CC BY). The use, distribution or reproduction in other forums is permitted, provided the original author(s) and the copyright owner(s) are credited and that the original publication in this journal is cited, in accordance with accepted academic practice. No use, distribution or reproduction is permitted which does not comply with these terms.
*Correspondence: Mariam M. Allam, bWFsbGFtQHVtYXNzLmVkdQ==