 Caroline Sayuri Nishisaka1
 Connor Youngerman2Laura K. Meredith2Janaina Braga do Carmo1,3
 Acacio Aparecido Navarrete1,3*
- 1Graduate Program of Biotechnology and Environmental Monitoring PPGBMA, Federal University of São Carlos, Sorocaba, Brazil
- 2School of Natural Resources and the Environment, University of Arizona, Tucson, AZ, United States
- 3Department of Environmental Sciences, Federal University of São Carlos, Sorocaba, Brazil
The conversion of forest to agricultural soils is a widespread activity in tropical systems, and its link to nitrous oxide (N2O) fluxes and nitrogen cycling gene abundance is relevant to understand environmental drivers that may interact with climate change. A current challenge to estimating N2O emissions from land use conversion is an incomplete understanding of crop-specific impacts on denitrifier communities and the N2O fluxes driven by differences in the above- and below-ground inputs with crop type. To address this knowledge gap in tree crops, we evaluated N2O fluxes and denitrification gene abundance and their relationships with soil and plant residue characteristics in citrus and eucalyptus plantations in the field and in soil incubations. We found that the accumulated N2O fluxes from soil were lower for the two agricultural field sites than those for their adjacent forest sites in dry and wet seasons. The N2O fluxes were higher in the wet season, and this seasonal difference persisted even when the soils collected from both seasons were incubated under the same moisture and temperature conditions in the lab for 30 days. Increased N2O fluxes in the wet season were accompanied by an increase in soil nirK and nosZ gene abundance, the dissolved organic carbon (DOC) concentration, and the total soil carbon (C) and nitrogen (N) content. In turn, the abundance of denitrifiers, as indicated by nirK, nirS, and nosZ gene copy numbers, showed a low but significant positive correlation with soil bulk density. Our results suggest that soil moisture, leaf litter, and crop residues influence the seasonal differences in both N2O fluxes and abundance of denitrifiers in citrus- and eucalyptus-cultivated soils, likely through effects on soil physicochemical characteristics. These findings highlight the overwhelming role of environmental drivers that can make investigating microbial drivers difficult in the field and open the possibility for a better understanding of N cycling processes in tropical soils based on paired field- and incubation-based experimentation.
Introduction
Many gaseous nitrogen (N) emissions from soils are a consequence of soil microbial processes (Hallin et al., 2018). In soils, nitrous oxide (N2O) is produced by N cycling nitrification and denitrification reactions, which are mediated by enzymes encoded by nirK, nirS, and nosZ genes (Levy-Booth et al., 2014). Denitrification in agricultural soils is a leading source of anthropogenic N2O, especially in humid climates (Lammel et al., 2015; Kanter et al., 2016). Atmospheric N deposition is chronically elevated and predicted to increase in tropical regions (Reay et al., 2008; IPCC, 2014) and may stimulate additional N cycling pathways in these regions. A high demand for wood material and orange exports causes eucalyptus and citrus crops to play important roles in the agricultural sector in Brazil (Neves et al., 2010; Cavararo, 2014). However, the impacts of N additions on N2O emissions have been studied most often in natural forests and rarely in tropical plantations (Martinson et al., 2013; Mori et al., 2013; Zhang et al., 2014). The effects of agricultural management of tree crops (e.g., citrus orchards and eucalyptus plantations) on the N2O balance remain unclear.
It is critical to understand the sensitivity of the microbial communities that regulate ecosystem N cycling to the soil, and the changes in both environmental and crop-specific conditions that accompany natural forest loss via conversion to agriculture. Microbe-mediated N2O production begins with the reduction of nitrate () to nitrite (), followed by the reduction of to nitric oxide (NO), which is catalyzed by enzymes encoded by nirK and nirS genes (Pajares and Bohannan, 2016). The conversion of one-third of NO to N2O is followed by its reduction to N2 by N2O reductases encoded by nosZ genes, thereby partially mitigating N2O release to the atmosphere (Jones et al., 2008; Hallin et al., 2018). The presence of crop residues and other leaf litter affects the rate of denitrification primarily by increasing organic C availability, which is one of the most important factors influencing denitrification (Handerson et al., 2010). While different studies have investigated the links between N2O fluxes and key marker genes (Lammel et al., 2015; Liu et al., 2016), few have investigated the interplay between tree crop species, their residues, and denitrifiers that lead to different N2O emission profiles from various types of agricultural management.
In this study, we evaluated seasonal patterns in N2O fluxes and denitrification gene abundance and their relationships with soil and plant residue characteristics in citrus and eucalyptus plantations. We evaluated the following hypotheses: (1) that citrus- and eucalyptus-cultivated soils emit higher amounts of N2O to the atmosphere than their adjacent natural forest soil counterparts and (2) that the abundance of denitrifier genes, as indicated by nirK, nirS, and nosZ gene copy numbers, would be increased in citrus- and eucalyptus-cultivated soils in comparison to that in natural forest soils. We predicted that these observed differences would be driven in part by seasonal environmental variables, the chemical characteristics of plant residues and soil physicochemical characteristics. To evaluate these expectations, we determined N2O soil atmosphere trace gas fluxes, nirK, nirS, and nosZ gene copy numbers, and soil physicochemical and plant residue chemical characteristics in samples taken in the dry and wet seasons in the field and using soil and plant residue incubations. The results from our study provide the first comprehensive picture of the complex determinants of N2O cycling in the tree crops that are widespread in the tropics.
Materials and Methods
Site Descriptions
Four different field sites were chosen in Southeastern Brazil; two sites (Citrus and Forest 1) are located in the Sorocaba municipality (23° 34′ 30.76″ S; 47° 31′ 58.95″ W and 23° 34′ 14.21″ S; 47° 30′ 50.23″ W, respectively) and two others (Eucalyptus and Forest 2) are located in the Salto de Pirapora municipality (23° 36′ 07.92″ S; 47° 33′ 42.72″ W and 23° 36′ 54.13″ S; 47° 33′ 58.56″ W, respectively) in the state of São Paulo, Brazil (Figure 1).
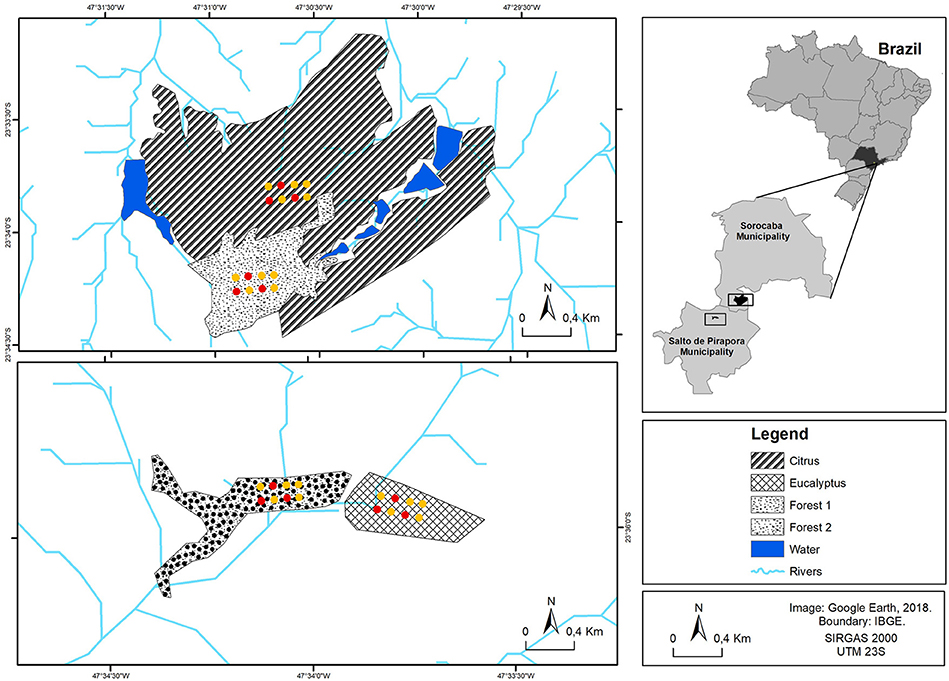
Figure 1. Sampling site locations for Citrus, Forest 1, Eucalyptus and Forest 2. The chambers for gas sample collection (red and yellow points in the diagram) were installed at each sampling site in dry and wet seasons. Soil and plant residue samples (also the yellow points in the diagram—soil and plant residue sampling cores were randomly chosen next to the yellow point chambers) were taken at each sampling site (for a total of five samples per sampling site at each season).
Among the four sampling sites, Forest 1 and Citrus are located on São Pedro Farm, with a total area of 431.5 ha with 333.7 ha of conventional citrus orchards. According to the records of 18 August 1965 and 29 July 1970, Forest 1 can be considered to be in an advanced regeneration stage without recorded anthropogenic disturbances within the last 52 years. The conversion from forest to citrus orchard occurred 48 years before our study. The orchards have been planted every 10 years since. On an annual basis, the citrus orchard received 856.8 kg ha−1 of NPK (15-10-15). This dose was split into three applications as follows: the first application was 55.1 kg ha−1 of N as NH4NO3, 36.7 kg ha−1 of P2O5 as triple superphosphate and 55.1 kg ha−1 of K2O as KCl, and the second and third applications were 36.7 kg ha−1 of N as NH4NO3, 24.5 kg ha−1 of P2O5 as triple superphosphate and 36.7 kg ha−1 of K2O as KCl. Although fertilizer recommendations were expressed in kg ha−1, all the fertilizers were mechanically spread under the canopy, which occupied half of the field area. In contrast, the Eucalyptus site is located in a 38 ha plantation. Fertilization was performed in the furrow once during eucalyptus planting and consisted of 50 kg of N in the form of urea, 250 kg of P2O5 (triple superphosphate), and 50 kg of K2O (potassium oxide) per hectare. Broadcast fertilization was performed 9 and 18 months after planting with 55 kg of N, 20 kg of P2O5, and 75 kg of K2O per hectare. The Eucalyptus site was planted 4 years prior to our study. The native 10 ha vegetation area adjacent to the eucalyptus (Forest 2) is in an advanced natural regeneration stage without any recorded anthropogenic disturbance in the last 50 years.
The regional climate is subtropical warm (humid temperatures with a warm summer according to Köppen's classification) with annual precipitation of 1,285 mm and 16.8°C and 30.1°C as the minimum and maximum average temperatures, respectively. The air and soil temperature varied <7 and 5°C, respectively, among the different sampling sites during the gas and soil sample collection. The only soil in the study sites is an Udox in a hyperthermal soil temperature regime according to the classification of Soil Survey Staff (1999).
N2O Fluxes From the Soil
The N2O flux from the soil was measured using the chamber-based method (Davidson et al., 2002) in the regional dry (July 2016) and wet (January 2017) seasons. Gas sampling was performed at all four sampling sites (Citrus, Eucalyptus, Forest 1, and Forest 2). At each site, eight cylindrical PVC bases (30 cm diameter, 22 cm height) were installed in soils under the tree canopies. All gas sampling was performed between 7:00 and 12:00 a.m. After closing the chambers, 60 mL samples were collected at 1, 10, 20, and 30 min using syringes and were transferred and stored under pressure in 20 mL evacuated penicillin flasks sealed with gas-impermeable butyl rubber septa (Bellco Glass 2048). The gas sampling was performed over 5 days at each site in each season for a total of 1,280 gas samples (i.e., 32 gas samples for each sampling site per day) in order to fit to the soil sampling and it may not represent behavior over the entire seasons. The N2O mole fractions were determined by gas chromatography with an electron capture detector (GC 2014 Shimadzu, Columbia, MD, USA). The system was equipped with a HayeSep™ N packed column (1.5 m, 80–100 mesh) for N2O separation. Helium was used as the carrier gas. Gas samples were stored at 20°C and analyzed 1–2 weeks after collection. Measurements of atmospheric pressure, chamber height and air temperature were taken during the gas sampling to determine the total moles of air in the chamber volume. The N2O fluxes were calculated for each sampling event in each site and season according to equation (Jantalia et al., 2008):
f = (ΔG/Δt)x(C/A)x(m/Vm)
Where: f = gas flux, N2O (mg N-N2O m−2 day−1);
Δ G = concentration of N2O during sampling;
Δ t = time period that chamber remained closed;
V and A = volume and soil surface area covered by chamber, respectively;
m = molecular weight of the N2O.
Weekly accumulated N2O fluxes were estimated by plotting daily fluxes through time, interpolating linearly between them and integrating the area under the curve.
Soil, Leaf Litter, and Crop Residue Sampling
Soil samples were collected from five different points at each sampling site from the upper 10 cm (topsoil) layer on the 3rd day of gas sampling in both the dry and wet seasons. At each of the 5 sampling points at the Citrus and Eucalyptus sites, crop residues (i.e., leaves, stalk, and husk) (Supplementary Figures 1A,C) were collected from a 30 cm diameter area and stored in plastic bags, and soil samples were collected using a 5 cm diameter aseptic cylindrical corer. The same sampling approach was taken at 5 sampling points in the Forest 1 and Forest 2 sites for soil and plant residues, where litter layer samples (Supplementary Figures 1B,D) were collected in the same manner as crop residues in the agricultural sites. A total of 40 soil samples were collected from the field (4 sampling sites × 5 sampling points × 2 sampling periods). The samples were transported to the laboratory on ice, stored at −20°C, and processed within 72 h of sampling.
Soil Physicochemical and Plant Residue Chemical Analysis
The soil physicochemical analysis was performed on each of the 40 soil samples. The granulometric analysis was performed as described in Camargo et al. (2009) using the soil texture triangle from IAC (Agronomic Institute of Campinas). Soil moisture was determined by the gravimetric method as described in EMBRAPA (2009). Bulk density was measured by the volumetric flask method (EMBRAPA, 2009). For chemical analysis, a subsample of each sample was air dried, passed through a 2 mm mesh sieve, and shaken in pure water. Of this solution, 100 μL was acidified with 1.5% of 2 M HCl, followed by a purge with synthetic air for 5 min to remove the inorganic carbon. Then, the dissolved organic carbon (DOC) content was determined on a Shimadzu TOC-5000 A analyzer (Shimadzu, Columbia, MD, USA). Another soil subsample was air dried and passed through a 0.149 mm mesh for total C and N determination by dry combustion on a LECO® CN-2000 elemental analyzer (PerkinElmer, Waltham, MA, USA). Soil -N and -N were extracted by 2 M potassium chloride (KCl) and quantified using spectrophotometry as described by Norman et al. (1985) and Krom (1980), respectively. The soil pH in CaCl2, soil moisture, total soil porosity, and particle density were analyzed according to EMBRAPA (2009). The determination of particle density was based on the relationship between soil mass and the volume occupied by the soil particles. All analyses were performed in triplicate for each soil sample. Total C and N, the only analyses performed on plant residues (leaf litter and crop residues), was performed by dry combustion on a LECO® CN-2000 elemental analyzer (PerkinElmer, Waltham, MA, USA) after the samples were completely dried at 65°C and ground.
Soil, Leaf Litter, and Crop Residue Incubation Experiment
To evaluate the N2O fluxes and denitrification gene abundance across our sites while normalizing the influence of environmental parameters (e.g., moisture and temperature variability) on the soil, a set of microcosms were prepared with the soils and plant residues collected from the field sites in the dry and wet seasons. The soil characteristics such as the water holding capacity (WHC) of the soil, soil moisture, and soil density were analyzed prior to soil incubation as mentioned above for these soil samples. The WHC was determined by transferring the soil into a metal ring with a paper filter until it was fully covered, followed by a water soaking step until water completely diffused in the ring. The weights of the soil, ring, and wet set (ring + wet soil) were previously noted for further calculations. After all of these analyses, the samples were incubated at 105°C for 24 h and then weighed. The WHC was calculated from the ratio between the water and soil weight multiplied by 100 (results in %). For each sampling site and season, five microcosms were prepared by placing ~300 g of soil into 500 mL sterilized Schott bottles (63.58 cm2 basal area) covered by plant residues. The plant residues from the corresponding site were added on top of the soils to achieve the same coverage as observed in the field (visual evaluation); the forest sites had thicker litter layers than the citrus and eucalyptus site crop residue layers. The microcosms were incubated at room temperature (between 20° and 22°C) for 1 day at a moisture level of 45% of WHC, after which the soil moisture was adjusted to 70% of WHC by adding water and weighing. The microcosm soil moisture was maintained at this level for the remaining 30 days by weighing daily to check and adjust for moisture loss. The N2O fluxes were measured after the first 24 h (at 45% of WHC) and then at 1, 7, 15, and 30 days following wetting (at 70% of WHC). For each flux measurement, five gas samples were taken from the microcosm headspace using syringes at 1, 30, 60, and 90 min after closure of the microcosm, followed by the respirometric assay proposed by Pitombo et al. (2018). The N2O concentrations were determined by gas chromatography, and the fluxes were calculated as described above. On the last day of gas sampling, soil samples were taken from each of the 40 microcosms (4 sampling sites × 5 microcosms × 2 sampling periods) and stored at −20°C until the DNA extraction process.
Isolation of DNA From the Soil and Quantitative Real-Time PCR Assays for the Denitrification Genes
Genomic DNA was extracted from 250 mg of soil from the field and soil incubation experiments using the Power Lyzer™ Power Soil® DNA Isolation Kit (MoBio Laboratories, Carlsbad, CA, USA) according to the manufacturer's instructions. The DNA purity and concentration were assessed spectrophotometrically (Nanodrop ND-1000, NanoDrop Technologies, Inc., Wilmington, DE, USA) to determine absorbance at the following wavelengths: 230, 260, 280, and 320 nm. All 80 DNA samples were stored at −20°C until use. Quantitative real-time PCR (qPCR) using the nirK, nirS, and nosZ genes as biomarkers was performed to assess the abundance of the denitrifying bacterial community in each of the 40 soil samples from the sampling sites and 40 incubation experiment samples. Amplicons of Sinorhizobium meliloti (DSM 30135), Pseudomonas fluorescens (DSM 50090), and Bradyrhizobium japonicum (DSM 1755) were used as standards for the nirK, nirS, and nosZ genes, respectively. DNA standard curves were generated by dilution series of 102-107 copies μL−1 using duplicate 10-fold dilutions of S. meliloti, P. fluorescens, and B. japonicum standard DNA.
The following primer pairs were used for qPCR of nirK, nirS, and nosZ gene fragments (Table 1).
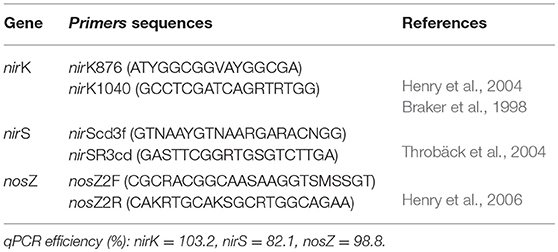
Table 1. Primer pair sequences used to quantify nirK, nirS, and nosZ genes.
Each 10 μL reaction contained 5 μL of SYBR green master mix (Applied Biosystem, Foster City, CA, USA), 0.7 μL of each primer (0.3 μM for nirK and nirS and 0.5 μM for nosZ), 0.5 μL of bovine serum albumin (BSA; 0.12 mg mL−1) and 1–2 ng μL−1 (final concentration) of template DNA. The following conditions were chosen for nirK amplification after optimization: initial denaturation for 10 min at 95°C and 40 cycles of 30 s at 95°C, 30 s at 58°C, and 40 s at 72°C. The PCR conditions for nirS amplification were as follows: initial denaturation for 2 min at 94°C and 50 cycles of 15 s at 95°C, 1 min at 57°C, and 1 min at 72°C. For nosZ amplification, the following PCR conditions were used: initial denaturation for 10 min at 95°C and 45 cycles of 15 s at 95°C, 30 s at 60°C, and 30 s at 72°C. A negative (no template) control reaction in which soil DNA was substituted for nuclease-free water was used in qPCR assays. PCR amplification and product quantification were performed using the QuantStudio™ 3 Real Time PCR System (Applied Biosystems, Foster, CA, USA). A melting curve analysis of amplicons was conducted to confirm that the fluorescent signals originated from specific amplicons and not from primer dimers or other artifacts. Automated analyses of PCR amplicon quality (e.g., PCR baseline subtraction, Ct threshold set to the linear amplicon phase) and quantity were performed using QuantStudio® Design and Analysis Software (Applied Biosystems).
Statistical Analysis
A Tukey's HSD test was used to determine the significance of the differences in N2O fluxes between dry and wet seasons within the same sampling site and agricultural and adjacent forest site in the same season based on data obtained in field and incubation experiment. The statistical comparison of N2O fluxes was performed using Statistica v. 10.0 software (Statsoft Inc., Tulsa, OK, USA).
Pearson's correlation analysis was performed to explore the relationships among the abundances of denitrification genes (nirK, nirS, and nosZ), N2O fluxes, and soil physicochemical characteristics by using the function “prcomp” in the R packages “factoextra” and “FactoMineR” (version 3.3.3; R Core Team, 2017). The explicit relationships among these variables were examined by constrained ordination generated by principal component analysis (PCA). The PCA and Pearson's correlation analyses were performed based on a data frame in which all variables had the same row length. The field N2O flux data in these analyses were based on averages by “day” across “chamber,” resulting in eight unique flux measurements per sampling site per season. The soil incubation N2O flux measurements were averaged by “day” across microcosm bottles only.
Linear mixed effects models (R version 3.3.3; R Core Team, 2017) with “chamber” nested in “day” were used to test N2O fluxes across sites and seasons; P-values were obtained using Satterthwaite's approximation of degrees of freedom (lmerTest). Mean N2O fluxes were compared with Tukey HSD and were considered significantly different at P ≤ 0.05 (lsmeans).
Data for Citrus and its adjacent forest (Forest 1), and Eucalyptus and its adjacent forest (Forest 2) were analyzed independently; four mixed effects models were tested (Table 2). Model 1 used field data from Citrus and Forest 1; Model 2 used field data from Eucalyptus and Forest 2; Model 3 used lab data from Citrus and Forest 1; Model 4 used lab data from Eucalyptus and Forest 2. All models contained data from both wet and dry seasons. Analyses of Models 2–4 were done on the natural log scale; constants were added in these models to make all N2O flux values >0 so that data could be log-transformed. Constants' units were in mg m−2 day −1 in the field data and mg kg soil −1 day −1 in lab data. LSmeans were back transformed and the respective constant was subtracted for presentation and interpretation.
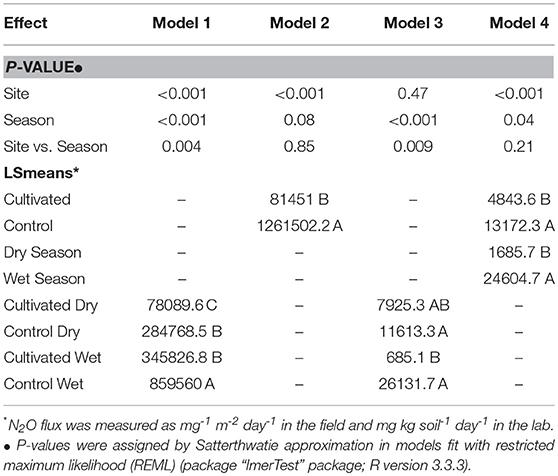
Table 2. The effect of site and season on N2O flux in field and lab experiments.
Linear mixed effects models were also conducted using total gene abundances as the response variable. These models had the same data groupings as above; replicate was used as the random effect.
Results
Field and Soil Incubation Fluxes of N2O
The field N2O fluxes increased by 10–77% from the dry to wet season. At all sites, the field average N2O fluxes were lower in the dry season than in the wet season (Figure 2A). The N2O fluxes were lower for the two agricultural sites than those from their adjacent forest sites in both the dry and wet seasons. These differences in average N2O fluxes were significant (Tukey's HSD, P < 0.05) between the dry and wet seasons and between agricultural sites and their respective adjacent forest sites (Figure 2A), except for the Eucalyptus and Forest 2 sites that showed no difference between the dry and wet seasons (Figure 2A). The accumulated flux for dry season was between 0.3 and 6.9 mg N-N2O m−2 week−1, and for wet season was between 0.7 and 8.15 mg N-N2O m−2 week−1.
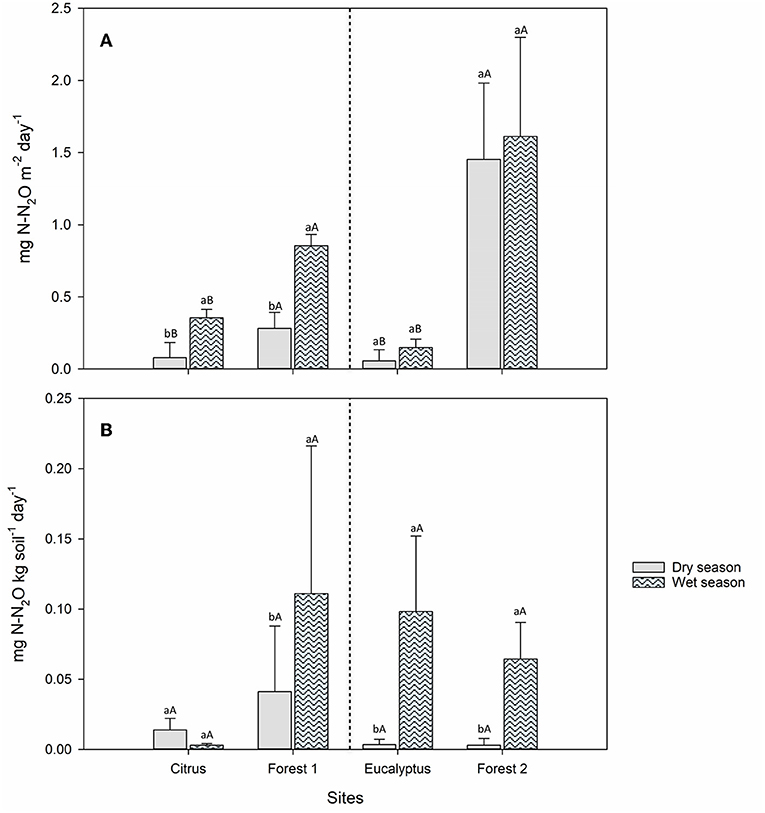
Figure 2. Average N2O fluxes (n = 5) from Citrus, Forest 1, Eucalyptus and Forest 2 sites for measurements made in the dry (solid) and wet (pattern) seasons. (A) Field measurements (B) Soil incubation measurements, moisture at 70% of water holding capacity. Tukey's HSD test (P < 0.05) was performed to compare the dry and wet seasons within the same sampling site (lower-case letters) and the agricultural vs. adjacent forest site (Citrus vs. Forest 1 and Eucalyptus vs. Forest 2) in the same season (upper-case letters).
A significant interaction between site and season was observed for N2O flux in model 1 (P = 0.004, t-value = 2.90; lmerTest). Lsmeans determined Forest 1 Wet Season to have the greatest mean N2O flux (859,560 mg N-N2O m−2 day−1) and Citrus Dry Season to have the smallest mean N2O flux (78,089.6 mg N-N2O m−2 day−1); there was no mean flux difference between Citrus Wet Season (345,826.8 mg N-N2O m−2 day−1) and Forest 1 Dry Season (284,768.5 mg N-N2O m−2 day−1), which were between Forest 1 Wet Season and Citrus Dry Season (P < 0.05; Table 2). Model 2 showed site was the only significant predictor for N2O flux (P < 0.001, t-value = 10.35); lsmeans determined Forest 2 had significantly greater flux (1,261,502.2 mg N-N2O m−2 day−1) than Eucalyptus (81,451 mg N-N2O m−2 day−1) (P < 0.05; Table 2).
The incubated soils demonstrated different trends in average N2O fluxes with season and site than those observed in the field (Figure 2B). The incubations of soil and plant residues collected in the dry and wet seasons showed higher average N2O fluxes from the soils collected from the Eucalyptus, Forest 1, and Forest 2 sites in the wet season than those collected in the dry season even though soil moisture was fixed at 70% of WHC throughout all soil incubations (Figure 2B). The Citrus site showed the opposite pattern, with higher average N2O flux in the dry season than in the wet season. In the Eucalyptus, Forest 1, and Forest 2 sites, the differences in average N2O fluxes between the soils collected in the dry and wet seasons from a given sampling site were significant (P < 0.05), while the difference was not significant for the Citrus site (Figure 2B).
A significant interaction between site and season was observed for N2O flux in model 3 (P = 0.009, t-value = 2.71; lmerTest). Lsmeans determined no difference in Forest 1 Wet Season and dry season fluxes, which had the greatest mean N2O fluxes (11,613.3 and 26,131.7 mg N-N2O kg soil−1 day−1, respectively); Citrus Wet Season had the smallest mean N2O flux (685.1 mg N-N2O kg soil−1 day−1); there was no difference between Citrus Dry Season mean fluxes (7,925.3 mg N-N2O kg soil−1 day−1) and any of the other groups' (P < 0.05; Table 2). Model 4 showed site and season were both significant predictors for N2O flux (P < 0.001, t-value = 4.29; P = 0.04, t-value = 2.10, respectively); lsmeans determined the wet season had a greater mean flux (24,604.7 mg N-N2O kg soil−1 day−1) than the dry season (2,685.7 mg N-N2O kg soil−1 day−1); and forests had a greater mean flux (13,172.3 mg N-N2O kg soil−1 day−1) than agricultural sites (4,843.6 mg N-N2O kg soil−1 day−1) (P < 0.05; Table 2).
Soil Physicochemical and Plant Residue Chemical Characteristics
The soil physical factors varied across the sites but did not change significantly with season. The range of soil texture fractions across all sites was 9–54% clay, 20–66% sand, and 12–35% silt. The soils were described as Forest 1 soil as clay, Citrus soil as clay-sandy, Forest 2 soil as sandy and Eucalyptus soil as clay. The soil pH ranged from 4.5 to 7.0 for the dry season and from 5.0 to 6.9 for the wet season. The pH was the lowest at the Eucalyptus site and the highest at the Forest 1 site in both seasons. These soil factors differed (Tukey's HSD, P < 0.05) between the Citrus and Forest 1 sites in both seasons and between the Eucalyptus and Forest 2 sites in the dry season only (Table 3) but not between dry and wet seasons at the same site (Tukey's HSD, P > 0.05).
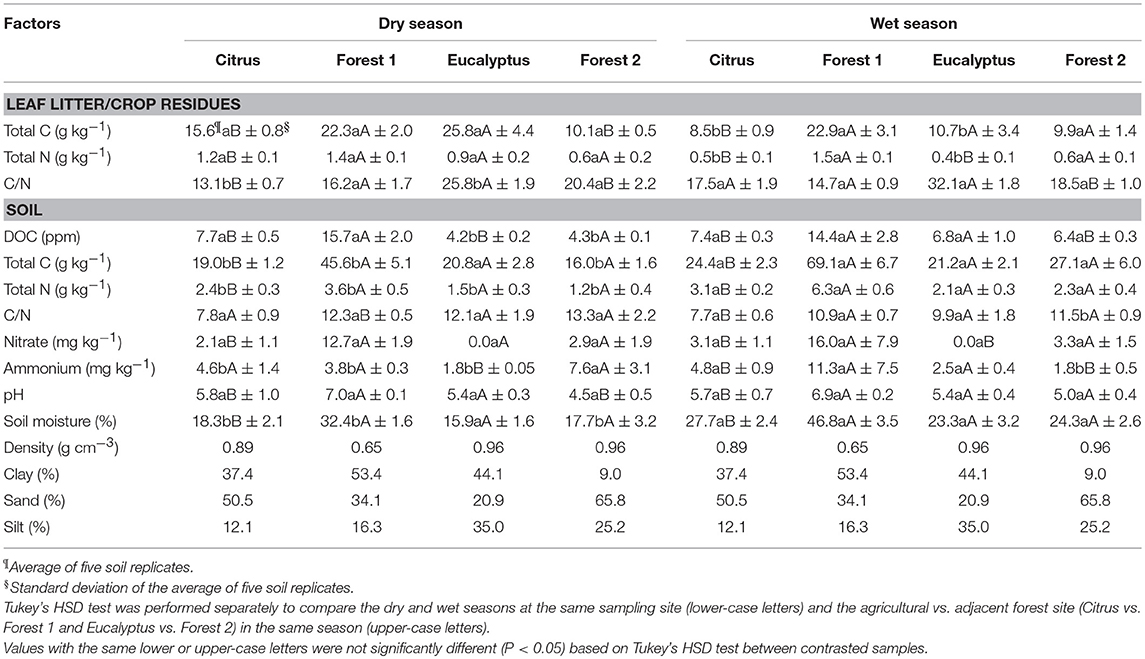
Table 3. Leaf litter and crop residue chemical factors and soil physicochemical factors from Citrus, Forest 1, Eucalyptus and Forest 2 sites collected in the field in dry and wet seasons.
Soil C and N varied with site and season in distinct ways for the tree crops and forests. Total soil C, N, and DOC were higher in Forest 1 than Citrus site in both seasons (Table 3). The same pattern was not observed for the Forest 2 and the Eucalyptus site, where differences were typically small. In general, soil C, N, and DOC increased by 121–162%, 117–181%, and 130–260%, respectively, in the wet season when the difference was significant (e.g., increase in DOC for the Eucalyptus and Forest 2 sites). The balance of the pools of C and N, expressed as the C/N ratio, was lower in the soil from the agricultural sites than from the forest sites (indicating more N) and tended to decrease further into the wet season.
The plant residue pool, which represents key matter inputs to the soil, was highly dynamic for the tree croplands but not for the forests. The plant residues (crop residues) in the Citrus and Eucalyptus sites were twice as high in C and N in the dry season compared to those in the wet seasons, while a corresponding change in the forest residues was not observed. The statistical analysis showed significant differences for total C and N of the plant residues between the Citrus and Forest 1 sites for both seasons and between Eucalyptus and Forest 2 in the dry season. The C/N of the plant residues was stable across the wet and dry seasons at all sites except for the Citrus and Eucalyptus sites, where the crop residue was higher in N in the dry season (C/N~13.0 and ~25, respectively) than in the wet season (C/N~17.0 and ~32, respectively).
The levels of the key denitrifying substrates nitrate and ammonium were the most variable in the forests, which drove the dynamics of the observed trends with site and season. Nitrate was higher in the forests than in the croplands, and the levels were significantly different (Tukey's HSD, P < 0.05) between the Citrus and Forest 1 sites in the dry and wet seasons and between the Eucalyptus and Forest 2 sites in the wet season (Table 3). The nitrate levels did not vary significantly with season, but the ammonium levels increased (between 4 and 197%) in the wet season for all sites except Forest 2. Ammonium increased significantly in Forest 1 and decreased in Forest 2 in the wet season, which drove their corresponding differences from the adjacent tree croplands that had lower significant increase on levels of ammonium across the seasons.
Denitrification Gene Abundance
The genetic markers of the denitrifiers (nirK, nirS, and nosZ) increased in abundance from the dry to wet season in all sites, except the Citrus site. The abundance of these three denitrification genes, as determined by qPCR (expressed in 105 gene copies per gram of soil), indicated that the nirK and nosZ gene copy numbers were generally highest in the wet season in both the field and incubation experiments (Table 4). These differences were for all sites and conditions (field vs. incubation), except for the Citrus site in the soil incubations, which demonstrated a higher nosZ abundance in the dry season soil incubations and little difference in nirK. Of all three gene targets, the nirS gene fragment had the lowest abundance at all sampling sites regardless of season or condition, and the differences with site and season were not significant. The gene abundance did not differ between the agricultural and adjacent forest sites in the same season. Finally, using linear mixed effects models, we found no significant effects (P > 0.05) of site and season on the total gene abundance (sum of nosZ, nirK, and nirS) in the field and lab experiments (Table S1).
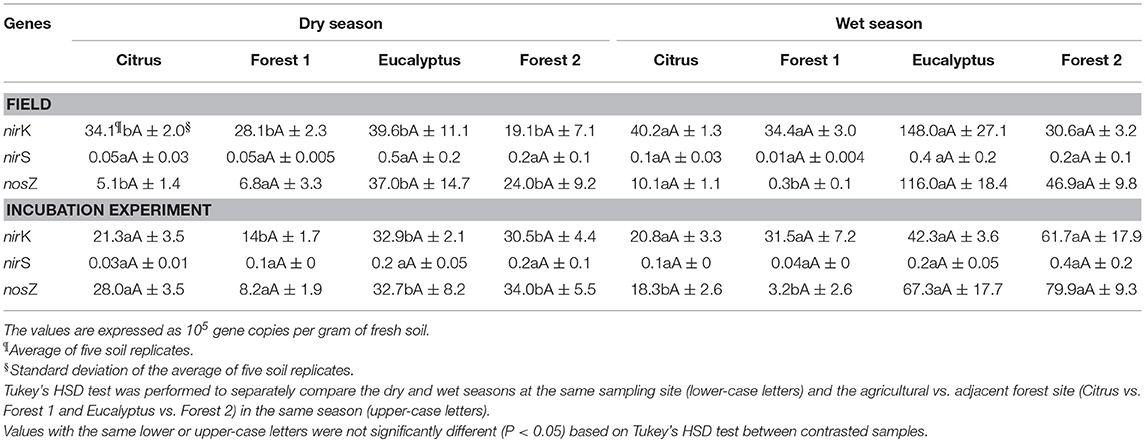
Table 4. Absolute abundance of nirK, nirS, and nosZ genes measured by quantitative real-time PCR from field and incubation experiment soil samples in dry and wet seasons.
Relationships Among Denitrification Gene Abundances, N2O Fluxes, and Soil and Plant Residue Physicochemical Factors
The relationships between nirK, nirS, and nosZ gene abundance, N2O fluxes, and soil physicochemical factors were examined by PCA ordination analysis separately for each agriculture-forest pair from both the field and incubation results. The field data (Figure 3) revealed distinct groups for the geographical locations of the adjacent sampling sites (Citrus vs. Forest 1 and Eucalyptus vs. Forest 2). For the Citrus and Forest 1 sites, there was no association between nirK, nirS, and nosZ gene abundance and soil and plant residue chemical factors such as DOC, total C, or total N, which were related to soil bulk density (Figure 3A). A significant positive association (P < 0.05) was found among DOC, soil and plant residue total C and N, nitrate, ammonium, pH, and N2O fluxes at the Citrus and Forest 1 sites. Soil moisture was positively correlated with the soil and plant residue chemical factors, as well as with N2O fluxes. The PCA ordination revealed a positive correlation among N2O fluxes, ammonium and DOC for the Eucalyptus and Forest 2 sites (Figure 3B). The denitrification genes showed a positive correlation with bulk density and plant residue total C and N for these sampling sites.
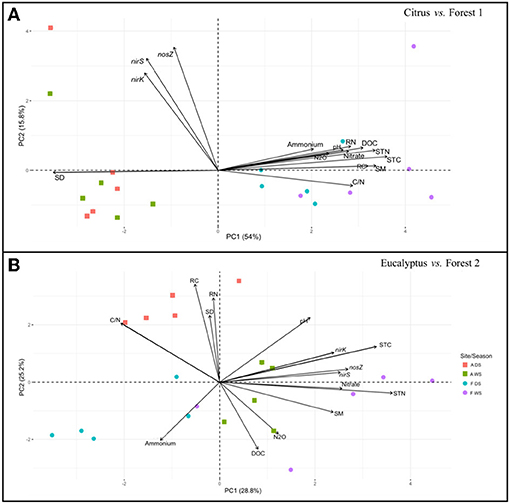
Figure 3. Principal component analysis plot based on the nirK, nirS, and nosZ gene abundances, N2O fluxes, and soil physicochemical and plant residue chemical factors as determined in the field samples. (A) Citrus and Forest 1 sites and (B) Eucalyptus and Forest 2 sites. The symbols refer to replicates of soil from the following sampling sites and seasons: agricultural sites in the dry season (ADS), agricultural sites in the wet season (AWS), forest sites in the dry season (FDS), and forest sites in the wet season (FWS). C/N, from soil total C and N; DOC, Dissolved organic carbon; N2O, Nitrous oxide; RC, Residue total carbon; RN, Residue total nitrogen; SD, Soil density; SM, Soil moisture; STC, Soil total carbon; and STN, Soil total nitrogen.
A similar PCA ordination analysis performed on the soil incubation experiment dataset (Figure 4) showed the same grouping pattern by sampling site locations as revealed by the field dataset for the Citrus and Forest 1 soils (Figures 3A, 4A). A positive correlation was revealed between N2O fluxes and the soil chemical factors in the incubated soil samples (Figure 4A), where the abundance of the nirK, nirS, and nosZ genes was not strongly associated with the other variables. Both the Eucalyptus and Forest 2 sites revealed a correlation between N2O fluxes and soil DOC, in which the nirK, nirS, and nosZ gene abundance was more positively correlated with soil pH, soil total C and N, and soil moisture than with N2O fluxes (Figure 4B).
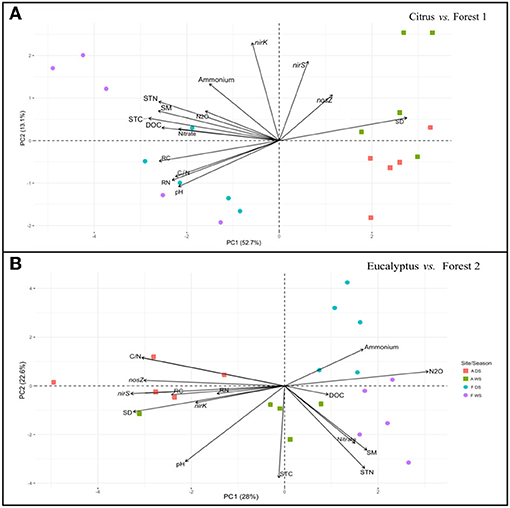
Figure 4. Principal component analysis plot based on the nirK, nirS, and nosZ gens abundances, N2O fluxes, and soil physicochemical and plant residue chemical factors as determined in the soil incubation experiment samples. (A) Citrus and Forest 1 sites and (B) Eucalyptus and Forest 2 sites. The symbols are identical to those defined in Figure 3.
Pearson correlations were determined between all data from each of the four sampling sites in both the field and soil incubation experiments and season (Supplementary Figure 2). A greater number of negative correlations were observed in the agricultural Citrus and Eucalyptus sites (Supplementary Figures 2A,C) than in the Forest 1 and Forest 2 sites (Supplementary Figures 2B,D). For instance, nirK and nirS gene abundance revealed a negative correlation with DOC in the Citrus and Eucalyptus sites, while in both forest sites, the same correlation was positive for the field and soil incubation experiments. The correlations common to both the field and soil incubation experiment data included those between soil total C and N and the nirK, nirS, and nosZ genes. Furthermore, in all sampling sites, soil moisture was positively correlated with N2O fluxes for the field measurements. In the soil incubation experiment, DOC was correlated with N2O fluxes at all sampling sites (Supplementary Figure 2).
Discussion
Through complementary field- and incubation-based analyses, we characterized the fluxes of N2O from the soil and their plant residue covers to evaluate our research hypotheses. In contrast to the first hypothesis that citrus- and eucalyptus-cultivated soils emit higher amounts of N2O to the atmosphere than their adjacent natural forest soils counterparts, we observed higher average N2O fluxes from the natural forest soils than from the adjacent crop-cultivated soils (Figure 2; Table 2). Season emerged as a key driver of N2O fluxes and marker gene abundance for denitrifiers, which did not significantly differ with land use (Table 4; Table S1), in contrast to our second hypothesis. The factors such as soil moisture and plant residue characteristics that may drive the observed differences with season, land use, and their combinations are discussed below.
Our results showed a strong influence of season on N2O fluxes, with the N2O flux increasing in the wet season in both the field and soil incubation experiments. Field moisture was an important predictor of the N2O fluxes in the field and incubations (Figures 3, 4, and Table 2). Clough et al. (2017) also showed higher N2O fluxes in soil at high moisture levels once a lower oxygen content and, consequently, an anaerobic environment, stimulate denitrification (Van Spanning et al., 2007). Leaf litter and crop residues can contribute to increased soil moisture retention and may consequently promote N2O production (Kravchenko et al., 2017). Forest 1 and Forest 2 soils had thicker litter layers than the cultivated soils, and our results are therefore consistent with the higher N2O fluxes from soils under thicker plant residue layers. In addition, Taketani et al. (2017) stated that soil moisture influences changes in soil microbial communities by increasing nutrient transportation during the high moisture period. Thus, plant residues can promote soil moisture retention, oxygen limitation, nutrient transport, and the corresponding microbial community composition in ways known to promote the denitrification process, a critical component of N2O fluxes.
We discovered that the drivers of the differences in the soil N2O fluxes in the wet and dry seasons were not limited to the soil moisture conditions. If that had been the case, we would have seen the differences in the average N2O fluxes observed in the field (Figure 2A) vanish upon incubation under identical moisture conditions in the lab (Figure 2B). Instead, we found that the soil collected from the two seasons demonstrated persistent differences in N2O flux dynamics in lab incubations. Therefore, this persistent and surprising legacy behavior was used to evaluate the key drivers of N2O fluxes based on the chemical characteristics of leaf litter and crop residues and soil physicochemical characteristics. The differences among soil texture as showed for the studied sites may be also an important factor on N2O production, as previous state by Harrisson-Kirk et al. (2013) and Skiba and Ball (2002). However, considering a Udox soil under a hyperthermal soil temperature regime, which C and N turnover is faster, nutrient cycling may have a more significant effect on N2O fluxes.
The N2O fluxes were increased with the carbon content due its support of denitrifying organisms, and DOC may have been particularly important. Tiedje et al. (1983) suggested that organic C is more important than oxygen status in determining the denitrifying enzyme content of habitats. Higher concentrations of organic C usually support higher populations of heterotrophs, which include denitrifiers. Positive correlations among the DOC concentration, total soil C and N2O fluxes were revealed in most soils in the field and soil incubation experiments. Higher DOC concentrations may drive more N2O fluxes as labile C increases and plays a role as an electron acceptor for denitrifying microorganisms (Harter et al., 2014). Marques et al. (2012) showed a strong and positive relationship between the DOC concentration, total soil C and soil moisture when studying Amazonian soils under different land uses. In superficial soils (0–10 cm), as used in this study, the DOC concentration is mostly influenced by the type of plant residue on the soil surface (Marques et al., 2012). Harter et al. (2014) showed a positive correlation between the DOC concentration and N2O fluxes in biochar-amended soil, possibly due to the high root quantity in forest fields, which supports DOC transportation throughout the soil in the dry season. This process makes the denitrification process efficient in the absence of water in soil under native forests when compared with that in agricultural fields (Marques et al., 2012).
As the substrate for denitrification, the availability and type of N in the soils and plant residues is an important factor in N2O fluxes. In this study, the N2O fluxes were positively correlated with soil total N mainly in the forest soils. This relationship has been described by previous studies, specifically for N in the nitrate form () (Carmo et al., 2005; Cerri et al., 2006). However, the site with the highest ratios of N to C (lowest soil C/N) in the soil and in the crop residue inputs was the Citrus cultivation site. That site may have had greater N availability due to the annual fertilizer application, but, in fact, it had the lowest N2O fluxes and a lower N2O emission potential in the wet than the dry season, perhaps due to the increase in C/N in the wet season crop residue. The inorganic-based fertilizers used in citrus orchards are rapidly mineralized and have the possibility to supply in addition to , which is the preferred N species for uptake by most higher plants (Britto and Kronzucker, 2002). The is constantly regenerated via dissimilatory nitrate reduction to ammonium (DNRA) due to the redox fluctuation conditions in tropical soils (Silver et al., 2001; Templer et al., 2008), and with a subsequent influx of O2, this becomes re-available to ammonia oxidizing communities, disfavoring the denitrification process. Higher levels of nitrate and ammonia were observed in the forests compared to the cultivated sites that received historical or annual fertilization (see section Site Descriptions), and the concentrations increased in the wet season. Therefore, the site- and season-specific trends in N2O flux are driven in part by changes in total N but perhaps most strongly by whether the N input is supplied through plant litter or fertilizer and how that impacts the relevant C/N ratios.
The soil pH may have also contributed to the site differences in N2O fluxes, as denitrification rates are pH sensitive. Several studies have established that denitrification rates tend to decrease at low soil pH values (Simek et al., 2002; Saleh-Lakha et al., 2009). Parkin et al. (1985) previously demonstrated a 2-fold decrease in the denitrification rate and a 3-fold decrease in denitrification enzyme activity when soil pH decreased from approximately pH 6.0–4.1, suggesting that prolonged exposure to a low soil pH selected a denitrifier population that was more adapted to the low pH environment. Subsequently, the N2O reduction by the acid-tolerant population was insignificant compared to the N2O production rates. Although our results did not reveal a significant correlation between the N2O fluxes and soil pH for the different samples, the relationship between N2O fluxes and soil pH in the Citrus and Forest 1 sites corroborates these previous findings.
The denitrifying gene markers tracked changes in N2O fluxes in some but not all cases, and their poor prediction of N2O dynamics may indicate that other microbial N cycling processes were also important (Martins et al., 2015). Increased N2O fluxes in the wet season in the field and incubation experiments were accompanied by increasing nirK gene abundances in the soil from all sampling sites. However, the gene-based measurements did not predict N2O dynamics in all sites, experiments, and seasons (Table S1). Although, the higher levels of nirK than nirS indicate that the N2O emission potential by microbial denitrification is consistent with the previous determinations for agricultural soils by Dandie et al. (2011) and Wang et al. (2017). In addition, the abundance of denitrifiers, as indicated by nirK, nirS, and nosZ gene copy numbers, neither differed between the agricultural and adjacent forest sites in the same season nor did they have a clear correlation with the chemical characteristics of the leaf litter and crop residues and soil physicochemical characteristics by site or condition (field vs. incubation). The exception was that the soil density has a low but significant positive correlation with denitrification gene abundance (Supplementary Figure 2); more dense soils may have lower porosity and higher moisture levels. Previous attempts to relate denitrifier abundance to environmental factors or N2O emissions have been undertaken in a range of environments with varying results (Rich and Myrold, 2004; Philippot et al., 2009; Wertz et al., 2009; Enwall et al., 2010). Soil denitrifiers have been found not to respond to the environmental properties in grassland and agricultural fields, waterlogging, and changes between ecosystems, while the structure or composition of the denitrifying microbial communities indicated differences (Philippot et al., 2009; Dandie et al., 2011; Wang et al., 2017). Therefore, we acknowledge that although surface soils have a more favorable environment for denitrifying microorganisms, the denitrification gene abundance does not necessarily relate to the real community composition. Despite this, it may be equally plausible that other N cycling pathways not represented by our three marker genes (nirK, nirS, and nosZ) are important factors in some or all of our sites. Additional pathways that produce N2O or drive other N cycle conversions are known (Pajares and Bohannan, 2016) although their importance to N2O cycling in tropical soils is unclear and variable. While beyond the scope of this study, the characterization of additional N cycling pathways may be necessary to explain the observed discrepancies between denitrification gene abundance and N2O fluxes across seasons and sites.
Conclusion
Taken together, our findings through complementary field- and incubation-based analyses showed higher N2O fluxes from natural forest soils than from the adjacent citrus- and eucalyptus-cultivated soils, with denitrification gene abundance not significantly different between the natural forest and cropland soils. Based on these findings, both hypotheses of this study were rejected. Additionally, we conclude that the differences observed in the N2O fluxes and in some cases the nirK, nirS, and nosZ gene copy numbers are related to seasonal environmental variables and soil and plant residue characteristics, especially the DOC concentration, C and N content and density. Our results highlight the overwhelming role of environmental drivers (e.g., moisture dynamics) that can make investigating microbial drivers difficult in the field and open the possibility for a better comprehension of N cycling processes in tropical soils based on soil incubation experiments, particularly when both methods are comparatively employed as presented here.
Author Contributions
AN and JdC conceived and designed the study. CN performed the research. CN, CY, LM, and AN analyzed the data. CN, LM, JdC, and AN wrote the paper.
Funding
This study was supported by a grant from Fundação de Amparo à Pesquisa do Estado de São Paulo (FAPESP 2016/15289-4 and 2017/17441-0). Greenhouse gases analyses and denitrifiers abundance determination were viable due to GC and qPCR equipment's acquisition supported by FAPESP 2012/50694-6 and 2016/16687-3 granted to improve the laboratory infrastructure.
Conflict of Interest Statement
The authors declare that the research was conducted in the absence of any commercial or financial relationships that could be construed as a potential conflict of interest.
Acknowledgments
We wish to thank Leonardo Machado Pitombo, Isadora Leme, and Rafael Da Róz from the Federal University of São Carlos for their technical support in lab analysis and map preparation. We also wish to thank José Luiz Moreira César and Pedro Conde Filho for sharing the private area for field experiment.
Supplementary Material
The Supplementary Material for this article can be found online at: https://www.frontiersin.org/articles/10.3389/fenvs.2019.00011/full#supplementary-material
References
Braker, G., Fesefeldt, A., and Witzel, K. P. (1998). Development of PCR primer systems for amplification of nitrite reductase genes (nirK and nirS) to detect denitrifying bacteria in environmental samples. Appl. Environ. Microbiol. 64, 3769–3775.
Britto, D. T., and Kronzucker, H. J. (2002). toxicity in higher plants: a critical review. J. Plant Physiol. 159, 567–584. doi: 10.1078/0176-1617-0774
Camargo, O. A., Moniz, A. C., Jorge, J. A., and Valadares, J. M. A. S. (2009). Métodos de Analise Química, Mineralógica e Fésica de Solos do Instituto Agronômico de Campinas. Campinas. Instituto Agronômico.
Carmo, J. B., Andrade, C. A., Cerri, C. C., and Piccolo, M. C. (2005). Nitrogen availability and N2O fluxes from pasture soil after herbicide application. Rev. Bras. Ciencia Solo 29, 735–746. doi: 10.1590/S0100-06832005000500009
Cavararo, R. (2014). Produção da Extração vegetal e da silvicultura. Rio de Janeiro IBGE 29, 1–56. Available online at: https://biblioteca.ibge.gov.br/visualizacao/periodicos/74/pevs_2014_v29.pdf
Cerri, C. E. P., Piccolo, M. C., Feigl, B. J., Paustian, K., Cerri, C. C., Victoria, R. L., et al. (2006). Interrelationships among soil total C and N, trace gas fluxes, microbial biomass, and internal N-cycling in soils under pasture of the Amazon region. J. Sustain. Agric. 27, 45–69. doi: 10.1300/J064v27n04_05
Clough, T. J., Lanigan, G. J., Klein, C. A. M., Samad, M. S., Morales, S. E., Rex, D., et al. (2017). Influence of soil moisture on codenitrification fluxes from a urea-affected pasture soil. Sci. Rep. 7:2185. doi: 10.1038/s41598-017-02278-y
Dandie, C. E., Wertz, S., Leclair, C. L., Goyer, C., Burton, D. L., Patten, C. L., et al. (2011). Abundance, diversity and functional gene expression of denitrifier communities in adjacent riparian and agricultural zones. FEMS Microbiol. Ecol. 77, 69–82. doi: 10.1111/j.1574-6941.2011.01084.x
Davidson, E. A., Savage, K., Verchot, L. V., and Navarro, R. (2002). Minimizing artifacts and biases in chamber-based measurements of soil respiration. Agric. For. Meteorol. 113, 21–37. doi: 10.1016/S0168-1923(02)00100-4
EMBRAPA (2009). Manual de Análises Químicas de Solos, Plantas e Fertilizantes. EMBRAPA Informações Tecnolõgicas, 2 Edn. rev. ampl. BrasiÌlia: EMBRAPA Informação Tecnológica.
Enwall, K., Throbäck, I. N., Stenberg, M., Soderstrom, M., and Hallin, S. (2010). Soil resources influence spatial patterns of denitrifying communities at scales compatible with land management. Appl. Environ. Microbiol. 76, 2243–2250. doi: 10.1128/AEM.02197-09
Hallin, S., Philippot, L., Loffler, F. E., Sanford, R. A., and Jones, C. M. (2018). Genomics and ecology of novel N2O-reducing microorganisms. Trends Microbiol. 26, 43–55. doi: 10.1016/j.tim.2017.07.003
Handerson, S. L., Dandie, C. E., Patten, C. L., Zebarth, B. J., Burton, D. L., Trevors, J. T., et al. (2010). Changes in denitrifier abundance, denitrification gene mRNA levels, nitrous oxide emissions, and denitrification in anoxic soil microcosms amended with glucose and plant residues. Appl. Environ. Microbiol. 76, 2155–2164. doi: 10.1128/AEM.02993-09
Harrisson-Kirk, T., Beare, M. H., Meenken, E. D., and Condron, L. M. (2013). Soil organic matter and texture affect responses to dry/wet cycles: effects on carbon dioxide and nitrous oxide emissions. Soil Biol. Biochem. 57, 43–55. doi: 10.1016/j.soilbio.2012.10.008
Harter, J., Krause, H. M., Schuettler, S., Ruser, R., Fromme, M., Scholten, T., et al. (2014). Linking N2O emissions from biochar-amended soil to the structure and function of the N-cycling microbial community. ISME J. 8, 660–674. doi: 10.1038/ismej.2013.160
Henry, S., Baudoin, E., López-Gutiérrez, J. C., Martin-Laurent, F., Bauman, A., and Philippot, L. (2004). Quantification of denitrifying bacteria in soils by nirK gene targeted real-time PCR. J. Microbiol. Methods 59, 327–335. doi: 10.1016/j.mimet.2004.07.002
Henry, S., Bru, D., Stres, B., Hallet, S., and Philippot, L. (2006). Quantitative detection of the nosZ gene, encoding nitrous oxide reductase, and comparison of the abundances of 16S rRNA, narG, nirK, and nosZ genes in soils. Appl. Environ. Microbiol. 72, 5181–5189. doi: 10.1128/AEM.00231-06
IPCC (2014). “Climate change 2014: mitigation of climate change,” in Working Group III Contribution to the Fifth Assessment Report of the Intergovernmental Panel on Climate Change, eds O. Edenhofer, R. Pichs-Madruga, and Y. Sokona, et al. Available online at: https://www.ipcc.ch/site/assets/uploads/2018/02/ipcc_wg3_ar5_full.pdf
Jantalia, C. P., dos Santos, H. P., Urquiaga, S., Boddey, R. M., and Alves, B. J. R. (2008). Fluxes of nitrous oxide from soil under different crop rotations and tillage systems in the South of Brazil. Nutr. Cycling Agroecosyst. 82, 161–173. doi: 10.1007/s10705-008-9178-y
Jones, C. M., Stres, B., Rosenquist, M., and Hallin, S. (2008). Phylogenetic analysis of nitrite, nitric oxide, and nitrous oxide respiratory enzymes reveal a complex evolutionary history for denitrification. Mol. Biol. Evol. 25, 1955–1966. doi: 10.1093/molbev/msn146
Kanter, D. R., Zhang, X., Mauzerall, D. L., Malyshev, S., and Shevliakova, E. (2016). The importance of climate change and nitrogen use efficiency for future nitrous oxide emissions from agriculture. Environ. Res. Lett. 11, 1–9. doi: 10.1088/1748-9326/11/9/094003
Kravchenko, A. N., Toosi, E. R., Guber, A. K., Ostrom, N. E., Yu, J., Azeem, K., et al. (2017). Hotspots of soil N2O emission enhanced through water absorption by plant residue. Nat. Geosci. 10, 496–500. doi: 10.1038/ngeo2963
Krom, M. D. (1980). Spectrophotometric determination of ammonia: a study of a modified Berthelot reaction using salicylate and dichloroisocyanurate. Analyst 105, 305–316. doi: 10.1039/AN9800500305
Lammel, D. R., Feigl, B. J., Cerri, C. C., and NuÌsslein, K. (2015). Specific microbial gene abundances and soil parameters contribute to C, N, and greenhouse gas process rates after land use change in Southern Amazonian Soils. Front. Microbiol. 6:1057. doi: 10.3389/fmicb.2015.01057
Levy-Booth, D. J., Prescott, C. E., and Grayston, S. J. (2014). Microbial functional genes involved in nitrogen fixation, nitrification and denitrification in forest ecosystems. Soil Biol. Biochem. 75, 11–25. doi: 10.1128/AEM.01751-10
Liu, R., Hu, H., Suter, H., Hayden, H. L., He, J., Mele, P., et al. (2016). Nitrification is a primary driver of nitrous oxide production in laboratory microcosms from different land-use soils. Front. Microbiol. 7:1373. doi: 10.3389/fmicb.2016.01373
Marques, J. D. O., Luizão, F. J., Teixeira, W. G., and Ferreira, S. J. F. (2012). Variações do carbono orgânico dissolvido e de atributos físicos do solo sob diferentes sistemas de uso da terra na Amazônia Central. Rev. Brasil. Ciência Solo 36, 613–622. doi: 10.1590/S0100-06832012000200030
Martins, C. S. C., Nazaries, L., Macdonald, C. A., Anderson, I. C., and Singh, B. K. (2015). Water availability and abundance of microbial groups are key determinants of greenhouse gas fluxes in a dryland forest ecosystem. Soil Biol. Biochem. 86, 5–16. doi: 10.1038/s41598-018-33594-6
Martinson, G. O., Corre, M. D., and Veldkamp, E. (2013). Responses of nitrous oxide fluxes and soil nitrogen cycling to nutrient additions in montane forests along an elevation gradient in southern Ecuador. Biogeochemistry 112, 625–636. doi: 10.1007/s10533-012-9753-9
Mori, T., Ohta, S., Ishizuka, S., Konda, R., Wicaksono, A., Heriyanto, J., et al. (2013). Effects of phosphorus addition with and without ammonium, nitrate, or glucose on N2O and NO emissions from soil sampled under Acacia mangium plantation and incubated at 100% of the water-filled pore space. Biol. Fertil. Soils 49, 13–21. doi: 10.1007/s00374-012-0690-5
Neves, M. F., Trombin, V. G., Milan, P., Lopes, F. F., Cressoni, F., and Kalaki, R. (2010). O Retrato da Citricultura Brasileira. RibeiraÌo Preto: Markestrat.
Norman, R. J., Edberg, J. C., and Stucki, J. W. (1985). Determination of nitrate in soil extracts by dual-wavelength ultraviolet spectrophotometry. Soil Sci. Soc. Am. J. 49, 1182–1185. doi: 10.2136/sssaj1985.03615995004900050022x
Pajares, S., and Bohannan, B. J. M. (2016). Ecology of nitrogen fixing, nitrifying, and denitrifying microorganisms in tropical forest soils. Front. Microbiol. 7:1045. doi: 10.3389/fmicb.2016.01045
Parkin, T. B., Sexstone, A. J., and Tiedje, J. M. (1985). Adaptation of denitrifying population to low soil pH. Appl. Environ. Microbiol. 49, 1053–1056.
Philippot, L., Cuhel, J., Saby, N. P. A., Cheneby, D., Chronakova, A., Bru, D., et al. (2009). Mapping field-scale spatial patterns of size and activity of the denitrifier community. Environ. Microbiol. 11, 1518–1526. doi: 10.1111/j.1462-2920.2009.01879.x
Pitombo, L. M., Ramos, J. C., Quevedo, H. D., Palmezani, K., Paiva, J. F., Pereira, E. A., et al. (2018). Methodology for soil respirometric assays: step by step and guidelines to measure fluxes of trace gases using microcosms. MethodsX 5, 656–668. doi: 10.1016/j.mex.2018.06.008
R Core Team (2017). R: A Language and Environment for Statistical Computing. Vienna: R Foundation for Statistical Computing. Available online at: https://www.R-project.org/
Reay, D. S., Dentener, F., Smith, P., Grace, J., and Feely, R. A. (2008). Global nitrogen deposition and carbon sinks. Nat. Geosci. 1, 430–437. doi: 10.1038/ngeo230
Rich, J. J., and Myrold, D. D. (2004). Community composition and activities of denitrifying bacteria from adjacent agricultural soil, riparian soil, and creek sediment in Oregon, USA. Soil Biol. Biochem. 36, 1431–1441. doi: 10.1016/j.soilbio.2004.03.008
Saleh-Lakha, S., Shannon, K. E., Henderson, S. L., Goyer, C., Trevors, J. T., Zebarth, B. J., et al. (2009). Effect of pH and temperature on denitrification gene expression and activity in Pseudomonas mandelii. Appl. Environ. Microbiol. 75, 3903–3911. doi: 10.1128/AEM.00080-09
Silver, W. L., Herman, D. J., and Firestone, M. K. (2001). Dissimilatory nitrate reduction to ammonium in upland tropical forest soils. Ecology 82, 2410–2416. doi: 10.1890/0012-9658(2001)082[2410:DNRTAI]2.0.CO;2
Simek, M., Jísová, L., and Hopkins, D. W. (2002). What is the so-called optimum pH for denitrification in soil? Soil Biol. Biochem. 34, 1227–1234. doi: 10.1016/S0038-0717(02)00059-7
Skiba, U., and Ball, B. (2002). The effect of soil texture and soil drainage on emissions of nitric oxide and nitrous oxide. Soil Use Manag. 18, 56–60. doi: 10.1079/SUM2001101
Soil Survey Staff (1999). Soil Taxonomy. A Basic System of Soil Classification for Making and Interpreting Soil Surveys, 2nd Edn. in Agricultural Handbook 436 (Washington, DC: Natural Resources Conservation Service, USDA), 869.
Taketani, R. G., Lançoni, M. D., Kavamura, V. N., Durrer, A., Andreote, F. D., and Melo, I. S. (2017). Dry season constrains bacterial phylogenetic diversity in a semi-arid rhizosphere system. Soil Microbiol. 73, 153–161. doi: 10.1007/s00248-016-0835-4
Templer, P. H., Silver, W. L., Pett-Ridge, J., DeAngelis, K. M., and Firestone, M. K. (2008). Plant and microbial controls on nitrogen retention and loss in a humid tropical forest. Ecology 89, 3030–3040. doi: 10.1890/07-1631.1
Throbäck, I. N., Enwall, K., Jarvis, A., and Hallin, S. (2004). Reassessing PCR primers targeting nirS, nirK and nosZ genes for community surveys of denitrifying bacteria with DGGE. FEMS Microbiol. Ecol. 49, 401–417. doi: 10.1016/j.femsec.2004.04.011
Tiedje, J. M., Sexstone, A. J., Myrold, D. D., and Robinson, J. A. (1983). Denitrification: ecological niches, competition and survival. Antonie von Leeuwenhoek 48, 569–583. doi: 10.1007/BF00399542
Van Spanning, R. J. M., Richardson, D. J., and Ferguson, S. J. (2007). “Introduction to the biochemistry and molecular biology of denitrification,” in Biology of the Nitrogen Cycle, Chap. 1, eds Bothe H, Ferguson SJ, and Newton WE (Amsterdam: Elsevier), 3–20. doi: 10.1016/B978-044452857-5.50002-3
Wang, Y., Uchida, Y., Shimomura, Y., Akiyama, H., and Hayatsu, M. (2017). Responses of denitrifying bacterial communities to short-term waterlogging of soils. Sci. Rep. 7:803. doi: 10.1038/s41598-017-00953-8
Wertz, S., Dandie, C. E., Goyer, C., Trevors, J. T., and Patten, C. L. (2009). Diversity of nirK denitrifying genes and transcripts in an agricultural soil. Appl. Environ. Microbiol. 75, 7365–7377. doi: 10.1128/AEM.01588-09
Keywords: tropical soil, denitrifiers, nitrous oxide, citrus, eucalyptus
Citation: Nishisaka CS, Youngerman C, Meredith LK, do Carmo JB and Navarrete AA (2019) Differences in N2O Fluxes and Denitrification Gene Abundance in the Wet and Dry Seasons Through Soil and Plant Residue Characteristics of Tropical Tree Crops. Front. Environ. Sci. 7:11. doi: 10.3389/fenvs.2019.00011
Received: 01 November 2018; Accepted: 16 January 2019;
Published: 05 February 2019.
Edited by:
Victor Satler Pylro, Universidade Federal de Lavras, BrazilReviewed by:
Xavier Raynaud, Université Paris-Sorbonne, FranceJulliane Dutra Medeiros, Universidade Federal de Juiz de Fora, Brazil
Julio Cezar Fornazier Moreira, Universidade de São Paulo, Brazil
Copyright © 2019 Nishisaka, Youngerman, Meredith, do Carmo and Navarrete. This is an open-access article distributed under the terms of the Creative Commons Attribution License (CC BY). The use, distribution or reproduction in other forums is permitted, provided the original author(s) and the copyright owner(s) are credited and that the original publication in this journal is cited, in accordance with accepted academic practice. No use, distribution or reproduction is permitted which does not comply with these terms.
*Correspondence: Acacio Aparecido Navarrete, YWNhY2lvbmF2YXJyZXRlQGdtYWlsLmNvbQ==