 Martin Yemefack
 Rosaline Njomgang2
 David G. Rossiter
- 1International Institute of Tropical Agricultural (IITA), Natural Resource Management (NRM), Yaoundé, Cameroon
- 2Laboratoire d'Analyses des Sols, Plantes, Eau et Engrais (LASPEE), Institute of Agricultural Research for Development (IRAD), Yaoundé, Cameroon
- 3ISRIC World Soil Information, Wageningen, Netherlands
- 4Section of Soil and Crop Sciences, Cornell University, Ithaca, NY, United States
- 5School of Geography Science, Nanjing Normal University, Nanjing, China
In the tropical rain forest zone of Southern Cameroon, shifting cultivation and perennial plantations of cocoa are the main farming systems practiced by small-scale farmers to ensure subsistence food crop production and a small income. This research used scientific modeling tools to produce quantitative information on the evolution of soils under this shifting agricultural system. An analysis of farming system led to the development of a conceptual model of the spatio-temporal dynamics of shifting agriculture, including transition matrices of rotational cycles that guided the sampling strategy for the study of soil evolution under the system. The study of soil variability showed that 30–35% of the total variance of some topsoil (0–20 cm) properties was due to the influence of land use practices. Five soil properties (pH, calcium, available phosphorus, bulk density and organic carbon) that are the most sensitive to these agricultural practices were empirically modeled and linear/quadratic fractional rational functions were successfully fitted to time series soil variables to derive quantitative measures on temporal changes in soil with land use. Data and methods produced are useful for soil quality assessment and spatio-temporal dynamic simulation in order to guide decision-making for sustainable land-use planning and soil resources management.
Introduction
The imbalance between the luxurious forest stands and the low agricultural production of soils of the tropical rain forest region raises several questions about their capability to sustain intensive agriculture. This has forced small-scale farmers in this area to adopt shifting agricultural systems to ensure subsistence food crop production and a small income. This shifting agriculture is considered as a strategy of resources management in which fields are shifted in order to exploit the energy and nutrient capital of natural vegetation-soil complex of the future land portion to be used (Warner, 1991). Because this strategy is flexible in response to changes in the environment, it is a dynamic system shifting in space and time. According to several authors (Sanchez, 1977; Tulaphitak et al., 1985; Bewket and Stroosnijder, 2003), many soil characteristics under such systems vary over time from forest land clearing to the end of food cropping phase and during the fallow period or subsequent perennial plantations.
In such a context, there is a need to promote, on the basis of the soil evolution and soil attributes dynamics, better land management practices that can ensure efficient use of energy and nutrient capital from soil-vegetation complex. Indeed, the characterization of the spatial variability of these soil attributes is essential to achieve a better understanding of complex relations between soil properties and environmental factors (Goovaerts, 1998), and to determine appropriate management practices for soil resources use (Bouma et al., 1999). Changes in soil attributes can thus be modeled and used to quantify soil behavior under various scenarios (Jørgensen, 1994; Hoosbeek et al., 2000). Models here, are simplified representations of a soil system, designed to facilitate the understanding of processes and to predict the behavior of the system. This is what motivated the research reported in this paper.
The main objective was to provide quantitative information, developed through modeling processes, on short and long-term effects of shifting agriculture on soil properties. Various scientific techniques have been applied to simplify and model information extracted from a comprehensive dataset of soil properties collected under various land use/land cover (LULC) types, in order to provide answers to the following questions: what are land-uses and their transitions within the agricultural landscape? How dynamic is this land use system? At what scales do what factors influence chiefly on soil data variability or consistency? What are the most affected soil parameters? What are the extent and rates of changes in time?
The Research Site
The study area (Figure 1) is located between 2°47′-3°14′ N and 10°24′-10°51′ E in the Tropenbos Cameroon Programme (TCP). The climate is characterized by four seasons: two rainy seasons (March–June and September–November) and two dry seasons. The bi-modal rainfall pattern thus defines two growing seasons. The average annual rainfall is between 1,600 and 2,000 mm, with annual average temperature between 24 and 25°C (Waterloo et al., 2000). The TCP research area of was selected according to Foahom and Jonkers (1992) as representative of the mid-altitude dense moist evergreen Biafran forest of southern Cameroon (Gartlan, 1989).
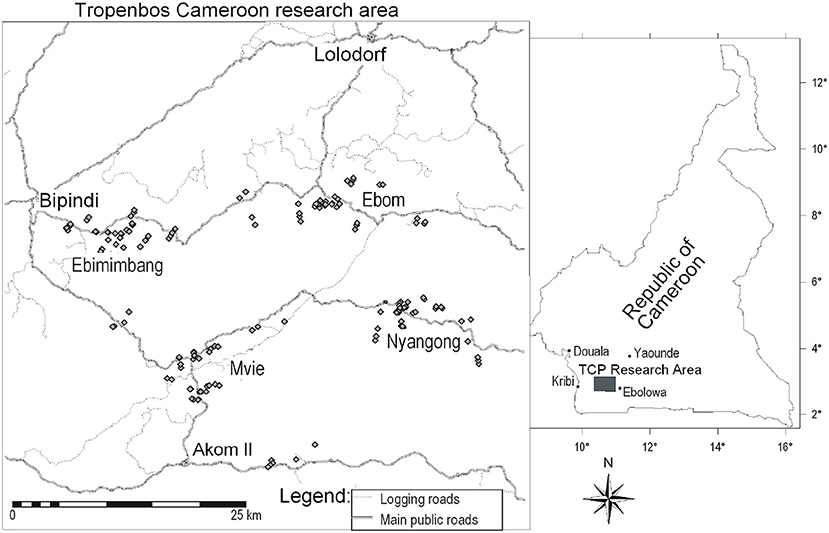
Figure 1. Location of the study areas and spatial distribution pattern of sample points (small diamonds in the sample area map).
The area is undulating and rises gradually to the southeast. The north-western part is underlain by the Precambrian Basement Complex and the south-eastern part by the Ntem Metamorphic Complex (Champetier de Ribes and Reyre, 1959). Most of the upland soils (about 95%) are Ferralsols and Acrisols according to the World Reference Base (WRB) for Soil Resources (FAO-ISRIC, 2006). These soils groups differ primarily by the presence of a strong textural contrast between topsoil and subsoil horizons in Acrisols and the dominance by sesquioxide clays in Ferralsols. Less developed poorly drained soils (about 5%) occupy the swampy drainage ways (Van Gemerden and Hazeu, 1999).
The area is sparsely populated, with <10 inhabitants per km2 in general, but about 20 inhabitants per km2 within villages, all located along the roads. Selective industrial logging and extensive shifting agriculture are the most important land use activities. Most agricultural farms are smallholdings but there are some larger plantations owned by local elites who are natives of a village, but who live in the cities.
Research Design and Methods
Shifting Agriculture as It Is Practiced
Analysis of farming systems (Nounamo and Yemefack, 2001; Yemefack, 2005, Chapter 2) established that shifting agriculture in the rain forest area of Cameroon is based on five main components: household, cropping, animal husbandry, soil system, and non-agricultural activities. These sub-systems are interrelated and under the influence of exogenous biophysical and socio-economic factors such as climate, roads and market infrastructures, prices, land tenure, and availability of credit. The household component plays a central role in the functioning of the whole system because, farmers are the locus of decision-making as well as source of labor and consumption. In the cropping system, the cultivation of food crop fields shifts every season from one place to another by clearing a parcel of fallow land or a portion of primary forest in order to exploit the energy potentials of soil-vegetation complex of the new plot. However, with increasing urbanization, the resulting demand for food may provide new income opportunities and promote diversification.
Data Collection
Four representative village areas (Ebimimbang, Ebom, Mvie, and Nyangong) were selected (Figure 1) to represent the distinct physiographic zones of the study area based on the landscape ecological survey by Van Gemerden and Hazeu (1999). Surface areas of 293 crop fields opened within 3 years by 35 households were measured. Thirty three plots were monitored from the first year of cropping to 7 years. Large plantations by local elites were visually identified on a geo-referenced false color composite (bands 4, 5, 3) of the Landsat-7 ETM+ imageries and their boundaries digitized in the ILWIS GIS (ITC, 2001) for evaluating their surface area. These elites are natives of the village who live and work in towns and have by custom, the right to clear forest land, which no one else is using. These rights were established to allow growing families to expand their subsistence production but are now applied by the local elites for a completely different purpose.
A Synchronic approach for soil data collection was combined with diachronic monitoring of plots during the 2-year cropping period and after 5 subsequent years. Land Use/Land cover (LULC) treatments (9 in total) were chosen based on actual agricultural production cycles (Figure 2) at smallholder scale described in Yemefack (2005, Chapter 2). Samples were taken with three or four different fields as replications in each village. These treatments comprised three fallow types with increasing duration [CF, (Chromolaena Fallow of 3–5 year-old), BF (Bush Fallow of 7–9 year-old), and FF (Forest Fallow of >15 year-old)], one CL (Crop Land) monitored from the beginning to the end of the cropping phase (coded: CL1 = at the beginning and CL2 = at the end of cropping 2 years after), one FCF (Forest Crop Field of 1–2 year-old), two PP (Perennial plantation) types (PPm = less than 7-year-old and PPo = more than 30 year-old), and one PF (Primary Forest) as control. No fertilizers were applied on any plot. A total of 175 patches were surveyed [FCF (12), CL1 (27), CL2 (27), CF (12), BF (12), FF (12), PF (34), PPm (10), PPo (12)].
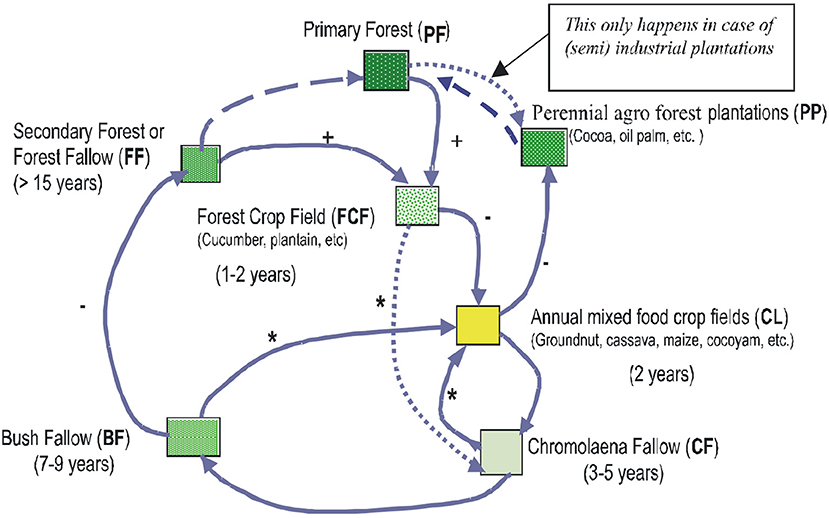
Figure 2. Observed transitions between land uses. Adapted from Yemefack (2005, Chapter 2). ( ) Common transitions; (
 ) Infrequent transitions; (
 ) PF recovery after definite abandonment; (+) patches can split (fragmentation); (–) patches can merge with others of the same type (consolidation); (*) patches can merge with those of other types.
In order to well-integrated the effect of land use on soils at the whole plot level, composite soil samples were bulked from five augerings along diagonals across each selected LULC patch and along a 100–200 m transect in forests, at three depths (0–10, 10–20, and 30–50 cm). CL plots were sampled two times (at the beginning of cropping, CL1 and 2 years after, CL2). These soil samples were analyzed in the IRAD soil laboratory at Nkolbisson (Yaoundé) for pH water (1:2.5 ratio), organic matter (Walker and Black method), available phosphorus (Bray II method), exchangeable bases (extraction with 1M ammonium acetate solution); exchange acidity (leaching with 1M KCl and titration by 1M NaOH), particle size distribution (Robinson pipette method) and bulk density (cylinder and oven dry at 105°C), using procedures described in Van Reeuwijk (1993).
Statistical Data Analysis and Modeling
A conceptual framework of shifting cultivation and rotational fallow cultivation systems (Figure 2) was developed (Yemefack, 2005; Chapter 2) which served as the reference for all the data collection and analyses.
Following a preview study on these data (Yemefack et al., 2006b), a multi-criteria quantitative selection procedure was developed and applied to a set of 13 soil variables collected within a chrono-sequence of shifting cultivation system. Five soil properties [pH, exchangeable calcium (Ca), available phosphorus (P.av), bulk density (Bd), and organic carbon (OC)] selected as the most affected by the shifting agricultural practices were used in this study. The five soil properties indicators could be easily interpreted in terms of their relation to land management practices and land use changes. The five selected soil properties all contribute to one or more soil functions proposed by Doran and Parkin (1996) as indicators of soil quality. Soil pH stands for soil reaction and contributes to the definition of soil biological and chemical thresholds essential to process modeling. Calcium represents the status of soil exchangeable bases and contributes to the ability of soil to supply nutrients. Available phosphorus is important in supplying N and P to plants. Bulk density influences soil porosity and water infiltration, and contributes to the potential for leaching and erodibility. Finally, organic carbon affects the ability of soil to accept, hold, and release nutrients, water and other chemical constituents as well as to the physical soil structure. They can thus be used individually or in combination to assess the effect of this practice on soil condition (Yemefack et al., 2006b).
Various statistical techniques [descriptive statistics, analysis of variance, and means separations (Tukey's method), Curve fitting, etc.] were applied to the dataset for each specific objective. The analyses were carried out in R environment (Ihaka and Gentleman, 1996). Spatial analysis and remote sensing processing were done using ILWIS (ITC, 2001). Functions of soil properties evolution with time were determined using CurveExpertProfessional 2.0.4 software (Hyams, 2014a). The goodness-of-fit of the parameterized function to the data was assessed with the coefficient of determination (R2). The GraphExpertProfessional 1.1.3 software (Hyams, 2014b) was used to plot these functions.
The five most sensitive soil properties were used individually to model the behavior of soil over time, the time being represented by a land use chronosequence (Yemefack et al., 2006a). Models are here considered as simplified representations of a system, which are designated to facilitate the understanding of processes and to predict the behavior of the system under various scenarios (Hoosbeek et al., 2000). Within the longest cycles of shifting cultivation (SC) and agroforest cocoa plantations (PP) (Figure 3), each soil property changes as a function of time t, with
where P(t) is the value of the soil property P at time t, P0 is the value of soil property P at time t = 0 (under the PF cover), and f(t) is the change function of time. Since our interest for this study was to model the changes, not the absolute values, we converted each variable to a proportional deviation (Pd) from the reference sites PF as follows: If Pi is the value of a soil property from treatment i and P0 the non-zero value of the same property from the corresponding PF on the same soil type, the Proportional deviation Pdi is computed as:
Pd values were plotted against time to determine the form of f(t) and attempts were made to fit suitable functional forms, of which low-order fractional rational functions proved to be most appropriate. In this case, proper linear/quadratic fractional rational functions,
showed a reasonable shape to model changing soil properties in response to events such as land clearing, burning, cropping, fallowing and PP. The shape of this function curve is controlled by parameters a (equal zero in this case of Pd), b, c, and d that were all computed using non-linear least squares in the R environment (Ihaka and Gentleman, 1996). The fitted functions were used to evaluate metrics describing soil behavior over time: maximum proportional deviation from the base state (ym), time to reach this maximum (tm), and relaxation time toward the original value (tp = time after tm at which the curve reaches some predefined proportion of recovery).
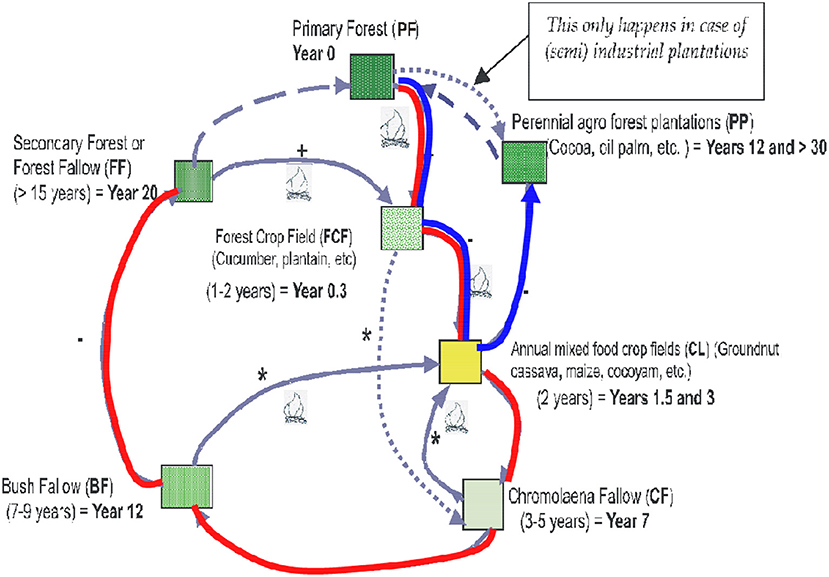
Figure 3. Modeling pathways of temporal soil evolution under shifting cultivation (SC in red line) and under perennial plantations (PP in blue line).
Results and Discussion
Dynamics of Shifting Agriculture
The cultivation of food crop fields (FCF and CL) shifts every season from one place to another by clearing a parcel of fallow land (FF, BF, or CF) or a portion of primary forest (PF). The resulting spatial pattern is a landscape composed of patches of primary forest, fallows, crop fields, perennial plantations, and settlements with their associated home gardens. Figure 2 shows the observed transitions between land uses within this system; considered as the conceptual basis for analysis of land use dynamics within the area. Table 1 shows the observed transition proportions for each year and over the 6-year study period, thus estimating transition probabilities for some of the arcs in Figure 4.
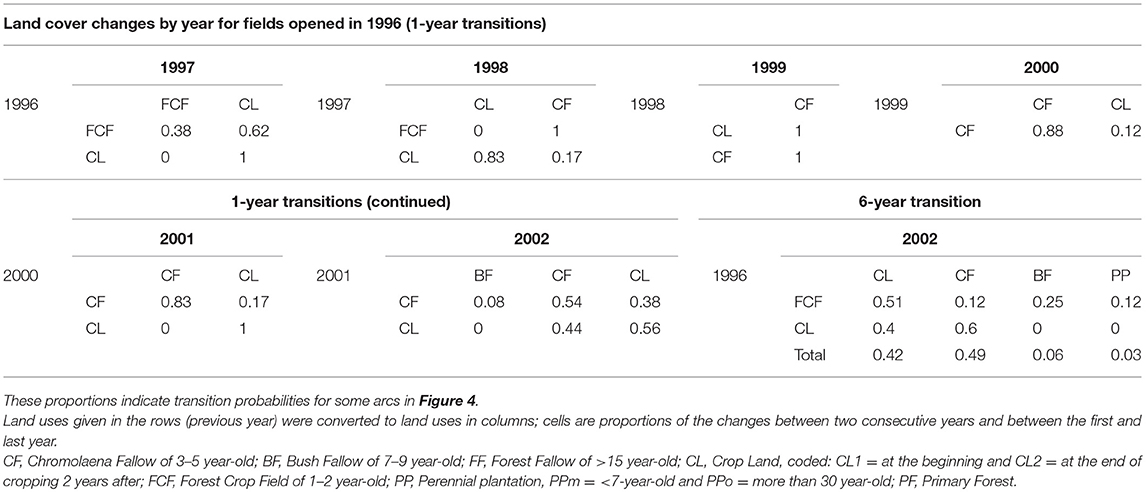
Table 1. One- and six-year transition proportions for fields opened in 1996.
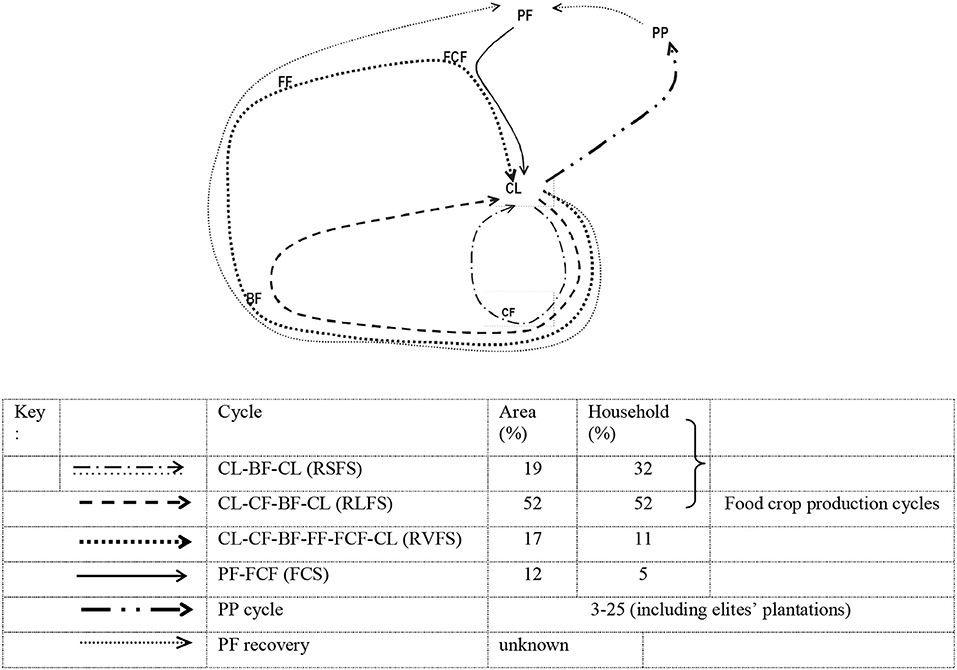
Figure 4. Cycle proportions of shifting agricultural land use management in southern Cameroon. Adapted and modified from Yemefack (2005, Chapter 2). CF, Chromolaena Fallow of 3–5 year-old; BF, Bush Fallow of 7–9 year-old; FF, Forest Fallow of >15 year-old; CL, Crop Land, coded: CL1 = at the beginning and CL2 = at the end of cropping 2 years after); FCF, Forest Crop Field of 1–2 year-old; PP, Perennial plantation, PPm = less than 7-year-old and PPo = more than 30 year-old; PF, Primary Forest.
The analysis of farmers' field size distribution and the conceptual model of land use dynamic exposed the issue of rotational fallow systems, which tend to replace the ideal shifting cultivation in which short-term cropping alternates with secondary forest on a plot. This has shown (Figure 4) that about 19% of food crop field plots were based on short rotational fallow cycles (RSFS), about 52% on long rotational fallow cycles (RLFS), about 17% on very long fallow cycles (RVFS), and about 12% on forest conversion (FCS). These proportions were similar to figures reported by Fujisaka et al. (1996) in their review of shifting cultivation systems at sites located in Africa, Asia, and Latin America. If the shorter fallow cycles are sustainable, this would be ecologically (minimizing deforestation) profitable as well as for the household (less labor). This may require intensification: tighter integration into the market economy and some purchased inputs, with special attention to nutrient cycling and soil management.
In this study, 88% of the area cleared for crop fields came from fallow lands and only 12% from primary forest (Figure 4). If the proportion of the food crop fields that are abandoned to secondary forest could also be close to 12%, the food crop production system does not require net conversion of forest under the present situation of slow population growth and weakly developed infrastructure and markets, provided that secondary forest is ecologically valuable like the primary forest.
However, with the involvement of local elites in agricultural plantations, net deforestation is probably occurring, because these plantations are only developed within the primary forest to avoid land-use conflicts. In addition, plantation plot sizes are far larger than those of small farmers. In this study, 35 households cleared 95 ha in 3 years, of which only 12% was from PF. By contrast, only six elite's plantations (at Mvie area) converted 425 ha, all from PF, during the same period. This brings the total proportion of PF in the cleared area to about 40% when including elite plantations.
Summary Statistics and Soil Variability in the Study Area
Table 2 shows average soil properties change from fallow to food crop fields after burning within the 0–10 cm of soil depth and Table 3 summarizes the statistics of the five soil variables studied here. They all showed a positive skewness at all depths with coefficients varying between 0.08 and 2.2. So that the mean of each variable is slightly greater than the median. However, no transformation was done on the original dataset since ANOVAs are rather insensitive to slight departures from normality Webster (2000). The statistics of these soil variables showed a much higher variation at the shallowest depth than in the subsoil as shown by the coefficient of variation (CV%) of each variable, confirming the common observation that soil management such as burning and tillage in shifting cultivation systems affects primarily the topsoil.
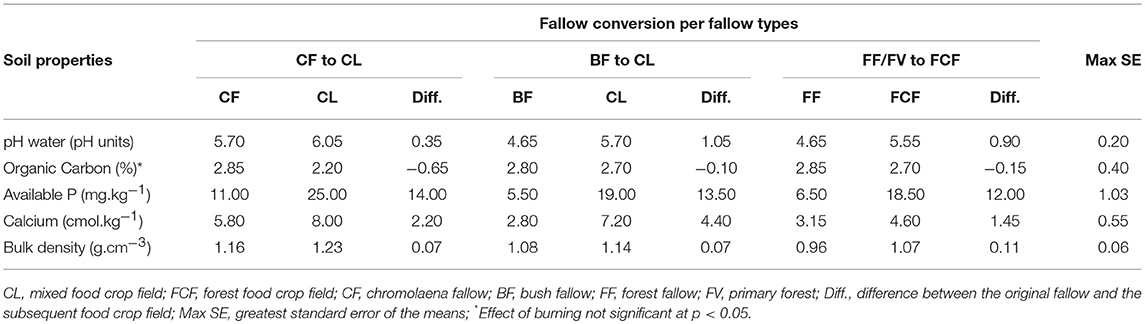
Table 2. Average soil properties change from fallow to food crop fields after burning within the 0–10 cm of soil depth.
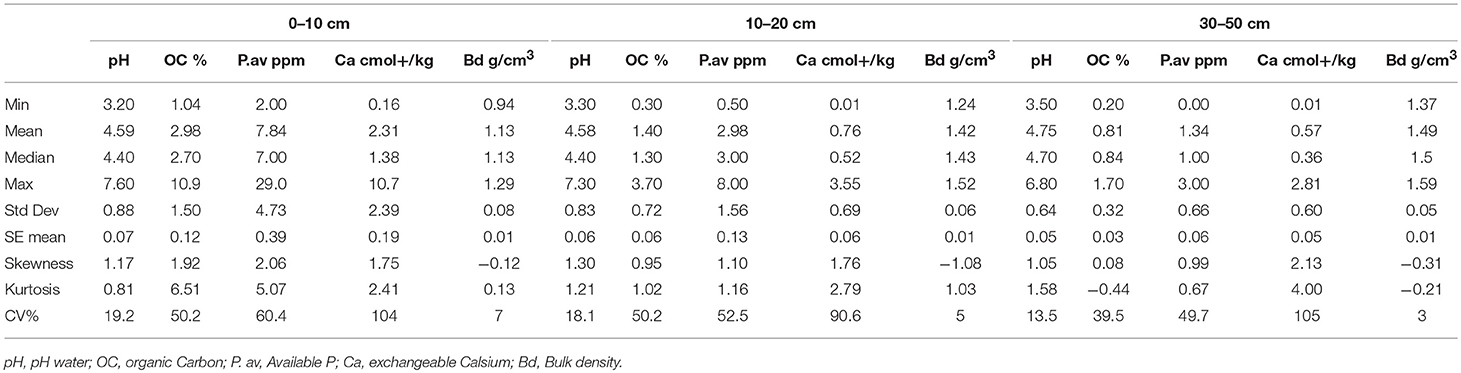
Table 3. Summary statistics of the original soil variables (sample population n = 147).
Based on a preview study by Yemefack et al. (2005) carried out in the same area to characterize the sources of soil variability at four scales (regional, village, plot, and laboratory), a meta-analysis was done for a better understanding of complex relations between soil properties, environmental factors and land use systems. The analysis showed that this four-scales study was able to explain for five variables, up to 80% (for less sensitive soil variables) to 95% (most sensitive ones) of the overall soil variation (Figure 5); with 25–35% by local factors and 5–10% by within-plot factors, which are mainly influenced by land use practices. However, 5–20% of the total variance remained unexplained and is perhaps due to statistical or other interactions between levels for which we had no experimental design.
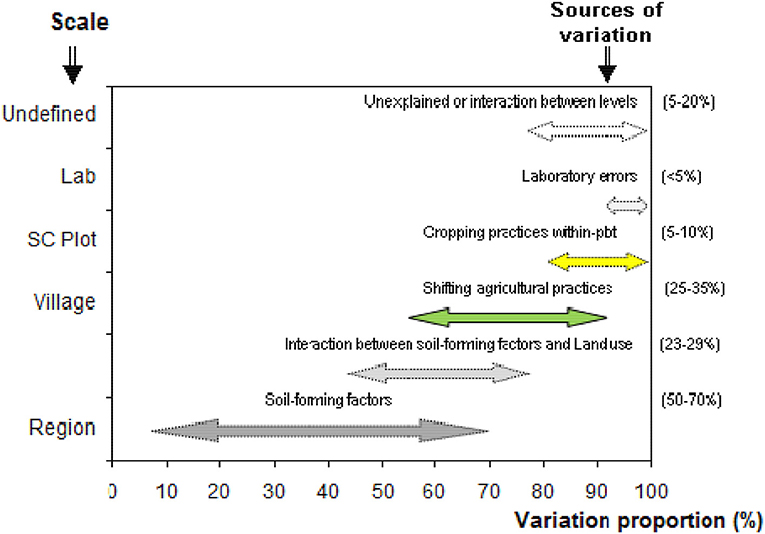
Figure 5. Sources and scale of soil variability within the SALMS of southern Cameroon.
Land use practices significantly (p < 0.05) influenced topsoil variation at village level (i.e., between plots) and accounted for 30–35% of topsoil (0–20 cm depth) variation. But, because regional factors of soil variability are more stable over time, research for a better understanding of the relations between soil properties and appropriate management practices for soil resource use, should focus chiefly on processes and factors occurring at local-scale level (village) because they are influenced by a dynamical land use system.
Soil Dynamics Under Shifting Agriculture
Many soil properties were significantly sensitive to land use effect within the first 20 cm of soil depth (but not for deeper layers); with the same trend but different rates of changes for some soil characteristics. Soil behavior under the shifting agriculture was here quantified for the most sensitive soil properties by their mathematical model as a function of time.
The five soil properties (pH water, exchangeable calcium, available phosphorus, bulk density, and organic carbon) selected as the most affected by the shifting agricultural practices (Yemefack et al., 2006b) were considered to be used individually or in combination to assess the effect of this practice on soil condition.
In modeling the evolution of these parameters, proportional deviation (Pd) for the control (Virgin Forest) of soil properties was plotted against time to determine the form of the time functions f (t) and attempts were made to fit suitable functional forms, of which low-order fractional rational functions proved to be most appropriate on our dataset.
Based on these functions, the long-term response of the soils to land use/land cover types along the chrono-sequence was found to have two phases in both shifting cultivation (SC) and perennial cocoa plantation (PP) (Figure 6): an initial change with land clearing, which continues into the initial cropping phase, and a reversal of this change during the fallow period or PP. The first phase responds to the effects of heat and liming ashes from burning and corresponds to an increase of pH water, Calcium, Available P, and bulk density. For organic carbon, there was an initial decrease, probably due to the rapid mineralization of organic matter caused by heat and tillage. The reversal trends confirmed the effect of fallow; tending toward the initial values of soil properties.
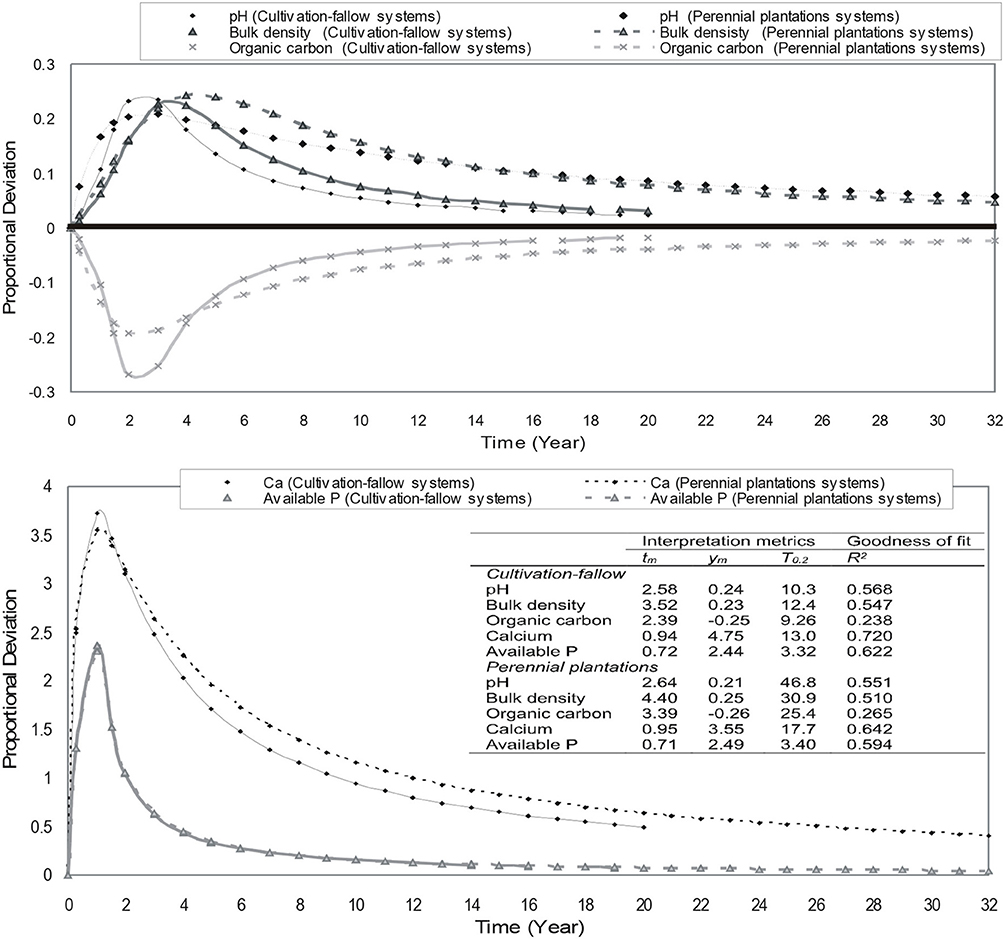
Figure 6. Linear/quadratic fractional rational functions fitted to soil properties (0–10 cm) dynamics under two land use chrono-sequences (food cropping-fallow system and perennial plantation) as shown by proportional deviations from the reference under primary forest over time.
The fitted function explained 50–80% of soil dynamics for the first four variables in the 0–20 cm layer but only 25% for organic carbon. These functions showed a very quick reaction to forest conversion for calcium, available P and organic carbon with maxima reached at the end of the first year. Soil reaction and bulk density showed significant changes a bit later (2.5–3.5 years). The general trend of organic carbon dynamics showing a significant decrease during the short cultivation period and an increase during the period of fallow or PP corroborated with the results of Van Noordwijk et al. (1997) on soils in a similar eco-zone of Sumatra. The low contribution (only 25%) of organic carbon to the models could be explained by the strong fluctuations of data during the years in this humid tropical environment where hot and wet conditions directly impact soil organic matter during yearly seasons.
Concluding Remarks
• The conceptual model of land use dynamics and their transitions showed that the short rotational fallow cycle (RSFS) is increasingly being used due to the farmers' desire to replace cash income from cocoa with cash food crops. This may require intensification; with tighter integration into the market economy and some purchased inputs (with special attention to nutrient cycling and soil management) in order to enjoy the benefits of the shorter fallow cycles in minimizing both deforestation and labor demand.
• Land use practices significantly influence topsoil variation at village level (i.e., between plots) and accounted for 30–35% of the total variance of the top 20 cm of soil.
• Five soil properties (pH, exchangeable calcium, available phosphorus, bulk density, and organic carbon) that are the most affected by the shifting agricultural practices in topsoil, showed an empirical trend of soil behavior under shifting agriculture which is well-described by linear/quadratic fractional rational functions of time. Interpretation metrics derived from these functions are useful for supporting decision in defining and timing any intervention action. For example, the short-lived effect of burning on available P suggests that the external input of phosphorous fertilizer would be required in a prolonged cropping system.
• The research has provided a set of results on land use that are useful for soil quality assessment in relation to land use practices, and for spatio-temporal simulation modeling of shifting agricultural landscape dynamics in order to guide decision-making on sustainable soil management in the area.
Author Contributions
MY initiated the study and carried out field data collection, data analyses and drafted the manuscript. RN was part of the study from the beginning and has carried out all the lab analyses, she has especially contributed to the section on soil variability at lab level. DR has been involved in this study as Ph.D. supervisor, he has contributed to statistical data analyses and to improving the manuscript.
Conflict of Interest Statement
The authors declare that the research was conducted in the absence of any commercial or financial relationships that could be construed as a potential conflict of interest.
Acknowledgments
The financial support for field data collection was provided by the ITTO (International Tropical Timber Organization) within the framework of the Tropenbos Cameroon Programme (Project PD 26/92). Supplementary data collection and analysis were completed with support from the International Institute for Geo-Information Science and Earth Observation (ITC), Enschede, The Netherlands. Some of the materials used in this paper were drawn from Yemefack (2005), a Ph.D. thesis published as ITC Dissertation 121, ITC Enschede, and Utrecht University, The Netherlands.
References
Bewket, W., and Stroosnijder, L. (2003). Effects of agroecological land use succession on soil properties in Chemoga watershed, Blue Nile basin, Ethiopia. Geoderma 111, 85–98. doi: 10.1016/S0016-7061(02)00255-0
Bouma, J., Stoorvogel, J., Van Alphen, B. J., and Booltink, H. W. G. (1999). Pedology, precision agriculture, and the changing paradigm of agricultural research. Soil Sci. Soc. Am. J. 63, 1763–1768. doi: 10.2136/sssaj1999.6361763x
Champetier de Ribes, G., and Reyre, D. (1959). Carte Géologique de Reconnaissance: Notice Explicative Sur la Feuille Yaoundé-ouest. Paris: Direction des Mines et de la Géologie.
Doran, J. W., and Parkin, T. B. (1996). “Quantitative indicators of soil quality: a minimum data set,” in Methods for Assessing Soil Quality, eds J. W. Doran and A. J. Jones (Madison: Soil Science Society of America), 25–37.
Foahom, B., and Jonkers, W. B. J. (1992). A Programme for Tropenbos Research in Cameroon. Wageningen: The Tropenbos Foundation.
Fujisaka, S., Hurtado, L., and Uribe, R. (1996). A working classification of slash-and-burn agricultural systems. Agroforest. Syst. 34, 151–169. doi: 10.1007/BF00148159
Gartlan, S.(ed.). (1989). La conservation Des Écosystèmes Forestiers du Cameroun. Gland; Suisse et Cambridge: UICN.
Goovaerts, P. (1998). Geostatistical tools for characterizing the spatial variability of microbiological and physico-chemical soil properties. Biol. Fertl. Soils 27, 315–334. doi: 10.1007/s003740050439
Hoosbeek, M. R., Amundson, R. G., and Bryant, R. B. (2000). “Pedological modeling,” in Handbook of Soil Science. ed M. E. Sumner (Boca Raton, FL: CRC Press), E77–E116.
Hyams, D. G. (2014a). CurveExpert Professional Documentation. Release 2.0.4. Available online at: http://docs.curveexpert.net/curveexpert/pro
Hyams, D. G. (2014b). GraphExpert Professional Documentation. Release 1.1.3. Available online at: http://docs.curveexpert.net/curveexpert/pro
Ihaka, R., and Gentleman, R. (1996). R: a language for data analysis and graphics. J. Comput. Graphic Stat. 5, 299–314.
Jørgensen, S. E. (1994). Models as instruments for combination of ecological theory and environment practice. Ecol. Model. 75–76, 5–20. doi: 10.1016/0304-3800(94)90003-5
Nounamo, L., and Yemefack, M. (2001). Farming Systems in the Evergreen Forest of Southern Cameroon: Shifting Cultivation and Soil Degradation the Tropenbos Foundation. Wageningen: The Tropenbos Foundation.
Sanchez, P. A. (eds.). (1977). “Soil management under shifting cultivation,” in A Review of Soils Research in Tropical Latin America, North Carolina Agricultural Experiment Station Technical Bulletin 219 (Raleigh, NC), 46–67.
Tulaphitak, T., Pairintra, C., and Kyuma, K. (1985). Changes in soil fertility and tith under shifting cultivation: changes in soil nutrient status. Soil Sci. Plant Nutr. 31, 239–249. doi: 10.1080/00380768.1985.10557430
Van Gemerden, B. S., and Hazeu, G. W. (1999). Landscape Ecological Survey (1:100 000) of the Bipindi-Akom II-Lolodorf Region, Southwest Cameroon the Tropenbos Foundation. Wageningen: The Tropenbos Foundation.
Van Noordwijk, M., Cerri, C. C., Woomer, P. L., Nurgroho, K., and Bernoux, M. (1997). Soil carbon dynamics in the humid tropical forest zone. Geoderma 79, 187–225. doi: 10.1016/S0016-7061(97)00042-6
Warner, K. (1991). Shifting Cultivators: Local Technical Knowledge and Natural Resource Management in the Humid Tropics. Rome: FAO.
Waterloo, M. J., Ntonga, J. C., Dolman, A. J., and Ayangma, A. B. (2000). Impact of Shifting Cultivation and Selective Logging on the Hydrology and Erosion of Rain Forest Land in South Cameroon, 2nd Revised Edn. Wageningen: The Tropenbos Foundation.
Webster, R. (2000). Statistics to support soil research and their presentation. Eur. J. Soil Sci. 52, 331–340. doi: 10.1046/j.1365-2389.2001.00383.x
Yemefack, M. (2005). Modelling and Monitoring Soil and Land use Dynamics Within Shifting Agricultural Landscape Mosaic Systems ITC Enschede and Utrecht University, Enschede.
Yemefack, M., Jetten, V. G., and Rossiter, D. G. (2006b). Developing a minimum data set for characterizing soil dynamics under shifting cultivation systems. Soil Tillage Res. 86, 84–98. doi: 10.1016/j.still.2005.02.017
Yemefack, M., Rossiter, D. G., and Jetten, V. G. (2006a). Empirical modelling of soil dynamics along a chronosequence of shifting cultivation in southern Cameroon. Geoderma 133, 380–397. doi: 10.1016/j.geoderma.2005.08.003
Keywords: soil properties dynamics, soil evolution, modeling soil dynamics, shifting agriculture, tropical rain forest, Southern Cameroon
Citation: Yemefack M, Njomgang R and Rossiter DG (2019) Quantified Soil Evolution Under Shifting Agriculture in Southern Cameroon. Front. Environ. Sci. 7:16. doi: 10.3389/fenvs.2019.00016
Received: 03 July 2018; Accepted: 23 January 2019;
Published: 28 February 2019.
Edited by:
Christina Bogner, University of Bayreuth, GermanyReviewed by:
Dominique Arrouays, Institut National de la Recherche Agronomique (INRA), FranceZamir Libohova, United States Department of Agriculture, United States
Copyright © 2019 Yemefack, Njomgang and Rossiter. This is an open-access article distributed under the terms of the Creative Commons Attribution License (CC BY). The use, distribution or reproduction in other forums is permitted, provided the original author(s) and the copyright owner(s) are credited and that the original publication in this journal is cited, in accordance with accepted academic practice. No use, distribution or reproduction is permitted which does not comply with these terms.
*Correspondence: Martin Yemefack, bS55ZW1lZmFja0BjZ2lhci5vcmc=; bXllbWVmYWNrQHlhaG9vLmZy; eWVtZWZhY2tAYWx1bW5pLml0Yy5ubA==