 Amy McNally1,2*
 Sean McCartney1,3
 Alex C. Ruane4
 Iliana E. Mladenova1,2
 Alyssa K. Whitcraft5,6
 Inbal Becker-Reshef5,6
 John D. Bolten1Christa D. Peters-Lidard1Cynthia Rosenzweig4
 Stephanie Schollaert Uz1
- 1NASA Goddard Space Flight Center, Greenbelt, MD, United States
- 2Earth System Science Interdisciplinary Center, University of Maryland, College Park, MD, United States
- 3Science Systems and Applications, Inc., Lanham, MD, United States
- 4NASA Goddard Institute for Space Studies, Climate Impacts Group, New York, NY, United States
- 5Global Agricultural Monitoring Research Group, Department of Geographical Sciences, University of Maryland, College Park, MD, United States
- 6GEO Global Agricultural Monitoring Initiative Secretariat, Geneva, Switzerland
In a globalizing and rapidly-developing world, reliable, sustainable access to water and food are inextricably linked to each other and basic human rights. Achieving security and sustainability in both requires recognition of these linkages, as well as continued innovations in both science and policy. We present case studies of how Earth observations are being used in applications at the nexus of water and food security: crop monitoring in support of G20 global market assessments, water stress early warning for USAID, soil moisture monitoring for USDA's Foreign Agricultural Service, and identifying food security vulnerabilities for climate change assessments for the UN and the UK international development agency. These case studies demonstrate that Earth observations are essential for providing the data and scalability to monitor relevant indicators across space and time, as well as understanding agriculture, the hydrological cycle, and the water-food nexus. The described projects follow the guidelines for co-developing useable knowledge for sustainable development policy. We show how working closely with stakeholders is essential for transforming NASA Earth observations into accurate, timely, and relevant information for water-food nexus decision support. We conclude with recommendations for continued efforts in using Earth observations for addressing the water-food nexus and the need to incorporate the role of energy for improved food and water security assessments.
Introduction
In a globalizing and rapidly-developing world, reliable and sustainable access to water, food, and energy are inextricably linked to each other and basic human rights. With world population estimated to reach between 9 and 10 billion by mid-century (UN DESA, 2015), demand for water and food is estimated to increase by 40 and 35%, respectively by 2030 (U. S. National Intelligence Council, 2013). Globally, the agricultural sector consumes on average two-thirds of accessible freshwater on the planet (Clay, 2004; Prince and Fantom, 2014). Agriculture further impacts water resources through land degradation, changes in runoff, and unsustainable use of ground water (Alauddin and Quiggin, 2008). Given the magnitude of the challenge of providing safe and reliable access to water and food a system-wise approach is required to protect against current and future risks of insecurity.
The linkages between water, food, and energy make sustainability and security difficult to disentangle. A “nexus” approach is required that recognizes the interdependencies across sectors for optimizing resources sustainably (Rasul and Sharma, 2016). The United Nations (UN) now states “The water-food-energy nexus is central to sustainable development…The inextricable linkages between these critical domains require a suitably integrated approach to ensuring water and food security, and sustainable agriculture and energy production worldwide” (http://www.unwater.org/water-facts/water-food-and-energy/).
The idea for a nexus approach was introduced at the Bonn 2011 Nexus Conference (Endo et al., 2017), a meeting organized by the German government in preparation for the UN Conference on Sustainable Development, known as Rio+20. The objective of the Bonn 2011 Nexus Conference was to brainstorm solutions to complex, sustainable development problems and to develop recommendations for improving upon the previous UN Earth Summit, Rio1992, which fell short of delivering on its sustainable development goals. As a result of Bonn 2011, the nexus emerged to challenge existing international, national, and sub-national policies, and transition from a sectoral approach to solutions that embrace a cross-sectoral, coherent, and integrated perspective. Moreover, an integrated approach helps decision-makers address externalities and trade-offs between food, water, and energy sectors such as: the degradation of ecosystem services; rapidly increasing demand for resources through population growth; an expanding middle class, with changes in diets; urbanization; globalization; and climate change (Hoff, 2011).
Given the global and cross-scale nature of the water-food-energy nexus, Earth observations (EO) from satellites and models have made important contributions to both scientific research and decision-making. Agriculture is inherently a nexus issue, and EO have a history in addressing agriculture and the water-food nexus. Since the launch of the National Aeronautics and Space Administration's (NASA) first Landsat mission (originally named Earth Resources Technology Satellite [ERTS]) in 1972, global agricultural monitoring has been one of the longest operational applications for satellite imagery (Leslie et al., 2017). By 1979, the National Oceanic and Atmospheric Administration (NOAA) Advanced Very High Resolution Radiometer (AVHRR) multispectral instrument allowed for monitoring vegetation greenness from space, with global coverage on a daily basis. AVHRR allowed scientists to create vegetation indices such as the Normalized Difference Vegetation Index (NDVI) for monitoring seasonal changes in vegetation condition (phenology), as well as drought stress derived from NDVI anomalies (Anyamba and Tucker, 2012). Along with the rise in EO have come rapid increases in high-performance computational resources, which favor the open development and execution of Earth system models customized for agricultural and water resources modeling [e.g., NASA Goddard Earth Observing System Model (GEOS-5; Rienecker et al., 2008), NASA Goddard Institute for Space Studies Model-E (Schmidt et al., 2014), and NASA Land Information System (LIS; Kumar et al., 2006)]. In the context of crop yields, Figure 1 is a schematic of how retrospective datasets and their near-real time production can provide water-food nexus decision support. Meanwhile, forecasts require a probabilistic perspective as uncertainties interact across climate and crop response models, providing alternative scenarios for decision support.
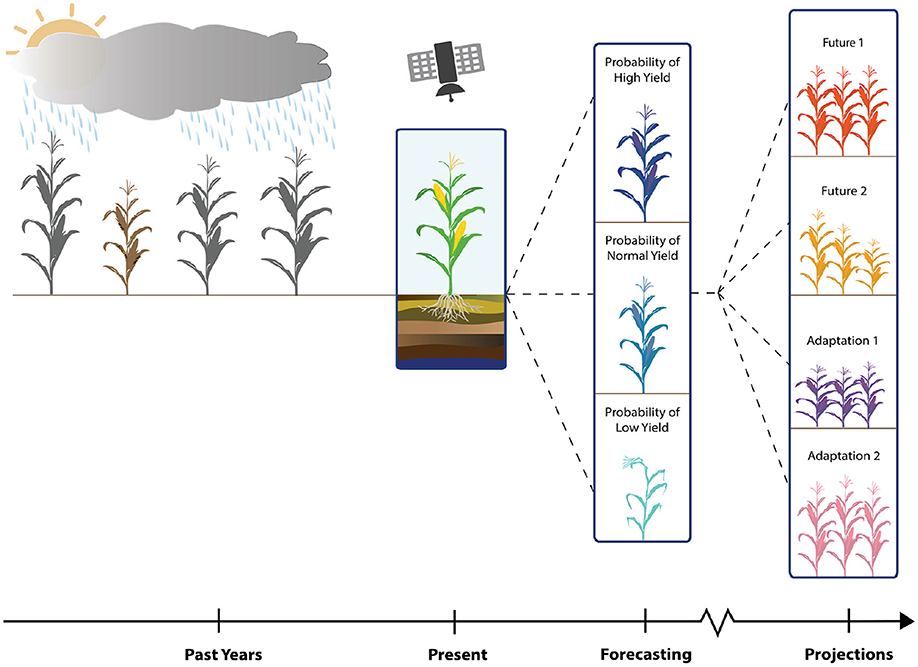
Figure 1. Retrospective, real-time, forecast, and projection modes for agricultural applications. Resources include weather observations, satellites, and crop model projections. The focus is on understanding historical anomalies, providing detail on current state, providing probabilistic forecasts, and projecting alternate scenarios affected by factors within and beyond the farming system.
Water security
The United Nations University (2013) defined water security as “…the capacity of a population to safeguard sustainable access to adequate quantities of acceptable quality water for sustaining livelihoods, human well-being, and socio-economic development, for ensuring protection against water-borne pollution and water-related disasters, and for preserving ecosystems in a climate of peace and political stability.”
Food security
The UN Food and Agriculture Organization (FAO) defined food security as “…when all people, at all times, have physical, social and economic access to sufficient, safe and nutritious food which meets their dietary needs and food preferences for an active and healthy life.” (World Food Summit, 1996).
In addition to state-of-the-art technology, NASA uses an applications approach to missions, fostering innovative uses of NASA EO in organizations' policy decisions for societal benefit (Brown et al., 2013; Brown and Escobar, 2014). This is accomplished by following guidelines for the co-production of useable knowledge in sustainable development (Clark et al., 2016). Commitment to this approach is demonstrated by the Group on Earth Observations, a voluntary organization comprised of intergovernmental, international, and regional organizations (GEO, 2005), which promotes the use of EO in sustainable development policy. GEO has a Water-Energy-Food (W-E-F) Community Activity, which uses EO, analytics, and new governance approaches to integrate across the water, energy, and food sectors. Objectives are to develop new datasets and applications and to enable their integration for the W-E-F nexus to benefit the water, energy, and food Sustainable Development Goals (SDGs; GEO, 2016). Data sharing among these initiatives is promoted through The Global Earth Observation System of Systems (GEOSS), which aims to build a Community of Practice around enhancing stakeholder engagement, and improving in situ measurements, data assimilation, and modeling capabilities (Lawford et al., 2013). The GEO W-E-F activity builds upon the success of the GEO Global Agricultural Monitoring (GEOGLAM) Initiative (detailed in section Crop Monitors for AMIS and Early Warning) as well as the GEO Global Water Sustainability (GEOGLOWS) water activities that use EO to mitigate hydrologic extremes and degraded water quality.
Given the global and cross-scale nature of agriculture and the water-food nexus, EO from satellites are essential for providing the data and scalability to monitor relevant indicators across space and time. This improved understanding of agriculture and the hydrological cycle can provide water-food nexus decision support. The case studies presented below provide insight into how these initiatives promote the transformation of EO into usable knowledge for sustainable development policy.
Application Case Studies
The following case studies provide real-world examples of scientists and end-users following the guidelines for co-developing useable knowledge for sustainable development (Clark et al., 2016), in the context of food and water security. The sustained partnerships with decision makers allow us, as EO researchers, to continuously provide state-of-the-art products that stakeholders deem accurate, credible, and legitimate, and thus support decision-making and policy. The extent to which end-users adopt a water-food nexus approach will guide their information requests and, in turn, the products that EO scientists provide. Beyond the direct stakeholders these data are made publicly available which enhances transparency, and potential for innovations from the broader water-food nexus community of researchers and policy makers. The case studies largely ignore the energy component of food and water security. In the paper's conclusions we discuss how greater consideration of energy could strengthen EO's role in food and water decision-making.
Crop Monitors for AMIS and Early Warning
When food prices spiked in 2011, the G20 decided to act against food price volatility, promote market transparency, and to improve early warnings of crop shortages and failures. Given the long history of EO and agriculture, they requested a proposal from the GEO Agricultural Monitoring Community of Practice (Becker-Reshef et al., 2010) to use satellite-based EO to enhance crop production projections. From this, the GEO Global Agricultural Monitoring Initiative (GEOGLAM) and Agricultural Market Information System (AMIS), were born, and endorsed by the G20 through its 2011 Action Plan on Food Price Volatility and Markets. Together these programs provide timely and transparent information on agricultural markets (Parihar et al., 2012; Whitcraft et al., 2015a). In 2012, the world again witnessed simultaneous declines in crop conditions across multiple important grain producing areas: the United States, Kazakhstan, and Russia. GEOGLAM's use of NASA's MODIS NDVI anomaly via the Global Agricultural Monitoring (GLAM) system enabled one of the earliest detections of this major food production issue (Becker-Reshef et al., 2010).
The synoptic, early warnings provided by EO positively impacted both food security and market stability by empowering policy makers and farmers to formulate food security action plans before crisis hit. Given this success, GEOGLAM launched the monthly, global Crop Monitor for AMIS (CM4AMIS). Operational since September 2013, the CM4AMIS leverages existing monitoring systems to build international consensus around the conditions of wheat, maize, soybean, and rice in the countries responsible for >80% of production. The Crop Monitor consensus building process, informed by EO, has the capacity to account for water and energy constraints on agricultural production. National and regional assessments are based on expert opinion and field campaigns/surveys (if available) combined with baseline datasets (crop type mask and crop calendars). To assess spatially varying crop and water conditions experts rely on EO datasets including NASA MODIS-based NDVI and NDVI anomaly (Bréon and Vermote, 2012), NOAA NCEP Reanalysis 2 Temperature Anomaly and Precipitation Anomaly (Kistler et al., 2001; Kanamitsu et al., 2002), European Centre for Medium-Range Weather Forecasts (ECMWF) Cumulative Temperature Anomaly and Precipitation Anomaly (Matricardi et al., 2004; Berrisford et al., 2011; Dee et al., 2011), Soil Moisture Anomaly from the European Space Agency (ESA) Soil Moisture Ocean Salinity (SMOS) retrievals processed by NOAA NESDIS (Reichle et al., 2008; Bolten et al., 2010; Kerr et al., 2012), EUMETSAT Soil Water Index Anomaly from ASCAT scatterometer onboard the Metop-A satellite (Wagner et al., 1999; Bartalis et al., 2006; Naeimi et al., 2009), USDA-NOAA Evaporative Stress Index based on modeled output and geostationary observations (Anderson et al., 2007, 2010), and USGS Actual Evapotranspiration Anomaly (Senay et al., 2013). In the future, products from the Harmonized Landsat and Sentinel dataset (Claverie et al., 2018) will be used, which can resolve phenomenon like irrigation. We acknowledge that remotely estimates are limited by their different characteristics (e.g., optical sensor temperature retrievals require cloud free conditions, which may be rare during the rainy season). Because of this, convergence of evidence and expert opinion are required to synthesize the best possible information.
The outcome of the Crop Monitor process are maps of conditions and their associated drivers (wet, dry, hot, cold, extreme event), textual summaries of conditions (excellent, favorable, watch, poor), and pie charts that show conditions of crops by share of global production and global exports (Figures 2A,B). These monthly reports, released the first Thursday of each month for conditions as of the 28th of the previous month, provide qualitative assessments of conditions, which provide intuitive, readily comprehensible snapshots of global crop conditions to a non-EO community. As of June 2018, the CM4AMIS has nearly 40 partners from around the world reporting on their countries and regions of expertise, and has become a trusted source of information for AMIS, National Ministries of Agriculture, and those interested in grain markets.
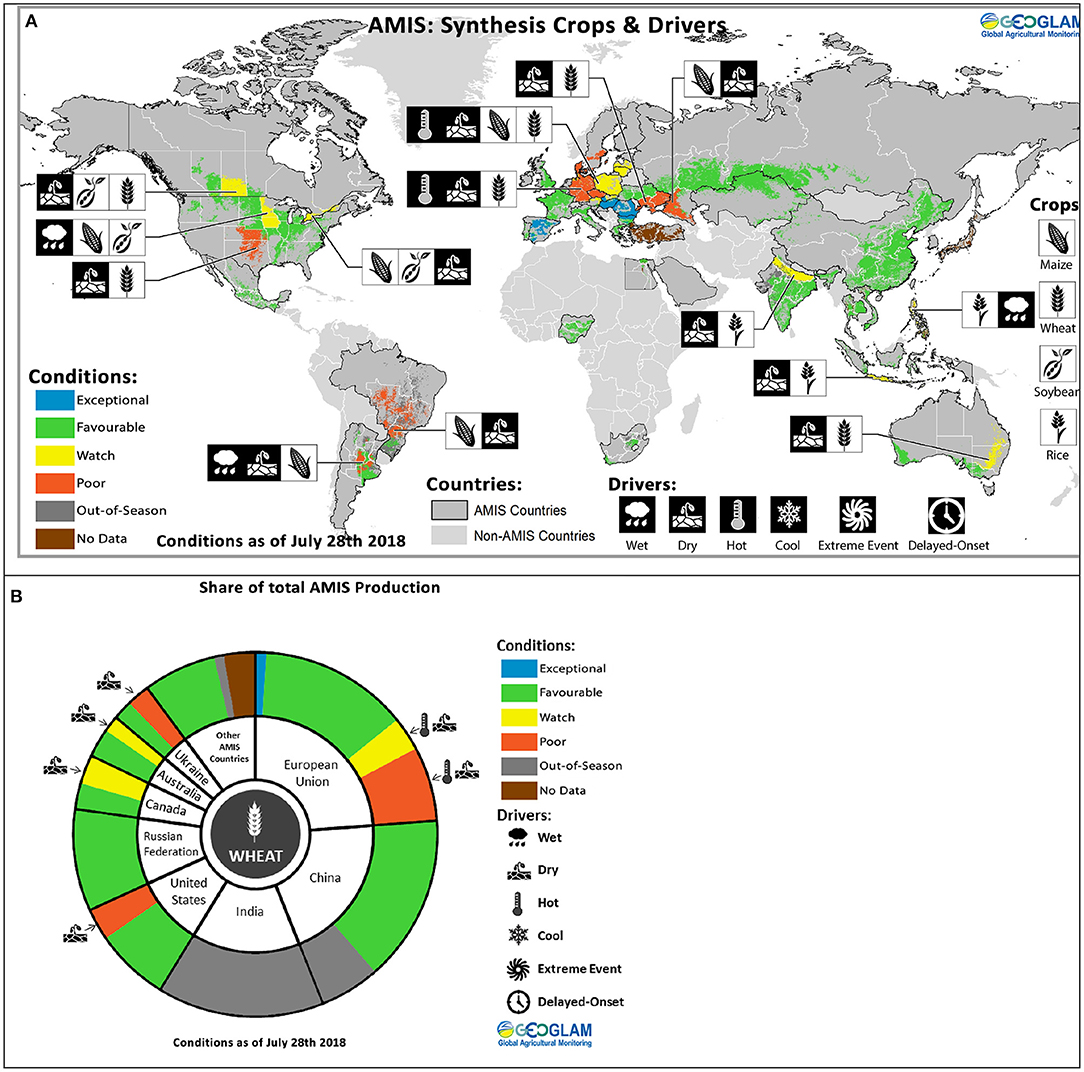
Figure 2. (A) July 2018 CM4AMIS contains maps of conditions and their associated drivers (wet, dry, hot, cold, extreme event). (B) Pie charts show conditions of specific crops, e.g., July 2018 wheat, by share of global production and global exports.
In 2016, building on the utility and impact of the CM4AMIS, GEOGLAM launched the Crop Monitor for Early Warning (CM4EW) with the early warning community, including Famine Early Warning Systems Network (FEWS NET), European Commission Joint Research Centre (EC JRC), and World Food Program (WFP). The CM4EW focuses on countries at risk of food insecurity, water insecurity and their relevant crops and drivers. The CM4EW utilizes the same input data, and consideration of expert opinion and consensus as the CM4AMIS (Figures 3A,B). While expert opinion may implicitly include water and energy considerations, contributors to the CM4EW explicitly include additional drivers in their regional assessments: delayed onset of rainy season, pests and disease, and socio-political factors (see legend in Figure 3B), all of which may be influenced by water and energy availability. The CM4EW has directly resulted in several examples of policy and action to strengthen food security. The unique convening power of the GEOGLAM Crop Monitor system enabled the UN FAO, the EC JRC, the WFP, and the FEWS NET to, in February 2016, release a joint statement on the dire outlooks for food supply in southern Africa as a result of the strong 2015–2016 El Niño (UN FAO, 2016). By April 2016, USAID's Office of Food for Peace provided USD 47.2 million in emergency food assistance and the Government of Lesotho provided an additional USD 10 million to address food, water, health and sanitation needs (USAID, 2016).
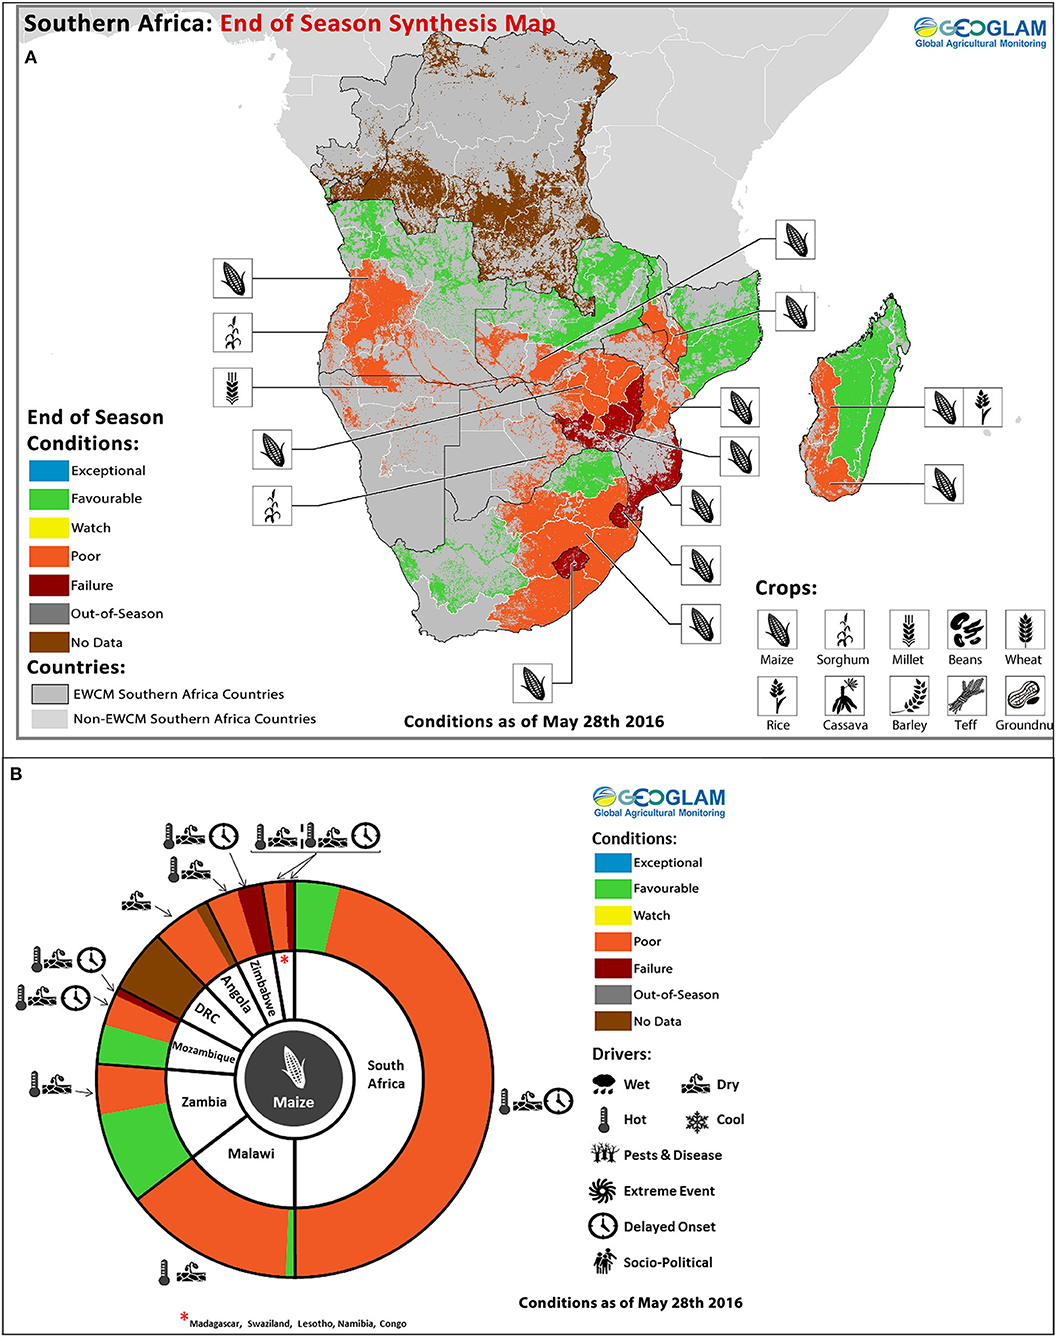
Figure 3. (A) CM4EW synthesis map for Southern Africa, May 2016. CM4EW reports contain the same information as CM4AMIS, and additionally include a “failure” condition when production is expected to be >25% below average, as well as additional drivers: delayed onset of rainy season, pests and disease, and socio-political factors. (B) Pie charts show conditions of crops, e.g., May 2016 maize, by share of national production.
Most recently, the Crop Monitor has been implemented operationally at the national level in Tanzania and Uganda, as well as Kenya and Vietnam (in development, as of June 2018). In May 2017, the CM4EW revealed Uganda was vulnerable to widespread crop failure due to drought (Uganda Department of Relief Disaster Preparedness, and Management, 2017). This information was used to trigger USD 4 million from the Disaster Risk Financing fund to create temporary employment and offset agricultural losses by supporting 31,386 households (~150,000 people) in Karamoja region. Early season satellite data, provided by the Crop Monitor, provided clear evidence of impending crop failure allowing policy makers to act proactively rather than reactively, as has been the case in the past (Martin Owor, Commissioner in the Office of the Prime Minister Uganda personal communication; 17 April, 2018). This end-user feedback demonstrates the value added to international food security by the EO and international consensus work that characterizes the GEOGLAM Crop Monitor.
Moving forward, the Crop Monitor will continue regional and national implementation and develop international “system of systems.” Additional efforts will investigate the use of quantitative indicators of crop conditions that consider the interlinkages between food, water, and energy systems for improved production outlooks.
Water Availability Monitoring for Food and Water Security
Remotely sensed rainfall, vegetation, soil moisture, and temperature data are critical for organizations that monitor agricultural conditions and food security (see also sections Crop Monitors for AMIS and Early Warning and Improving the USDA-FAS Soil Water Information). Until recently, however, less attention has been given to the water security dimension of food security. To address this gap in monitoring and forecasting, FEWS NET and NASA are co-developing the FEWS NET Land Data Assimilation System (FLDAS; McNally et al., 2017). FLDAS uses remotely sensed and reanalysis inputs to drive land surface (hydrologic) models, to produce a global archive of historic hydroclimate conditions as well as routine updates for monitoring current events (1982-present). These data are publicly available from NASA Goddard Earth Science Data and Information Services Center.
In addition to routine modeling, the FEWS NET team at NASA Goddard Space Flight Center's Hydrological Sciences Laboratory maps water availability for the African continent at a monthly scale, both in terms of monthly streamflow anomaly and annual water stress, i.e., streamflow per capita (Figure 4A). A novel aspect of the water stress product is that it tracks water availability in terms of volumetric water requirements for human (domestic) demands. Meanwhile, the streamflow anomaly maps contextualize current conditions in terms of the historic mean (1982–2016), which is a more traditional approach to drought monitoring.
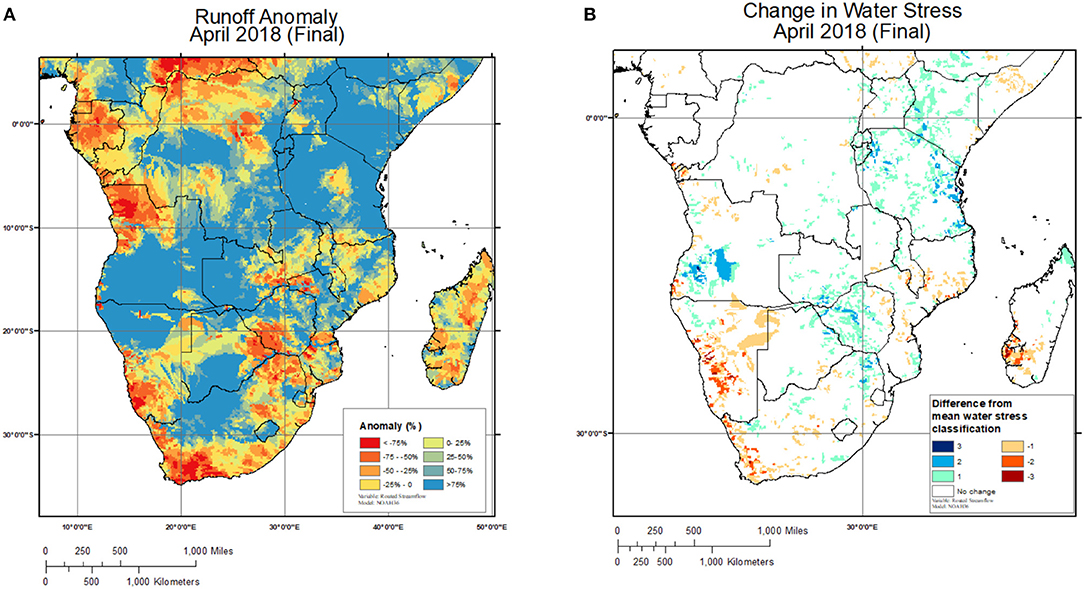
Figure 4. (A) Streamflow anomalies show surplus for much of the region, and 0–75% basin average streamflow deficits for April 2018 in Southern Madagascar. (B) Water Stress Change, based on annual Falkenmark classifications show that Southern Madagascar (and Western Cape) is 1–3 classes more stressed than a typical April. Maps updated twice a month at https://lis.gsfc.nasa.gov/projects/fewsnet-southern-africa.
To generate these maps, FLDAS total runoff drives the HYMAP2 routing scheme (Getirana et al., 2017) to produce streamflow (m3/s). The average of the routed streamflow is calculated for each Pfafstetter basin level 6 from the USGS Hydrologic Derivatives for Modeling Applications database (Verdin, 2017) and this average is converted to a volume of water per month (m3). The given month's anomalies are computed, as a percent of that month's historic mean, and shown in the “Runoff Anomaly” map (Figure 4A). Next, streamflow per capita is computed using WorldPop Africa 2015 population estimates (Linard et al., 2012), aggregated to the Pfafstetter basin level 6. Basin level monthly streamflow is then divided by basin level population estimates to derive streamflow per capita. Using the current and 11-months previous accumulation, streamflow per capita is classified per Falkenmark (1989) water supply thresholds. Finally, the difference from average class is computed for a given month and mapped (Figure 4B), highlighting locations where current and previous 11-months streamflow conditions depart from a basin's average water stress classification. Together these maps provide shorter and longer-term perspectives on water availability.
In general, these products are best used for bi-monthly monitoring and situational awareness, examples of which are in FEWS NET special reports (FEWS NET, 2015, 2016, 2017) to illustrate the severity and extent of recent droughts in sub-Saharan Africa. FLDAS outputs are well-correlated with remotely sensed ET and soil moisture (R > 0.7) (McNally et al., 2016, 2017) and accurately represented the water balance in the Blue Nile Basin, Ethiopia (Jung et al., 2017) in terms of remotely sensed ET (R = 0.9), total water storage (R = 0.86), and streamflow (R = 0.9). Given that these data are publicly available a growing body of literature is utilizing and evaluating the data (e.g., Philip et al., 2017). It should be noted that in evaluations and applications, a basin's water availability estimates may be limited by constraints related to the remotely sensed inputs and the hydrologic models. Currently, abstractions (e.g., irrigation) are not modeled which would influence the accuracy of soil moisture, ET, and streamflow estimates. The quality of the meteorological inputs is also a factor. CHIRPS precipitation, input to FLDAS, has been shown to perform well in Africa (Funk et al., 2015), but some locations that lack rain gauges may have large errors. Moreover, the operational FLDAS models (Noah36 and VIC412) represent naturalized streamflow and do not represent impoundments (e.g., dams), or groundwater, which may be important water sources for some communities. That said, adjusting the time scale of analysis does compensate for some of these shortcomings. For example, water stress based on a 12-month accumulation can capture deficits to groundwater and reservoirs.
The water stress and streamflow anomaly maps provide an example application that highlights the relationship between food and water in Southern Africa. The 1-month streamflow anomaly (Figure 4A) shows “short term” positive anomalies across much of the domain. The 12-month Stress Anomaly maps (Figure 4B) shows that these positive anomalies have increased water availability in Zimbabwe, Tanzania, and Kenya. However, this short term wetness was not enough to positively impact longer-term water availability across much of the region, particularly Southern Madagascar, the Western Cape, and Namibia, that were 1–3 classes more stressed than normal.
Well before 2018 below-average cumulative rainfall during the 2014–2015 rainy season in Southern Africa set the stage for water deficits with below average monthly rainfall and streamflow. The following year, the 2015–2016 El Niño and associated drought had a severe negative impact on agricultural outcomes across much of Southern Africa (FEWS NET, 2016), including Botswana, Swaziland, Southern Madagascar, Southern Mozambique, and the maize-triangle region of South Africa (see section Crop Monitors for AMIS and Early Warning). While more localized, the 2016–2017 rainy season registered below average rainfall for the Western Cape region (see section Improving the USDA-FAS Soil Water Information), and Southern Madagascar. The 2017–2018 season also registered below average rainfall across the region (see section Crop Monitors for AMIS and Early Warning). By June 2018, FEWS NET reported that consecutive years of below average rainfall had reduced agricultural production and incomes in several Southern Africa countries, and a Water Aid (2018) warned that water scarcity in Southern Madagascar and Southern Mozambique could reach Cape Town's feared, “Day Zero” proportions (i.e., taps run dry and people are required to queue for water).
A time series from the FLDAS archive (Figure 5) confirms that 2015–2016 was Southern Madagascar's second-worst season in the 35-year record in terms of rainfall and that annual runoff has been trending downward since 2010–2011. It is useful to look at both rainfall and runoff, given their non-linear relationship, when assessing water availability. The FEWS NET (2018a) reports “stressed” and “crisis” conditions in Southern Madagascar for the June-September 2018 and October-January 2019 period, highlighting lack of water availability for people and livestock (FEWS NET, 2018b). Contributing to this dire outlook was that as early as July 2018, El Niño conditions were forecasted for late 2018 and early 2019, increasing the likelihood for a delayed start of the rainy season (delaying crop planting), and below average rainfall totals (exacerbating water availability deficits). Working with the FEWS NET Southern Africa field scientist, these data will be used to monitor the situation and communicate in the Food Security Outlooks how local water availability relates to regional food security.
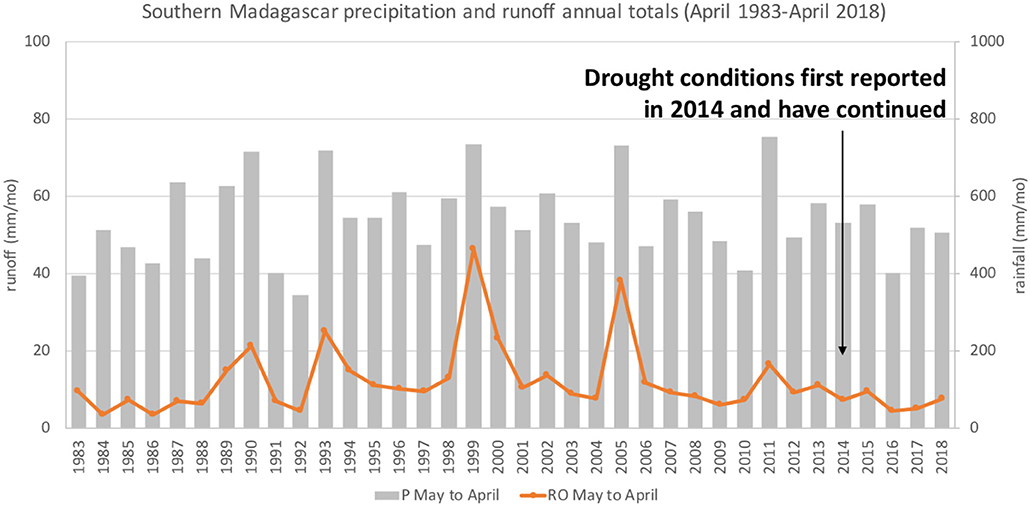
Figure 5. Twelve-month precipitation and runoff spatially averaged over the Tsihombe basin, Southern Madagascar. 2016 was the second-worst year in the 35-year record. FEWS NET reports consecutive years of below average rainfall, and water availability deficits have reduced agricultural production and incomes.
Improving the USDA-FAS Soil Water Information
The main objective of US Department of Agriculture Foreign Agricultural Service (USDA-FAS) is to provide timely information on current and expected agricultural supply and demand estimates. The water-food nexus approach is inherent, as they utilize and publicly provide information on the environmental conditions that influence agricultural supply, and combine this with other economic and policy information to produce estimates, that ultimately feedback into policy making. The USDA World Agricultural Outlook Board (WAOB) produces monthly forecasts of the global monthly crop condition assessments carefully compiled by USDA-FAS and posts to the public-facing Crop Explorer website (https://ipad.fas.usda.gov/cropexplorer/). The agency's regional and global crop yield forecasts are based on a large variety of agro-meteorological parameters and physically-based models compiled in the Crop Condition Data Retrieval and Evaluation (CADRE) Data Base Management System (DBMS). CADRE is a comprehensive geospatial database that utilizes remote sensing imagery, meteorological data, and in situ observations to produce preliminary crop condition and yield production estimates. Proper crop growth and development is largely dependent on the amount of water present in the root-zone. Therefore, a critical concern for the USDA-FAS analysts is to capture the impact of agricultural drought on crop development and health, and the resulting yield production. Since soil moisture is known to be a leading indicator of future crop conditions, the value of a robust soil moisture-based assessment within the historical climate context has proven to be critically important for the CADRE database (Bolten and Crow, 2012; Mladenova et al., 2017). The baseline soil moisture estimates in CADRE are developed using the modified two-layer Palmer model (PM), which is a water balance-based hydrologic model driven by daily precipitation data and minimum and maximum temperature observations (Palmer, 1965). PM produces global daily soil moisture estimates, whose accuracy is primarily driven by the quality of the precipitation data. This has been problematic over areas with limited gauge or poor-quality precipitation data that may not detect weather extremes. Agricultural drought, associated with the lack of water or soil saturation and floods (i.e., abundance of water), can have detrimental impact on crop growth and yield production.
To improve CADRE root-zone soil moisture estimates where there are precipitation-related errors, NASA has been working with USDA-FAS on the integration of surface soil moisture retrievals obtained using satellite-based remote sensing. The approach has been applied to the USDA-FAS Palmer model and the CADRE root-zone soil moisture information has been enhanced by the integration of soil moisture retrievals derived using observations acquired by NASA's Soil Moisture Active Passive (SMAP) mission (Entekhabi et al., 2010; Crow et al., 2012; Chan et al., 2016). SMAP's passive only retrievals are ingested into the PM using the Enhanced Kalman Filter (EnKF) technique, where the satellite-based surface soil moisture information is transferred into the models' sub-surface (i.e., root-zone) layer through a sampled error covariance matrix that reflects the error characteristics of both the model estimates and the satellite observations (Bolten et al., 2010; Han et al., 2014). The USDA-FAS crop analysts extract timely and essential information on changes in soil moisture conditions from root-zone soil moisture anomaly maps. It should be noted that in evaluations and applications, soil moisture estimates might be limited by constraints related to the remotely sensed inputs and the hydrologic model. In addition to the shortcomings in satellite precipitation mentioned earlier, microwave soil moisture retrievals have larger errors when dense vegetation is present. Meanwhile, the Palmer model is a simple water balance model that may not represent local hydrologic complexity. Despite these limitations this system has been demonstrating its utility in an operational setting.
An example of root-zone soil moisture maps developed by the SMAP-enhanced PM over South Africa are shown in Figure 6. The Western Cape, a province located in the southern part of South Africa is the country's largest wheat-growing region. Winter cereals in the area are typically planted in May and harvested in October. The Western Cape has suffered a critical drought that impacted the 2017 growing season, which has been associated with record low rainfall, high temperatures, and high evaporation rates. The decline in moisture conditions during 2017 (Figure 6) would cause 29% reduction in wheat yield relative to the previous year based on the USDA-FAS reported estimates published in February 2018 (U. S. Department of Agriculture - Foreign Agricultural Service, 2018) This would consequently have a large impact on food security, social well-being, and loss of income in the area, the management of which would require financial investments and socio-economic support.
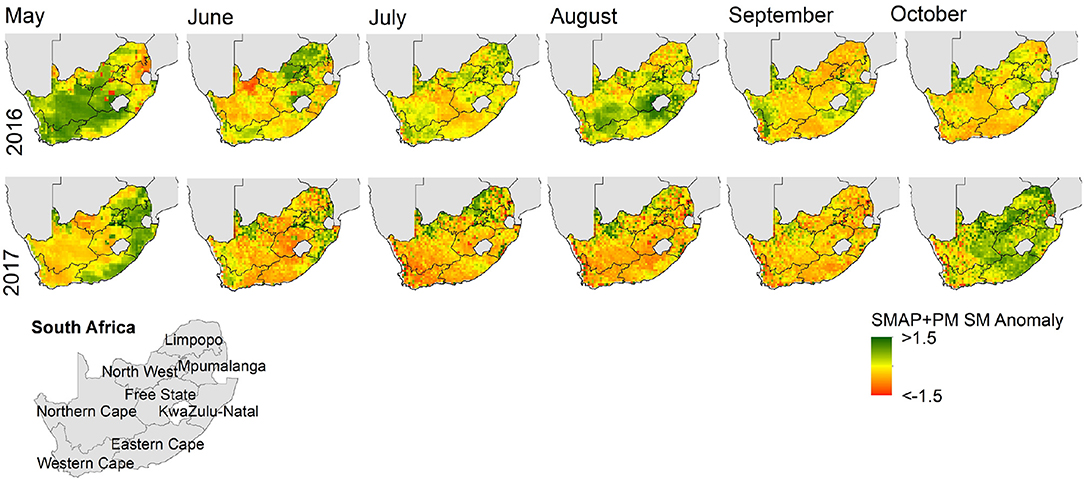
Figure 6. Monthly root-zone soil moisture anomaly conditions over South Africa during the 2016 and 2017 growing seasons (May–October). Each value shows the deviation of the current conditions relative to the long-term average standardized by the climatological standard deviation. Negative values indicate that the current conditions are below average, while positive indicate surplus of water.
Throughout the process, USDA-FAS has worked with NASA to identify the problem (rainfall errors), and develop a solution to meet analyst needs. The careful integration of near real-time satellite-based soil moisture observations into the USDA decision support system allows USDA-FAS analysts to compare current soil moisture and crop conditions and develop a more comprehensive assessment of expected agricultural yield in many areas of the world that currently lack adequate ground-based observations. The continued partnership allows NASA remotely sensed soil moisture to be transformed into useable knowledge while USDA-FAS will continue to benefit from ongoing improvements related to NASA EO.
Modeling Agricultural Impacts Across Time Horizons
In addition to providing estimates of water availability and soil moisture, EO can be linked with biophysical and socioeconomic agricultural modeling frameworks that elucidate historical, current, and future challenges in the water-food nexus. To accomplish this, NASA scientists launched the Agricultural Model Intercomparison and Improvement Project (AgMIP) in 2010 to provide enhanced community organization around systematic intercomparison and stakeholder-driven applications of agricultural models to address food security (Rosenzweig et al., 2013). AgMIP's global community utilizes climate, crop, livestock, economics, and nutrition models to understand interactions between biophysical and socioeconomic systems, dependencies across local and global markets, and the shifting nature of impacts and risk across time horizons. The result is a series of models and tools that may be applied individually or as part of AgMIP's Coordinated Global and Regional Assessments (CGRA), a multi-discipline, multi-scale, multi-model, and multi-institution framework to address major challenges in adaptation, mitigation, food security, and food policy.
NASA observational products provide a critical foundation for modeling agricultural systems, as these assessments are rooted in the distillation of historical climate information and the creation of future climate change projections. The need for a consistent historical climate record led to the development of an agricultural modeling-oriented version of the NASA Modern Era Retrospective-analysis for Research and Applications (AgMERRA; Ruane et al., 2015). And to assess future conditions AgMIP models utilizes climate scenarios derived from the ensemble of Earth system models (ESMs) contributed to the Coupled Model Intercomparison Project with CMIP (Taylor et al., 2011; Eyring et al., 2015) and the NASA Goddard Institute for Space Studies Model-E (Schmidt et al., 2014). The application of global process-based crop models sheds light on strong differences in crop production and vulnerability across regions and farming systems. For example, the parallel Decision Support System for Agrotechnology Transfer (pDSSAT) model (Elliott et al., 2014) was used to simulate global, spatially distributed yield response to a 20% reduction in precipitation (Figure 7). A majority of pixels, with at least 10 hectares of rainfall maize, experience 0–30% loss in yields with 20% reduction in precipitation (brown colors, Figure 7). There are however, some areas with positive response to rainfall reduction, particularly in the wettest portions of the humid tropics (portions of the Brazilian interior, Bangladesh, and parts of the Congo Basin). These locations have plentiful water and therefore have sufficient amounts even with a substantial (20%) reduction, and the lower precipitation levels also have reduced runoff, fertilizer leaching, and soil erosion, which can have a slight benefit for yields. This type of information, generated as part of AgMIP's Global Gridded Crop Model Intercomparison (GGCMI phase 2; Elliott et al., 2015), motivates stakeholder interventions to increase resilience and reduce food security risks. Similar to previous case studies, we acknowledge there are sources of uncertainty from remotely sensed inputs or hydrologic parameters. Additional uncertainty is introduced in the modeling of crop yields, which requires information on crop parameters and farm management practices. Over time, and with partner cooperation, accuracy of these inputs will improve, but some error will remain. That said, water-food nexus stakeholders can still benefit from the exploration of future scenarios.
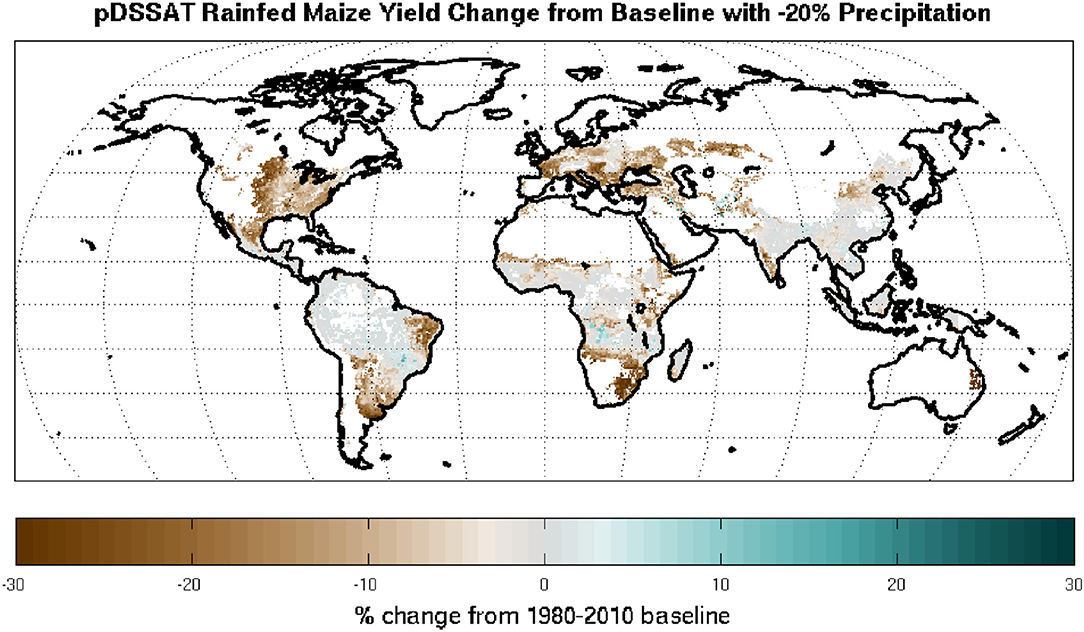
Figure 7. Example of process-based crop model response map that motivates global and regional interventions. Rainfed maize yield response to a 20% reduction in precipitation, as simulated by the pDSSAT crop model as part of AgMIP's Global Gridded Crop Model Intercomparison. Note that only grid cells are shown where current rainfed maize production is at least 10 hectares according to the Spatial Production Allocation Model (SPAM2005) database (You et al., 2014).
The process-based crop modeling community fostered by AgMIP provides an important perspective to stakeholder-oriented applications for food security and the water-food nexus. Stakeholders need information and understanding of agricultural systems across a continuum of time horizons (Table 1). Agricultural sector stakeholders are under high pressure to maintain high awareness of present field conditions and seek an improved understanding of past years' crops (e.g., farmers, disaster risk reduction community, commodities traders). Near term outlooks are important for an early indication of seasonal production and water consumption and the long-term outlooks help to manage complex risks, anticipate emerging opportunities, and ensure the viability of current resources and long-term investments.
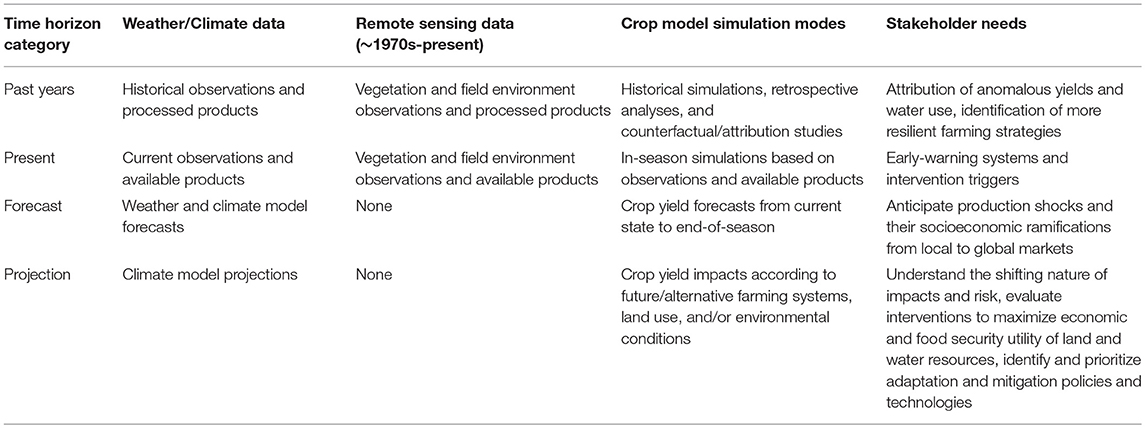
Table 1. Observational and physical model sources of information to drive crop models across a continuum of stakeholder-relevant time horizons.
Two cases exemplify the utility of AgMIP approaches for stakeholders. First, AgMIP partnered with the UK Department for International Development to assess the intertwining influences of socioeconomic development, climate change, and technological adaptation for vulnerable farming systems across 15 countries in sub-Saharan Africa and South Asia (Rosenzweig and Hillel, 2015). AgMIP partners worked closely with local stakeholders (regional and national ministries, development agencies, non-governmental organizations, farmers groups, and farm supply companies) to co-develop representative agricultural pathways (RAPs; Valdivia et al., 2015) indicating likely socioeconomic conditions that would shape future farming systems. While RAPs varied by location common themes included decreasing water availability, degradation of soils, and increasing use of fertilizers. Next, RAPs were evaluated for how global price changes and local climate shifts would create divergent impacts on regional households. In the case of Bethlehem, South Africa (Beletse et al., 2014) climate change scenarios predicted yield losses and associated revenue losses of 3–27% per farm. However, adaptation scenarios that included advancements in agricultural technology (e.g., improved seeds and fertilizers) increased yields 13–22% and decreased poverty 12–22%.
These results elucidate the potential for different adaptation and policy decisions to increase resilience and the likelihood of positive outcomes. The identification of agricultural technology advancement may lead to prioritization for further investment (often as elements of ongoing development investment or national adaptation and mitigation planning).
Second, AgMIP applied its CGRA process in response to the UN Framework Convention on Climate Change's request for information on the adaptation and mitigation costs related to global warming of 1.5 or 2.0°C above pre-industrial conditions (Rosenzweig et al., 2018). Results from 31 CMIP5 climate models, 5 additional GCMs that performed new 1.5 and 2.0°C stabilization simulations, 3 global crop models, 2 economic models, and regional case studies utilizing local crop and regional economics models elucidated the biophysical and socioeconomic impacts across farming systems and global markets (Ruane et al., 2018a,b). While results varied by region, in general, tropical maize yields declined and prices increased while soy yields increased, and prices decreased. Both maize and wheat cropping areas expanded while soy area planted decreased.
Results also quantified potential opportunities for farmers from mitigation-oriented subsidies (Antle et al., 2018). In one scenario, US Pacific Northwest wheat farmers could receive compensation for greenhouse gas mitigation via reducing soil emissions of greenhouse gasses and increasing production of biofuel crops. This policy strategy would offset the loss of income related to climate change and contribute to reduction in greenhouse gases. Consistently-linked simulations and scenarios also allowed for an unprecedented examination of uncertainty in projected impacts on local and global food systems (Ruane et al., 2018b), the shifting nature of extreme events (Schleussner et al., 2018), and effects on small-holder systems in West Africa (Faye et al., 2018).
Summary and Conclusions
These case studies demonstrate how EO are being used to assess water and food security outcomes, and designed to meet needs of analysts who work within larger decision-making contexts related to the water-food nexus. These projects work closely with stakeholders to ensure that current and future products support relevant decision-making. To summarize:
(1) GEOGLAM formed in response to a demand from G20 to provide agricultural relevant information from EO. Within this broader context, national and regional experts convene to reach consensus regarding the interpretation of EO and agricultural outcomes. Evaluations of requirements and EO's capability to meet them is an ongoing process undertaken in the broader GEOGLAM context (Whitcraft et al., 2015b). From initial success and lessons learned, this framework has been adapted to meet new demands from new partners including the Crop Monitor for Early Warning and National Level monitors. For example, new efforts will incorporate new EO that better represent irrigation, which is a requirement for addressing the food-water-energy nexus.
(2) The FEWS NET Land Data Assimilation System (FLDAS) and associated water stress products were developed in response to demand from USAID and FEWS NET to address the linkage between food security and water availability. These data are used within the broader context of food access, utilization, and stability. There is ongoing feedback and learning from partner scientists regarding how to best communicate the relationship between water availability, food security, and the water-food nexus.
(3) USDA-FAS soil water modeling was developed in response to demand from USDA-FAS to address errors in near real-time satellite derived precipitation products. These data are used in the broader context improving US agriculture export opportunities and global food security. Success can be attributed to, and lesson's learned from NASA scientist's willingness to work within the USDA system to easily meet FAS analysts' needs, as well as providing support as technology advances (e.g., SMOS to SMAP, and SMAP improvements in spatial resolution and latency). This partnership allows for the co-production of state-of-the-art, usable soil moisture information.
(4) AgMIP developed an assessment of vulnerable farming systems to meet the needs of the UK Department for International Development and UN Framework Convention on Climate Change's request for information on the adaptation and mitigation costs related to global warming. These cases fit within AgMIP's broader context of providing enhanced community organization around systematic intercomparison and stakeholder-driven applications of agricultural models to address food security. Moreover, AgMIP's global network of agricultural specialists that inform modeling efforts improve the quality and legitimacy of project results.
A commonality across these case studies is that they are all constrained by EO capabilities and uncertainties. With these constraints, EO data producers are transparent about what the models represent (e.g., natural streamflow vs. streamflow subject to impoundments and abstractions), model uncertainties (from model physics, parameters, and quality of inputs) and accuracy of remotely sensed products. For example, the accuracy of rainfall estimates may be contingent upon the extent to which satellite products have been calibrated to ground-based observations and the spatial distribution of these observations. Additional uncertainty is introduced when future climate scenarios are coupled with hydrologic and crop models.
Even with continuous improvements in EO to reduce these uncertainties, decision support is constrained by end-users' ability to recognize shortcomings in the data products and apply the information appropriately. What is an analyst's capacity for understanding of EO uncertainty, rather than accepting outputs from a “black-box”? And how well can analysts incorporate additional sources of information to answer lingering questions? For example, the USDA and FEWS NET hydrologic models do not include dynamic representation of cropping systems that would both depend on and determine water supplies, which are important considerations in the water-food nexus. Nor do these models represent irrigation or inter-basin water transfers, which can be energy intensive water supply mechanisms. GEOGLAM and FEWS NET analysts address some these limitations by incorporating additional sources of information via a convergence of evidence approach that considers information from remotely sensed soil moisture, evapotranspiration, and vegetation products that have been shown to detect the presence of irrigated agriculture (Senay et al., 2007; Lawston et al., 2017). In all instances, strong relationships and trust between EO data producers and end-users, described in this paper, are essential to compensate for uncertainties in EO and devise strategies to provide the best possible decision support.
Actionable Recommendations
These case studies demonstrate the value of NASA Earth science data through applications activities and are key examples of translating satellite data into actionable information and knowledge used to inform policy and enhance decision-making. One of the key lessons learned from these case studies is that given the complexity of problems that span the water-food nexus the partnerships between EO producers and end-users is critical for ensuring that EO data is applied appropriately to maximize its utility for decision support. Given these experiences we make the following actionable recommendations for other researchers (or applied science managers) interested in producing information for addressing the water-food nexus, and sustainable development policy guided by the literature on the co-development of useable knowledge for sustainability. We frame these recommendations in the context of NASA applied science programs; however, they are relevant to any organization and program that provides strategic guidance on food-water-energy projects.
First, during the “proof-of-concept” phase, specific applications need to be matched with methods and models that are appropriate given data availability, application time scale, delivery schedule, and requirement for precision (i.e., different approaches used to monitor global market impacts vs. identify field adaptation vs. assess long-term agricultural outlooks). NASA coordination can help more rapidly match science and decision context. Also during this phase, facilitated collaboration across NASA models, missions, and methods will build more robust applications, more rapidly characterize uncertainties, and ensure consistency in the downstream use of NASA products. For example, AgMIP is on the cutting edge of mechanistic modeling of both the biophysical and socioeconomic system that is a fertile ground of innovation for the case studies mentioned here, as well as other agricultural applications. NASA applied sciences could facilitate the integration of these systems to demonstrate proof-of-concept to existing and new end-users.
Second, stakeholder demand and engagement is key. Repeated interaction and iterative co-development of tools and information products build trust, understanding, and utility in application. If you have successfully moved from the “proof-of-concept” stage to engaging an end-user, listening and responding to their needs is critical: answer their specific questions, accept input from their experts, use their models/indices, provide products that analysts are familiar with, or can easily interpret, and provide trainings on new, potentially less intuitive products. This will ensure that you are producing “usable knowledge.”
Finally, products (data, images, reports) need to be publicly available and follow guidelines for data sharing. Interactive user interfaces and web-pages that provide both graphics and data (e.g., PNG and GeoTIFF) can primarily support project needs as well provided content for the broader water-food nexus community. Following these guidelines has resulted in collaboration between FEWS NET, USDA-FAS, GEOGLAM, and AgMIP. Moreover, publicly available FLDAS estimates of the full water and energy balance (1982-present), being used by academic researchers (e.g., Philip et al., 2017) can provide important, useable insights to climate change, trends, and extremes. In addition to data and maps these projects provide a variety of reports online that can help others examine different facets of historic droughts. The strength of the data and products comes from close collaboration with specific end-users, while sharing the results in a useable way meets the important task of producing information for addressing the water-food nexus, and sustainable development policy.
These recommendations are directly applicable to better incorporate the role of energy availability and sustainability into water and food security applications, and better address the food-water-energy nexus. Additional research and “proof of concept” development that is led by or includes water-food applications scientists will need to devote effort to presenting new products and communicating research to potential end-users. Communicating these new efforts in a way that resonates with end-users may be an iterative process. Ultimately, moving “proof-of-concept” products into active decision support will require demand from end-users, and their commitment to a nexus approach to food-water-energy security and sustainability.
Author Contributions
AM, SM, and AR contributed the concept and writing. AW and IM contributed to writing. JB, IM, CR, AR, IB-R, AW, CP-L, and AM designed respective projects in the case studies. SU reviewed the manuscript.
Funding
NASA Applied Sciences, FEWS NET's Participating Agency Program Agreement for NASA Water Availability Monitoring (AID-FFP-T-17-00001). NASA Harvest food security consortium (NASA NNH16ZDA001N-FSAC Grant No: 80NSSC17K0625).
Conflict of Interest Statement
The authors declare that the research was conducted in the absence of any commercial or financial relationships that could be construed as a potential conflict of interest.
Acknowledgments
We appreciate the assistance of Amanda Evengaard and Meridel Phillips in figure creation (NASA GISS); Brian Barker for provision of figures (UMD); Kristine Verdin (NASA GSFC) for figure creation and Tamuka Magadzire (FEWS NET) for feedback.
Abbreviations
AgMIP, Agricultural Model Intercomparison and Improvement Project; AMIS, Agricultural Market Information System; CADRE, Crop Condition Data Retrieval and Evaluation database; CGRA, Coordinated Global and Regional Assessments; CM4AMIS, Crop Monitor for AMIS; CM4EW, Crop Monitor for Early Warning; CMIP, Coupled Model Intercomparison Project; EC JRC, European Commission Joint Research Centre; ECMWF, European Centre for Medium-Range Weather Forecasts; EO, Earth observations; ESA, European Space Agency; FAO, UN Food and Agriculture Organization; FAS, Foreign Agriculture Service; FEWS NET, Famine Early Warning Systems Network; FLDAS, FEWS NET Land Data Assimilation System; G20, Group of Twenty - 19 countries and the European Union; GEO, Group on Earth Observations; GEOSS, Global Earth Observation System of Systems; GEOGLAM, GEO Global Agricultural Monitoring; GEOGLOWS, GEO Global Water Sustainability; GLAM, Global Agricultural Monitoring; MODIS, Moderate Resolution Imaging Spectrometer; NASA, National Aeronautics and Space Administration; NCEP, NOAA National Center for Environmental Prediction; NDVI, Normalized Difference Vegetation Index; NOAA, National Oceanic and Atmospheric Administration; PM, Palmer Model; RAPs, Representative Agricultural Pathways; SDGs, Sustainable Development Goals; SMAP, Soil Moisture Active Passive; SMOS, Soil Moisture Ocean Salinity; USDA, US Department of Agriculture; USGS, US Geological Survey; W-E-F, Water Energy Food; WFP, World Food Program; USAID, US Agency for International Development; UN, United Nations.
References
Alauddin, M., and Quiggin, J. (2008). Agricultural intensification, irrigation and the environment in South Asia: issues and policy options. Ecol. Econ. 65, 111–124. doi: 10.1016/j.ecolecon.2007.06.004
Anderson, M. C., Hain, C., Wardlow, B., Pimstein, A., Mecikalski, J. R., and Kustas, W. P. (2010). Evaluation of drought indices based on thermal remote sensing of evapotranspiration over the continental United States. J. Clim. 24, 2025–2044. doi: 10.1175/2010JCLI3812.1
Anderson, M. C., Norman, J. M., Mecikalski, J. R., Otkin, J. A., and Kustas, W. P. (2007). A climatological study of evapotranspiration and moisture stress across the continental United States based on thermal remote sensing: 1. Model formulation. J. Geophys. Res. 112:D10117. doi: 10.1029/2006JD007506
Antle, J. M., Cho, S., Tabatabaie, S. M. H., and Valdivia, R. O. (2018). Economic and environmental performance of dryland wheat-based farming systems in a 1.5 °C world. Mitig. Adapt. Strateg. Glob. Change 24, 165–180. doi: 10.1007/s11027-018-9804-1
Anyamba, A., and Tucker, C. (2012). “Historical perspectives on AVHRR NDVI and vegetation drought monitoring,” in Remote Sensing of Drought: Innovative Monitoring Approaches, eds B. D. Wardlow, M. C. Anderson, and J. P. Verdin (Boca Raton, FL: CRC Press).
Bartalis, Z., Kidd, R., and Scipal, K. (2006). Bartalis, Z., Kidd, R., and Scipal, K. (2006). “Development and implementation of a discrete global grid system for soil moisture retrieval using the metop ascat scatterometer,” in Proceedings of the 1st EPS/MetOp RAO Workshop, (Frascati: ESA).
Becker-Reshef, I., Justice, C., Sullivan, M., Vermote, E., Tucker, C., Anyamba, A., et al. (2010). Monitoring global croplands with coarse resolution earth observations: the global agriculture monitoring (GLAM) project. Remote Sens. 2, 1589–1609. doi: 10.3390/rs2061589
Beletse, Y. G., Durand, W., Nhemachena, C., Crespo, O., Tesfuhuney, W. A., Jones, M. R., et al. (2014). “Projected impacts of climate change scenarios on the production of maize in Southern Africa: an integrated assessment case study of the bethlehem district, central free state, South Africa,” in Handbook of Climate Change and Agroecosystems, Series on Climate Change Impacts, Adaptation, and Mitigation ed R. Hillel (London: Imperial College Press), 125–157.
Berrisford, P., Dee, D. P., Poli, P., Brugge, R., Fielding, K., Fuentes, M., et al. (2011). The ERA-Interim archive Version 2.0, ERA Report Series. ERA Report Series, Shinfield Park, Reading.
Bolten, J. D., and Crow, W. T. (2012). Improved prediction of quasi-global vegetation conditions using remotely-sensed surface soil moisture. Geophys. Res. Lett. 39:19406. doi: 10.1029/2012GL053470
Bolten, J. D., Crow, W. T., Zhan, X., Jackson, T. J., and Reynolds, C. A. (2010). Evaluating the utility of remotely sensed soil moisture retrievals for operational agricultural drought monitoring. IEEE J. Select. Topics Appl. Earth Observ. Remote Sens. 3, 57–66. doi: 10.1109/JSTARS.2009.2037163
Bréon, F.-M., and Vermote, E. (2012). Correction of MODIS surface reflectance time series for BRDF effects. Remote Sens. Environ. 125, 1–9. doi: 10.1016/j.rse.2012.06.025
Brown, M. E., and Escobar, V. M. (2014). Assessment of soil moisture data requirements by the potential SMAP data user community: review of SMAP mission user community. IEEE. J. Selec. Topics Appl. Earth Observ. Remote Sens. 7, 277–283. doi: 10.1109/JSTARS.2013.2261473
Brown, M. E., Escobar, V. M., Aschbacher, J., Milagro-Pérez, M. P., Doorn, B., Macauley, M. K., et al. (2013). Policy for robust space-based earth science, technology and applications. Space Policy 29, 76–82. doi: 10.1016/j.spacepol.2012.11.007
Chan, S. T. K., Bindlish, R., O'Neill, P., Njoku, E. G., Jackson, T. J., Colliander, A., et al. (2016). Assessment of the SMAP Passive Soil Moisture Product [WWW Document]. Undefined. Avaliable online at: paper/Assessment-of-the-SMAP-Passive-Soil-Moisture-Chan-Bindlish/9f206a2b251d6c26de051480fc2ca5d57afb8bf0 (Accessed August 17, 2018).
Clark, W. C., Kerkhoff, L., van Lebel, L., and Gallopin, G. C. (2016). Crafting usable knowledge for sustainable development. Proc. Natl. Acad. Sci. U.S.A. 113, 4570–4578. doi: 10.1073/pnas.1601266113
Claverie, M., Ju, J., Masek, J. G., Dungan, J. L., Vermote, E. F., Roger, J.-C., et al. (2018). The harmonized landsat and sentinel-2 surface reflectance data set. Remote Sens. Environ. 219, 145–161. doi: 10.1016/j.rse.2018.09.002
Clay, J. (2004). World Agriculture and the Environment: A Commodity-by-Commodity Guide to Impacts and Practices. Island Press.
Crow, W. T., Kumar, S. V., and Bolten, J. D. (2012). On the utility of land surface models for agricultural drought monitoring. Hydrol. Earth Syst. Sci. 16, 3451–3460. doi: 10.5194/hess-16-3451-2012
Dee, D. P., Uppala, S. M., Simmons, A. J., Berrisford, P., Poli, P., Kobayashi, S., et al. (2011). The ERA-interim reanalysis: configuration and performance of the data assimilation system. Q. J. R. Meteorol. Soc. 137, 553–597. doi: 10.1002/qj.828
Elliott, J., Kelly, D., Chryssanthacopoulos, J., Glotter, M., Jhunjhnuwala, K., Best, N., et al. (2014). The parallel system for integrating impact models and sectors (pSIMS). Environ. Model. Software 62, 509–516. doi: 10.1016/j.envsoft.2014.04.008
Elliott, J., Müller, C., Deryng, D., Chryssanthacopoulos, J., Boote, K. J., Büchner, M., et al. (2015). The global gridded crop model intercomparison: data and modeling protocols for phase 1 (v1.0). Geosci. Model Dev. 8, 261–277. doi: 10.5194/gmd-8-261-2015
Endo, A., Tsurita, I., Burnett, K., and Orencio, P. M. (2017). A review of the current state of research on the water, energy, and food nexus. J. Hydrol. Region. Stud. 11, 20–30. doi: 10.1016/j.ejrh.2015.11.010
Entekhabi, D., Njoku, E. G., O'Neill, P. E., Kellogg, K. H., Crow, W. T., Edelstein, W. N., et al. (2010). The soil moisture active passive (SMAP) mission. Proc. IEEE 98, 704–716. doi: 10.1109/JPROC.2010.2043918
Eyring, V., Bony, S., Meehl, G. A., Senior, C. A., Stevens, B., Stouffer, R. J., et al. (2015). Overview of the coupled model intercomparison project phase 6 (CMIP6) experimental design and organization. Geosci. Model Dev. 9, 1937–1958. doi: 10.5194/gmd-9-1937-2016
Falkenmark, M. (1989). The massive water scarcity now threatening africa: why isn't it being addressed? Ambio 18, 112–118.
Faye, B., Webber, H., Naab, J. B., MacCarthy, D. S., Adam, M., Ewert, F., et al. (2018). Impacts of 1.5 versus 2.0°C on cereal yields in the West African Sudan Savanna. Environ. Res. Lett. 13:034014. doi: 10.1088/1748-9326/aaab40
FEWS NET (2015). Illustrating the Extent and Severity of the 2015 Drought - Ethiopia Special Report [WWW Document]. Avaiable onlie at: https://fews.net/sites/default/files/documents/reports/FEWS%20NET_Ethiopia%202015%20Drought%20Map%20Book_20151217_0.pdf (Accessed Augest 21, 2018).
FEWS NET (2016). Illustrating the Extent and Severity Of The 2015-16 Drought [WWW Document]. Available online at: https://fews.net/sites/default/files/documents/reports/FEWS%20NET_Southern%20Africa%202015_16%20Drought%20Map%20Book_20160318_0.pdf (Accessed August 21, 2018).
FEWS NET (2017). Illustrating the Extent and Severity of the 2016/17 Horn of Africa drought - East Africa Special Report [WWW Document]. Available online at: https://fews.net/sites/default/files/documents/reports/FEWS_NET_Horn_of_Africa_June%202017_Drought_Map_Book.pdf (Accessed August 22, 2018).
FEWS NET (2018a). Southern Africa - Food Security Outlook: 2018-06-30 to Thu, 2019-01-31 [WWW Document]. Available online at: http://fews.net/southern-africa/food-security-outlook/july-2018 (Accessed August 17, 2018).
FEWS NET (2018b). Madagascar Food Security Outlook December 2018 to May 2019 Humanitarian Assistance to Ease Emergency (IPC Phase 4) in Beloha District in January 2019 [WWW Document]. Madagasacar. Available online at: http://fews.net/sites/default/files/documents/reports/Madagascar_Outlook_Dec2018_Final.pdf (Accessed January 31, 2019).
Funk, C., Peterson, P., Landsfeld, M., Pedreros, D., Verdin, J., Shukla, S., et al. (2015). The climate hazards infrared precipitation with stations—a new environmental record for monitoring extremes. Sci. Data 2:150066. doi: 10.1038/sdata.2015.66
GEO (2005). Global Earth Observation System of Systems (GEOSS): 10-Year Implementation Plan, Document Library - Earth Online. ESA.
GEO (2016). 2017-2019 GEO Work Programme [WWW Document]. Available online at: https://www.earthobservations.org/documents/geo_xiv/GEO-XIV-5-4_2017-2019%20GEO%20Work%20Programme.pdf (Accessed August 20, 2018).
Getirana, A., Peters-Lidard, C., Rodell, M., and Bates, P. D. (2017). Trade-off between cost and accuracy in large-scale surface water dynamic modeling. Water Resour. Res. 53, 4942–4955. doi: 10.1002/2017WR020519
Han, E., Crow, W. T., Holmes, T., and Bolten, J. (2014). Benchmarking a soil moisture data assimilation system for agricultural drought monitoring. J. Hydrometeor. 15, 1117–1134. doi: 10.1175/JHM-D-13-0125.1
Hoff, H. (2011). “Understanding the nexus: background paper for the conference: the water, energy and food security nexus,” in Presented at the Bonn 2011 Nexus, Stockholm Environment Institute (Stockholm), 51. Available online at: http://hdl.handle.net/20.500.11822/19068
Jung, H. C., Getirana, A., Policelli, F., McNally, A., Arsenault, K. R., Kumar, S., et al. (2017). Upper blue nile basin water budget from a multi-model perspective. J. Hydrol. 555, 535–546. doi: 10.1016/j.jhydrol.2017.10.040
Kanamitsu, M., Ebisuzaki, W., Woollen, J., Yang, S.-K., Hnilo, J. J., Fiorino, M., et al. (2002). NCEP–DOE AMIP-II Reanalysis (R-2). Bull. Amer. Meteorol. Soc. 83, 1631–1644. doi: 10.1175/BAMS-83-11-1631
Kerr, Y. H., Waldteufel, P., Richaume, P., Wigneron, J. P., Ferrazzoli, P., Mahmoodi, A., et al. (2012). The SMOS soil moisture retrieval algorithm. IEEE Trans. Geosci. Remote Sens. 50, 1384–1403. doi: 10.1109/TGRS.2012.2184548
Kistler, R., Kalnay, E., Collins, W., Saha, S., White, G., Woollen, J., et al. (2001). The NCEP–NCAR 50-year reanalysis: monthly means CD-ROM and documentation. Bull. Amer. Meteorol. Soc. 82, 247–268. doi: 10.1175/1520-0477(2001)082<0247:TNNYRM>2.3.CO;2
Kumar, S. V., Peters-Lidard, C. D., Tian, Y., Houser, P. R., Geiger, J., Olden, S., et al. (2006). Land information system: an interoperable framework for high resolution land surface modeling. Environ. Model. Softw. 21, 1402–1415. doi: 10.1016/j.envsoft.2005.07.004
Lawford, R., Strauch, A., Toll, D., Fekete, B., and Cripe, D. (2013). Earth observations for global water security. Curr. Opin. Environ. Sustain. 5, 633–643. doi: 10.1016/j.cosust.2013.11.009
Lawston, P. M., Santanello, J. A., and Kumar, S. V. (2017). Irrigation signals detected from SMAP soil moisture retrievals. Geophys. Res. Lett. 44, 11860–11867. doi: 10.1002/2017GL075733
Leslie, C. R., Serbina, L. O., and Miller, H. M. (2017). Landsat and Agriculture—Case Studies on the Uses and Benefits of Landsat Imagery in Agricultural Monitoring and Production (USGS Numbered Series No. 2017–1034). Open-File Report. U.S. Geological Survey, Reston, VA.
Linard, C., Gilbert, M., Snow, R. W., Noor, A. M., and Tatem, A. J. (2012). Population distribution, settlement patterns and accessibility across Africa in 2010. PLoS ONE 7:e31743. doi: 10.1371/journal.pone.0031743
Matricardi, M., Chevallier, F., Kelly, G., and Thépaut, J.-N. (2004). An improved general fast radiative transfer model for the assimilation of radiance observations. Q. J. R. Meteorol. Soc. 130, 153–173. doi: 10.1256/qj.02.181
McNally, A., Arsenault, K., Kumar, S., Shukla, S., Peterson, P., Wang, S., et al. (2017). A land data assimilation system for sub-Saharan Africa food and water security applications. Sci. Data Lond. 4:170012. doi: 10.1038/sdata.2017.12
McNally, A., Shukla, S., Arsenault, K. R., Wang, S., Peters-Lidard, C. D., and Verdin, J. P. (2016). Evaluating ESA CCI soil moisture in East Africa. Int. J. Appl. Earth Observ. Geoinform. 48, 96–109. doi: 10.1016/j.jag.2016.01.001
Mladenova, I. E., Bolten, J. D., Crow, W. T., Anderson, M. C., Hain, C. R., Johnson, D. M., et al. (2017). Intercomparison of soil moisture, evaporative stress, and vegetation indices for estimating corn and soybean yields over the U.S. IEEE J. Select. Top. Appl. Earth Observ. Remote Sens. 10, 1328–1343. doi: 10.1109/JSTARS.2016.2639338
Naeimi, V., Scipal, K., Bartalis, Z., Hasenauer, S., and Wagner, W. (2009). An improved soil moisture retrieval algorithm for ERS and METOP scatterometer observations. IEEE Trans. Geosci. Remote Sens. 47, 1999–2013. doi: 10.1109/TGRS.2008.2011617
Palmer, W. (1965). Meteorological Drought (U.S. Research Paper No. 45). Washington, DC: US Weather Bureau.
Parihar, S., Justice, C., Soares, J., Leo, O., Kosuth, P., Jarvis, I., et al. (2012). “GEO-GLAM: a GEOSS-G20 initiative on global agricultural monitoring,” in Presented at the 39th COSPAR Scientific Assembly (Mysore), 1451.
Philip, S., Kew, S. F., Jan van Oldenborgh, G., Otto, F., O'Keefe, S., Haustein, K., et al. (2017). Attribution analysis of the ethiopian drought of 2015. J. Clim. 31, 2465–2486. doi: 10.1175/JCLI-D-17-0274.1
Rasul, G., and Sharma, B. (2016). The nexus approach to water–energy–food security: an option for adaptation to climate change. Clim. Pol. 16, 682–702. doi: 10.1080/14693062.2015.1029865
Reichle, R. H., Crow, W. T., and Keppenne, C. L. (2008). An adaptive ensemble Kalman filter for soil moisture data assimilation. Water Resour. Res. 44:W03423. doi: 10.1029/2007WR006357
Rienecker, M., Suarez, M., Todling, R., Bacmeister, J., Takacs, L., Liu, H., et al. (2008). The GEOS-5 Data Assimilation System - Documentation of Versions 5.0.1, 5.1.0, and 5.2.0. (No. 27). Technical Report Series on Global Modeling and Data Assimilation. NASA, Greenbelt, MD.
Rosenzweig, C., and Hillel, D. (2015). Handbook of Climate Change and Agroecosystems: The Agricultural Model Intercomparison and Improvement Project (AgMIP) Integrated Crop and Economic Assessments - Joint Publication with American Society of Agronomy, Crop Science Society of America, and Soil Science Society of America (In 2 Parts). London: Imperial College Press.
Rosenzweig, C., Jones, J. W., Hatfield, J. L., Ruane, A. C., Boote, K. J., Thorburn, P., et al. (2013). The agricultural model intercomparison and improvement project (AgMIP): protocols and pilot studies. Agric. Forest Meteorol. 170, 166–182. doi: 10.1016/j.agrformet.2012.09.011
Rosenzweig, C., Ruane, A. C., Antle, J., Elliott, J., Ashfaq, M., Chatta, A. A., et al. (2018). Coordinating AgMIP data and models across global and regional scales for 1.5°C and 2.0°C assessments. Philos. Trans. A Math. Phys. Eng. Sci. 376:20160455. doi: 10.1098/rsta.2016.0455
Ruane, A., Antle, J., Elliott, J., Folberth, C., Hoogenboom, G., Mason-D'Croz, D., et al. (2018a). Biophysical and economic implications for agriculture of +1.5 and +2.0°C global warming using AgMIP coordinated global and regional assessments. Clim. Res. 76, 17–39. doi: 10.3354/cr01520
Ruane, A., Goldberg, R., and Chryssanthacopoulos, J. (2015). Climate forcing datasets for agricultural modeling: merged products for gap-filling and historical climate series estimation. Agric. For. Meteorol. 200, 233–248. doi: 10.1016/j.agrformet.2014.09.016
Ruane, A., Phillips, M. M., and Rosenzweig, C. (2018b). Climate shifts within major agricultural seasons for +1.5 and +2.0 °C worlds: HAPPI projections and AgMIP modeling scenarios. Agric. For. Meteorol. 259, 329–344. doi: 10.1016/j.agrformet.2018.05.013
Schleussner, C.-F., Deryng, D., Müller, C., Elliott, J., Saeed, F., Christian, F.olberth, Liu, W., et al. (2018). Crop productivity changes in 1.5 °C and 2 °C worlds under climate sensitivity uncertainty. Environ. Res. Lett. 13:064007. doi: 10.1088/1748-9326/aab63b
Schmidt, G. A., Kelley, M., Nazarenko, L., Ruedy, R., Russell, G. L., Aleinov, I., et al. (2014). Configuration and assessment of the GISS ModelE2 contributions to the CMIP5 archive. J. Adv. Model. Earth Syst. 6, 141–184. doi: 10.1002/2013MS000265
Senay, G. B., Bohms, S., Singh, R. K., Gowda, P. H., Velpuri, N. M., Alemu, H., et al. (2013). Operational evapotranspiration mapping using remote sensing and weather datasets: a new parameterization for the SSEB approach. JAWRA J. Am. Water Res. Assoc. 49, 577–591. doi: 10.1111/jawr.12057
Senay, G. B., Budde, M., Verdin, J. P., and Melesse, A. M. (2007). A coupled remote sensing and simplified surface energy balance approach to estimate actual evapotranspiration from irrigated fields. Sensors 7:22. doi: 10.3390/s7060979
Taylor, K. E., Stouffer, R. J., and Meehl, G. A. (2011). An overview of CMIP5 and the experiment design. Bull. Am. Meteorol. Soc. 93, 485–498. doi: 10.1175/BAMS-D-11-00094.1
Uganda Department of Relief Disaster Preparedness, Management. (2017). Uganda Local Governments Association|National Integrated Early Warning System Bulletin for 15_July to 15_August_2017. Available online at: http://www.ulga.org/national-integrated-early-warning-system-bulletin-for-15_july-to-15_august_2017/ (Accessed August 17, 2018).
UN DESA (2015). “World population prospects: the 2015 revision, key findings and advance tables”, in Working Paper No (2015). New York, NY: United Nations Department of Economic and Social Affairs.
UN FAO (2016). FAO - News Article: El Niño set to Have a Devastating Impact on Southern Africa's Harvests and Food Security [WWW Document]. Available online at: http://www.fao.org/news/story/en/item/382932/icode/ (Accessed August 17, 2018).
United Nations University (2013). Water Security & the Global Water Agenda. A UN-Water Analytical Brief | ECONADAPT Library.
USAID (2016). Southern Africa Drought Fact Sheet Fy 2016 [WWW Document]. USAID.gov. Available online at https://www.usaid.gov/sites/default/files/documents/1866/southern_africa_dr_fs01_04-08-2016.pdf (Accessed January 31, 2019).
U. S. Department of Agriculture - Foreign Agricultural Service (2018). Severe Drought in the Western Cape Reduces South Africa's 2017/18 Wheat Output - Commodity Intelligence Report. USDA.
U. S. National Intelligence Council (2013). Global Trends 2030: Alternative Worlds. Government Printing Office.
Valdivia, R. O., Antle, J. M., Rosenzweig, C., Ruane, A. C., Vervoort, J., Ashfaq, M., et al. (2015). >“Representative agricultural pathways and scenarios for regional integrated assessment of climate change impacts, vulnerability, and adaptation,” in Handbook of Climate Change and Agroecosystems: The Agricultural Model Intercomparison and Improvement Project Integrated Crop and Economic Assessments, eds C. Rosenzweig, and D. Hillel (London: Imperial College Press), 27–44.
Verdin, K. L. (2017). Hydrologic Derivatives for Modeling and Analysis—A New Global High-Resolution Database (USGS Numbered Series No. 1053), Data Series. Reston, VA: U.S. Geological Survey.
Wagner, W., Lemoine, G., and Rott, H. (1999). A method for estimating soil moisture from ers scatterometer and soil data. Remote Sens. Environ. 70, 191–207. doi: 10.1016/S0034-4257(99)00036-X
Water Aid (2018). After Cape Town, Five Other Water-Scarce Regions to Watch [WWW Document]. Available online at: https://reliefweb.int/report/world/after-cape-town-five-other-water-scarce-regions-watch (Accessed August 17, 2018).
Whitcraft, A., Becker-Reshef, I., and Justice, C. (2015a). A framework for defining spatially explicit earth observation requirements for a global agricultural monitoring initiative (GEOGLAM). Remote Sens. 7, 1461–1481. doi: 10.3390/rs70201461
Whitcraft, A., Becker-Reshef, I., Killough, B., Justice, C., Whitcraft, A. K., Becker-Reshef, I., et al. (2015b). Meeting earth observation requirements for global agricultural monitoring: an evaluation of the revisit capabilities of current and planned moderate resolution optical earth observing missions. Remote Sens. 7, 1482–1503. doi: 10.3390/rs70201482
World Food Summit (1996). The rome declaration on world food security. Popul. Dev. Rev. 22, 807–809. doi: 10.2307/2137827
You, L., Wood-Sichra, U., Guo, Z., See, L., and Koo, J. (2014). Spatial Production Allocation Model (SPAM) 2005 v2.0. MapSPAM [WWW Document]. Available onlie at: http://mapspam.info (Accessed January 31, 2019).
Keywords: Earth observations, water-food nexus, NASA, food security, water security, modeling, applications
Citation: McNally A, McCartney S, Ruane AC, Mladenova IE, Whitcraft AK, Becker-Reshef I, Bolten JD, Peters-Lidard CD, Rosenzweig C and Uz SS (2019) Hydrologic and Agricultural Earth Observations and Modeling for the Water-Food Nexus. Front. Environ. Sci. 7:23. doi: 10.3389/fenvs.2019.00023
Received: 29 August 2018; Accepted: 07 February 2019;
Published: 01 March 2019.
Edited by:
Jill A. Engel-Cox, National Renewable Energy Laboratory (DOE), United StatesReviewed by:
Stefanos Xenarios, Nazarbayev University, KazakhstanSushel Unninayar, Morgan State University, United States
Copyright © 2019 McNally, McCartney, Ruane, Mladenova, Whitcraft, Becker-Reshef, Bolten, Peters-Lidard, Rosenzweig and Uz. This is an open-access article distributed under the terms of the Creative Commons Attribution License (CC BY). The use, distribution or reproduction in other forums is permitted, provided the original author(s) and the copyright owner(s) are credited and that the original publication in this journal is cited, in accordance with accepted academic practice. No use, distribution or reproduction is permitted which does not comply with these terms.
*Correspondence: Amy McNally, YW15LmwubWNuYWxseUBuYXNhLmdvdg==