 Linda C. Harwell
 Deborah N. Vivian
 Michelle D. McLaughlin2
 Stephen F. Hafner
- 1National Health and Environmental Effects Research Laboratory, Gulf Ecology Division, Office of Research and Development, U.S. Environmental Protection Agency, Gulf Breeze, FL, United States
- 2Student Services Contractor, Oak Ridge Associated Universities, Oak Ridge, TN, United States
- 3Student Services Contractor, University of West Florida, Pensacola, FL, United States
The increased availability of publicly available data is, in many ways, changing our approach to conducting research. Not only are cloud-based information resources providing supplementary data to bolster traditional scientific activities (e.g., field studies, laboratory experiments), they also serve as the foundation for secondary data research projects such as indicator development. Indicators and indices are a convenient way to synthesize disparate information to address complex scientific questions that are difficult to measure directly (e.g., resilience, sustainability, well-being). In the current literature, there is no shortage of indicator or index examples derived from secondary data with a growing number that are scientifically focused. However, little information is provided describing the management approaches and best practices used to govern the data underpinnings supporting these efforts. From acquisition to storage and maintenance, secondary data research products rely on the availability of relevant, high-quality data, repeatable data handling methods and a multi-faceted data flow process to promote and sustain research transparency and integrity. The U.S. Environmental Protection Agency recently published a report describing the development of a climate resilience screening index which used over one million data points to calculate the final index. The pool of data was derived exclusively from secondary sources such as the U.S. Census Bureau, Bureau of Labor Statistics, Postal Service, Housing and Urban Development, Forestry Services and others. Available data were presented in various forms including portable document format (PDF), delimited ASCII and proprietary format (e.g., Microsoft Excel, ESRI ArcGIS). The strategy employed for managing these data in an indicator research and development effort represented a blend of business practices, information science, and the scientific method. This paper describes the approach, highlighting key points unique for managing the data assets of a small-scale research project in an era of “big data.”
Introduction
The current literature shows that there is growing support from the scientific community for using secondary or “found” data in both theoretical and applied research (Niemeijer and de Groot, 2008; Hampton et al., 2013; Davis-Kean et al., 2015). The “big data” environment has proven to be fertile ground for nurturing innovation in indicator research and development. Easily accessible secondary data has given rise to new big data technologies that can potentially increase the production of robust and reproducible indicator products (Madin et al., 2007; Mooney and Winstanley, 2007; Demchenko et al., 2013; Jha et al., 2015). The concept of big data has been described in many ways. However, no single statement serves as the de facto definition. De Mauro et al. (2015) proposes an ontologically derived definition based on an analysis of existing big data definitions. The authors suggest that “Big Data represents the Information assets characterized by such a High Volume, Velocity, and Variety to require specific Technology and Analytical Methods for its transformation into Value.” This description seems aptly relevant as it emphasizes the enormity of the public access landscape as well as the tools needed to work with big data effectively.
The “information highway” moves over 35 terabits of data per minute (roughly 1.1 billion double-sided print pages of information every 60 s). New and upgraded submarine fiber optic routes have increased data transfer capacity by 32% annually for the last 5 years to support the growing digital load (Submarine Telecoms, 2017, p. 17). In no small measure, the research community has contributed to the proliferation of big data. Many funding organizations now require that data generated through publicly-funded research be made openly available if legally and ethically possible. In the United States (U.S.), all federal agencies investing in research must support increased access to published research and resulting scientific data (Holdren, 2013, February 22). This continuous inflow of freely accessible research products offers some broad reaching benefits not the least of which is simply increasing research visibility (Piwowar et al., 2007). For indicator research and development, big data are playing an essential role in filling long-standing data gaps in quantifying complex, multi-dimensional concepts such as sustainability, resilience, and well-being measures (Smith et al., 2013; Cutter et al., 2014; OECD, 2017; Buck et al., 2018; Summers et al., 2018; Wendling et al., 2018; Helliwell et al., 2019).
The wealth of accessible information can be both rewarding and challenging for science, especially in finding ways to manage it. Scientific data management (SDM) has historically been a challenge for research. A two-part commentary, “How to Manage Data Badly Part 1 and 2” (Hale, 1999, 2000), highlighted existing issues surrounding the management of research data in the field of ecology. Although the publication described the lack of SDM in the context of a single science discipline, the message resonated universally as few people could disagree with the observations regarding the poor state of SDM practices 20 years ago. Since then, data and information sciences have taken center stage as organizations seek to build more robust and efficient ways to collect, process, manage and curate big data (Gray et al., 2005; Sansone et al., 2018). New technologies and expert solutions are emerging to assist both private and public sectors in managing big data (Pilat and Fukasaku, 2007; Cox and Pinfield, 2014; Simms et al., 2016; Borycz and Carroll, 2018).
“Big science” research (i.e., high throughput, long-term or high value) are often provided with enough resources to support the technology and expertise needed to implement well-designed SDM and curation frameworks (Crowston and Qin, 2011; Berman and Cerf, 2013). On the other hand, “small science” projects (i.e., small team, short-term or exploratory research) often lack adequate SDM funding even though small-scale research can collectively generate more data than their “big science” counterparts (Crowston and Qin, 2011). Individual researchers often bear the responsibility for managing the data assets in smaller-scale science, yet many do not have practical data management experience or access to relevant personnel to process, document, and, eventually, curate big data-driven research adequately (Lynch, 2008; Borgman, 2012). As research funding ebbs and flows, smaller-scale efforts are increasingly turning to big data to support research. Without sufficient SDM support, big data collection and processing activities alone can quickly overwhelm a project, making it difficult to curate reproducible science (Lowndes et al., 2017). With a growing universe of open research and the ease with which the data may be acquired, it seems imperative that research institutions invest in building the capacity for all research efforts to plan and execute robust SDM, regardless of the size or perceived value (Everyone Needs a Data-Management Plan, 2018)
There is a growing demand for science-based indicators (Nardo et al., 2005) and indicator research is well-suited for big data. By design, indicators and indices (summarized indicators) are intended for a public audience. With the advent of the open access initiatives, SDM planning guidelines and tools are abundant, yet many of these resources lack the details and a common set of standards to be meaningful (Dietrich et al., 2012). Research data and the processes to manage them are iterative and “mature” over time as the research progresses (Crowston and Qin, 2011; Digital Curation Center, http://www.dcc.ac.uk/). For large-scale or high-volume research efforts, highly automated and detailed SDM policies may be most appropriate, but for smaller research activities, a more straightforward infrastructure that can evolve as the data mature may be the most beneficial (Link et al., 2017).
In 2017, the U.S. Environmental Protection Agency (EPA) published the conceptual framework and demonstration of the Climate Resilience Screening Index (CRSI) (Summers, J. K. et al., 2017; Summers, K. et al., 2017; Summers et al., 2018). EPA researchers were tasked with developing and demonstrating a composite index that could characterize the resilience of the U.S. in the context of potential natural hazard exposures—in a 12-month time frame and using existing resources. The CRSI framework is hierarchical (Figure 1). The overall index is informed by five domain sub-indices that are described by twenty indicators which are comprised of 117 metrics. To be most useful, CRSI needed to be applicable to different geographical, population, and temporal scales using the same cultivated data set. A diverse ecosystem of secondary data representing 120 unique data values were collected for 3135 U.S. counties in 2000–2015 time-period to quantify metrics.
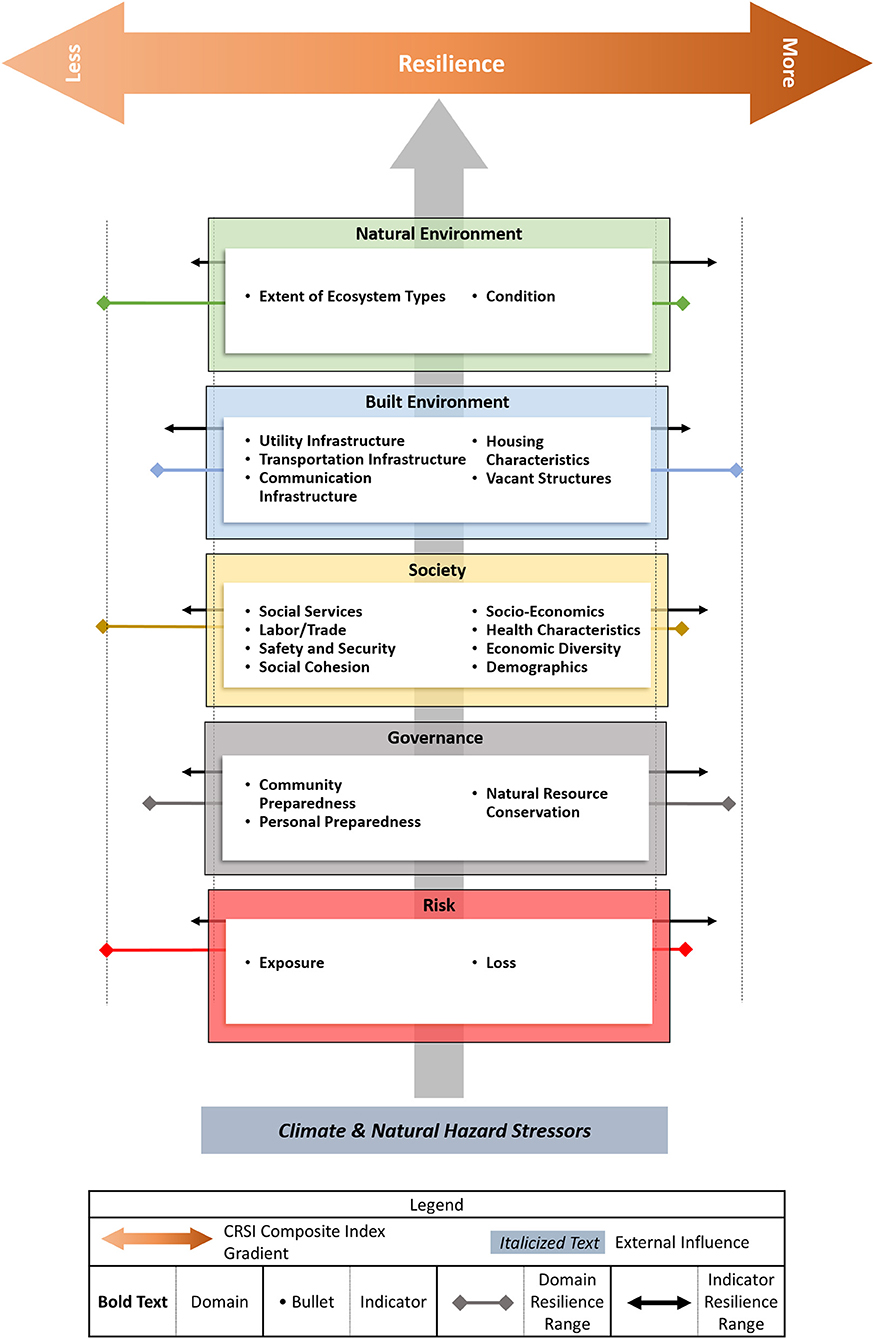
Figure 1. The CRSI conceptual framework (Summers, K. et al., 2017). Lines extending left and right of domain labeled boxes depict a theoretical range of socio-economic and ecological recoverability factors that may influence the overall CRSI measure. Black arrows relate to indicators and color, diamond-ended lines are assigned to domains highlighted by the same color.
The development of composite indices to describe complex ideas is not new. The Better Life Index (BLI) (OECD, 2017), Environmental Performance Index (EPI) (Wendling et al., 2018), Human Development Index (HDI) (United Nations Development Programme, 2018), and Ocean Health Index (OHI) (Halpern et al., 2012) are a few notable examples. A composite index is a communication tool that uses a collection of individual metrics or indicators to translate data into information that describes a multi-dimensional concept (Nardo et al., 2005). A common trait shared across the example indices and CRSI is the use and synthesis of economic, social and ecological secondary data. BLI, EPI, HDI, and OHI offer reference materials, tools and data in a readily accessible format (i.e., websites and web-services) to help others reproduce the featured indices. All four indicator research efforts are exemplar cases of transparent and reproducible research in the end-stage or mature phase of the full SDM cycle. The CRSI research, on the other hand, is still “young” in the data maturation continuum and many of the SDM systems are still evolving. Project researchers rather than data professionals are responsible for planning and implementing SDM. Most CRSI team members lack practical SDM experience. The researchers are generally familiar with the premise of SDM but not the common vernacular or specific considerations associated with secondary resources. Like many research institutions, SDM planning and open access research are not new subjects at the U.S. EPA, although details vary widely from one research project to another.
The perceived apathy toward indicator research SDM and curation appears to be a recurring theme. Early stages in big data SDM in particular are prone to be hectic and disorganized since processes have yet to stabilize (Crowston and Qin, 2011). What is lacking in the current SDM literature is a portrait of SDM-life before all the data decisions have been made and SDM processes are in flux. This paper describes the CRSI SDM approach which offers an inside peek at SDM from the “small-science” perspective. Highlighted are key strategies that have proven helpful for managing the big data assets of CRSI and addressing potential challenges that can impede successful research outcomes.
Approach
The CRSI SDM Concept
SDM in the CRSI effort is an inclusive process where all researchers are expected to participate in data collection, assessment, processing, and storage. The SDM infrastructure is adapted from past practices described in Hale et al. (2003) which emphasizes a culture of “data sharing.” Additional queues from Zook et al. (2017) helped inform CRSI SDM requirements for capturing the copyright information (Carroll, 2015), data provenance (Carlson and Anderson, 2007), and data ethics (Floridi and Taddeo, 2016; Vayena and Tasioulas, 2016) that are especially important to address when data are made publicly accessible. U.S. EPA SDM guidelines recommend that a suite of 10 topics should be addressed for thorough data asset management planning (Table 1). Since principal investigators lead and provide oversight in research projects, it seems natural that improving SDM outcomes begins with education and hands-on experience for researchers. The CRSI SDM is a relatively simple framework that embraces “better data management through partnerships” concepts (Hale et al., 2003), adapted for a small, co-located team. At its core, the CRSI SDM environment is as much a training platform as it is an assemblage of data management practices. The objectives of this “learn as you go” SDM ethos is to adequately execute research asset management while increasing the SDM knowledge and capabilities of the research personnel. Governance of data collection, processing, and curation is integrated into the science conversation, so the language of research curation becomes as natural to the researchers as the science. The SDM of the CRSI effort represents a collaborative process in which all researchers have ownership.
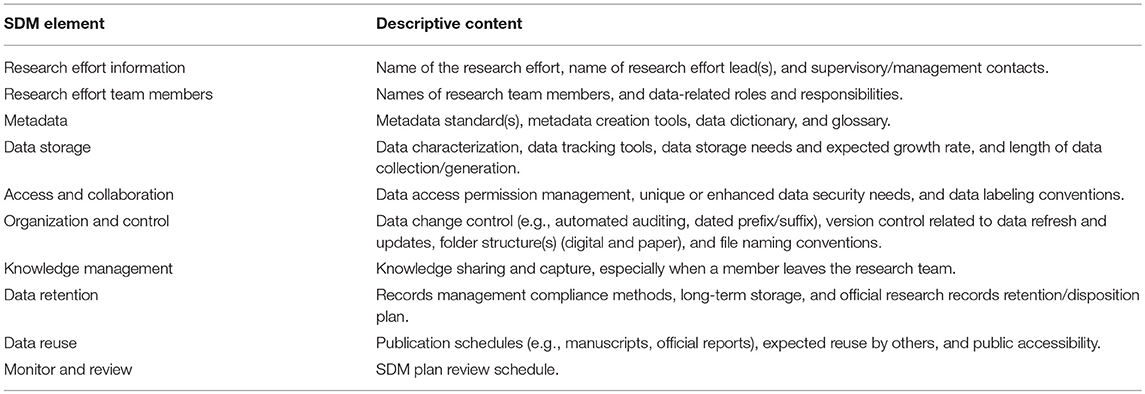
Table 1. Elements addressed in the scientific data management (SDM) plan for the Climate Screening Resilience Index research.
Data Collection
Every member of the team participated in the literature, secondary data, and metadata collection. A literature review was conducted to describe the state of resilience indicator science to provide the rationale for the development of the index and to identify existing resilience indicator efforts that could inform the research. Publications related to any resilience indicator or index concepts including hazard exposures, natural disasters, infrastructure, quality of life and governance were considered as potential sources of contextual data for CRSI. Based on the completed literature review, each researcher searched the internet for sources of publicly available data to identify and collect as candidate secondary data relevant for quantifying CRSI indicators. Supplementary information such as licensing documents, disclaimers, data catalogs, and users' guides, was also collected along with secondary data.
Data Acceptance
Data collection is, of course, at the core of indicator development. Exploring big data can result in many secondary data resources, some representing alternative choices for the same data. Procedural guidelines were developed to help minimize bias and improve selection relevancy during the literature and secondary data collection process. To the extent possible, these criteria served as the first-level evaluation for determining the potential suitability of secondary data for use in CRSI calculations. If a set of data appeared relevant but did not meet every criterion, then a team consensus informed the final determination on acceptability. The following (Table 2) briefly describes each criterion.
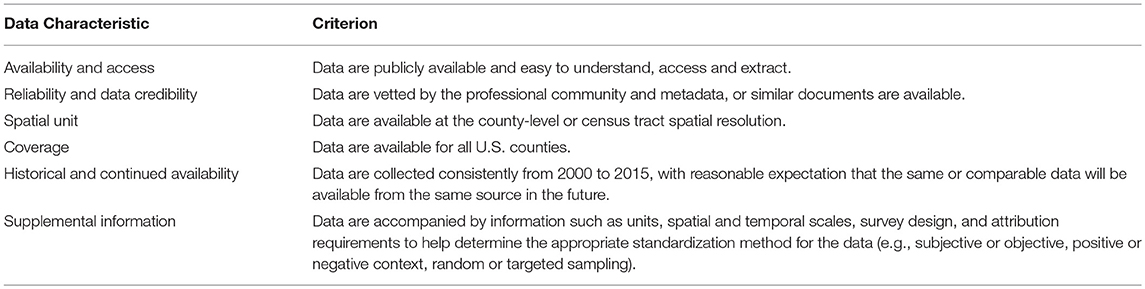
Table 2. Data acceptance criteria used to identify and select secondary.
Assessing CRSI Data Quality and Suitability
There is a persistent assumption that data retrieved from a credible source are suitable for a research effort out of hand (Boyd and Crawford, 2012). Cai and Zhu (2015) provide thoughtful insight regarding the challenges of examining the quality and suitability of big data. While reviewing data can be straightforward, the suitability of the data for the research is a bit more subjective and requires a way to conceptualize the data in the context of intended use. While random subsets of data were manually reviewed for quality and errors, a 100% assessment is nearly impossible with extensive sets of data. Descriptive statistics were most helpful for assessing the quality and suitability of the secondary data for CRSI. A full complement of summaries was generated for each component of the CRSI framework including the metrics. Histograms and other visualizations assisted researchers with examining data for anomalies and use-case weaknesses.
Tools for Literature and Data Acquisition/Processing
Publish or Perish software (Harzing, 2007) was used to assist with identifying literature for review. Clearly defined keywords and phrases were used to search well-established literature repositories (e.g., Scopus, Web of Science, JSTOR). Responsibilities for conducting the literature review were distributed across the research team. Each publication was evaluated for relevance to the CRSI research. Electronic publication files were downloaded and maintained in a literature repository. Manual literature searches were conducted to help fill any literature gaps resulting from the software-driven prioritization.
For many, collected literature simply contribute to the reference list in publications. However, in SDM, the decision choices related to including or excluding a published work for the research, is data. To that end, researches provided a summary associated with each review using a template as an outline. The outline captured information that could be used to drive queries to produce literature-related statistics or reporting. Citations along with review summaries were eventually uploaded to a Microsoft (MS) Access (2016) database.
There is a movement that is rapidly spreading within the research community—the use of open-source tools for processing big data (e.g., R-Project, https://www.r-project.org/; Python, https://www.python.org/; Apache Spark, https://spark.apache.org/). Unfortunately, the skill sets available for processing CRSI data ranged from practically non-existent to programming in multiple languages. Each researcher used their tool of choice for processing data. While this decision lacked robust technical standardization, it offered a timely solution for completing data collection and processing by helping to distribute the data processing load. Allowing each researcher to work with the tool most familiar to them also helped reduce data processing errors. SAS, R-Project, SPSS, MS Excel, ESRI ArcGIS, and Python were the dominant software packages used for processing the data. A suite of secondary data was assigned to specific individuals based on their level of data handling experience. Each researcher was responsible for formatting, standardizing and harmonizing their selection of secondary data as well as documenting the processing methods.
Organization and Storage of CRSI Data Resources
Research data and other materials were physically stored on a centralized network server housed within the U.S. EPA. Hierarchically-nested subdirectories or folders contained all information consisting of raw data, processed data, final research results, and supplementary information. The physical storage structures that comprised the framework mirrored the different components of the CRSI research. This arrangement offered a convenient way to compartmentalize the various stages of the research data assets. Additionally, associating file structure features with components of the research made it easier for researchers to locate specific pieces of information. Figure 2 shows the CRSI data storage layout.
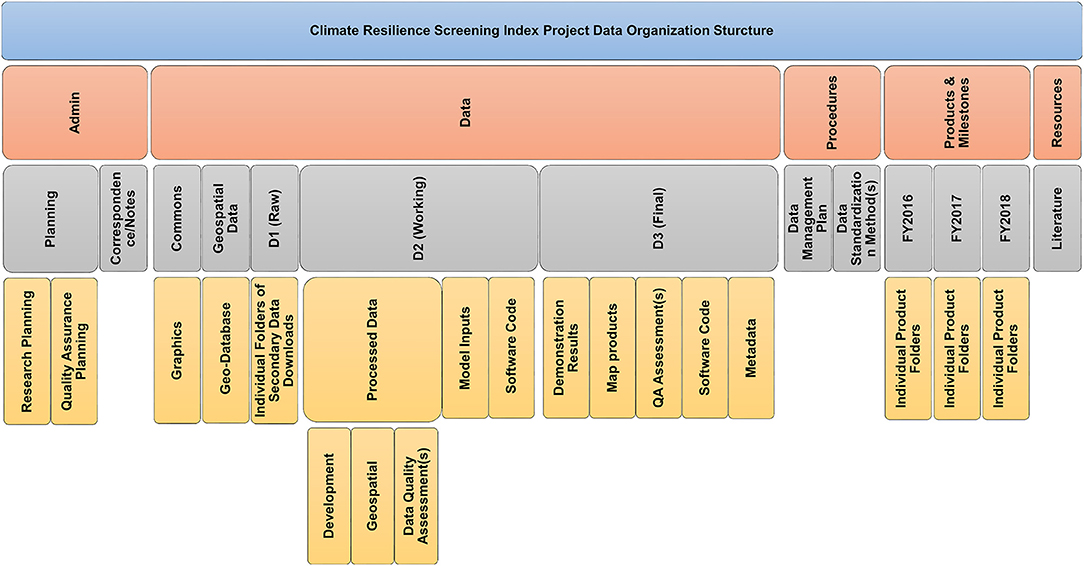
Figure 2. Illustration of the CRSI file structure layout. Each block represents a separate subdirectory or folder. All elements organized under the “Data” block form the primary data construct.
CRSI Data Construct
Central to the file storage structure was the CRSI data construct. The data construct is a remnant of past practices that has worked well-across different research efforts. Data assets were partitioned relative to their processed status. The directory naming conventions were consistent with past and concurrent research activities helping to maintain data organization consistency. Also, the data construct made it convenient for managing access permissions and enforcing data policies, e.g., use constraints, sensitive data access, and original data preservation. Apart from raw geospatial data (Section Geospatial Data), the CRSI data construct was used for the handling of raw, processed, and production (research results) data. As depicted in Figure 1, the D1 directory warehoused the raw secondary data in the form provided by the source along with pertinent documentation (e.g., metadata, data dictionaries, users' guides). Once all secondary data were collected and vetted, the original downloaded files were held sequestered while a copy operated as the functional data platform for the remaining phases of data processing. The D2 directory housed processed data (e.g., standardized) that were accessed repetitively for CRSI data quality assessments and analyses. Data quality assessment results and software code files related to data processing or qualifying were maintained in the D2 directory as well. The D3 structure held the CRSI results in comma-delimited (*.csv) format. Files produced in software-specific form (e.g., *.sas7bdat, *.xlsx) were maintained as an additional layer of data recoverability. Information housed in the D3-level structure consisted of demonstration results, model inputs, and map products.
Geospatial Data
Geospatial processing was used to derive natural environment and natural hazard values based on the Multi-Resolution Land Characteristics (MRLC) Consortium's National Land Cover Data Set (Homer et al., 2015), both with and without additional secondary data overlays. Secondary data collected for geoprocessing were archived in their original form. Base maps and data downloads were migrated to a file geodatabase construct for geospatial processing where secondary data were rendered as feature classes. A file-based geodatabase was used for managing and querying the collection of CRSI-related spatial data. A file geodatabase organizes data physically in a directory or folder structure rather than in a single personal database file such as those used with MS Access. Individual data files are accessed directly using geospatial software such as ESRI ArcGIS (Version 10.5), the application used for CRSI. For this effort, the use of a file geodatabase served multiple purposes:
• Eliminated the constraints of individual file sizes that are associated with other GIS conventions (shapefiles).
• Allowed for the use of a standardized coordinate system to ensure all imported data would be uniformly projected, without further intervention.
• Kept related data together and organized during processing.
Values generated from geospatial processing were treated as “found data” and folded into the D1 portion of the data construct. Any further standardization or normalization treatment of these data followed the same protocols as all other sources of secondary data.
CRSI Data Security and Data Operations Continuity
Existing enterprise-wide information security protocols served as the primary access and data security defense for CRSI. However, these measures could not safeguard data from inadvertent deletions, modifications, or misplacements caused by well-intentioned “insiders” (team researchers)—particularly in the early stages of the research when processes are chaotic, and data are most vulnerable. More specific data security steps were taken to safeguard the CRSI research assets internally. A menu-driven access portal developed in the MS Access data to serve as a conduit between the research team and CRSI data. Querying capability that mapped demonstration results (D3 level data) to relevant D2 and D1 data and supplementary information were developed. A series of reference tables linked data records stored in the database to data resources only available outside the database (e.g., raw secondary data), including information about data origin and evolution (data provenance). Pre-defined queries driven by interactive menus maintained within the database provided a way for the research team to navigate CRSI research assets while minimizing potential data mishaps. In addition, a bibliographic index of literature was created to act as an electronic card catalog for the literature repository. Indexed references for both accepted and rejected publications could be queried to return summary information created during the literature review. Additionally, secondary-data sources were linked to relevant publications so researchers could cross-reference materials from either data point or an article.
The inclusive SDM environment inherently provided as a continuity of operations mechanism. Other practices fostered knowledge exchange including SDM discussions during team briefings and planning sessions as well as SDM specific peer-to-peer training. The SDM plan, implementation of SDM plan, routine research communication, and team interactions collectively created a sustainable knowledge management paradigm.
Example Outcomes from Highlighted SDM Processes
This section offers some “results” associated with the CRSI data environment. Example CRSI data characteristics and quality assessments are presented. Additionally, a general overview describing the database design is briefly described.
Characteristics of the Reviewed Literature and Secondary-Data
Literature summaries showed that 369 publications met at least one keyword or key phrase criterion. Approximately 20% of the literature reviewed had a direct bearing on the development of the CRSI framework. Another 4% of CRSI references indirectly informed the conceptualization of CRSI while 76% lacked vital factors of interest or were duplicative.
Over 1.3 million secondary data values retrieved from thirty-seven unique data providers (Table 3) served as the basis for constructing CRSI. These data were comprised of annual collections of available information from 2000 to 2015 for 3135 counties of the U.S. A complement of 383,713 averaged secondary-data measures supported final CRSI calculations was derived from the average of values for each data set across all available years, resulting in. These data represented a range of science disciplines (e.g., meteorology, geology, economics, geography, social science, ecology). Information documenting the intent, scope, quality, and refresh frequency was captured for each set of secondary data sets as well as attribution and copyright requirements.
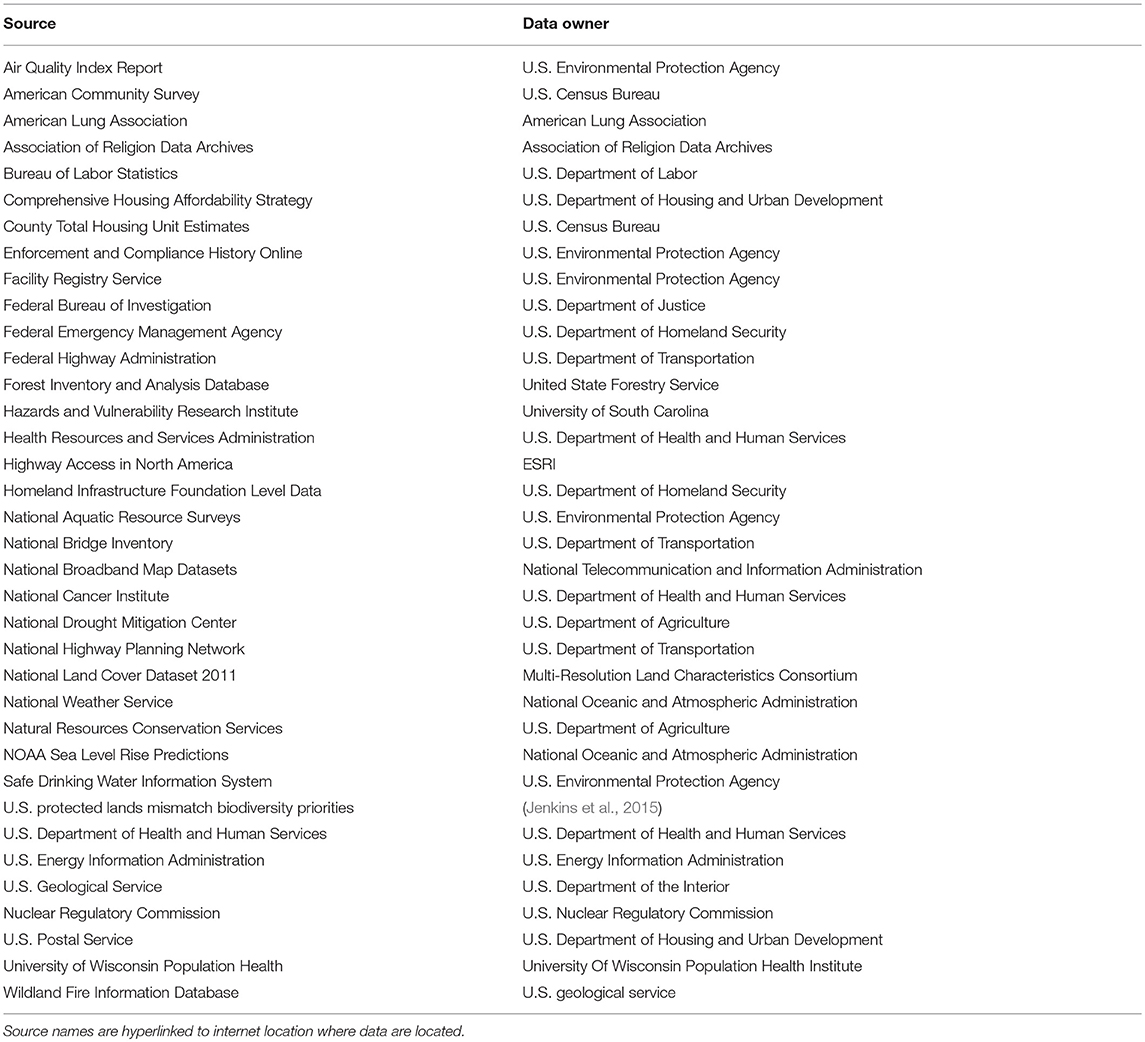
Table 3. List of secondary data sources used in the CRSI indicator development research.
Geospatially-derived secondary data were not available for eight boroughs in Alaska nor could these data be imputed with any reasonable level of confidence. Natural environment metrics (e.g., land types, soil productivity, coastal condition, natural hazards) were translated from ecologically relevant spatial scales (e.g., 12-digit hydrologic unit codes, ecoregions) to county-level boundaries. Metrics associated with natural hazard and toxic exposures were population normalized then modeled for the pertinent value if needed. Nearly one hundred percent (99.7%) of counties were represented in the CRSI metric inventory.
CRSI Results: Index, Domains, Indicators, and Metrics
The CRSI demonstration results were produced at four hierarchically-related aggregation levels (Figures 3A,B)—metrics, indicators, domains, and indices—which collectively represent 448,305 individual results (Figure 4). Metrics were derived directly from processed secondary data and were the most abundant. The summary of county-level metrics quantified indicators, indicators were summarized to domains, and domains informed the equation for the final CRSI values.
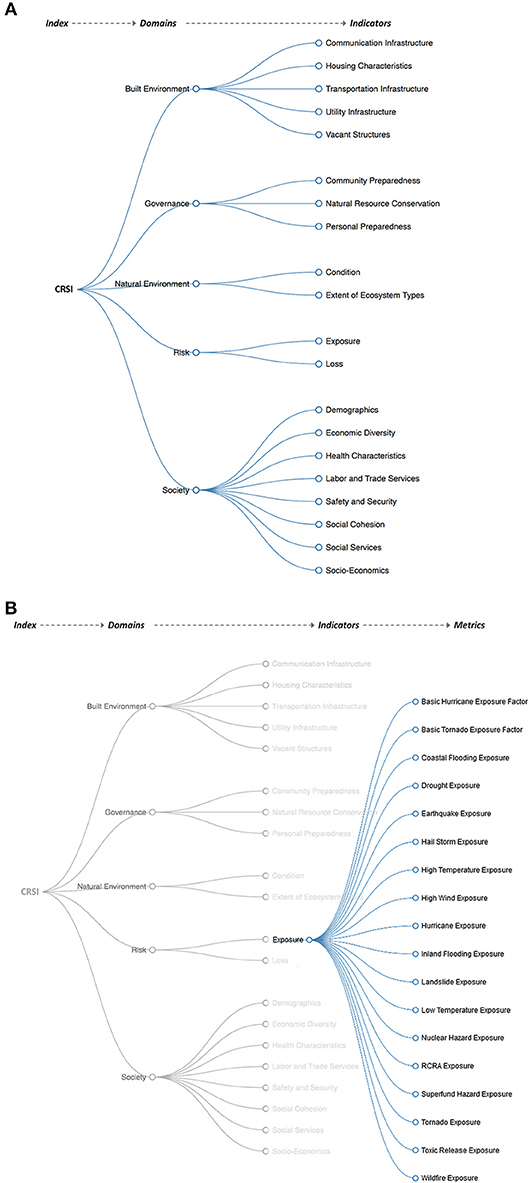
Figure 3. (A) The CRSI-domain-indicator data tree that served to inform the organization of different aggregates of indicator values. (B) A continuation of the CRSI data tree depicting the relationship between one indicator and associated metrics (processed data).
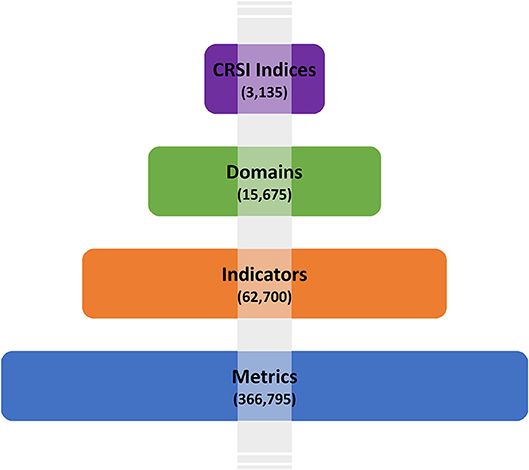
Figure 4. A diagram illustrating the relationship of CRSI components and their contribution to the over quantity of demonstration results.
Data Quality Assessments
Statistical summaries, cumulative distribution functions (CDFs), and histograms were created using final CRSI values and each metric, indicator, and domain component to aid in the data quality assessments. If the descriptive statistics or data visualizations presented an unexpected value or data pattern, a review of each step of the data handling process was conducted to determine if an error occurred because of the data processing. Corrective actions were taken on detected errors, but if no error was detected, then the value remained. A series of CDFs are offered to demonstrate the value of this data quality assessment exercise. Figure 5A shows the distribution pattern related to one set of metric-level data found with an “suspected” error and the distribution of these same metrics after the error is corrected. Figures 5B–D show the relative influence of this single metric across a full spectrum of derived CRSI components, both before and after error correction takes place.
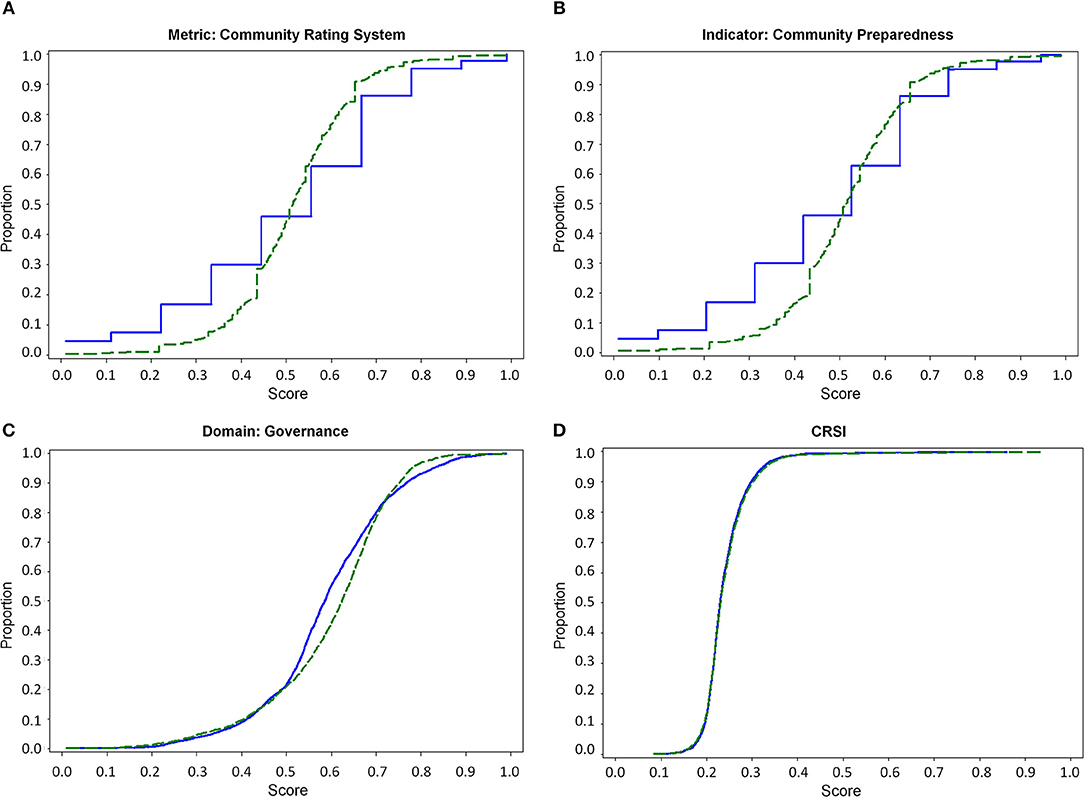
Figure 5. Cumulative distribution function (CDF) analyses were performed for each suite of metrics, indicators, domains and CRSI values. Graphs were used to identify possible processing errors and to understand how errors influence the different aggregates of results: (A) the stair-step pattern of the “Before Correction” CDF suggests that a problem existed in the suite of Community Rating System metrics while the “After Correction” CDF shows the more expected distribution pattern; (B) demonstrates the level of influence a single metric can exert on an indicator; (C) illustrates the difficulty in identifying the metric error at the domain-level of CRSI calculations; and (D) shows that the metric-level error is virtually undetectable in the final index (CRSI) values.
Histograms of CRSI values initially presented a right-skewed distribution pattern (Figure 6A). Several boroughs in the state of Alaska were the primary driver. After results and processing steps were verified, each record was qualified in the D3-level CRSI data set. When extreme outliers were removed, CRSI results appeared better distributed, aligning more with expectations (Figure 6B). Qualified results were kept in the final set of CRSI results.
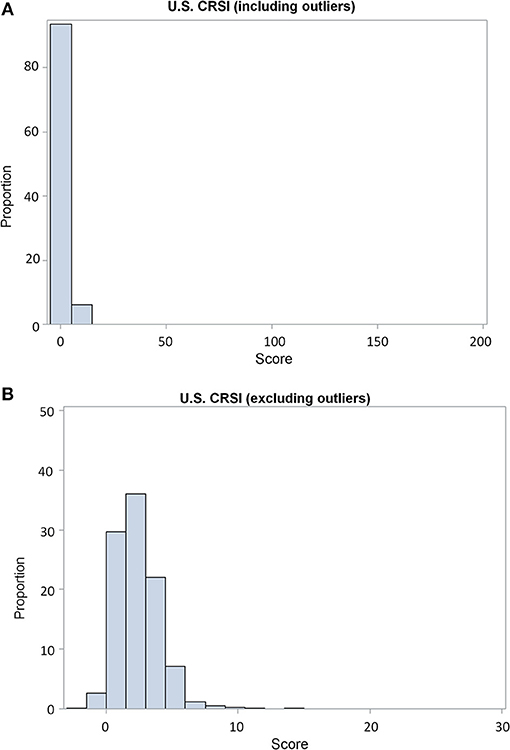
Figure 6. (A) The histogram shows severely right-skewed results in the distribution of calculated CRSI scores. A review of the results found that pattern was due to CRSI values for 12 of 22 boroughs in Alaska were far outside the 3rd quartile range rather than any specific data processing error. (B) After qualifying these 12 CRSI results as outliers, the histogram reflects a distribution pattern that was expected with the 12 outlier values were removed. Publications using the final CRSI measures report results, both with and without these qualified outliers.
CRSI Data Warehouse
The CRSI database was constructed using an MS Access (2016) database and designed to serve as a data warehouse. Leveraging features and functions available in MS Access, menus, forms, and reports were created to assist researchers in navigating the CRSI data warehouse. A switchboard (e.g., menu system) operated as the primary user interface. Forms provided interactive filtering capabilities to customize the information displayed from the various data tables held within the warehouse. Pre-defined queries joined relevant information from across the CRSI data management framework. Pre-defined report formats presented query results. Filtering functions were also offered in reports to refine the information offered for print. The general flow of data and information to and from the CRSI data warehouse is presented in Figure 7.
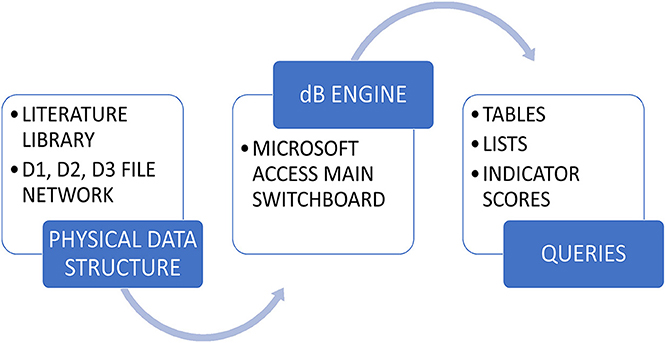
Figure 7. A visual representation depicting the general flow of CRSI data using the CRSI data warehouse as the avenue for the CRSI research team to access results, literature, and secondary data information.
The size limitation associated with MS Access databases (2 GB; Microsoft support https://support.office.com) proved problematic for housing secondary data but accommodated all of the results (D3). A set of relational tables were created to link CRSI metrics with original data download files, relevant literature, and supplementary material. Results could be displayed graphically and downloaded so team members can reuse the data without compromising the resources that support the research. Figure 8 provides a detailed illustration of the CRSI data warehouse framework.
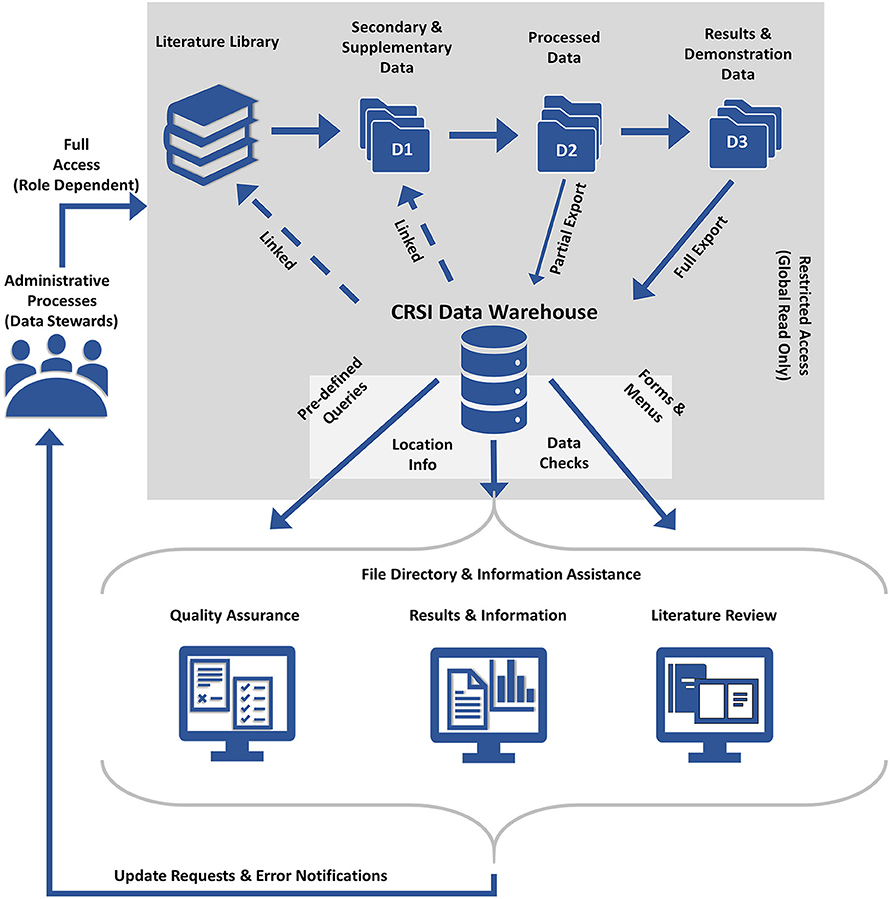
Figure 8. The CRSI data warehouse framework depicting the flow of data and information; access controls; outputs generated; and research asset monitoring and management loop.
Discussion
Big data have ushered in the promise of new research possibilities. In indicator research and development, big data has most assuredly found a home. This wealth of publicly accessible information has helped advance indicator research. Big data helps small research efforts like CRSI flourish and prove relevant on the global stage. However, broader discussions regarding best research data management and sharing practices are needed (Borgman, 2012). The apparent lack of consistent SDM standards and the impact this has on research reproducibility is driving the development of new technologies for managing enterprise-wide research assets. Methods and technology continue to evolve potentially offering more scalable data management solutions for research efforts of all sizes (Davidson et al., 2014; Zook et al., 2017; Peng et al., 2018). Given the SDM inequities between “big science” and “small-science,” even these newer approaches may remain beyond the grasp of small-scale research (Borycz and Carroll, 2018).
The SDM strategies described in this paper may be self-evident, but an abundance of literature seems to suggest that Hale's (1999,2000) observations regarding the poor state of SDM persists even after two decades of data technology and knowledge advancements. The scientific community runs the risk of losing access to valuable research assets over time if SDM continues to lag in smaller-scale research (Crowston and Qin, 2011). The CRSI SDM illustration suggests that “small-science” does not necessarily equate to “small data.” On the contrary, big data assures us that vast amounts of data are available with just a mouse-click, even if the SDM infrastructure to manage them does not exist.
The CRSI SDM approach demonstrates one potential model for managing big data needs in a small-scale research setting. The CRSI SDM framework is easy to understand and offers ample opportunity to increase a research team's SDM capacity when data expertise is limited or unavailable. Big data management can be messy. Lowndes et al. (2017) describes the transitioning of the OHI SDM data processing methods for calculating the index from a plodding and inefficient process to a cost-effectiveness and highly functional data processing supported research reproducibility and accessibility better. Open-source tools such as freely available software packages (e.g., R-Project, Python), collaboration and workflow platforms (e.g., GitHub, Project Jupytr) and database engines (e.g., SQLite, MongoDB) are a few tool-kits that may be considered for evolving the CRSI SDM. Each enhancement would represent progress in SDM life-cycle and a step toward best SDM practices. The CRSI SDM approach could serve as starting point for small-scale indicator research projects to successfully leverage big data resources.
The current release of CRSI and domain sub-index measures are available for 3135 counties in Portable Document Format (PDF) as Appendix B in Summers, K. et al. (2017). An updated suite of CRSI results are being reviewed presently. The next release of CRSI data will be made available as a downloadable file through the Data.gov portal (https://www.data.gov/) when the review is complete.
Author Contributions
All authors listed have made a substantial, direct and intellectual contribution to the work, and approved it for publication.
Disclaimer
The views expressed in this manuscript are those of the authors and do not necessarily represent the views or policies of the U.S. Environmental Protection Agency. Any mention of trade names, products, or services does not imply an endorsement by the U.S. Government or the U.S. Environmental Protection Agency. The EPA does not endorse any commercial products, services, or enterprises.
Conflict of Interest Statement
The authors declare that the research was conducted in the absence of any commercial or financial relationships that could be construed as a potential conflict of interest.
References
Berman, F., and Cerf, V. (2013). Who will pay for public access to research data? Science 341, 616–617. doi: 10.1126/science.1241625
Borgman, C. L. (2012). The conundrum of sharing research data. J. Am. Soc. Inform. Sci. Technol. 63, 1059–1078. doi: 10.1002/asi.22634
Borycz, J., and Carroll, B. (2018). Managing digital research objects in an expanding science ecosystem: 2017 conference summary. Data Sci. J. 17:16. doi: 10.5334/dsj-2018-016
Boyd, D., and Crawford, K. (2012). Critical questions for big data: provocations for a cultural, technological, and scholarly phenomenon. Inform. Commun. Soc. 15, 662–679. doi: 10.1080/1369118X.2012.678878
Buck, K. D., Summers, J. K., Smith, L. M., and Harwell, L. C. (2018). Application of the human well-being index to sensitive population divisions: a children's well-being index development. Child Indicators Res. 11, 1249–1280. doi: 10.1007/s12187-017-9469-4
Cai, L., and Zhu, Y. (2015). The challenges of data quality and data quality assessment in the big data era. Data Sci. J. 14:2. doi: 10.5334/dsj-2015-002
Carlson, S., and Anderson, B. (2007). What are data? The many kinds of data and their implications for data re-use. J. Comp. Mediated Commun. 12, 635–651. doi: 10.1111/j.1083-6101.2007.00342.x
Carroll, M. W. (2015). Sharing research data and intellectual property law: a primer. PLoS Biol. 13:e1002235. doi: 10.1371/journal.pbio.1002235
Cox, A. M., and Pinfield, S. (2014). Research data management and libraries: current activities and future priorities. J. Librarianship Inform. Sci. 46, 299–316. doi: 10.1177/0961000613492542
Crowston, K., and Qin, J. (2011). A capability maturity model for scientific data management: evidence from the literature. Proc. Am. Soc. Inform. Sci. Technol. 48, 1–9. doi: 10.1002/meet.2011.14504801036
Cutter, S. L., Ash, K. D., and Emrich, C. T. (2014). The geographies of community disaster resilience. Global Environ. Change 29, 65–77. doi: 10.1016/j.gloenvcha.2014.08.005
Davidson, J., Jones, S., Molloy, L., and Kejser, U. B. (2014). Emerging good practice in managing research data and research information within UK Universities. Proc. Comp. Sci. 33, 215–222. doi: 10.1016/j.procs.2014.06.035
Davis-Kean, P. E., Jager, J., and Maslowsky, J. (2015). Answering developmental questions using secondary data. Child Dev. Perspect. 9, 256–261. doi: 10.1111/cdep.12151
De Mauro, A., Greco, M., and Grimaldi, M. (2015). “What is big data? A consensual definition and a review of key research topics,” in AIP Conference Proceedings Vol. 1644 (Madrid), 97–104.
Demchenko, Y., Grosso, P., De Laat, C., and Membrey, P. (2013). “Addressing big data issues in scientific data infrastructure,” in Collaboration Technologies and Systems (CTS), 2013 International Conference on. IEEE, 48–55.
Dietrich, D., Adamus, T., Miner, A., and Steinhart, G. (2012). De-mystifying the data management requirements of research funders. Issues Sci. Technol. Librarianship 70. doi: 10.5062/F44M92G2
Everyone Needs a Data-Management Plan (2018). Nature 555:286. [Editorial]. Available oniline at: https://www.nature.com/articles/d41586-018-03065-z (accessed July 10, 2018)
Floridi, L., and Taddeo, M. (2016). What is data ethics? Phil. Trans. R. Soc. A 374:20160360. doi: 10.1098/rsta.2016.0360
Gray, J., Liu, D. T., Nieto-Santisteban, M., Szalay, A., DeWitt, D. J., and Heber, G. (2005). Scientific data management in the coming decade. Acm Sigmod Record 34, 34–41. doi: 10.1145/1107499.1107503
Hale, S. S. (2000). How to manage data badly (part 2). Bull. Ecol. Soc. Am. 81, 101–103. doi: 10.1890/0012-9623(2000)086[0101:C]2.0.CO;2
Hale, S. S., Miglarese, A. H., Bradley, M. P., Belton, T. J., Cooper, L. D., Frame, M. T., et al. (2003). “Managing troubled data: coastal data partnerships smooth data integration,” in Coastal Monitoring through Partnerships (Dordrecht: Springer), 133–148.
Halpern, B. S., Longo, C., Hardy, D., McLeod, K. L., Samhouri, J. F., Katona, S. K., et al. (2012). An index to assess the health and benefits of the global ocean. Nature 488:615. doi: 10.1038/nature11397
Hampton, S. E., Strasser, C. A., Tewksbury, J. J., Gram, W. K., Budden, A. E., Batcheller, A. L., et al. (2013). Big data and the future of ecology. Front. Ecol. Environ. 11, 156–162. doi: 10.1890/120103
Harzing, A. W. (2007). Publish or Perish. Available online at: http://www.harzing.com/pop.htm (accessed August 22, 2018)
Helliwell, J., Layard, R., and Sachs, J. (2019). World Happiness Report 2019. New York, NY: Sustainable Development Solutions Network. Available online at: http://worldhappiness.report/ed/2019/
Holdren, J. P. (2013, February 22). Increasing Access to the Results of Federally Funded Scientific Research. Washington, DC: Executive Office of the President, Office of Science and Technology Policy. Available online at: https://obamawhitehouse.archives.gov/sites/default/files/microsites/ostp/ostp_public_access_memo_2013.pdf.
Homer, C. G., Dewitz, J. A., Yang, L., Jin, S., Danielson, P., Xian, G., et al. (2015). Completion of the 2011 National Land Cover Database for the conterminous United States-Representing a decade of land cover change information. Photogr. Eng. Remote Sensing 81, 345–354.
Jenkins, C. N., Van Houtan, K. S., Pimm, S. L., and Sexton, J. O. (2015). U.S. protected lands mismatch biodiversity priorities. Proc Natl Acad Sci USA. 112, 5081–5086. doi: 10.1073/pnas.1418034112
Jha, M., Jha, S., and O'Brien, L. (2015). “Integrating big data solutions into enterprize architecture: constructing the entire information landscape,” in The International Conference on Big Data, Internet of Things, and Zero-Size Intelligence BIZ2015 (Kuala Lumpur), 8–10.
Link, G. J., Lumbard, K., Conboy, K., Feldman, M., Feller, J., George, J., et al. (2017). Contemporary issues of open data in information systems research: considerations and recommendations. Commun. Assoc. Inform. Syst. 41:25. doi: 10.17705/1CAIS.04125
Lowndes, J. S. S., Best, B. D., Scarborough, C., Afflerbach, J. C., Frazier, M. R., O'Hara, C. C., et al. (2017). Our path to better science in less time using open data science tools. Nat Ecol Evol. 1:0160. doi: 10.1038/s41559-017-0160
Madin, J., Bowers, S., Schildhauer, M., Krivov, S., Pennington, D., and Villa, F. (2007). An ontology for describing and synthesizing ecological observation data. Ecol. Inform. 2, 279–296. doi: 10.1016/j.ecoinf.2007.05.004
Mooney, P., and Winstanley, A. C. (2007). “Improving environmental research data management,” in EnviroInfo 2007. Paper presented at the 21st International Conference for Environmental Protection Part 1, Warsaw, Poland, 12-14 September, eds O. Hryniewicz, J. Studzinski, and M. Romaniuk (Aachen: Shaker Verlag), 473–477.
Nardo, M., Saisana, M., Saltelli, A., Tarantola, S., Hoffman, A., and Giovannini, E. (2005). Handbook on Constructing Composite Indicators: Methodology and User Guide, OECD Statistics Working Papers, OECD Publishing, Paris.
Niemeijer, D., and de Groot, R. S. (2008). A conceptual framework for selecting environmental indicator sets. Ecol. Indicators 8, 14–25. doi: 10.1016/j.ecolind.2006.11.012
Peng, G., Privette, J. L., Tilmes, C., Bristol, S., Maycock, T., Bates, J. J., et al. (2018). A conceptual enterprise framework for managing scientific data stewardship. Data Sci. J. 17:15. doi: 10.5334/dsj-2018-015
Pilat, D., and Fukasaku, Y. (2007). OECD principles and guidelines for access to research data from public funding. Data Sci. J. 6, OD4–OD11. doi: 10.2481/dsj.6.OD4
Piwowar, H. A., Day, R. S., and Fridsma, D. B. (2007). Sharing detailed research data is associated with increased citation rate. PLoS ONE 2:e308. doi: 10.1371/journal.pone.0000308
Sansone, S.-A., Cruse, P., and Thorley, M. (2018). High-quality science requires high-quality open data infrastructure. Sci. Data 5:180027. doi: 10.1038/sdata.2017.27
Simms, S., Strong, M., Jones, S., and Ribeiro, M. (2016). The future of data management planning: tools, policies, and players. Int. J. Digital Curation 11, 208–217. doi: 10.2218/ijdc.v11i1.413
Smith, L. M., Case, J. L., Smith, H. M., Harwell, L. C., and Summers, J. K. (2013). Relating ecosystem services to domains of human well-being: foundation for a US index. Ecol. Indicators 28, 79–90. doi: 10.1016/j.ecolind.2012.02.032
Submarine Telecoms (2017). Industry Report 6th Edition. Issuu. Available online at: https://issuu.com/subtelforum/docs/stfindustryreportissue6final (accessed October 15, 2017).
Summers, J. K., Harwell, L. C., Smith, L. M., and Buck, K. D. (2018). Measuring community resilience to natural hazards: the natural hazard resilience screening index (NaHRSI)—development and application to the United States. GeoHealth 2, 372–394. doi: 10.1029/2018GH000160
Summers, J. K., Smith, L. M., Harwell, L. C., and Buck, K. D. (2017). Conceptualizing holistic community resilience to climate events: foundation for a climate resilience screening index. GeoHealth, 1, 151–164. doi: 10.1002/2016GH000047
Summers, K., Harwell, L., Buck, K., Smith, L., Vivian, D., Bousquin, J., et al. (2017). Development of a Climate Resilience Screening Index (CRSI): An Assessment of Resilience to Acute Meteorological Events and Selected Natural Hazards. Washington, DC: U.S. Environmental Protection Agency.
United Nations Development Programme (2018). Human development indices and indicators: 2018 Statistical update. Available online at: http://hdr.undp.org/en/content/human-development-indices-indicators-2018-statistical-update
Vayena, E., and Tasioulas, J. (2016). The dynamics of big data and human rights: the case of scientific research. Phil. Trans. R. Soc. A, 374:20160129. doi: 10.1098/rsta.2016.0129
Wendling, Z. A., Emerson, J. W., Esty, D. C., Levy, M. A., de Sherbinin, A., et al. (2018). 2018 Environmental Performance Index. New Haven, CT: Yale Center for Environmental Law & Policy. Available online at: https://epi.yale.edu/
Keywords: resilience, indicators, data management, framework, curation
Citation: Harwell LC, Vivian DN, McLaughlin MD and Hafner SF (2019) Scientific Data Management in the Age of Big Data: An Approach Supporting a Resilience Index Development Effort. Front. Environ. Sci. 7:72. doi: 10.3389/fenvs.2019.00072
Received: 08 November 2018; Accepted: 14 May 2019;
Published: 04 June 2019.
Edited by:
Peng Liu, Institute of Remote Sensing and Digital Earth (CAS), ChinaReviewed by:
Michael Burgass, Imperial College London, United KingdomVittore Casarosa, Istituto di Scienza e Tecnologie Dell'informazione “Alessandro Faedo” (ISTI), Italy
Copyright © 2019 Harwell, Vivian, McLaughlin and Hafner. This is an open-access article distributed under the terms of the Creative Commons Attribution License (CC BY). The use, distribution or reproduction in other forums is permitted, provided the original author(s) and the copyright owner(s) are credited and that the original publication in this journal is cited, in accordance with accepted academic practice. No use, distribution or reproduction is permitted which does not comply with these terms.
*Correspondence: Linda C. Harwell, aGFyd2VsbC5saW5kYUBlcGEuZ292