 Md. Safat Sikder
 Cédric H. David
 George H. Allen
 Xiaohui Qiao
 E. James Nelson
 Mir A. Matin
- 1Jet Propulsion Laboratory, California Institute of Technology, Pasadena, CA, United States
- 2Department of Geography, Texas A&M University, College Station, TX, United States
- 3Department of Civil and Environmental Engineering, Brigham Young University, Provo, UT, United States
- 4International Centre for Integrated Mountain Development, Kathmandu, Nepal
Numerical models have become essential tools for simulating and forecasting hydro-meteorological variability, and to help better understand the Earth's water cycle across temporal and spatial scales. Hydrologic outputs from these numerical models are widely available and represent valuable alternatives for supporting water management in regions where observations are scarce, including in transboundary river basins where data sharing is limited. Yet, the wide range of existing Land Surface Model (LSM) outputs makes the choice of datasets challenging in the absence of detailed analysis of the hydrological variability and quantification of associated physical processes. Here we focus on two of the world's most populated transboundary river basins—the combined Ganges-Brahmaputra-Meghna (GBM) in South Asia and the Mekong in Southeast Asia—where downstream countries are particularly vulnerable to water related disasters in the absence of upstream hydro-meteorological information. In this study, several freely-available global LSM outputs are obtained from NASA's Global Land Data Assimilation System (GLDAS) and from the European Centre for Medium-Range Weather Forecasts (ECMWF) Re-Analysis-interim/Land (ERA-interim/Land) and used to compute river discharge across these transboundary basins using a river network routing model. Simulations are then compared to historical discharge to assess runoff data quality and identify best-performing models with implications for the terrestrial water balance. This analysis examines the effects of meteorological inputs, land surface models, and their spatio-temporal resolution, as well as river network fineness and routing model parameters on hydrologic modeling performance. Our results indicate that the most recent runoff datasets yield the most accurate simulations in most cases, and suggest that meteorological inputs and the selection of the LSM may together be the most influential factors affecting discharge simulations. Conversely, the spatial and temporal resolution of the LSM and river model might have the least impact on the quality of simulated discharge, although the routing model parameters affect the timing of hydrographs.
Introduction
South and Southeast Asia are currently home to the world's most densely populated areas (FAO, 2016). This region is also characterized by extreme hydrologic variability with ~70–80% of the total annual rainfall occurring during the short June to September window of the summer monsoon, causing flooding to be a regular annual event (Mirza, 2011; Hoang et al., 2019). In addition, the combination of climate change and anthropogenic water diversions from rivers affect the region through increased drought frequency (Khandu et al., 2016). Such demographic and hydrologic extremes together make the two principal rivers of South and Southeast Asia—the combined Ganges-Brahmaputra-Meghna (GBM) and the Mekong—some of the world's largest rivers (e.g., Dai et al., 2009) and most populous transboundary basins (Webster et al., 2010; Lakshmi et al., 2018). Surface water from these rivers provides great benefits because it helps support critical agricultural and energy production needs for over 690 million people (FAO, 2016), i.e., a tenth of the human population. Yet, the benefits of surface water also come with challenges, most notably for the downstream parts in these basins, which were determined to have the world's highest risks of exposure to floods, but also to droughts (UNEP, 2016).
In Bangladesh, which is situated in the downstream portion of the GBM basin, losses due to flooding are severely hampering the economic growth of the country. Approximately 80% of the country consists of floodplains such that, in a typical year, about a third of Bangladesh is flooded during the monsoon (Brouwer et al., 2007). During extreme flood years, two thirds of the country can be inundated for ~3 months, causing widespread devastation on the region (Mirza et al., 2003). The mean annual loss caused by normal flooding in Bangladesh is estimated about US$175 million (Mirza, 2011). The World Resources Institute ranks Bangladesh as first in the world in terms of percentage of country GDP regularly exposed to flooding and second in terms of population exposed (Priya et al., 2017).
While the Mekong River Basin is also characterized by the intensity of its wet season (Hoang et al., 2019), the most critical ongoing hydrologic challenge is the expected increase of large hydropower dams on the main stem of the Lower Mekong River (Kummu and Sarkkula, 2008; Bonnema and Hossain, 2017). The proposed construction of 11 hydropower dams on the now free-flowing river (Orr et al., 2012) is anticipated to have a significant impact on the region's ecohydrology (Pokhrel et al., 2018) and aquaculture—the Mekong contains the world's largest inland fisheries (Hecht et al., 2019). These degradations are expected to continue to grow in the future with a total of 90 and 136 dams to be built within the Lower Mekong basin by the year 2030 and 2060, respectively (Räsänen et al., 2012). Recent studies reporting a 10-fold increase from water storage capacity from 2 to 20% of annual flow by 2025 indicate that the drastic impacts of the proposed dam constructions on fisheries, agriculture, and the environment are likely to persist (Kummu et al., 2010; Hecht et al., 2019).
The high population density and hydrologic extremes in South and Southeast Asia therefore pose a variety of challenges to water management. The transboundary aspect of river basins in the area and associated geopolitical challenges in data sharing make water management endeavors rely heavily on simulations from computer models (Hossain et al., 2014). Much of the existing literature in the region has therefore focused on detailed hydrologic modeling endeavors with locally-tailored models (e.g., Nishat and Rahman, 2009; Hossain et al., 2017). In the case of Bangladesh, much effort has been dedicated to flood mitigation through forecasting to further the economic progress and food security with particular emphasis on increased lead time of flood forecasting systems (CEGIS, 2006; Webster et al., 2010), i.e., the latency between available forecasts and real-time events. Other notable applications include the flood forecasting system of Sikder and Hossain (2018), and antecedent studies of hydrologic and hydraulic model development (e.g., Siddique-E-Akbor et al., 2014; Maswood and Hossain, 2015).
Similarly, the planned and ongoing development of hydroelectric dams in the Lower Mekong Basin has been a subject of intense national and international argument for the stakeholder countries of the Mekong basin and numerical models have played an important role in such debate. Hanington et al. (2017) showed how hydrological models can be used for water resources planning and management in the Mekong delta to support the agricultural production. Räsänen et al. (2012) studied the hydrological impact of the proposed dams on the downstream portion of the Mekong basin. Haddeland et al. (2006) and Tatsumi and Yamashiki (2015) investigated the effect of water diversions on the water and energy balances of the Mekong basin using hydrological models. Hoang et al. (2019) used a hydrological model to study the impact of climate change, construction of dams and flow diversion on the future flow of the Mekong river. Similar efforts by Johnston and Kummu (2012) and Pokhrel et al. (2018) have studied the expected evolution of the Mekong water resources in in the context of a changing climate.
Besides the aforementioned water resources applications of hydrologic models in the GBM and the Mekong basin, Land Surface Models (LSMs) are also used as a core tool for understanding the spatio-temporal variation of hydro-meteorological variables and associated physical processes. The importance of understanding the water cycle and quantifying its various fluxes using LSMs is even more acute in the case of ungauged and transboundary regions, where such data can prevent large-scale disasters (Siddique-E-Akbor et al., 2014; Murshed and Kaluarachchi, 2018). At this time, several operational global LSMs are producing continuous estimates of different hydrological fluxes, which can be used as an easily-accessible alternative to locally-tailored hydrological models. Numerous studies have used these readily available LSM outputs to analyze different components of the water cycle. For example, Lakshmi et al. (2018) quantified water availability in the world's major river basins using the Global Land Data Assimilation System (GLDAS) model outputs (Rodell et al., 2004).
Perhaps the most widespread use of GLDAS or other global LSMs in South and Southeast Asia is along with the Gravity Recovery and Climate Experiment (GRACE) data to determine groundwater fluctuations and changes in water storage. Rodell et al. (2009) and Chinnasamy et al. (2015) used GLDAS soil moisture along with GRACE to estimate the groundwater depletion rate in North India. Khandu et al. (2016) used GRACE along with soil moisture estimates from different LSMs to estimate the influence of precipitation extremes on the Total Water Storage (TWS) in the GBM basin. A recent study by Murshed and Kaluarachchi (2018) used GLDAS soil moisture data to estimate freshwater availability in the Ganges Delta and demonstrated how LSMs can be used to identify the complex issues of water security.
Global LSM outputs are also often applied throughout the world's largest basins for comparison and validation against satellite-derived data. Syed et al. (2008) used GLDAS and GRACE separately to characterize the Terrestrial Water Storage Change (TWSC) in major river basins and found a good agreement in satellite- and model-derived TWSC. Rodell et al. (2011) used GRACE and other observed and modeled data together to estimate evapotranspiration for a few major river basins and compared the results with models. Chen et al. (2013) compared the Advanced Microwave Scanning Radiometer—Earth Observing System (AMSR-E) and all four GLDAS LSM-derived soil moisture with the in-situ station averaged soil moisture data in the Tibetan Plateau and reported that three out of four GLDAS LSMs perform better than the satellite product in that region, though the LSMs generally underestimated soil moisture.
Global LSM data products therefore have strong potential for practical applications in ungauged and transboundary river basins, including in South and Southeast Asia, and the accuracy of these models is therefore critical for associated water resources management endeavors (Wang et al., 2011). For these LSMs to be most useful, they must be validated against in-situ data in anticipation for practical (i.e., “real-world”) applications, as done previously in several published studies. Berg et al. (2005) used GLDAS and NLDAS models to prepare hydro-meteorological forcing data (i.e., the continuous input data used to run the model) for global soil moisture estimation and compared their simulations with in-situ soil moisture data to find good agreement between the anomaly of observed and modeled soil moisture. Similarly, Bi et al. (2016) used in-situ soil moisture data to validate the GLDAS LSMs in the Tibetan Plateau and found that models can accurately capture the temporal variations, but systematically underestimate soil moisture. However, validating LSMs using distributed hydrological fluxes is challenging, since the evaporation, soil moisture, and groundwater are difficult to measure in-situ, and in-situ measurements only capture the local state.
River flow does not face the same distributed challenge because it is the integration of all upstream hydrologic processes and many in-situ discharge datasets in the major rivers of the world have continuous record. Therefore, river discharge can also be used to validate global LSM simulations, granted that the discharge is routed correctly (Zaitchik et al., 2010), the effects of anthropogenic activities in hydrological processes are addressed properly, and noting that observations are often difficult to obtain (Hossain et al., 2014). Such a validation is critical because it allows for the verification of the LSM estimates in an integrated manner. Yet, most of the validations of existing operational LSMs using river flow have been conducted in data-rich regions of the world. For example, Mitchell et al. (2004) used the in-situ discharge of the Contiguous United States (CONUS) to validate the North American Land Data Assimilation System (NLDAS). Xia et al. (2012b) updated the same validation study using the LSMs of NLDAS-2. In contrast, very few studies were conducted in other parts of the world. To the extent of our knowledge, only Zaitchik et al. (2010) used discharge estimates for the world's major rivers to validate GLDAS, and identified that the four LSMs of GLDAS performed differently and with distinct geographic patterns to estimate the river flow. They also found that the choice of meteorological forcing has a notable impact in the simulated discharge.
Recently-updated global LSM products (e.g., GLDAS-2) are now available but have not yet been evaluated against observed river flow. Such a validation effort is particularly needed for the transboundary river basins of South and Southeast Asia where global LSMs can provide valuable estimates of water fluxes and states. In this context, the primary goal of this study is to identify optimal global LSMs for estimating river flow in South and Southeast Asia. Furthermore, the accuracy of the model-simulated river discharge can be expected to be sensitive to the choice of the LSM, meteorological forcing, spatio-temporal resolution of the models, and routing model parameters. A secondary goal of this study is hence to identify the most influential factors affecting the accuracy of the simulated flow.
This paper is organized as follows. Section Model and Data describes the data and models used in this study, including the global LSMs, the river routing model, and the in-situ discharge data. The Methodology follows in section Methodology and section Results and Discussions describes our results and discusses our analysis. Finally, section Conclusions presents our conclusions.
Model and Data
Land Surface Models
Several publicly available LSM outputs from different projects were considered for this study. Model outputs from 2001 to 2009 were used for river routing simulation and preliminary analysis. This time window was carefully chosen to ensure that the data from all global LSMs considered are available. A list and the details of these LSMs are provided in Table 1, and further discussed below.
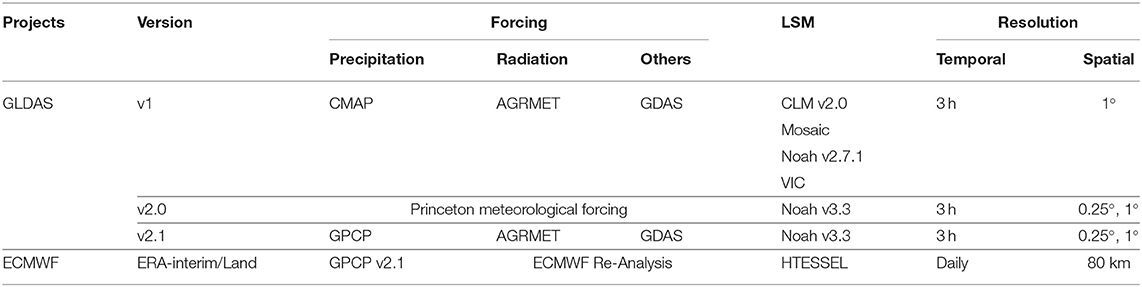
Table 1. Details of the Land Surface Model (LSM) outputs used in this study.
The GLDASv1 (denoted by GLDAS hereafter) consists of four different LSMs. These models are the Mosaic model (Koster and Suarez, 1996), the Noah model (Chen et al., 1996; Koren et al., 1999), the Common Land Model (CLM) (Dai et al., 2003), and the Variable Infiltration Capacity (VIC) model (Liang et al., 1994). A combination of meteorological datasets were used as the input (i.e., “forcing”) for these LSMs: the National Oceanic and Atmospheric Administration (NOAA) Global Data Assimilation System (GDAS) atmospheric analysis fields, the spatio-temporally disaggregated NOAA Climate Prediction Center Merged Analysis of Precipitation (CMAP) fields, and the Air Force Weather Agency's AGRicultural METeorological modeling system (AGRMET) method based in-situ downward shortwave and longwave radiation fields. The GLDASv1 outputs are available from January 1979 to date. More details about these models can be found in Rodell et al. (2004) and Rui and Beaudoing (2017).
An updated GLDAS is now available and denoted GLDAS-2. Two different versions of GLDAS-2 are available: GLDASv2.0 and GLDASv2.1. Both GLDASv2.x used more recent meteorological forcing than GLDAS in a unique LSM which is a newer version of Noah. GLDASv2.0 used the Princeton meteorological forcing data (Sheffield et al., 2006) that is available from January 1948 to December 2010. GLDASv2.1 used a combination of NOAA/National Center for Environmental Prediction's GDAS atmospheric analysis fields, the spatio-temporally disaggregated Global Precipitation Climatology Project (GPCP) precipitation fields, and the updated AGRMET downward shortwave and longwave radiation fields as the forcing data. Other enhancements in GLDAS-2 include switching to MODIS based land surface parameter datasets, and initialization of soil moisture over desert (Rui and Beaudoing, 2019). The model outputs of GLDASv2.1 are available for the period of January 2000—present.
Another set of global LSM outputs is available from the European Centre for Medium-Range Weather Forecasts (ECMWF). These simulations used the ECMWF Re-Analysis (ERA)-Interim data and the GPCPv2.1 adjusted precipitation field as forcing for the latest version of the Hydrology-Tiled ECMWF Scheme for Surface Exchanges over Land (HTESSEL) LSM to produce the ERA-Interim/Land products. The outputs of this model are covering a period of January 1979 to December 2010. More details of this dataset can be found in Balsamo et al. (2012, 2015).
River Network Routing Model
The Routing Application for Parallel computatIon of Discharge (RAPID) (David et al., 2011) is used as the river routing model in this study to derive the daily flow throughout the river basins. RAPID uses the Muskingum method (McCarthy, 1938) to calculate flow at all nodes of a given river network using surface and subsurface runoff from an LSM as inputs. One of the key advantages of RAPID is that it can efficiently be executed in a parallel computing environment by using a matrix form of the Muskingum method. More detailed descriptions of the Muskingum method and its use to propagate runoff from LSMs are available in David et al. (2011). The river network data for this study were obtained from the Hydrological Data and Maps Based on Shuttle Elevation Derivatives at Multiple Scales (HydroSHEDS) (Lehner et al., 2008). The fine resolution river network was directly extracted from the 15 arc second HydroSHEDS river network. The coarse river network was derived from the upscaled 0.1° HydroSHEDS grid (Alfieri et al., 2013; Snow, 2015). Apart from the given surface and subsurface runoff from any LSM and a given river network, the basic model setup requires two sets of model parameters. These parameters are the Muskingum dimensionless diffusion coefficient (denoted by x) and flow wave propagation time (denoted by k); and the parameters can vary spatially on a reach-by-reach basis although they are temporally constant.
Observed Discharge Data
Observed river flow data for different locations of the GBM and Mekong river basins were obtained from the Bangladesh Water Development Board (BWDB) and the Mekong River Commission (MRC), respectively. The location of these in-situ discharge stations are shown in Figure 1. The GBM discharge data were available for the entire routing model simulation period (2001–2009). The Mekong river flow data were available up to 2007 in a few stations, while the data were available up to 2006 in most stations. Therefore, the in-situ flow data in between 2001 and 2006 were considered for the performance analysis of the daily flow in all river stations for consistency. All available in-situ flow stations downstream of the Tonlé Sap Lake were excluded from the analysis due to its complex hydrological behavior.
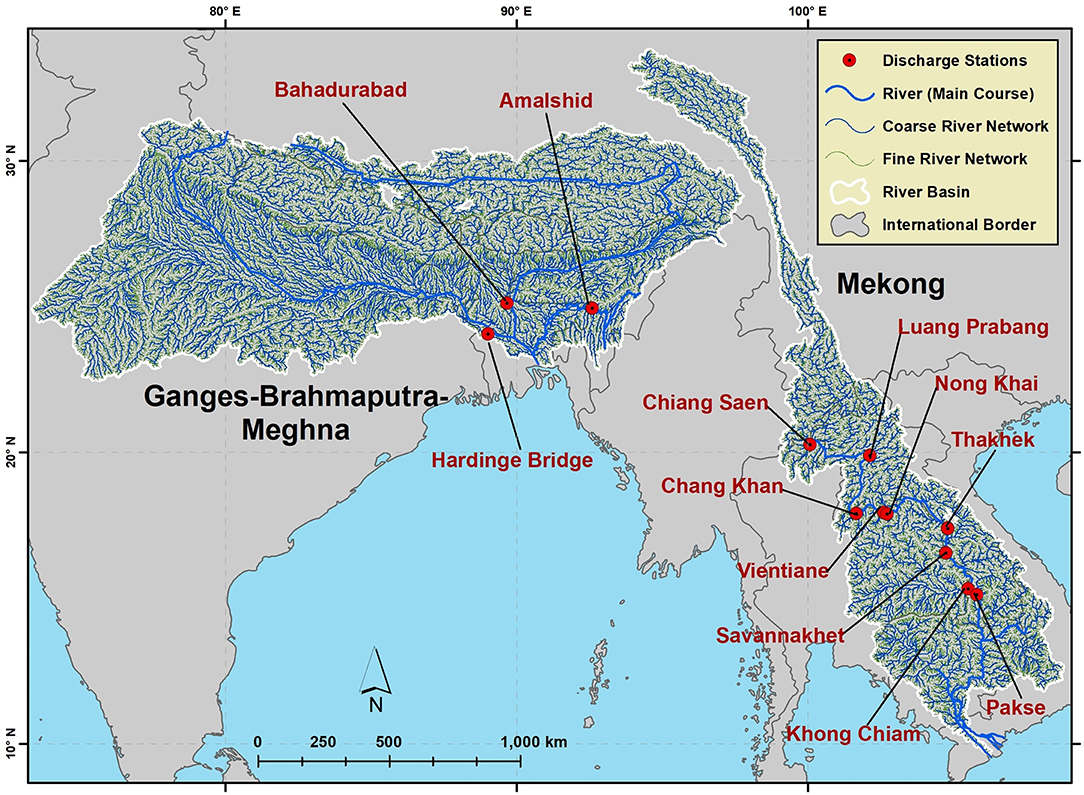
Figure 1. Location of the Ganges-Brahmaputra-Meghan (GBM) and Mekong river basins along with the in-situ discharge stations. The fine and coarse river networks used for flow routing are shown in the background.
Methodology
The primary objective of this study is to evaluate the performance of each global LSM in South and Southeast Asia by comparing routed runoff from a river model to daily in-situ river flow observations. The secondary objective is to identify the factors that significantly affect the simulated flow. To get a preliminary perspective on the relative performance of each LSM, the basin-averaged mean annual precipitation, evapotranspiration, and runoff were computed. At first, the basin-scale mean annual water budget error analysis was carried out in a way similar to Xia et al. (2012a) who used 28 years of data to evaluate LSM performance in the CONUS. In this study, the mean annual total model input (i.e., precipitation) and mean annual total model outputs (i.e., evapotranspiration, Runoff) were compared while assuming that the change in water storage for a long-term average should be negligible or close to zero. Here, 9 years of data (2001–2009) were used, and the difference between the mean-annual total input and output was reported as a percentage of the total input (i.e., precipitation). Note that the assumption of water balance closure over a 9-year period can be debated in light of the numerous past studies highlighting the effect of groundwater extraction on the terrestrial water balance (e.g., Rodell et al., 2009; Purdy et al., 2019) although it is justified in this study given our intended focus on readily-available LSM outputs. We define the mean annual percentage error in water budget as:
Where, error, ET, Qs, Qsb, Rain, Snow are for the area-averaged water budget error, the LSM simulated evapotranspiration, surface runoff, sub-surface runoff, input rainfall, and snowfall, respectively.
The evapotranspiration-precipitation and runoff-precipitation ratios were also derived from the area averaged mean annual variables. The spatio-temporal averaged runoff was then compared to the observed mean annual discharge, itself derived from the in-situ discharge of the most downstream station of each river basin. These stations are the Pakse, Hardinge Bridge, Brahmaputra, and Amalshid in the Mekong, Ganges, Brahmaputra, and Meghna basins, respectively (Figure 1). Note that all the area-averaged values discussed above were calculated with respect to these downstream in-situ stations. Therefore, the area covered by the spatio-temporal averaged variables is the same as the upstream basin area of each station (i.e., not the entire basin but a significant portion of it).
The river network routing model (i.e., RAPID) was then used to derive the daily flow at multiple locations in the river basins, and compared with available in-situ discharge data. To identify the factors that affect the simulated flow significantly, the simulated daily flows were compared to the observed discharge while varying the choice of the LSM, atmospheric forcing, model resolution, and routing parameters. Several experimental setups were therefore designed to reveal the relative impact of these four different design factors on the simulated flow. The comparisons were performed using a series of five traditional metrics: correlation coefficient, Nash–Sutcliffe efficiency (NSE), root mean square error (RMSE), bias, and standard error.
The impact of the choice of the LSM was first assessed. Since GLDAS uses the same forcing in four different LSMs, data only from this version (i.e., GLDASv1) were used for this initial analysis. The ECMWF ERA-interim/LAND derived daily flow was also used here for comparison with the other four LSMs, although the forcing data and the LSM resolution of ECMWF are different. To be consistent, in all cases the routing model was executed using the fine resolution river network. The name of each test case contains the project name and version, LSM name, model spatial resolution (i.e., 10 for 1° LSM outputs), and the river network resolution. For example, the name for the GLDAS Mosaic derived flow from the 1° runoff using the fine river network is: GLDAS-MOS10-Fine.
Precipitation—the primary input of water to land surface models—and other meteorological inputs are also sources of uncertainty in simulated streamflow. Therefore, a performance analysis was conducted for different forcing inputs to the same LSM. The Noah LSM outputs are available which was forced by different meteorological datasets; GLDAS, GLDASv2.0, and GLDASv2.1. Although GLDAS-2 products are available in two different spatial resolutions (i.e., 0.25 and 1°), only 1° resolution LSM products were used here for consistency with GLDAS. Like the previous experiment, the daily flow was derived using only the fine resolution river network in all cases, and the ECMWF ERA interim/LAND derived daily flow was used here as reference. It is important to note that the Noahv2.7 was used in GLDAS, while both GLDAS-2 versions used Noahv3.3 as the LSM. Also, the LSM used with the ECMWF ERA interim data was different from Noah, and has a different model resolution (~80 km). The experimental design nomenclature remains similar, but different GLDAS (i.e., v1, v2.x) versions were used here.
In a third experiment, models with different spatio-temporal resolutions were used. To control for LSM and forcing variabilities, only the GLDASv2.1 was used here with different spatial and temporal resolution, and discharge was simulated using fine (~5 km) and coarse (~20 km) river networks (Figure 1). The GLDASv2.1 (Noah LSM) model outputs are available in 0.25 and 1° spatial resolution and with 3 h temporal resolution. The 3 hourly data were temporally averaged to derive daily forcing for the routing model with different temporal resolutions (i.e., as daily LSM input). The name of each test case starts with the project name and version, followed by the LSM name, resolution (i.e., 10 and 025 for 1 and 0.25°, respectively), temporal resolution only for the daily scale (i.e., D) and the river network resolution (i.e., fine or coarse). For example, both GLDASv2.1-NOAH025-Coarse and GLDASv2.1-Noah025D-Coarse stand for the simulated river flow using the coarse river network with the 0.25 GLDASv2.1 Noah LSM output, but for the 3-hourly and daily temporal resolutions, respectively.
In a final experiment, river routing simulations were performed by changing the two parameters of the routing model (i.e., RAPID). These parameters are the diffusion coefficient (denoted by x) and propagation time (denoted by k) of the Muskingum method. Although, it is possible to vary sets of parameters independently for each reach in RAPID, it is not practical to do so for the large river basins with numerous river reaches used here. Therefore, both sets of parameters were first determined and subsequently changed through multiplication by a spatially-constant scale factor from experience. The initial values of the storage constants (k) of all cells of the model were determined from a spatiotemporally-constant wave celerity of 1 km/h while accounting for the variable length of river reaches. Similarly, the weighting coefficients (x) were initially set to the commonly accepted value of 0.1. Note that no specific parameter calibration is performed in this study. All the test simulations were then conducted using the ECMWF ERA interim/LAND outputs. The name of each test case starts with the model name and followed by the k scale factor (i.e., k02 and k035 for k scale factor 0.2 and 0.35, respectively), the x scale factor (i.e., x2, x3, and x4 for x scale factor 2, 3, and 4, respectively), river network resolution. For example, ERAi-Land-k02-x3-Coarse means the RAPID model was simulated using the ECMWF ERA interim/LAND with coarse resolution river network, while the scaling factor for k and x were 0.2 and 3, respectively. Note that the values of the scale factors are based on accepted ranges of values (e.g., Fread, 1993) and on past experience from previous RAPID studies (e.g., David et al., 2011).
The timing of hydrograph is also a concern for discharge simulations and motivate the use of an additional metric. To determine the accuracy of the hydrograph timing, a lagged cross-correlation was used (e.g., David et al., 2011; Allen et al., 2018). The lagged cross-correlation determines the correlation between two timeseries as a function of lag that is added between them. Optimal simulations flow should therefore show the maximum correlation with observations when the lag time is zero. The lagged cross-correlation between the simulations and observations is shown in Equation (2).
Where, ρ, Qob, Qsim, t, and τlag are the lagged cross correlation, observed flow, simulated flow, time step, and lag time, respectively.
A maximum of 10-day lag time was considered in this study, and correlations between the observed and (–)10-day to (+)10-day temporal offset of the simulated flow were calculated.
Results and Discussions
The analysis of the mean annual water budget following Equation (1) is summarized in Table 2 where the errors are shown here as a percentage of the input (i.e., precipitation). Assuming steady state, the error should be close to zero for the most optimized LSM, hence demonstrating that the water balance is properly satisfied. Our results show that the overall performance of the newer versions of GLDAS (i.e., GLDAS-2) and ECMWF is better in terms of the accuracy in water balance. Among the four LSMs of GLDAS, CLM is maintaining the lowest water balance errors in all the river basins, while Mosaic shows the largest errors. Additionally, and although all the four GLDAS models are using the same input data, the variation in water balance errors is significant within these LSMs. This may be due to differences in the fluxes and storage within soil layers given that the number of soil layers and their associated depths differ among models. The Mosaic model has three soil layers up to 350 cm below the ground, while the Noah model is using four soil layers up to 200 cm. CLM and VIC are using ten layers up to 343.3 cm and three layers up to 190 cm depth, respectively (Bi et al., 2016; Rui and Beaudoing, 2017).
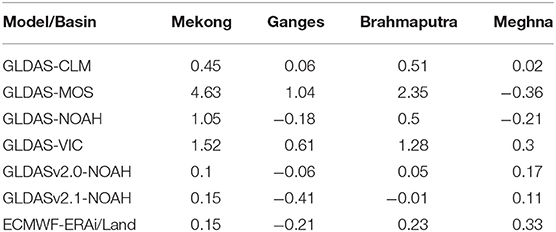
Table 2. Mean annual error in model water budget with respect to the input precipitation (%).
The evapotranspiration-precipitation ratio was then used to evaluate the models, as shown in Figure 2, and suggests that the newest projects (i.e., GLDAS-2 and ECMWF) have relatively similar behaviors throughout all river basins (with little ET/P ratio variability on a per-basin basis) while the earlier GLDAS LSMs (i.e., GLDASv1) have inconsistent behaviors (high ET/P variability in each basin). Although consistency among different models cannot be directly linked to simulation quality, it does add confidence in simulations. CLM may be showing the closest evapotranspiration-precipitation ratio to the newer version of the models. However, if the mean annual evapotranspiration (Figure 2, values are reported above the bars in mm/year) is considered in place of the ratio, then VIC and Noah appear to be the closest to the newer version of the models and CLM would underestimates the mean annual evapotranspiration. A similar pattern was found by Xia et al. (2012b), where simulated evapotranspiration was compared with observations for the CONUS using the NLDAS-2, and where VIC and Noah produce similar evapotranspiration. The GLDAS-2 and ECMWF were forced with similar amounts of input precipitation (Figure 2, values are reported below the bars in mm/year), while the GLDAS LSMs were forced with low-biased precipitation relative to GPCP (Rui and Beaudoing, 2019). The case of the Ganges basin may be of particular interest here, given that the amounts of input precipitation are all very close in GLDAS, GLDAS-2, and ECMWF. In this basin, CLM shows consistently lower evapotranspiration-precipitation ratios, while Noah is more consistent with newer simulations in GLDAS-2 and ECMWF. Our experiments are therefore generally inconclusive in recommending a specific LSM for evapotranspiration given that both evapotranspiration-precipitation ratio and precipitation itself both vary greatly in available experiments. However, the expected increase in the quality of precipitation dataset and the consistency of precipitation and evapotranspiration-precipitation ratios among latest projects provides some level of confidence in GLDAS-2 and ECMWF simulations.
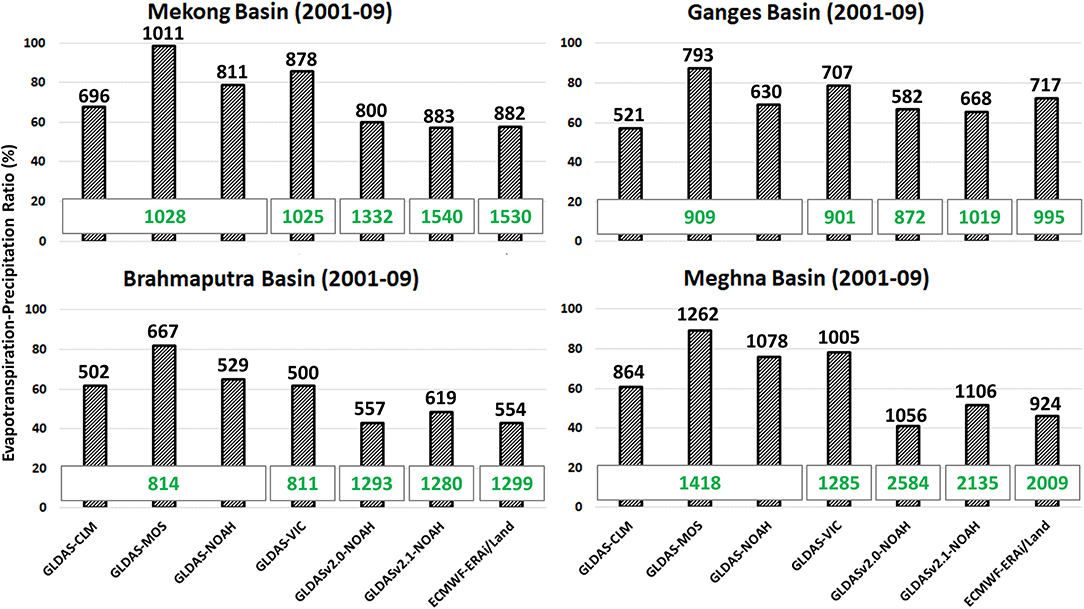
Figure 2. Mean annual Evapotranspiration-Precipitation ratio the Mekong and GBM basins. All the values shown above the bars and in the boxes are the simulated mean annual evapotranspiration and input precipitation in mm, respectively.
Similarly, the runoff-precipitation ratio was derived (Figure 3) along with the model simulated mean annual runoff values (Figure 3, above the bars in mm/year) and the observed mean annual runoff (Figure 3, on top of the charts). Here again GLDAS-2 and ECMWF are showing similar results, although the comparison with observed runoff (computed from observed discharge) is here able to confirm better performance in terms of mean annual runoff for the most recent projects. All the four earlier GLDAS LSMs are consistently underestimating runoff which is perhaps due to underestimated precipitation for this earlier dataset. CLM appears to perform relatively better in terms of runoff compared to the other GLDAS LSMs. This may be related to CLM's underestimation of evapotranspiration combined with lower amounts of input precipitation (Figure 2), generating relatively larger runoff. However, CLM also overestimates runoff in the Ganges basin due to more accurate precipitation there, which is associated with the underestimated evapotranspiration by CLM in Ganges basin. This confirms that a more accurate precipitation as input in the earlier GLDAS LSMs could have changed their accuracy. In general, GLDAS-2 and the ECMWF provide more accurate runoff estimation, in addition to low errors in annual water balance (Table 2). However, all LSMs significantly underestimate runoff in the case of the Brahmaputra basin, which may be due to unrealistic runoff-precipitation ratios or flawed amounts of precipitation in that basin.
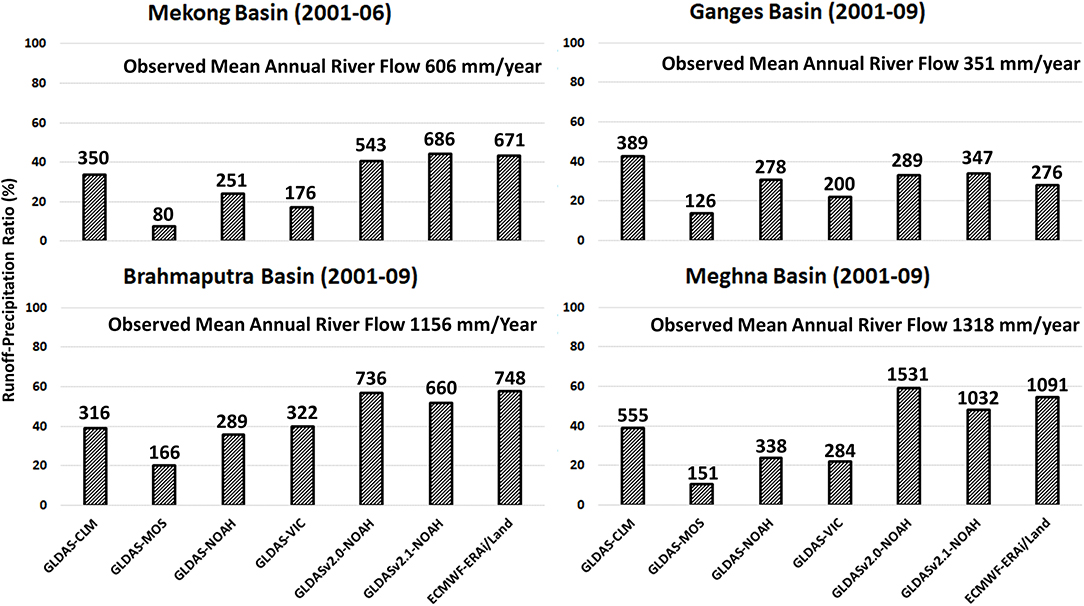
Figure 3. Mean annual Runoff-Precipitation ratio of the Mekong and GBM basins, along with the observed mean annual river flow. All the values reported above the bars are the simulated mean annual runoff in mm. Analysis for Mekong basin was conducted up to 2006, constrained by the in-situ river flow data availability.
The RAPID model was then used to derive daily flows from available global LSMs runoff throughout river basins and simulated flows were compared with the in-situ measurements. The analysis was carried out for the four aforementioned experimental setups, since the simulated flow may be sensitive to the selection the LSM, meteorological forcing, model resolution, and model parameters. A sample output of RAPID simulation is shown in Figure 4 for the Pakse station in the Mekong basin where the simulated and observed discharge are plotted as a function of: different LSMs (Figure 4A), different meteorological forcing (Figure 4B), different spatio-temporal resolutions of the models (Figure 4C), and different river network routing model parameters (Figure 4D). Note that the number of test cases considered in each experiment differs; and that this lack of consistency in the number of ensembles of the experimental setup may impede the fairness of comparisons. However, the ensemble sizes for the first two experiments (i.e., for different LSMs and different meteorological forcing) is dictated by data availability and beyond our control. Nevertheless, this preliminary analysis suggests that the simulated flow is mostly influenced by the selection of the LSM and by the meteorological forcing than it is influenced by the spatio-temporal resolution of the models and by the routing model parameters. Further analysis was conducted in all discharge stations of Figure 1 for these four different design factors using the correlation, NSE, RMSE, bias, and standard error, as discussed below.
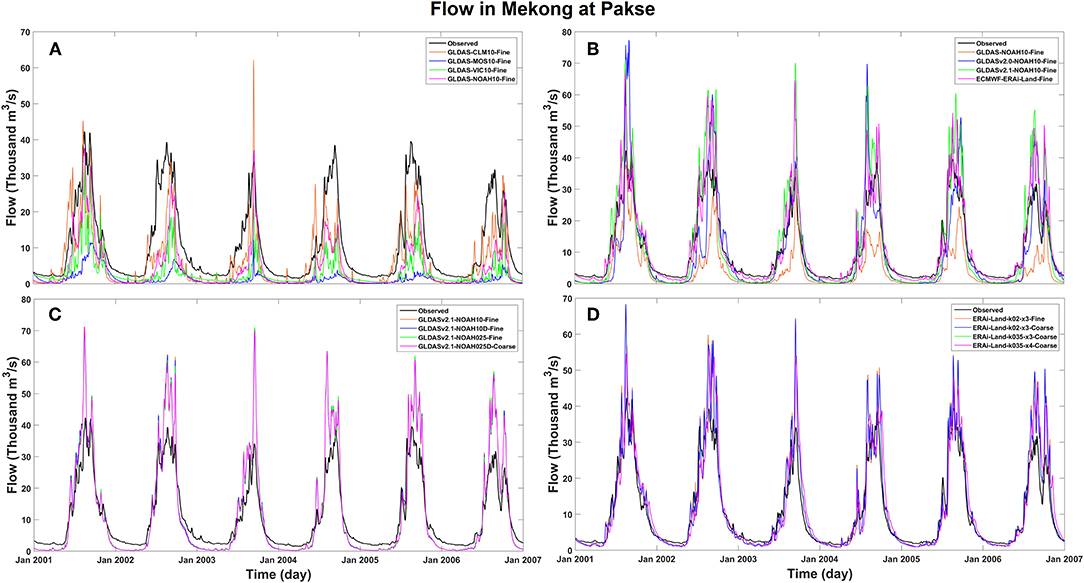
Figure 4. Example of the simulated daily flow hydrograph in the Mekong basin as a function of different (A) LSM, (B) input forcing, (C) spatio-temporal resolution of LSM and routing model, and (D) routing model parameter. Observed river flow is shown in black line.
Figure 5 shows the evaluation of the global LSMs as a function of different land surface models used. In this experiment, all the four models of GLDAS were considered, which were forced by the same meteorological data. Outputs using the ECMWF—forced with a different set of data—are also shown as a reference for comparison. Based on the five metrics used in this analysis (Figure 5), the selection of the LSM is an influential factor in river discharge simulations, as expected because LSMs are responsible for determining the amount of runoff that is available as inputs to rivers. The NSEs show that CLM performs consistently better among the other GLDAS LSMs. This can be explained by the low estimation of evapotranspiration in CLM combined with the underestimated precipitation forcing in GLDAS. CLM produces relatively higher runoff among the GLDAS LSMs, which is closer to the in-situ discharge observations. Overall, the model biases show that the GLDAS generally underestimates runoff likely in part due to the underestimated precipitation forcing. It is also worth noting here that the discharge estimates obtained from the ECMWF LSM runoff are far superior to that of the GLDAS LSMs, for all stations considered, although the determination of the underlying reasons for the relative higher quality is beyond the stated scope of this study.
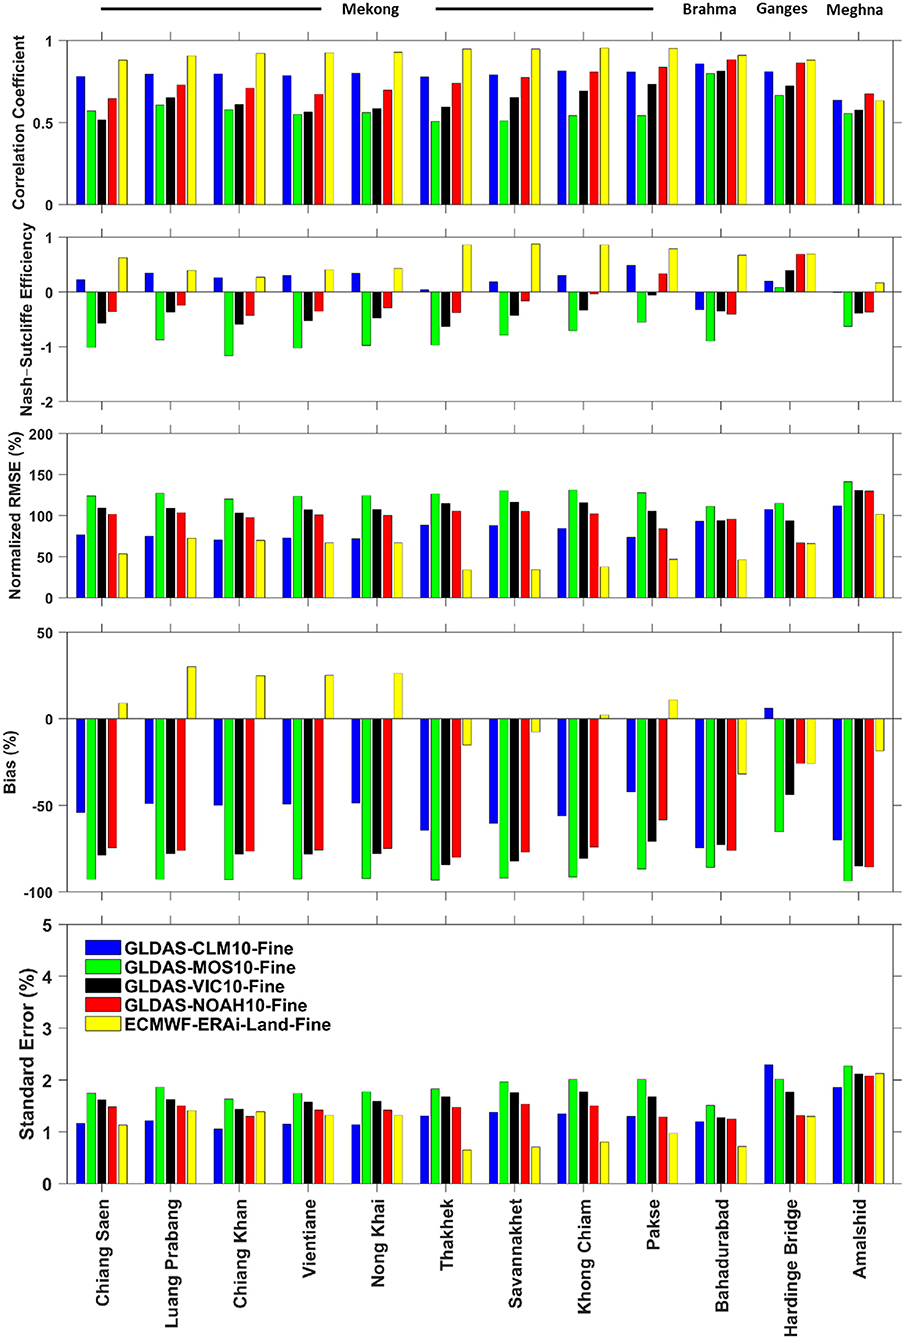
Figure 5. Performance of simulated daily stream flow at different locations of the Mekong and GBM basin as a function of different LSMs. All the GLDAS LMSs in this experiment were forced with the same meteorological inputs. ERA-interim/Land from ECMWF (with different resolution and uses a different meteorological forcing) is shown here as a reference.
Figure 6 shows the evaluation metrics for the simulated river flow at multiple locations as a function of the meteorological forcing used. To be consistent, we focus on the Noah model with different meteorological forcing. The ECMWF-based simulations are also shown for reference, as done in the previous analysis. Clearly, the forcing also has an impact on the accuracy of the simulated flow, particularly in model bias. This impact on simulated flow is also to be expected because precipitation is a key driver of the terrestrial water cycle. Figure 6 suggests that the updated precipitation forcing in GLDAS-2 helps reduce the aforementioned negative bias of the simulated river flow and improves model accuracy, which is evidenced by the high NSE values obtained. The performance of the ECMWF and GLDASv2.1 is similar in most cases. Yet, the ECMWF performs better for all in-situ stations except the Meghna, where the GLDASv2.1 metrics are slightly better. The accuracy of the simulated flow using GLDASv2.1 is greater than that of GLDASv2.0, and is followed by that of GLDAS.
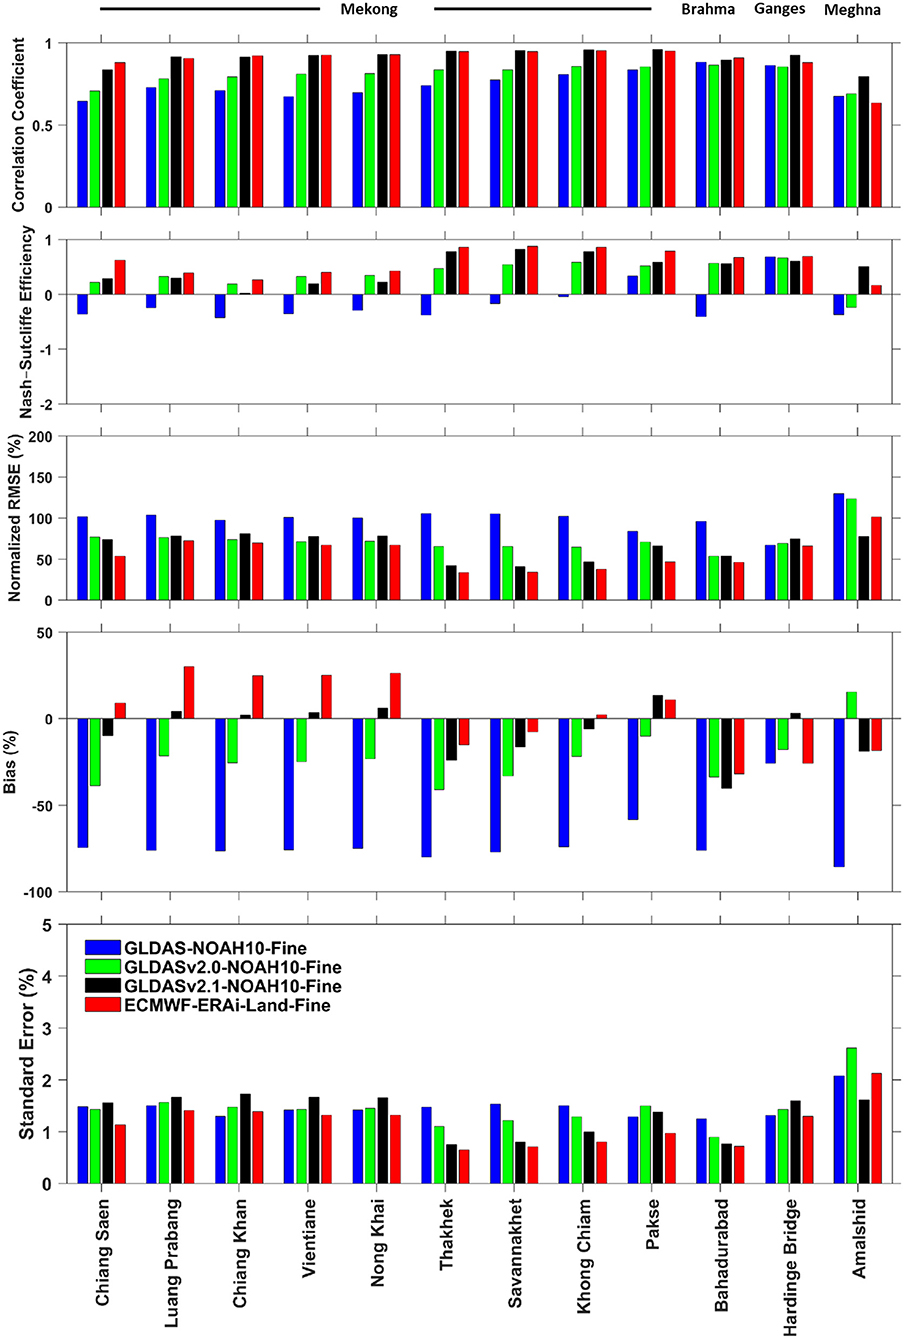
Figure 6. Same as Figure 5, but as a function of different meteorological forcing in the same LSM (i.e., Noah model).
The simulated flows are then evaluated for different spatio-temporal resolutions of the LSMs and for the spatial resolution of the river routing model (Figure 7). This analysis was carried out for 3-hourly and daily LSM data with 0.25 and 1° spatial resolution and using both fine and coarse resolutions for the river network used in the RAPID model. Surprisingly, despite these rather different spatio-temporal resolutions, Figure 7 shows that the performance in all cases is very similar. The linearity of the Muskingum equations that drive the RAPID model may be the source of this similarity in discharge outputs. The analysis was repeated using a few smaller catchments (e.g., 2,000–5,500 km2) within the Mekong basin (not shown here) and suggests some sensitivity of the simulated flow to varying spatial resolutions of LSM (i.e., 0.25 or 1°), which may be explained by the boundary of the smaller catchments being better defined by the fine resolution grid, also such effect remains limited.
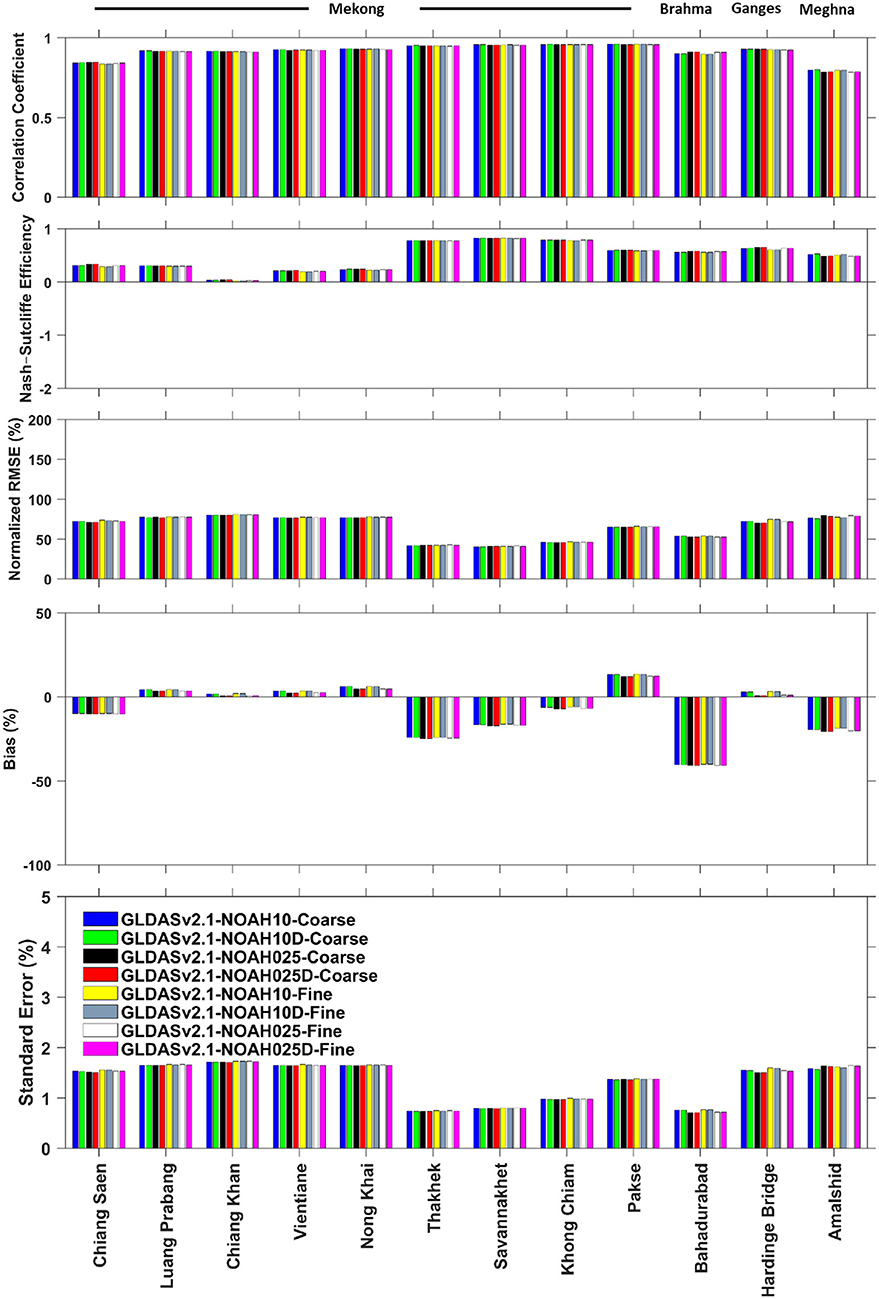
Figure 7. Performance of simulated daily stream flow as a function of different spatio-temporal resolution of the same LSM using the same meteorological forcing (i.e., GLDASv2.1-NOAH). Here, NOAH10 and NOAH025 are for different spatial resolutions, 1 and 0.25°, respectively. The LSM outputs in daily scale, denoted here by “D,” and the other test cases (i.e., without “D”) are for 3-hourly LSM outputs. The last part of each test case name is representing the river network resolution (Figure 1) used for flow routing.
The influence of the routing model parameters was also evaluated for the simulated river flow (Figure 8). The river flow was simulated using the ECMWF model runoff data with different weighting coefficient (x) and storage constant (k) scale factors. The analysis shows that the variation in simulated flow accuracy due to different routing model parameter is not as significant as the selection of the LSM or that of the meteorological forcing. Note here again that the number of test cases in this experiment (i.e., different routing model parameter) is different from the number of test cases considered for different LSMs and meteorological forcing. However, it is to be expected that the storage constant should have an influence on the timing of hydrograph, since this parameter is related to the time of concentration of the basin. This variation is not visible with the five metrics used in this analysis, possibly due to the large temporal window of the analysis (i.e., 6 year). Therefore, an additional metric was used here to determine the accuracy in the timing of the simulated hydrograph.
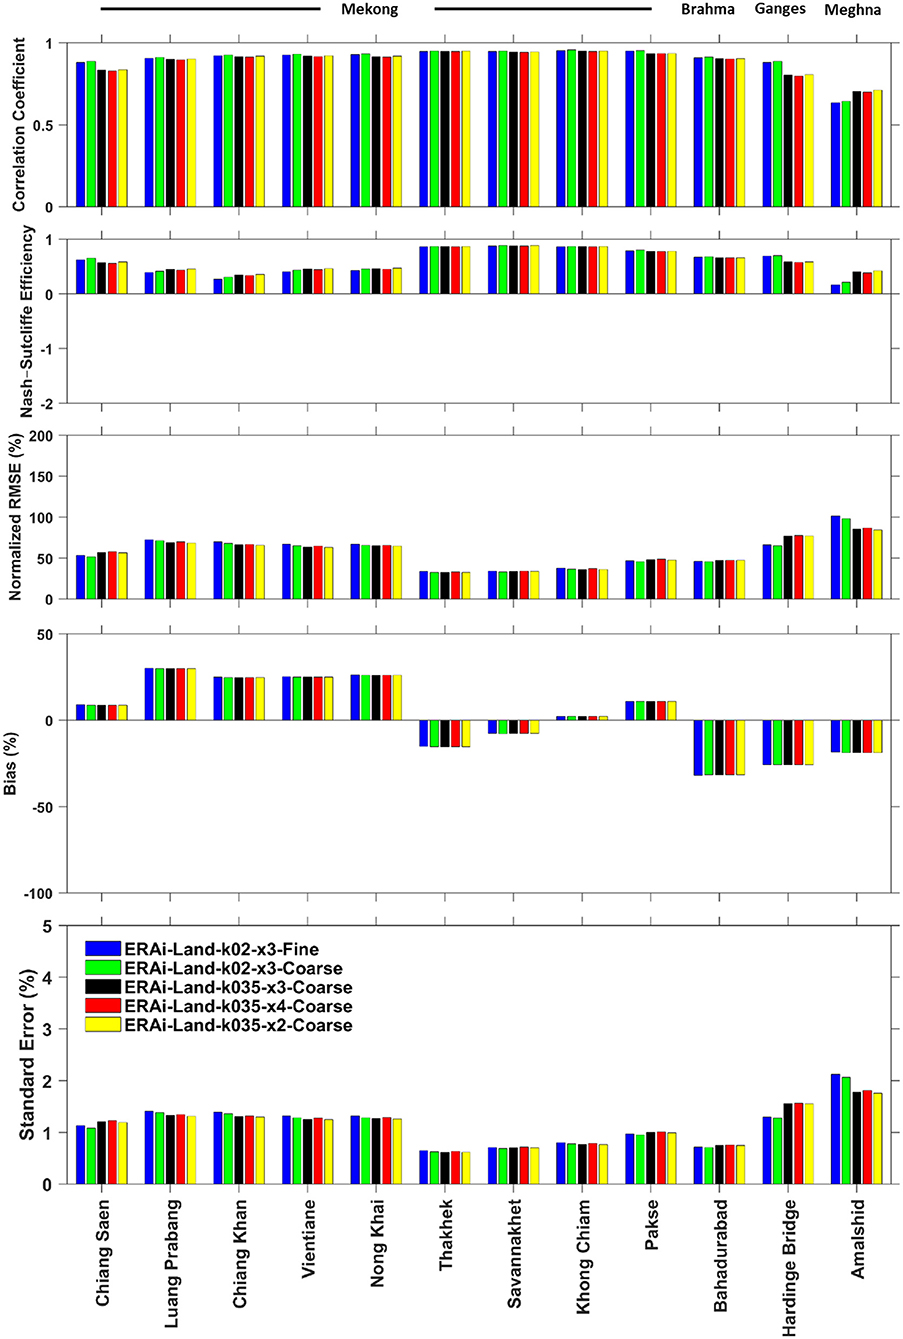
Figure 8. Sensitivity of using different flow routing parameters at different locations of the Mekong and GBM basins. All the routing simulations were conducted with the same LSM outputs (i.e., ECMWF-ERA-interim/Land).
The lagged cross-correlation was hence calculated by applying a temporal offset to the simulated flow and determining the lag for which the cross-correlation with observed data was highest. The results of this analysis are shown in Figure 9, where the lag time of the simulated flows corresponding to the maximum correlation with the observed flows are reported. This analysis was carried out for the simulated flow with different routing model parameters (Figure 9A), as well as for different LSM with different meteorological forcing (Figure 9B). Figure 9A illustrates that the timing of hydrograph influenced by the storage constant (k), as expected. Therefore, while the routing model parameters are not significantly changing the accuracy of the simulated flow as measured by traditional metrics (Figure 8), the storage constant is important to fine-tune the hydrograph timing of the simulated flow (Figure 9A). This suggests that existing spatially-varying values of k (e.g., Allen et al., 2018) may lead also to improved peak timing. However, the diffusion parameter is relatively insignificant, as was already shown previously (Koussis, 1978). Furthermore, the same analysis for different LSMs with different meteorological forcing (Figure 9B) shows that the timing of hydrograph is also influenced by the selection of LSM, as it is by the meteorological forcing. Here again, the timing of hydrograph for the ECMWF experiments is relatively better than that of all versions of GLDAS LSMs in all discharge stations with the exception of the Meghna basin (Figure 9B).
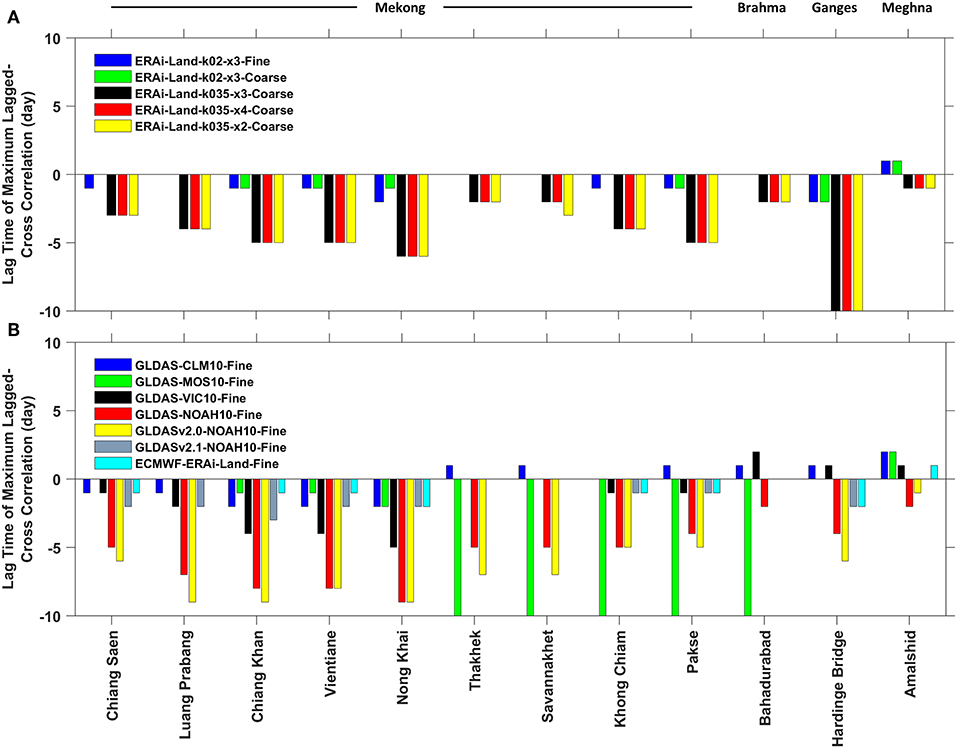
Figure 9. Lag time corresponding to the maximum lagged cross correlation in between the observed and simulated flow at different locations of the Mekong and GBM basins, as a function of different (A) routing model parameters, (B) LSMs and input forcing.
The overall analysis of the available global LSM data therefore shows that GLDAS-2 and ECMWF performed relatively better than the earlier GLDAS. This relative superiority is reported here for mass balance residual errors (although with caveats for the absence of groundwater processes and the relatively-short study period), and for mean annual flow. The analysis of the RAPID simulated daily river flow using five traditional metrics (correlation, NSE, bias, RMSE, and standard error) with respect to different LSMs and different meteorological forcing together indicate that in most cases ECMWF outperforms the other datasets considered in this study. Note that the different ensemble sizes used for LSMs (five), precipitation (four), model spatiotemporal resolution (eight), and river routing parameters (four) is inconsistent among our experiments partly due to data availability. However, the demonstrated sensitivity obtained for available ensembles (Figures 4–8) remains remarkable. In addition, the analysis of lagged cross-correlations also suggests that the ECMWF-derived river flow more accurately maintains the timing of hydrograph. In general, the ECMWF's ERA-interim/Land runoff derived river flow shows the most optimal performance in our study of the Mekong and the GBM river basin, although the determination of the source for this superiority is beyond the scope of this paper. For further illustration, the simulated flow hydrographs from the ECMWF model along with the in-situ data at different locations of the aforementioned river basins are shown in Figure 10.
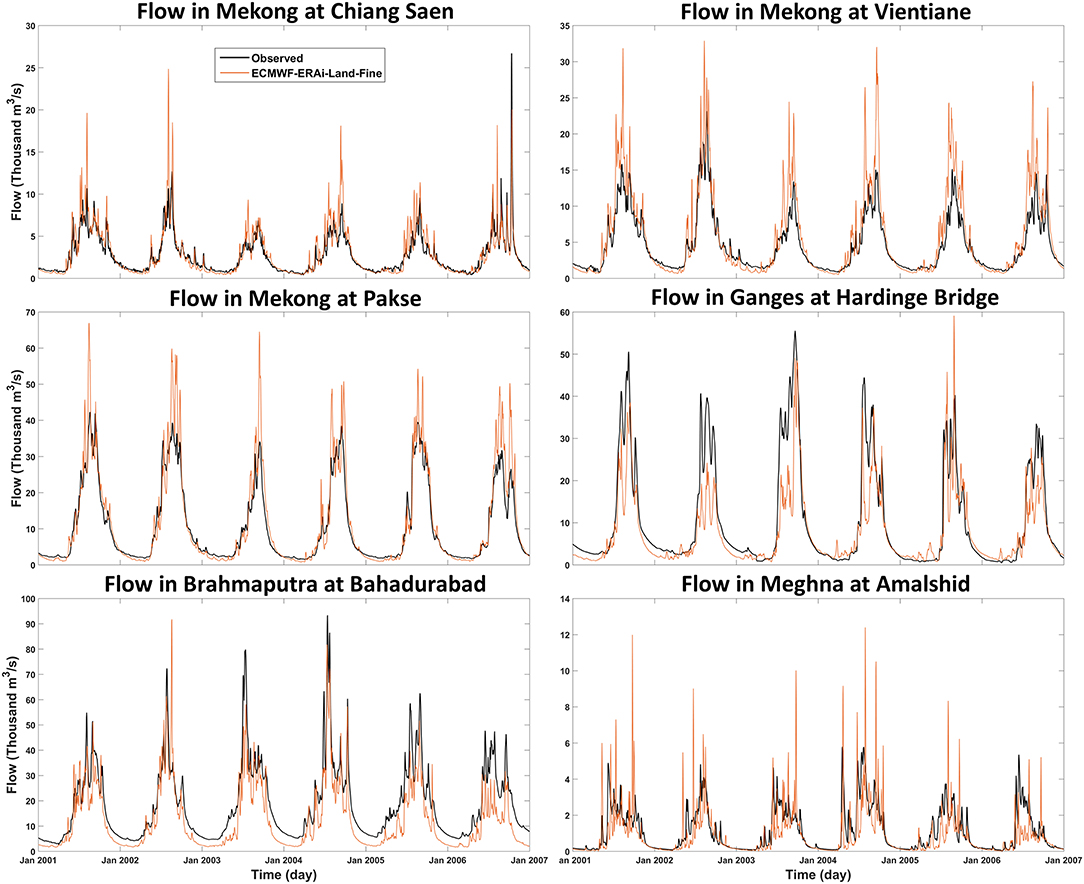
Figure 10. Comparison of the simulated daily stream flow using the ECMWF-ERA-interim/Land outputs in the fine scale routing model (i.e., with fine river network) and in-situ discharge at different locations of the Mekong and GBM basins.
Conclusions
Global Land Surface Models (LSMs) have the potential to help fill the observational gap of ungauged and of transboundary river basins. These models can be particularly valuable to mitigate water resources challenges in the large and densely populated transboundary river basins of South and Southeast Asia because they provide valuable estimations of the hydrological fluxes and states. Thus, the investigation of the appropriate global LSM among the many available operational models is critical in order to make best use of these model outputs. The primary goal of this study is therefore to identify the most optimal global LSMs for the region as it pertains to river flow estimation for the region. Concurrently, it is of value to determine the factors influencing the variance in the quality of model simulated flow.
The first part of this study's analysis was carried out based on the mean annual water fluxes estimated by several global LSMs (i.e., GLDAS, GLDAS-2, ECMWF ERA-interim/Land) to generally illustrate model accuracy. The ratios of the model simulated mean annual evapotranspiration and runoff to precipitation was evaluated in this context. The investigation of available global LSMs was conducted with respect to in-situ discharge because these data are reliable and more frequently available than the distributed observed water fluxes. The analysis of the simulated flow was executed using four traditional metrics (correlation, Nash-Sutcliffe Efficiency, bias, standard error, and root-mean-square error) to evaluation the sensitivity of the simulated flow to the selection of the LSM, the meteorological forcing, the spatio-temporal resolutions of the models, and the routing model parameters. Finally, the lagged cross-correlation analysis was conducted to evaluate the accuracy in the timing of the simulated hydrograph.
The analyses based on the mean annual water fluxes indicate that GLDAS-2 and ECMWF show better consistency with observed data than the earlier version of GLDAS. The model estimated mean annual runoff from GLDAS-2 and ECMWF products are also show better agreement with the observed runoff. Among the four LSMs of the GLDAS, CLM may appear to perform relatively better in terms of the runoff, although this may be due to underestimated precipitation combined with underestimates of evapotranspiration. The four experimental cases for the sensitivity analysis reveal that simulated river flow is mostly influenced by the selection of the LSM and by its input meteorological forcing. In contrast, the impact of the spatio-temporal resolutions of the LSMs is much lower for large river basins. A similarly low sensitivity is shown in the case of different routing model parameters for the traditional discharge metrics used. One should note that the varying size of ensembles in our experiments was largely a result of data availability and may have an impact in the sensitivity analysis of this study although enforcing consistency in ensemble sizes is beyond our intended scope. However, the analysis of lagged cross-correlation suggests that the flow wave propagation time has notable impact on the timing of hydrographs. Overall, the discharge simulations using runoff from the ECMWF ERA-Interim/Land outperform those from all other tested LSMs in terms of the simulated river flow accuracy as well as the timing of hydrograph in our study of the GBM and the Mekong basins. Our results suggest that the accuracy of ECMWF-derived flows is then followed by that of GLDASv2.1 GLDASv2.0, and GLDAS. One notable limitation of this study is that it does not include the anthropogenic effects (e.g., water diversions, dams, or land use change) in the models or their analysis. However, previous studies argued that the Brahmaputra basin is relatively in pristine condition since there is no major human intervention in the river (Biancamaria et al., 2011). There are also several existing dams and barrages in the Mekong River basin, but the impact of water use (i.e., for irrigation) on the mean annual flow for these diversions is relatively insignificant, at least during the study period. Haddeland et al. (2006) reported that the total use of water in Mekong basin is only 2.3% of the mean annual flow. While this small water use portion is applicable to our study period, it is expected to grow for later dates as a few large dams are under construction on the mainstem of the Mekong river, which is expected to change the impact on mean annual flow from ~2% in 2008 to ~20% in 2025 (Hecht et al., 2019). Future similar studies could therefore consider the inclusion of these anthropogenic activities, particularly in the Mekong basin, but also in the GBM. It is important to note here that the determination of the underlying reasons for the relative superiority of ECMWF runoff in our study of South and Southeast Asia is beyond the scope of this paper, and that our results are likely to be geographically dependent. We do not therefore make any recommendation for other river basins.
Data Availability Statement
The software used for this study can be found at https://github.com/c-h-david/rapid. GLDAS data are freely available with a NASA EarthData Login at https://disc.gsfc.nasa.gov. ERA-Interim/Land data are freely available with an ECMWF Login at https://apps.ecmwf.int/datasets/data/interim-land. Readers interested in obtaining daily discharge observations for our study domain and period may contact the Mekong River Commission and the Bangladesh Water Development Board.
Author Contributions
CD and MM conceived this study. The analysis reported and the compilation of first full draft of the manuscript was performed by MS. Initial simulations and preliminary analysis was done by GA, who also wrote an early version of the introduction. XQ and EN provided the necessary data for the coarse resolution river routing model. All authors contributed to writing the manuscript.
Funding
MS, CD, and GA were supported by the Jet Propulsion Laboratory, California Institute of Technology, under a contract with NASA; including a grant from the NASA SERVIR Applied Sciences Team. The contribution from SERVIR-HKH hub was supported by USAID.
Conflict of Interest
The authors declare that the research was conducted in the absence of any commercial or financial relationships that could be construed as a potential conflict of interest.
Acknowledgments
The research was carried out at the Jet Propulsion Laboratory, California Institute of Technology, under a contract with the National Aeronautics and Space Administration. The authors would like to thank the Bangladesh Water Development Board (BWDB) and the Mekong River Commission (MRC) for providing the observed data used in this study. Support from the SERVIR Coordination Office, particularly W. Lee Ellenburg, was critical to this study and is greatly appreciated. Valuable suggestions from the members of the Terrestrial Hydrology group of the Jet Propulsion Laboratory helped to enhance the study. The views and interpretations in this paper are those of the authors and are not necessarily attributable to BYU, ICIMOD, NASA, or USAID. Thank you to the editor and to the two reviewers for their suggestions which helped improve the initial version of this manuscript.
References
Alfieri, L., Burek, P., Dutra, E., Krzeminski, B., Muraro, D., Thielen, J., et al. (2013). GloFAS–Global ensemble streamflow forecasting and flood early warning. Hydrol. Earth Syst. Sci. 17, 12293–12332. doi: 10.5194/hessd-9-12293-2012
Allen, G. H., David, C. H., Andreadis, K. M., Hossain, F., and Famiglietti, J. S. (2018). Global estimates of river flow wave travel times and implications for low-latency satellite data. Geophys. Res. Lett. 45, 7551–7560. doi: 10.1029/2018GL077914
Balsamo, G., Albergel, C., Beljaars, A., Boussetta, S., Brun, E., Cloke, H., et al. (2012). ERA-Interim/Land: A Global Land-Surface Reanalysis Based on ERA-Interim Meteorological Forcing. ERA Report Series. European Centre for Medium-Range Weather Forecasts (ECMWF). Available online at: https://www.ecmwf.int/node/7922 (accessed May 21, 2019)
Balsamo, G., Albergel, C., Beljaars, A., Boussetta, S., Brun, E., Cloke, H., et al. (2015). ERA-Interim/Land: a global land surface reanalysis data set. Hydrol. Earth Syst. Sci. 19, 389–407. doi: 10.5194/hess-19-389-2015
Berg, A. A., Famiglietti, J. S., Rodell, M., Reichle, R. H., Jambor, U., Holl, S. L., et al. (2005). Development of a hydrometeorological forcing data set for global soil moisture estimation. Int. J. Climatol. 25, 1697–1714. doi: 10.1002/joc.1203
Bi, H., Ma, J., Zheng, W., and Zeng, J. (2016). Comparison of soil moisture in GLDAS model simulations and in situ observations over the Tibetan Plateau. J. Geophys. Res. 121, 2658–2678. doi: 10.1002/2015JD024131
Biancamaria, S., Hossain, F., and Lettenmaier, D. P. (2011). Forecasting transboundary river water elevations from space. Geophys. Res. Lett. 38:L11401. doi: 10.1029/2011GL047290
Bonnema, M., and Hossain, F. (2017). Inferring reservoir operating patterns across the Mekong basin using only space observations. Water Resour. Res. 53, 3791–3810. doi: 10.1002/2016WR019978
Brouwer, R., Akter, S., Brander, L., and Haque, E. (2007). Socioeconomic vulnerability and adaptation to environmental risk: a case study of climate change and flooding in Bangladesh. Risk Anal. 27, 313–326. doi: 10.1111/j.1539-6924.2007.00884.x
CEGIS (2006). Early Warning System. Final Report to the Asian Development Bank. Centre for Environmental and Geographical Service (CEGIS).
Chen, F., Mitchell, K., Schaake, J., Xue, Y., Pan, H. L., Koren, V., et al. (1996). Modeling of land surface evaporation by four schemes and comparison with FIFE observations. J. Geophys. Res. 101, 7251–7268. doi: 10.1029/95JD02165
Chen, Y., Yang, K., Qin, J., Zhao, L., Tang, W., and Han, M. (2013). Evaluation of AMSR-E retrievals and GLDAS simulations against observations of a soil moisture network on the Central Tibetan Plateau. J. Geophys. Res. 118, 4466–4475. doi: 10.1002/jgrd.50301
Chinnasamy, P., Maheshwari, B., and Prathapar, S. (2015). Understanding groundwater storage changes and recharge in Rajasthan, India through remote sensing. Water 7, 5547–5565. doi: 10.3390/w7105547
Dai, A., Qian, T., Trenberth, K. E., and Milliman, J. D. (2009). Changes in continental freshwater discharge from 1948 to 2004. J. Clim. 22, 2773–2792. doi: 10.1175/2008JCLI2592.1
Dai, Y., Zeng, X., Dickinson, R. E., Baker, I., Bonan, G. B., Bosilovich, M. G., et al. (2003). The common land model. Bull. Am. Meteorol. Soc. 84, 1013–1023. doi: 10.1175/BAMS-84-8-1013
David, C. H., Maidment, D. R., Niu, G. Y., Yang, Z. L., Habets, F., and Eijkhout, V. (2011). River network routing on the NHDPlus dataset. J. Hydrometeorol. 12, 913–934. doi: 10.1175/2011JHM1345.1
FAO (2016). AQUASTAT Main Database. Food and Agriculture Organization of the United Nations (FAO). Available online at: http://www.fao.org/nr/water/aquastat/data/query/index.html (accessed May 21, 2019).
Fread, D. L. (1993). “Flow routing,” in Handbook of Hydrology, ed D. R. Maidment (New York, NY: McGraw-Hill), 10.7–10.8.
Haddeland, I., Lettenmaier, D. P., and Skaugen, T. (2006). Effects of irrigation on the water and energy balances of the Colorado and Mekong River basins. J. Hydrol. 324, 210–223. doi: 10.1016/j.jhydrol.2005.09.028
Hanington, P., To, Q. T., Van, P. D. T., Doan, N. A. V., and Kiem, A. S. (2017). A hydrological model for interprovincial water resource planning and management: a case study in the Long Xuyen Quadrangle, Mekong Delta, Vietnam. J. Hydrol. 547, 1–9. doi: 10.1016/j.jhydrol.2017.01.030
Hecht, J. S., Lacombe, G., Arias, M. E., Dang, T. D., and Piman, T. (2019). Hydropower dams of the Mekong River basin: a review of their hydrological impacts. J. Hydrol. 568, 285–300. doi: 10.1016/j.jhydrol.2018.10.045
Hoang, L. P., Vliet, M. T. H., Kummu, M., Lauri, H., Koponen, J., Supit, I., et al. (2019). The Mekong's future flows under multiple drivers: how climate change, hydropower developments and irrigation expansions drive hydrological changes. Sci. Tot. Environ. 649, 601–609. doi: 10.1016/j.scitotenv.2018.08.160
Hossain, F., Siddique-E-Akbor, A. H., Mazumder, L. C., ShahNewaz, S. M., Biancamaria, S., Lee, H., et al. (2014). Proof of concept of an altimeter-based river forecasting system for transboundary flow inside Bangladesh. IEEE J. Select. Top. Appl. Earth Observ. Rem. Sens. 7, 587–601. doi: 10.1109/JSTARS.2013.2283402
Hossain, F., Sikder, S., Biswas, N., Bonnema, M., Lee, H., Luong, N. D., et al. (2017). Predicting water availability of the regulated Mekong River basin using satellite observations and a physical model. Asian J. Water Environ. Pollut. 14, 39–48. doi: 10.3233/AJW-170024
Johnston, R., and Kummu, M. (2012). Water resource models in the Mekong basin: a review. Water Resour. Manage. 26, 429–455. doi: 10.1007/s11269-011-9925-8
Khandu, F. E., Schumacher, M., Awange, J. L., and Schmied, H. M. (2016). Exploring the influence of precipitation extremes and human water use on total water storage (TWS) changes in the Ganges-Brahmaputra-Meghna river basin. Water Resour. Res. 52, 2240–2258. doi: 10.1002/2015WR018113
Koren, V., Schaake, J., Mitchell, K., Duan, Q. Y., Chen, F., and Baker, J. M. (1999). A parameterization of snowpack and frozen ground intended for NCEP weather and climate models. J. Geophys. Res. 104, 19569–19585. doi: 10.1029/1999JD900232
Koster, R. D., and Suarez, M. J. (1996). Energy and Water Balance Calculations in the Mosaic LSM. NASA Tech. Memo. Vol. 9. Greenbelt, MD: NASA Goddard Space Flight Cent. Available online at: https://gmao.gsfc.nasa.gov/pubs/docs/Koster130.pdf (accessed May 21, 2019).
Koussis, A. D. (1978). Theoretical estimation of flood routing parameters. J. Hydraul. Div. 104, 109–115.
Kummu, M., Lu, X. X., Wang, J. J., and Varis, O. (2010). Basin-wide sediment trapping efficiency of emerging reservoirs along the Mekong. Geomorphology 119, 181–197. doi: 10.1016/j.geomorph.2010.03.018
Kummu, M., and Sarkkula, J. (2008). Impact of the Mekong river flow alteration on the tonle sap flood pulse. AMBIO 37, 185–192. doi: 10.1579/0044-7447(2008)37[185:IOTMRF]2.0.CO;2
Lakshmi, V., Fayne, J., and Bolten, J. (2018). A comparative study of available water in the major river basins of the world. J. Hydrol. 567, 510–532. doi: 10.1016/j.jhydrol.2018.10.038
Lehner, B., Verdin, K., and Jarvis, A. (2008). New global hydrography derived from spaceborne elevation data. Eos Trans. Am. Geophys. Union. 89, 93–104. doi: 10.1029/2008EO100001
Liang, X., Lettenmaier, D. P., Wood, E. F., and Burges, S. J. (1994). A simple hydrologically based model of land surface water and energy fluxes for general circulation models. J. Geophys. Res. 99, 14415–14428. doi: 10.1029/94JD00483
Maswood, M., and Hossain, F. (2015). Advancing river modelling in ungauged basins using satellite remote sensing: the case of the Ganges–Brahmaputra–Meghna basin. Int. J. River Basin Manage. 14, 103–117. doi: 10.1080/15715124.2015.1089250
McCarthy, G. T. (1938). “The unit hydrograph and flood routing,” in Conference of the North Atlantic Division (New London, CT: U.S. Engineer Department), 1–19.
Mirza, M. M. Q. (2011). Climate change, flooding in South Asia and implications. Region. Environ. Change 11, 95–107. doi: 10.1007/s10113-010-0184-7
Mirza, M. M. Q., Warrick, R. A., and Ericksen, N. J. (2003). The implications of climate change on floods of the Ganges, Brahmaputra and Meghna rivers in Bangladesh. Clim. Change 57, 287–318. doi: 10.1023/A:1022825915791
Mitchell, K. E., Lohmann, D., Houser, P. R., Wood, E. F., Schaake, J. C., Robock, A., et al. (2004). The multi-institution North American Land Data Assimilation System (NLDAS): utilizing multiple GCIP products and partners in a continental distributed hydrological modeling system. J. Geophys. Res. 109:D07S90. doi: 10.1029/2003JD003823
Murshed, S. B., and Kaluarachchi, J. J. (2018). Scarcity of fresh water resources in the Ganges Delta of Bangladesh. Water Secur. 4–5, 8–18. doi: 10.1016/j.wasec.2018.11.002
Nishat, B., and Rahman, S. M. M. (2009). Water resources modeling of the Ganges-Brahmaputra-Meghna river basins using satellite remote sensing data. J. Am. Water Resour. Assoc. 45, 1313–1327. doi: 10.1111/j.1752-1688.2009.00374.x
Orr, S., Pittock, J., Chapagain, A., and Dumaresq, D. (2012). Dams on the Mekong river: lost fish protein and the implications for land and water resources. Glob. Environ. Change 22, 925–932. doi: 10.1016/j.gloenvcha.2012.06.002
Pokhrel, Y., Burbano, M., Roush, J., Kang, H., Sridhar, V., and Hyndman, D. (2018). A review of the integrated effects of changing climate, land use, and dams on Mekong river hydrology. Water 10:266. doi: 10.3390/w10030266
Priya, S., Young, W., Hopson, T., and Avasthi, A. (2017). Flood Risk Assessment and Forecasting for the Ganges-Brahmaputra-Meghna River Basins (English). Washington, DC: World Bank Group. Available online at: http://documents.worldbank.org/curated/en/272611508255892547/Flood-risk-assessment-and-forecasting-for-the-Ganges-Brahmaputra-Meghna-River-basins (accessed May 21, 2019).
Purdy, A. J., David, C. H., Sikder, M. S., Reager, J. T., Chandanpurkar, H. A., Jones, N. L., et al. (2019). An open-source tool to facilitate the processing of GRACE Observations and GLDAS outputs: an evaluation in Bangladesh. Front. Environ. Sci. 7, 1–8. doi: 10.3389/fenvs.2019.00155
Räsänen, T. A., Koponen, J., Lauri, H., and Kummu, M. (2012). Downstream hydrological impacts of hydropower development in the upper Mekong basin. Water Resour. Manage. 26, 3495–3513. doi: 10.1007/s11269-012-0087-0
Rodell, M., Houser, P. R., Jambor, U., Gottschalck, J., Mitchell, K., Meng, C.-J., et al. (2004). The global land data assimilation system. Bull. Am. Meteorol. Soc. 85, 381–394. doi: 10.1175/BAMS-85-3-381
Rodell, M., McWilliams, E. B., Famiglietti, J. S., Beaudoing, H. K., and Nigro, J. (2011). Estimating evapotranspiration using an observation based terrestrial water budget. Hydrol. Process. 25, 4082–4092. doi: 10.1002/hyp.8369
Rodell, M., Velicogna, I., and Famiglietti, J. S. (2009). Satellite-based estimates of groundwater depletion in India. Nature 460, 999–1002. doi: 10.1038/nature08238
Rui, H., and Beaudoing, H. (2017). README Document for GLDAS Version 1 Data Products. NASA Goddard Earth Science Data Information and Services Center (GES DISC). Available online at: https://hydro1.gesdisc.eosdis.nasa.gov/data/GLDAS_V1/README.GLDAS.pdf (accessed May 21, 2019).
Rui, H., and Beaudoing, H. (2019). README Document for NASA GLDAS Version 2 Data Products. NASA Goddard Earth Science Data Information Services Center (GES DISC). Available online at: https://hydro1.gesdisc.eosdis.nasa.gov/data/GLDAS/GLDAS_NOAH025_3H.2.0/doc/README_GLDAS2.pdf (accessed May 21, 2019).,
Sheffield, J., Goteti, G., and Wood, E. F. (2006). Development of a 50-year high-resolution global dataset of meteorological forcings for land surface modeling. J. Clim. 19, 3088–3111. doi: 10.1175/JCLI3790.1
Siddique-E-Akbor, A. H. M., Hossain, F., Sikder, S., Shum, C. K., Tseng, S., Yi, Y., et al. (2014). Satellite precipitation data–driven hydrological modeling for water resources management in the Ganges, Brahmaputra, and Meghna basins. Earth Interact. 18, 1–25. doi: 10.1175/EI-D-14-0017.1
Sikder, M. S., and Hossain, F. (2018). Improving operational flood forecasting in monsoon climates with bias-corrected quantitative forecasting of precipitation. Int. J. River Basin Manage. 1–11. doi: 10.1080/15715124.2018.1476368
Snow, A. D. (2015). A new global forecasting model to produce high-resolution stream forecasts [Master's thesis]. Brigham Young University, Provo, UT, United States.
Syed, T. H., Famiglietti, J. S., Rodell, M., Chen, J., and Wilson, C. R. (2008). Analysis of terrestrial water storage changes from GRACE and GLDAS. Water Resour. Res. 44:W02433. doi: 10.1029/2006WR005779
Tatsumi, K., and Yamashiki, Y. (2015). Effect of irrigation water withdrawals on water and energy balance in the Mekong river basin using an improved VIC land surface model with fewer calibration parameters. Agric. Water Manage. 159, 92–106. doi: 10.1016/j.agwat.2015.05.011
UNEP (2016). Transboundary River Basins Status and Trends SUMMARY FOR POLICY MAKERS. United Nations Environment Programme (UNEP). Available online at: http://www.geftwap.org/publications/river-basins-spm (accessed May 21, 2019).
Wang, F., Wang, L., Koike, T., Zhou, H., Yang, K., Wang, A., et al. (2011). Evaluation and application of a fine-resolution global data set in a semiarid mesoscale river basin with a distributed biosphere hydrological model. J. Geophys. Res. 116:D21108. doi: 10.1029/2011JD015990
Webster, P. J., Jian, J., Hopson, T. M., Hoyos, C. D., Agudelo, P. A., Chang, H. R., et al. (2010). Extended-range probabilistic forecasts of Ganges and Brahmaputra floods in Bangladesh. Bull. Am. Meteorol. Soc. 91, 1493–1514. doi: 10.1175/2010BAMS2911.1
Xia, Y., Mitchell, K., Ek, M., Cosgrove, B., Sheffield, J., Luo, L., et al. (2012b). Continental-scale water and energy flux analysis and validation for North American Land Data Assimilation System Project Phase 2 (NLDAS-2): 2. Validation of model-simulated streamflow. J. Geophys. Res. 117:D03110. doi: 10.1029/2011JD016051
Xia, Y., Mitchell, K., Ek, M., Sheffield, J., Cosgrove, B., Wood, E., et al. (2012a). Continental-scale water and energy flux analysis and validation for the North American Land Data Assimilation System Project Phase 2 (NLDAS-2): 1. Intercomparison and application of model products. J. Geophys. Res. 117:D03109. doi: 10.1029/2011JD016048
Keywords: water balance, discharge, global LSM, GLDAS, ERA-interim, GBM, Mekong
Citation: Sikder MS, David CH, Allen GH, Qiao X, Nelson EJ and Matin MA (2019) Evaluation of Available Global Runoff Datasets Through a River Model in Support of Transboundary Water Management in South and Southeast Asia. Front. Environ. Sci. 7:171. doi: 10.3389/fenvs.2019.00171
Received: 30 May 2019; Accepted: 11 October 2019;
Published: 31 October 2019.
Edited by:
Ashutosh S. Limaye, National Aeronautics and Space Administration (NASA), United StatesReviewed by:
Sujay V. Kumar, National Aeronautics and Space Administration, United StatesOlaf Schroth, Weihenstephan-Triesdorf University of Applied Sciences, Germany
Copyright © 2019 Sikder, David, Allen, Qiao, Nelson and Matin. This is an open-access article distributed under the terms of the Creative Commons Attribution License (CC BY). The use, distribution or reproduction in other forums is permitted, provided the original author(s) and the copyright owner(s) are credited and that the original publication in this journal is cited, in accordance with accepted academic practice. No use, distribution or reproduction is permitted which does not comply with these terms.
*Correspondence: Md. Safat Sikder, bWQuc2FmYXQuc2lrZGVyQGpwbC5uYXNhLmdvdg==