 Konrad Koch
 Sasha D. Hafner
 Sören Weinrich3
 Sergi Astals
- 1Chair of Urban Water Systems Engineering, Technical University of Munich, Garching, Germany
- 2Department of Engineering, Aarhus University, Aarhus, Denmark
- 3Biochemical Conversion Department, Deutsches Biomasseforschungszentrum Gemeinnützige GmbH, Leipzig, Germany
- 4Advanced Water Management Centre, The University of Queensland, Brisbane, QLD, Australia
- 5Department of Chemical Engineering and Analytical Chemistry, University of Barcelona, Barcelona, Spain
Biochemical methane potential (BMP) tests are routinely conducted in academia and industry to determine the methane potential of a given substrate. Although many guidelines have been proposed to standardize BMP tests, results published in the peer-reviewed literature show that critical flaws in experimental design or execution are still common. Therefore, a powerful but simple method for evaluating the quality of BMP measurements is proposed in this work: the specific methane production (SMP) curve from any BMP trial should have a similar shape for most substrates, and significant deviation from this typical response is usually associated with a lack of reliability in resulting BMP estimates. In this study, some common experimental mistakes were reproduced to demonstrate this concept and establish relationships between flaws in experiments, SMP curves, and BMP values. The studied flaws were inoculum storage (2 weeks and at different temperatures), inoculum dilution with water (no dilution to 1:2 dilution), and inoculum-to-substrate ratio (from 2.00 to 0.05). Common kinetic models were used to better assess SMP curves. All flaws exhibited an impact on the SMP curves, but excessive dilution and extremely low inoculum-to-substrate ratio had the largest impacts on both SMP curves and BMP. In the most extreme case (ISR of 0.05), there was a clear lag phase of more than 10 days, and the resulting BMP was 15% lower than for the reference case. Together these results demonstrate the utility of the proposed method. The ultimate goal of this research is to help less experienced researchers identify and address problems in their experimental procedure, ultimately contributing to more accurate BMP measurements. The general approach is both simple and useful, and should always be part of a quality check for BMP tests.
Introduction
Measurement of biochemical methane potential (BMP) of organic substrates is important for research (Ariunbaatar et al., 2016; Yeshanew et al., 2016; Benn and Zitomer, 2018; Hafner et al., 2018; Filer et al., 2019) and biogas plant management (Koch et al., 2016; Gandiglio et al., 2017; Lippert et al., 2018). In contrast to nearly all chemical parameters (e.g., pH value and the chemical oxygen demand), and other biochemical parameters (e.g., biochemical oxygen demand), there is no standard method available for BMP tests (Baird et al., 2017). The first protocol for the standardization of BMP tests was proposed in 1979 (Owen et al., 1979), and several more guidelines have followed (Angelidaki et al., 2009; VDLUFA, 2011; Holliger et al., 2016; VDI 4630, 2016). All of them provide more or less detailed information of how to design and conduct BMP tests, and two of them defined criteria to validate the obtained results (VDLUFA, 2011; Holliger et al., 2016). These validation criteria are either based on relative standard deviations among the replicates to guarantee high intra-laboratory reproducibility, or define a range for the methane yield of a positive control (i.e., microcrystalline cellulose).
A BMP test, however, delivers not only the BMP, but also the methane production over time usually presented in the form of a specific methane production (SMP) curve. While it is hard to predict the methane potential of an unknown substrate, in the present study it is hypothesized that the SMP curve should have a similar shape for most substrates. Significant deviation from this typical response usually indicates problems that need to be corrected in order to obtain reliable results. Although flaws may be readily recognized by experienced researchers, this is not always the case for those with less experience. The German VDI 4630 (2016) is so far the only BMP guideline that discusses the typical shape of SMP curves, albeit briefly. Furthermore, the guideline presents only hypothetical idealized curves and not actual measurements and it is not clear what might actually cause each response.
Atypical methane yields of substrates (reporting BMPs even higher than the theoretical methane yield of lipids) associated with unusual SMP curves (characterized by a long lag-phase and a multiphase growth, so-called “polyauxic behavior”) can be found in peer-reviewed studies. It is not, however, the point of this contribution to criticize any particular paper or research group. Instead, it is hypothesized that flaws in the experimental design and execution that ultimately affect the BMP can often be recognized from the shape of the respective SMP curve. Based on the authors' own experiences, three typical flaws were selected and intentionally applied in three BMP tests in this work: inappropriate inoculum storage conditions, excessive dilution of inoculum, and low inoculum-to-substrate ratios (ISR). Each test included a reference condition for comparison purposes. The aim of these experiments was not to study once again the impact of each parameter on the results of the BMP test, but to test and demonstrate the utility of the proposed method. The main motivation for this study is to present a method that can help researchers with less experience easily recognize problems in BMP tests based on the SMP curve (Figure 1).
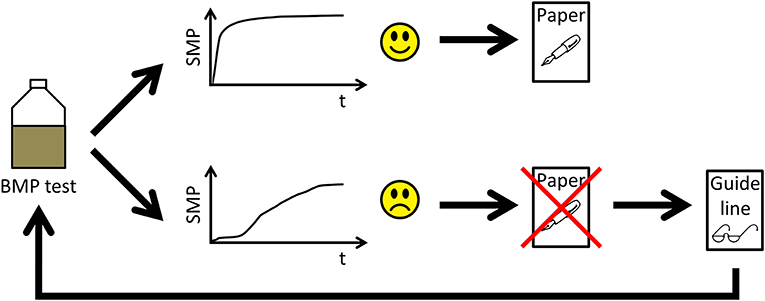
Figure 1. Graphical representation of the hypothesized method.
Materials and Methods
Source and Characteristics of Inoculum and Substrates
Digested sewage sludge used as inoculum and raw sewage sludge used as substrate were collected from Garching wastewater treatment plant (Bavaria, Germany). This treatment plant treats mainly municipal wastewater of ~31,000 population equivalents. The anaerobic digester is fed with raw sludge (mixture of primary and secondary sludge) at an organic loading rate of about 1.0 kgVS/(m3·d). The digester is operated at mesophilic conditions (~38°C) with a hydraulic retention time of about 30 days.
Pelleted dog food (Roy Premium Gourmet, PetCom Tierernährung GmbH & Co. KG, Minden, Germany) was used as a substrate in the storage experiment (instead of raw sewage sludge) to ensure that substrate quality was the same in all the tests. According to the producer, the dog food was composed of 25.0% raw protein, 16.0% raw lipid, 3.5% raw fiber, 6.2% ash, and the remains (including carbohydrates) accounting for 49.3% on a dry-weight basis.
Determination of total solids (TS) and volatile solids (VS) expressed as the share of fresh matter (FM) in % was carried out according to standard methods (Baird et al., 2017). Characteristics of inocula and substrates can be found in Table 1.
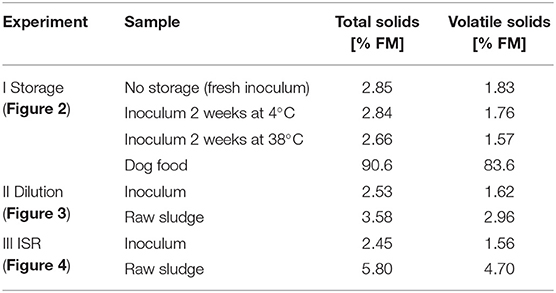
Table 1. Characteristics of inoculum and substrates used in each experiment.
Biochemical Methane Potential (BMP) Tests
BMP tests were conducted in triplicate with the Automatic Methane Potential Test System II (AMPTS II; Bioprocess Control, Sweden) following the guideline of Holliger et al. (2016), with the exception of deliberate flaws, as described below. The ISR was chosen to be 2 on VS basis (Holliger et al., 2016; VDI 4630, 2016). Operating volume was 450 mL and a mixing mode of 5 min mixing and 25 min rest was used. All tests were carried out under mesophilic conditions (38 ± 1°C) at least until daily gas production was <1% of the cumulative total gas production for 3 consecutive days (Holliger et al., 2016), which is indicated by diamonds in the following graphs. Prior to incubation, all bottles were flushed with a mixture of N2 and CO2 (65% N2, 35% CO2) at a flow rate of 2.5 liters per minute for 30 s to ensure a more than 5-times statistical exchange of the entire headspace. The AMPTS II system reports standardized (0°C, 1 atm, dry) cumulative methane volume from each bottle, which can be used to calculate both SMP curve and final BMP. Table 2 provides a summary of all experiments conducted.
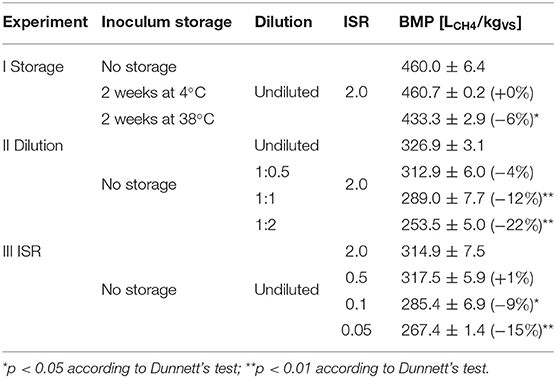
Table 2. Summary of conducted experiments and achieved BMP (mean ± standard deviation, n = 3 bottles per condition, percentage in brackets provides the difference from the reference condition).
Hypothesis Tests for Differences
Single factor analysis of variance (ANOVA) was used to evaluate differences in BMP within experiments. For each experiment, Dunnett's test was used to compare each treatment level to the reference condition. Tests were carried out in the software R using the aov() and summary.aov() functions from the stats package (version 3.4.4, 2018), and the glht() function from the multcomp package (version 1.4.8) for Dunnett's test. Differences were considered significant (*) when the p-value was below 0.05 and highly significant (**) when the p-value was below 0.01.
Kinetic Modeling
To characterize kinetic degradation behavior, three typical model structures for BMP test simulation were applied. Models were: single-fraction one-step first-order (Angelidaki et al., 2009; model A in Brulé et al., 2014) as well as a first-order two-step model (model B in Brulé et al., 2014) and the modified Gompertz model (Gompertz, 1825; Zwietering et al., 1990). All were implemented in the software environment Matlab (Mathworks, USA). Further information about the models can be found in the Supplementary Material. Parameter estimation was performed by minimizing the residual sum of squares between measured SMP curve and corresponding calculated values based on non-linear parameter optimization (trust region algorithm). Reasonable constraints for parameters were included in the estimation procedure as previously described in Janke et al. (2017). Model efficiency (ME) was applied to access model accuracy (Nash and Sutcliffe, 1970).
Proposed Method for Specific Methane Production (SMP) Curve Validation
The proposed method is based on visual inspection of SMP curves, which are commonly produced in BMP trials. A data resolution as high as possible is preferable, but a typical sampling frequency for manual data collection is sufficient (i.e., at least daily for the first 3–5 days during the phase of intensive methane production, then at least every 3 days for the next 2 weeks, afterwards once per week). To calculate SMP, the following steps were applied. While these steps are relatively easy to carry out with a spreadsheet or computation software, such as R or Matlab, free software for the task is also available (Hafner et al., 2018).
1. Start with standardized cumulative methane volume. This is provided directly by the AMPTS II system in this case, but when other systems are used it should be calculated from laboratory measurements.
2. Subtract inoculum methane production of the blanks from each observation by taking into account that inoculum mass in each bottle might differ.
3. Divide resulting net methane production by mass of substrate VS present in each bottle to calculate the substrate specific methane production (SMP) for each time step.
4. Plot SMP vs. incubation time for each substrate.
5. Assess SMP curves. An acceptable SMP curve shows (Figure 1):
a. Monotonic increase in methane production with no negative slope.
b. Steepest part of the curve near the start of the incubation with no to only very short lag-phase (not more than few days), reaching a stable plateau phase with only minor methane production.
c. No undulations in slope known as “polyauxic behavior”.
d. A progression similar to characteristic functional behavior of first-order (Brulé et al., 2014) or Monod-type models (Koch and Drewes, 2014). A long lag-phase requiring the application of a Gompertz model (Gompertz, 1825; Zwietering et al., 1990) or similar models is a strong indicator of mistakes in design and execution of the experiment.
Results and Discussion
Table 2 gives an overview of the experiments conducted in this study and the resulting BMP values. Table 3 summarizes estimated parameters of relevant model structures referred to during discussion of individual experimental results. Complete model predictions along with parameter estimates of all applied models are available in the Supplementary Material.
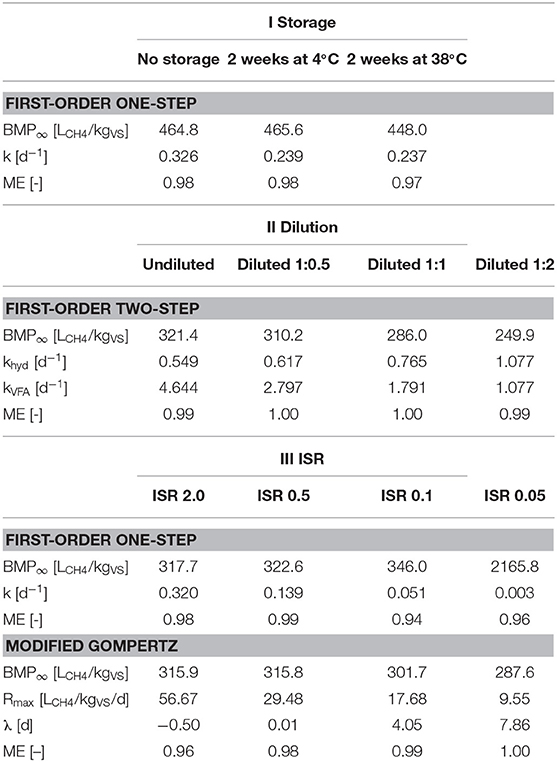
Table 3. Parameter estimates for the kinetic models applied in the three experiments.
Impact of Inoculum Storage on SMP Curves
An active inoculum is crucial for fast and complete degradation of the substrate in a BMP test. Its impact has been demonstrated in previous studies (De Vrieze et al., 2015; Koch et al., 2017). It is not always possible to start an experiment right after collecting the inoculum, although inocula “should be used as fresh as possible” (Holliger et al., 2016). Previous studies focused on the effect of inoculum storage on its biological activity and found that it is less a function of storage time but rather of storage temperature (Li et al., 2014; Hagen et al., 2015; Wang et al., 2016). While storage up to 1 month at ambient temperature resulted in similar final methane yields (Li et al., 2014; Hagen et al., 2015), storage at lower temperatures introduced a lag-phase and thereby impacted both kinetics of methane formation and BMP (Wang et al., 2016). Because inoculum storage can affect inoculum activity, storage was selected in the first experiment to demonstrate the relationship between the SMP curve and inoculum activity. The first test was started right away (<1 h) after inoculum collection. The remaining inoculum was split into two vessels and stored at 4 or 38°C for 2 weeks prior starting the second test. In order to exclude an impact of altering substrate quality over the 2 weeks of storing the inoculum, pelleted dog food with a moisture content of 10% was used as a substrate.
The performance of inoculum stored at 4°C for 2 weeks was very similar to the one of the fresh inoculum (indicated by dashed lines in Figure 2). In contrast, inoculum stored at the test temperature (38°C) for 2 weeks exhibited a significant lower background gas production of about only one third due to degassing during pre-incubation. The applied storage conditions also slightly influenced the SMP curves of the substrate. There was only a slight impact on the kinetics for the 4°C storage as can be seen by the delayed response relatively to the fresh inoculum, but it eventually reached nearly exactly the same BMP just about 4 days later. The SMP for the 38°C storage is not only characterized by an even more delayed response, but also by a significant lower BMP. The termination criterion was even reached about 3 days earlier compared to the reference.
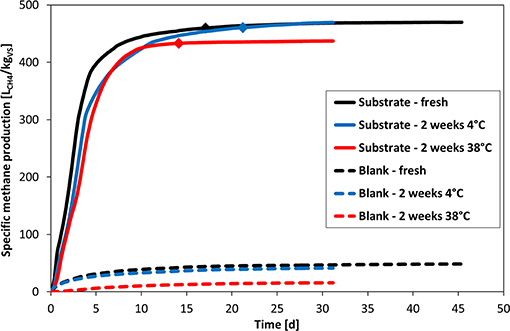
Figure 2. Impact of inoculum storage on specific methane production. Plotted values are the mean of three replicate bottles for each condition. Diamonds indicate the time when the daily gas production was below 1% of cumulative production during 3 consecutive days.
Application of a single (one-step) first-order kinetic model supports these observations. The kinetic constants of inocula stored at 4 and 38°C are slightly lower (0.24 d−1) compared to the inoculum directly utilized without a preceding storage period (0.33 d−1). The extrapolated BMP∞ (at infinite retention time) of the original inoculum and the inoculum stored at 4°C are almost identical (465 and 466 LCH4/kgVS, respectively), whereas the inoculum stored at 38°C showed a lower value of 448 LCH4/kgVS.
It can be concluded that the tested inoculum storage conditions had only a minor impact on both the shape of the SMP curves and the BMP of the substrate. However, a less resilient inoculum and more extreme storage conditions in terms of temperature and duration might show a different behavior. As reported by Li et al. (2014), sludge stored at room temperature for up to 4 months still retained sufficient activity for achieving 76–99% of fresh sludge methane yield. Hagen et al. (2015) stored the inoculum at −20°C for up to 11 months and found a significant loss of performance with cellulose as a function of temperature and duration. It can be concluded that the storage conditions applied in this study only had a minor impact on BMP values and SMP curves.
The SMP curves differed only slightly and none of the indicators for obvious problems listed in section Proposed Method for Specific Methane Production (SMP) Curve Validation were apparent.
Impact of Inoculum Dilution on SMP Curves
Some guidelines suggest that by dilution with deionized water, potential inhibition by unknown substrates can be avoided (Angelidaki et al., 2009; Holliger et al., 2016). Samples should be tested at concentrations as low as 5% of its original water content (Angelidaki et al., 2009). When sourcing the inoculum from a well-functioning digester of a municipal wastewater treatment plant as suggested by Raposo et al. (2012), typical VS concentrations reported from an inter-laboratory comparison were in the range of 10–30 gVS/L (Raposo et al., 2011). With a typical ISR and even an extreme dry substrate (such as microcrystalline cellulose with a TS and VS content of nearly 100%) the resulting VS concentration of the mixture will normally be in the recommended range of 20–60 gVS/L (Holliger et al., 2016). Hence, a dilution of the substrate is normally not needed, as long as the inoculum already provides enough moisture. Recent studies have proven that dilution of the inoculum below 10 gVS/L will even cause an underestimation of methane potential from BMP test and should thus be avoided (Wang et al., 2015; Reilly et al., 2016). Owing to incorrect interpretation of the recommendation in the guidelines (Angelidaki et al., 2009; Holliger et al., 2016), which refers to the substrate TS concentration and not to the inoculum or the mixture, an unnecessary dilution with water might be another source of error.
In order to demonstrate the impact of dilution on the SMP curve, a series of three dilutions (1:0.5, 1:1, 1:2; inoculum:water) has been tested, where 1:1 for instance correspond to the addition of the same amount of deionized water as inoculum (fresh mass basis). The ISR in all trials was maintained constant at 2 on VS basis, which was understandably not impacted by the water addition. The blanks were not diluted. Since wet mass of inoculum in diluted samples differed from the blanks, calculation of background methane production was based on VS of inoculum added to each bottle.
Figure 3 shows that with increasing dilution, the BMP is lowered, which is in agreement with findings of previous studies (Wang et al., 2015; Reilly et al., 2016). For the most extreme case of 1:2 dilution (VS content in the mixture reduced from 19.2 to 6.4 gVS/L), the slope during the plateau phase became negative, which indicates that the methane production from bottles with substrate but diluted with water was even lower than that of the undiluted blanks. Thereby, the termination criterion (indicated by diamonds in Figure 3) was also reached the sooner, the more diluted the mixture was. The reason for this observation was likely a VFA accumulation and pH drop, since the addition of deionized water severely reduced the buffer capacity from 18.0 gCaCO3/L in the undiluted inoculum to 4.6 gCaCO3/L in the 1:2 dilution, which was close to the recommended minimum of 3 gCaCO3/L (Holliger et al., 2016). Methanogenic archea have by far the slowest growth rates within anaerobic digester consortia, and cannot recover as fast as bacteria that carry out upstream steps (Pagliano et al., 2018). Furthermore, the dilution additionally induced a short initial lag-phase, which was more pronounced the higher the dilution rate.
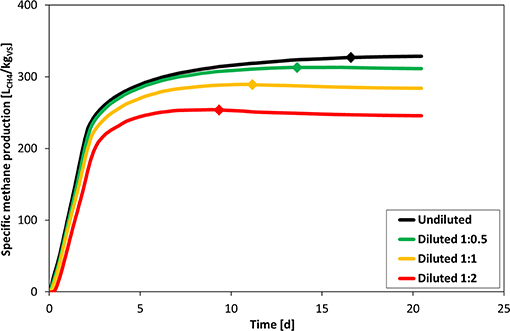
Figure 3. Impact of inoculum dilution on specific methane production. Plotted values are the mean of three replicate bottles for each condition. Diamonds indicate the time when the daily gas production was below 1% of cumulative production during 3 consecutive days.
These effects can also be verified by applying a first-order two-step kinetic model as shown in Table 3. With increasing dilution, the kinetic constant khyd of the first step (hydrolysis) consistently rises whereas the kinetic constant kVFA of second step (VFA degradation) decreases. As proposed by Eastman and Ferguson (1981), the pH drop caused by dilution enhances the hydrolysis rate. Furthermore, in case of 1:2 dilution, both kinetic constants are almost equal (khyd = kvfa = 1.08 d−1). Thus, methanogenesis (i.e., VFA degradation) becomes co-limiting in the overall AD process.
When biomass concentration (measured as the VS content) of an inoculum is already relatively low and the substrate also contains a lot of water (raw sewage sludge with a VS content of 2.96% was used in this case), further dilution with water significantly lowered the methane yield of the substrate (to 88 and 78% compared to the undiluted sample for 1:1 and 1:2 dilution, respectively). A similar observation was reported by Reilly et al. (2016), who found that a 1:1.5 dilution with deionized water reduced the methane yield from cellulose to 86% of the undiluted mixture. In the present case, the total VS concentration in the undiluted mixture was only about 20 gVS/L, which is already the minimum recommended by Holliger et al. (2016). It is therefore suggested to only dilute mixtures, which exhibit a VS content considerably higher than 60 gVS/L.
A long lag-phase in combination with the negative slope during the plateau-phase can serve as specific indicators for this kind of flaw.
Impact of Inoculum-to-Substrate Ratio (ISR) on SMP Curves
The most common flaw in BMP test is overloading which can be caused by either low inoculum intrinsic activity or by a low ISR. While a very high ISR will mainly challenge the experimental setup due to the relatively little gas production from the substrate, a low ISR might cause overloading of the microbial community, as has been demonstrated in various previous studies already (Hashimoto, 1989; Raposo et al., 2006; Kafle et al., 2014; Polizzi et al., 2017). Still, the impact of ISR on the shape of SMP curve has not been reported so far. An ISR of 2 is recommended for most substrates, while 4 might be applied for rapidly degradable substrates (e.g., glycerol, food waste) and 1 for slowly biodegradable substrates (e.g., lignocellulosic materials) (Holliger et al., 2016). In order to demonstrate the impact of ISR on SMP curves, an experiment was carried out using a typical ISR of 2 and three lower values of 0.5, 0.1, and 0.05.
Figure 4 clearly displays the effect of ISR on SMP. Still, ISR of 0.5 achieved the same BMP as ISR 2, but the shape of the SMP curve already indicates an improper digestion process with an initially delayed gas production. The “polyauxic behaviors” for ISR 0.1 and particularly for ISR 0.05 suggest severe inhibition of the anaerobic digestion process. This also resulted in a significantly lower methane potential of 91 and 85% compared to the yield of ISR 2 for ISR 0.1 and ISR 0.05, respectively. Overloading due to an improper ISR clearly caused a delay of the typical high initial biogas production. For all lower ISRs, but particularly for ISR 0.05, the necessary digestion time to achieve the required plateau phase to be allowed to terminate the test (as indicated by the diamond) was severely prolonged. It has to be noted that ISR 0.1 fulfilled the <1% in 3 days criterion already after 29 days of digestion, but the methane production was slightly higher (up to 1.3%) during days 43–52, when it felt below 1% again. A fractional increase in the methane production even during the plateau phase is hence an indicator of this kind of flaw.
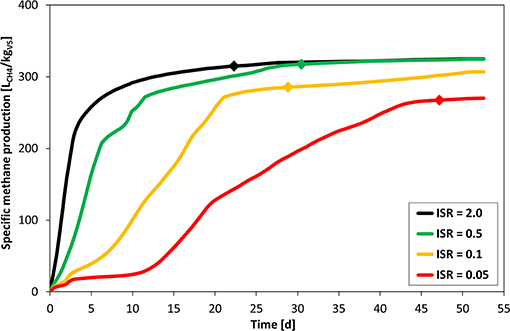
Figure 4. Impact of inoculum-to-substrate ratio on the specific methane production. Plotted values are the mean of three replicate bottles for each condition. Diamonds indicate the time when the daily gas production was below 1% of cumulative production during 3 consecutive days.
Selection of an improper ISR can cause an overloading of the inoculum and can result in suboptimal conditions for the digestion process due to inhibition. Methanogenesis, as the most sensitive step in anaerobic digestion, can be inhibited by the accumulation of VFAs and cause a slower methane production (Hill et al., 1987; Ahring et al., 1995). The SMP curve resulting from an ISR that is too low is typically characterized by undulations in the shape (“polyauxic behavior”) and steeper slope even in the plateau phase.
As already proposed in the presented guideline (section Proposed Method for Specific Methane Production (SMP) Curve Validation, criterion 5d) application of characteristic model structures can be utilized to access and evaluate validity of experimental results. In case of ISR 0.05, a first-order one-step kinetic model is characterized by unreasonable model parameters (e.g., BMP∞ = 2165.8 LCH4/kgVS), resulting in comparably low coefficient of determination (ME = 0.96). Plots of measured data and of all models applied can be found in the Supplementary Material. Since the functional progression of the modified Gompertz model explicitly implies lag-phase behavior, estimated parameters and simulation results enable a close depiction of process inhibition (e.g., ME ≈ 1.00 for ISR = 0.05) with an estimated lag-phase of 8 days. For ISR 2, the modified Gompertz model delivers a negative lag-phase of −0.5 days, which reflects the incapability of the modified Gompertz model to approximate normal SMP curves.
An excellent fit of the modified Gompertz model in combination with a low coefficient of determination or unreasonable model parameters of first-order or Monod-type models can serve as flaw indicators for improper chosen ISR.
Application of the Specific Methane Production (SMP) Curve Method
The shape of a BMP curve should generally be similar to the typical response illustrated in Figure 5. Different shapes are likely to indicate the presence of problems in the experimental design or execution that should be addressed in order to be able to produce accurate and repeatable BMP estimates. Figure 5 is a compilation of the most extreme responses of three flaws studied, but the shapes are comparable to those presented in a schematic representation of “typical shapes of gas formation curves” in the VDI 4630 (2016). In order to be able to assess the quality of the SMP curves and therefore, of the obtained results, it is proposed that researchers include SMP curves in every future BMP study, at least as Supplementary Material, as recommended earlier by Holliger et al. (2016). Furthermore, in order to improve the quality of biogas research, it is essential that reviewers check submissions for normal SMP curves. However, while the proposed method described in this work can be useful for detecting many common flaws in BMP tests, it cannot be used to detect all possible errors, such as incorrect VS values for substrate, biases in methane measurement, or biogas leakage (Hafner and Astals, 2019), which may not influence the shape of the SMP curve. The application of the proposed method is not limited to BMP tests with high temporal resolution, but the higher the temporal resolution is, the better small discrepancies to the typical response can be identified.
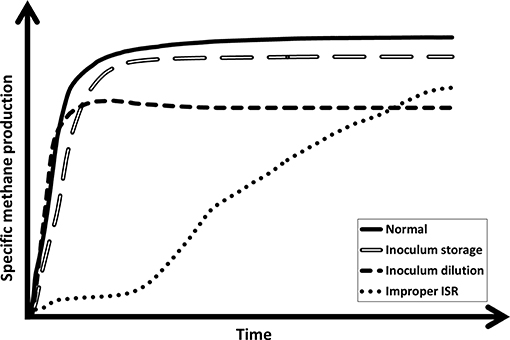
Figure 5. A normal specific methane production curve and the impact of three typical faults in the experimental design or execution.
Conclusions
BMP tests are commonly used to determine the methane potential of substrates. Although many guidelines provide detailed information of how to conduct BMP tests, a validation of the results beyond checking the yield from a positive control, or that a certain standard deviation within the replicates is not exceeded, is still missing. Since the shape of the SMP curve is very similar for most substrates, it is suggested as another criterion to qualitatively validate the test results. The examples presented in this work showed that, as hypothesized, unusual SMP curves may indeed provide an indication of problems with a BMP trial, and can be used to exclude inaccurate BMP measurements. The proposed method provides a simple but useful tool, especially for less experienced researchers.
Data Availability Statement
The datasets generated for this study are available on request to the corresponding author.
Author Contributions
KK proposed the method, performed the experiments, analyzed the data, wrote the manuscript draft, and revised it according to the others' comments. SW applied and evaluated the kinetic models for parameter estimation. SH, SW, and SA participated in the experimental design, interpretation and discussion of the experimental results, writing the manuscript, and revising it critically.
Funding
This work was supported by the German Research Foundation (DFG) and the Technical University of Munich (TUM) in the framework of the Open Access Publishing Program. The financial support of the TUM Global Incentive Fund to host the second international workshop on standardization of BMP tests at TUM is highly appreciated. SA was grateful to the Australian Research Council for his DECRA fellowship (DE170100497) and the Spanish Ministry of Science, Innovation and Universities for his Ramon y Cajal fellowship (RYC-2017-22372). SW was thankful to the German Federal Ministry of Food and Agriculture by funding the research project Evaluating substrates for biogas production–From laboratory to industrial scale (Grant 22034614).
Conflict of Interest
The authors declare that the research was conducted in the absence of any commercial or financial relationships that could be construed as a potential conflict of interest.
Acknowledgments
Björn Weihofen was kindly acknowledged for his excellent technical assistance.
Supplementary Material
The Supplementary Material for this article can be found online at: https://www.frontiersin.org/articles/10.3389/fenvs.2019.00178/full#supplementary-material
References
Ahring, B., Sandberg, M., and Angelidaki, I. (1995). Volatile fatty acids as indicators of process imbalance in anaerobic digestors. Appl. Microbiol. Biotechnol. 43, 559–565. doi: 10.1007/BF00218466
Angelidaki, I., Alves, M., Bolzonella, D., Borzacconi, L., Campos, J. L., Guwy, A. J., et al. (2009). Defining the biomethane potential (BMP) of solid organic wastes and energy crops: a proposed protocol for batch assays. Water Sci. Technol. 59, 927–934. doi: 10.2166/wst.2009.040
Ariunbaatar, J., Esposito, G., Yeh, D. H., and Lens, P. N. L. (2016). Enhanced anaerobic digestion of food waste by supplementing trace elements: role of selenium (VI) and iron (II). Front. Environ. Sci. 4:8. doi: 10.3389/fenvs.2016.00008
Baird, R. B., Eaton, A. D., and Rice, E. W. (2017). Standard Methods for the Examination of Water and Wastewater. Washington, DC: American Public Health Association.
Benn, N., and Zitomer, D. (2018). Pretreatment and anaerobic co-digestion of selected PHB and PLA bioplastics. Front. Environ. Sci. 5:93. doi: 10.3389/fenvs.2017.00093
Brulé, M., Oechsner, H., and Jungbluth, T. (2014). Exponential model describing methane production kinetics in batch anaerobic digestion: a tool for evaluation of biochemical methane potential assays. Bioprocess Biosyst. Eng. 37, 1759–1770. doi: 10.1007/s00449-014-1150-4
De Vrieze, J., Raport, L., Willems, B., Verbrugge, S., Volcke, E., Meers, E., et al. (2015). Inoculum selection influences the biochemical methane potential of agro-industrial substrates. Microb. Biotechnol. 8, 776–786. doi: 10.1111/1751-7915.12268
Eastman, J. A., and Ferguson, J. F. (1981). Solubilization of particulate organic carbon during the acid phase of anaerobic digestion. J. Water Pollut. Control 53, 352–366.
Filer, J., Ding, H. H., and Chang, S. (2019). Biochemical methane potential (BMP) assay method for anaerobic digestion research. Water 11:921. doi: 10.3390/w11050921
Gandiglio, M., Lanzini, A., Soto, A., Leone, P., and Santarelli, M. (2017). Enhancing the energy efficiency of wastewater treatment plants through co-digestion and fuel cell systems. Front. Environ. Sci. 5:70. doi: 10.3389/fenvs.2017.00070
Gompertz, B. (1825). On the nature of the function expressive of the law of human mortality, and on a new mode of determining the value of life contingencies. Philos. Trans. R. Soc. Lond. 115, 513–583. doi: 10.1098/rstl.1825.0026
Hafner, S. D., and Astals, S. (2019). Systematic error in manometric measurement of biochemical methane potential: sources and solutions. Waste Manag. 91, 147–155. doi: 10.1016/j.wasman.2019.05.001
Hafner, S. D., Koch, K., Carrere, H., Astals, S., Weinrich, S., and Rennuit, C. (2018). Software for biogas research: Tools for measurement and prediction of methane production. SoftwareX 7, 205–210. doi: 10.1016/j.softx.2018.06.005
Hagen, L. H., Vivekanand, V., Pope, P. B., Eijsink, V. G. H., and Horn, S. J. (2015). The effect of storage conditions on microbial community composition and biomethane potential in a biogas starter culture. Appl. Microbiol. Biotechnol. 99, 5749–5761. doi: 10.1007/s00253-015-6623-0
Hashimoto, A. G. (1989). Effect of inoculum/substrate ratio on methane yield and production rate from straw. Biol. Wastes 28, 247–255. doi: 10.1016/0269-7483(89)90108-0
Hill, D. T., Cobb, S. A., and Bolte, J. P. (1987). Using volatile fatty acid relationships to predict anaerobic digester failure. Trans. ASAE 30:496. doi: 10.13031/2013.31977
Holliger, C., Alves, M., Andrade, D., Angelidaki, I., Astals, S., Baier, U., et al. (2016). Towards a standardization of biomethane potential tests. Water Sci. Technol. 74, 2515–2522. doi: 10.2166/wst.2016.336
Janke, L., Weinrich, S., Leite, A. F., Terzariol, F. K., Nikolausz, M., Nelles, M., et al. (2017). Improving anaerobic digestion of sugarcane straw for methane production: combined benefits of mechanical and sodium hydroxide pretreatment for process designing. Energy Convers. Manag. 141, 378–389. doi: 10.1016/j.enconman.2016.09.083
Kafle, G. K., Bhattarai, S., Kim, S. H., and Chen, L. (2014). Effect of feed to microbe ratios on anaerobic digestion of Chinese cabbage waste under mesophilic and thermophilic conditions: Biogas potential and kinetic study. J. Environ. Manage. 133, 293–301. doi: 10.1016/j.jenvman.2013.12.006
Koch, K., and Drewes, J. E. (2014). Alternative approach to estimate the hydrolysis rate constant of particulate material from batch data. Appl. Energy 120, 11–15. doi: 10.1016/j.apenergy.2014.01.050
Koch, K., Lippert, T., and Drewes, J. E. (2017). The role of inoculum's origin on the methane yield of different substrates in biochemical methane potential (BMP) tests. Bioresour. Technol. 243, 457–463. doi: 10.1016/j.biortech.2017.06.142
Koch, K., Plabst, M., Schmidt, A., Helmreich, B., and Drewes, J. E. (2016). Co-digestion of food waste in a municipal wastewater treatment plant: comparison of batch tests and full-scale experiences. Waste Manag. 47, 28–33. doi: 10.1016/j.wasman.2015.04.022
Li, J., Zicari, S. M., Cui, Z., and Zhang, R. (2014). Processing anaerobic sludge for extended storage as anaerobic digester inoculum. Bioresour. Technol. 166, 201–210. doi: 10.1016/j.biortech.2014.05.006
Lippert, T., Bandelin, J., Musch, A., Drewes, J. E., and Koch, K. (2018). Energy-positive sewage sludge pre-treatment with a novel ultrasonic flatbed reactor at low energy input. Bioresour. Technol. 264, 298–305. doi: 10.1016/j.biortech.2018.05.073
Nash, J. E., and Sutcliffe, J. V. (1970). River flow forecasting through conceptual models part I–a discussion of principles. J. Hydrol. 10, 282–290. doi: 10.1016/0022-1694(70)90255-6
Owen, W. F., Stuckey, D. C., Healy, J. B. Jr, Young, L. Y., and McCarty, P. L. (1979). Bioassay for monitoring biochemical methane potential and anaerobic toxicity. Water Res. 13, 485–492. doi: 10.1016/0043-1354(79)90043-5
Pagliano, G., Ventorino, V., Panico, A., Romano, I., Robertiello, A., Pirozzi, F., et al. (2018). The effect of bacterial and archaeal populations on anaerobic process fed with mozzarella cheese whey and buttermilk. J. Environ. Manage. 217, 110–122. doi: 10.1016/j.jenvman.2018.03.085
Polizzi, C., Alatriste-Mondragón, F., and Munz, G. (2017). Modeling the disintegration process in anaerobic digestion of tannery sludge and fleshing. Front. Environ. Sci. 5:37. doi: 10.3389/fenvs.2017.00037
Raposo, F., Banks, C. J., Siegert, I., Heaven, S., and Borja, R. (2006). Influence of inoculum to substrate ratio on the biochemical methane potential of maize in batch tests. Process Biochem. 41, 1444–1450. doi: 10.1016/j.procbio.2006.01.012
Raposo, F., De la Rubia, M. A., Fernández-Cegrí, V., and Borja, R. (2012). Anaerobic digestion of solid organic substrates in batch mode: an overview relating to methane yields and experimental procedures. Renew. Sustain. Energy Rev. 16, 861–877. doi: 10.1016/j.rser.2011.09.008
Raposo, F., Fernández-Cegrí, V., De la Rubia, M. A., Borja, R., Béline, F., Cavinato, C., et al. (2011). Biochemical methane potential (BMP) of solid organic substrates: evaluation of anaerobic biodegradability using data from an international interlaboratory study. J. Chem. Technol. Biotechnol. 86, 1088–1098. doi: 10.1002/jctb.2622
Reilly, M., Dinsdale, R., and Guwy, A. (2016). The impact of inocula carryover and inoculum dilution on the methane yields in batch methane potential tests. Bioresour. Technol. 208, 134–139. doi: 10.1016/j.biortech.2016.02.060
VDI 4630 (2016). Fermentation of Organic Materials–Characterisation of the Substrate, Sampling, Collection of Material Data, Fermentation Tests. Düsseldorf: Verein Deutscher Ingenieure.
VDLUFA (2011). Measurement of Biogas and Methane Yields in Fermentation Tests. Darmstadt: Verband Deutscher Landwirtschaftlicher Untersuchungs-und Forschungsanstalten (VDLUFA).
Wang, B., Strömberg, S., Li, C., Nges, I. A., Nistor, M., Deng, L., et al. (2015). Effects of substrate concentration on methane potential and degradation kinetics in batch anaerobic digestion. Bioresour. Technol. 194, 240–246. doi: 10.1016/j.biortech.2015.07.034
Wang, B., Strömberg, S., Nges, I. A., Nistor, M., and Liu, J. (2016). Impacts of inoculum pre-treatments on enzyme activity and biochemical methane potential. J. Biosci. Bioeng. 121, 557–560. doi: 10.1016/j.jbiosc.2015.10.004
Yeshanew, M. M., Frunzo, L., Lens, P. N. L., Pirozzi, F., and Esposito, G. (2016). Mass loss controlled thermal pretreatment system to assess the effects of pretreatment temperature on organic matter solubilization and methane yield from food waste. Front. Environ. Sci. 4:62. doi: 10.3389/fenvs.2016.00062.
Keywords: anaerobic digestion, biochemical methane potential tests, data processing, methane production curve, identification of critical flaws
Citation: Koch K, Hafner SD, Weinrich S and Astals S (2019) Identification of Critical Problems in Biochemical Methane Potential (BMP) Tests From Methane Production Curves. Front. Environ. Sci. 7:178. doi: 10.3389/fenvs.2019.00178
Received: 06 May 2019; Accepted: 16 October 2019;
Published: 01 November 2019.
Edited by:
Maria Elisa Magri, Federal University of Santa Catarina, BrazilReviewed by:
Vhahangwele Masindi, Council for Scientific and Industrial Research (CSIR), South AfricaRicardo Luis Radis Steinmetz, EMBRAPA Swine and Poultry, Brazil
Copyright © 2019 Koch, Hafner, Weinrich and Astals. This is an open-access article distributed under the terms of the Creative Commons Attribution License (CC BY). The use, distribution or reproduction in other forums is permitted, provided the original author(s) and the copyright owner(s) are credited and that the original publication in this journal is cited, in accordance with accepted academic practice. No use, distribution or reproduction is permitted which does not comply with these terms.
*Correspondence: Konrad Koch, ay5rb2NoQHR1bS5kZQ==