 Katharine A. Owens
 Puspita I. Kamil
- 1Department of Politics, Economics, and International Studies, University of Hartford, West Hartford, CT, United States
- 2Catalyze Communications, Denpasar, Indonesia
Marine debris often begins as litter or waste on land. Rivers play an important role in transporting this debris from communities to ocean systems, and yet we lack data on debris in freshwater systems. This work promotes eliminating the gap in knowledge between debris in marine and freshwater systems through use of a consistent, replicable methodology that can be used to improve data on freshwater shoreline debris. Expansion in the application of this method globally can allow researchers to ground-truth estimates of the debris entering the world's oceans via rivers. Widespread use of this method would provide data on the litter degrading in the world's riverine systems, an important ecological problem in its own right often sidelined in work on marine debris. Improved ground-truthing will also shed light on the missing plastics question: the disparity between input estimates and measurement of plastic waste in the world's oceans. Cataloging the way debris moves through, and remains a part of, freshwater systems is imperative to addressing the global plastic waste problem. Here we share examples of how the method has been applied in the Tukad Badung river in Indonesia and the Karamana river in India.
Introduction
Rivers of Plastic
Evidence indicates that litter and plastic pollution is not only a problem in the world's oceans but also in global riverways (Rech et al., 2014; Jambeck et al., 2015; Lebreton et al., 2017; Schmidt et al., 2017; Blettler and Wantzen, 2019). Many researchers point to rivers as an important pathway for debris from clusters of human population to ocean systems (Nollkaemper, 1994; Islam and Tanaka, 2004; Lechner et al., 2014; Jambeck et al., 2015; Lebreton et al., 2017; Schmidt et al., 2017; Blettler and Wantzen, 2019). Whether a study from Europe describing how floating macro-plastics from the Rhone reach the Mediterranean (Castro-Jiménez et al., 2019) or research from Indonesia suggesting how rivers transport land-based plastic to the ocean (van Emmerik et al., 2019), the literature is replete with examples. In a comprehensive study testing hypotheses for how debris reaches oceanic systems, Willis et al. (2017) find that most debris comes from local sources. The Stemming the Tide report confirms that rivers bring debris from upstream communities to coastal areas (Ocean Conservancy, 2015). It also states that while researchers estimate that 80% of debris comes from land-based sources, their work on the ground in China and the Philippines indicates this number is likely much higher (Ocean Conservancy, 2015). In developing countries, uncollected waste “is directly deposited into and around rivers and other water bodies that present direct pathways into the marine ecosystem” (Ocean Conservancy, 2015, p. 14). As noted by van Emmerik et al. (2019) while rivers in South East Asia are seen as primary channels for plastic waste, without better observations “the origin and fate” of this waste remains unclear (p. 2). The most recent IPBES report (Díaz et al., 2019) notes that oceanic plastic pollution “has increased ten-fold” since 1980 (p. 28). Improving data on the way debris moves through, or remains a part of, freshwater systems is imperative to better understanding the global plastic waste problem. Here we share a consistent, replicable methodology—a modification of the NOAA Marine Debris Shoreline Field Guide methods (Opfer et al., 2012)—that can be applied to improve data on freshwater shoreline debris globally. This is not a new methodology, but instead a call to expand the application of this methodology globally to improve empirical evidence of debris in river systems. Expansion in the application of this method worldwide can allow researchers to ground-truth estimates on the debris entering the world's oceans and degrading in riverine systems, both of which can inform the “missing plastic” question.
Background
Understanding Freshwater Litter
While there are fewer assessments of freshwater debris than that of oceanic or coastal, freshwater research has grown in the last two decades. The published research favors collection from river water or sediment over that of riverbank assessments and more often than not focuses on the developed world. That said, the literature includes a range of studies of varying scope, many of which emphasize the potential of rivers to deliver waste—most often plastic—to the world's oceans.
Many studies emphasize water-based collection. An early assessment of the Los Angeles and San Gabriel Rivers reported an average of 2.3 billion pieces of plastic over 72 h of collecting in water under multiple conditions (Moore et al., 2011). Lechner et al. (2014) conducted a multi-year driftnet study on debris in the Danube, estimating 4.2 tons of debris flow from this river to the Black Sea each day. Researching floating debris in England's Tamar Estuary, Sadri and Thompson (2014) found 82% were micro-plastics. Working on the Thames, Morritt et al. (2014) netted over 8,000 items in a 3-month period and found it to be overwhelmingly made of plastic. In a study of 29 Great Lakes tributaries, Baldwin et al. (2016) collected and cataloged floating micro- and macro-plastics, finding plastic in all of their 107 samples. The authors report finding “fragments, films, foams, and pellets/beads… at greater concentrations during runoff-event conditions” but this was not the case for fibers (Baldwin et al., 2016, p. 10377). In a study modeling the distribution and transport of debris in the Great Lakes, Cable et al. (2017) found 2 million fragments/km2 in the Detroit River. In Vietnam, Lahens et al. (2018) evaluated both micro- and macro-plastic accumulation, determining that about 4.4 g per inhabitant per day of land-based waste entered the water system, a significant problem as their study area encompasses the megacity Ho Chi Minh. As a result of monthly observations of floating macro debris on the Rhone River, Castro-Jiménez et al. (2019) estimated that the river serves as conduit for approximately 200,000 pieces of plastic debris traveling to the Mediterranean annually. In 2019, van Emmerik et al. used field methods and modeling to discover 2,100 tons of plastic waste travels from the Jakarta area to the sea each year. Studies in freshwater consistently reveal that debris, primarily plastic, is a significant problem.
Micro-plastics are often the focus of water and shoreline assessments. Imhof et al. (2013) examined micro-plastics on the shores of the subalpine Italian lake Garda finding micro-plastic contamination in sediment at similar magnitude of that in marine systems. Studying 11 sites spanning over 800 km of the Rhine River Mani et al. (2015), measured an average of 892,777 micro-plastic particles per km2. In the first study on micro-plastics in the Thames, Horton et al. (2017) found this type of debris at all four of their sites, recording a high abundance of debris from paint used for road marking. An assessment from the South American Paraná floodplain lakes of micro-, meso-, and macro-plastics found contamination comparable to river and marine beach collections (Blettler et al., 2017). In the first report on micro-plastics in lake or estuarine habitats in India, Sruthy and Ramasamy (2017) found a mean abundance of micro-plastic of 252.80 ± 25.76 particles/m2, with low-density polyethylene dominating the sample. In a watershed-scale assessment from Montana encompassing 72 sites and 714 samples, Barrows et al. (2018) found micro plastics in 57% of the samples; the composition of which was predominantly fibrous, and made up of “synthetic or semi-synthetic materials” (p. 382). Comparing collections to discharge in the region, and unlike the results from the Baldwin et al. (2016) study, the authors determined storm water was not a source of micro-plastics in the Montana study area (Barrows et al., 2018). In a study of micro-plastics in five tributary basins of the Selenga River in Mongolia, Battulga et al. (2019) selected 12 sampling sites along river shorelines, collecting once during the dry season in August. They classified micro-plastic debris by subdividing it (mega-, macro-, meso-, and micro-fractions) and then typing it (foam, fragment, fiber, and film) and finally delineating polymers (polyethylene, polystyrene, polypropylene, polyvinyl chloride, polyethylene terephthalate, and polyurethane) (Battulga et al., 2019). The authors found polystyrene foam to be the most frequently appearing material, and concluded that debris was fragmenting on river shorelines (Battulga et al., 2019). Both shoreline and water-based microplastic research indicates that this is a significant environmental problem in freshwater systems.
Some studies use a range of methods, perhaps combining types (shoreline, water, or sediment) or including shorelines assessment of micro and macro plastics, or analyzing wildlife. Evaluating the Laurentian Great Lakes, Driedger et al. (2015) found that debris density in water rivaled that of ocean gyres, that shoreline litter was more than 80% plastic, and that sediments were not well studied. One comprehensive study of 15 sites in five rivers in Illinois and Indiana evaluated both riparian and benthic accumulation. They found riparian zone density in their sites was comparable to global beach averages, but that river benthic accumulation proved higher than in marine benthic environments (McCormick and Hoellein, 2016). In a shoreline study of the coastal wetland Martil in North-East Morocco, Alshawafi et al. (2017) found plastic (57%) dominated macro-debris types, and also noted its composition in micro-plastics including 26.9% foam, 7.8% fishing line, and 1.23% film. In a unique study analyzing data from the African duck, Reynolds and Ryan (2018) found that micro-fibers existed in 5% of fecal and 10% of feather samples, indicating a threat to freshwater systems and the wildlife residing there. This work provides evidence that the issue of global plastic pollution is as important in freshwater as it is in marine systems.
Several researchers focus, as we do, on river shoreline collections. Rech et al. (2014) conducted assessments along the shores of four Chilean rivers (Elqui, Maipo, Maule, and BioBio). They determined the main composition of debris found along riversides to be plastics, polystyrene, and manufactured wood, which ranged from 36 to 82% proportionally. Vincent and Hoellein (2017) collected at Pratt beach, Lake Michigan, USA, bi-weekly from March to November of 2015. They reported the highest density of litter in the fall, when compared to spring and summer; their assessment determined that direct littering as well as distribution via wind and waves led to pockets of higher accumulation (Vincent and Hoellein, 2017). Evaluating France's Adour River, Bruge et al. (2018) worked with stakeholders to collect over 120,000 items across 278 riverbank samples. While 41% of their collected debris was not identifiable due to degradation, of that which could be identified, 70% consisted of “food and beverage packaging, smoking-related items, sewage related debris, fishery and mariculture gear, and common household items” (Bruge et al., 2018, p. 1). These studies do not represent an exhaustive review of the literature on freshwater debris. And yet, collectively they provide evidence for how rivers transport debris globally, revealing the ways in which measuring debris in river systems can help inform work to understand the global problem of litter and debris.
Why Are Shoreline Studies Important?
While researchers study debris in both marine and freshwater systems, much more data exists for marine contexts. Researchers understand that river systems both retain and export debris, though rivers are often presented as only a conduit from land to oceans (McCormick and Hoellein, 2016). It should be noted that river and freshwater systems are an important component of the story of marine debris, not only due to their role as carriers of debris from land to ocean. Broadly speaking, freshwater systems contribute significantly to both human drinking water and food systems (Eerkes-Medrano et al., 2015). It is not only direct usage of freshwater that is important, but also the merits of protecting riverine ecosystems. Blettler and Wantzen (2019) promote eliminating the gap in knowledge between debris in marine and freshwater systems, emphasizing the study of macro debris from rubbish. The authors remark that studies of micro-plastics, a hot topic in the field, are far outpacing studies of macro-plastics in freshwater research perhaps to the detriment of our understanding (Blettler and Wantzen, 2019). Why is the study of macro-debris so important, particularly in the developing world? As noted by Blettler and Wantzen (2019), many studies estimate the movement of plastics from rivers to the ocean, yet often do so based not on collections but on extrapolations from population, waste infrastructure, and hydrological modeling (e.g., Jambeck et al., 2015; Lebreton et al., 2017; Schmidt et al., 2017). Few studies exist of river shoreline debris in the southeast and south Asian countries frequently named as the largest contributors to riverine to oceanic plastic (i.e., China, India, Indonesia, the Philippines, Sri Lanka, Thailand, and Vietnam) (Jambeck et al., 2015; Ocean Conservancy, 2015; Blettler et al., 2018; van Emmerik et al., 2019). Castro-Jiménez et al.'s (2019) research on the Rhone River's surface waters indicates that current estimates are not well coordinated with field observations. In addition, Blettler and Wantzen (2019) note that macro-plastics weigh more than micro-plastics, therefore removing them yields a higher reduction in inputs; that what many researchers call “mismanaged solid waste” is often pointed to as a primary source in developing countries, and can occur along waterways; and that if plastics join water systems at rivers, then both finding and collecting them there is a more economic and efficient way to prevent marine debris. Gasperi et al. (2014) recommend that the best estimates of river inputs will come from comprehensively assessing debris in “mid water and river floor… the surface and sub-surface” (p. 166). Lechner et al. (2014) emphasize the importance of quantifying river debris flows based on field studies. Blettler et al. (2018) note the particular importance of conducting studies on freshwater plastics in countries with the combined features of a lack of waste infrastructure and growing economic development, as is the case with our sites in India and Indonesia. Several researchers point out that debris in developing countries is often disposed next to freshwater bodies, in systems known to lead to excess leakage (Ocean Conservancy, 2015; Kaza et al., 2018). For all of these reasons, improving freshwater data collection is an important step in better understanding both the problem of marine debris and the problem of freshwater ecosystem degradation via pollution.
Methodology for River Collection
While researchers proposing estimates of debris moving through rivers were clearly working with the best data available, more often than not these estimates are not based on empirical data of debris along riversides. It is more often the case that studies extrapolate debris loads through estimations based on population density, waste infrastructure (or lack thereof), economic status, or hydrology (Jambeck et al., 2015; Lebreton et al., 2017). Using these data builds a composite estimate of debris in riverine systems, but to improve these estimates we need focused, scientifically replicable data to help us better understand the ways that plastic moves from rivers to oceans—and, importantly—stays in riverine systems. The focus should be broadened to include scientific collections along river shorelines (as we describe here) as well as in freshwater water columns and sediments. Our method as such is not a new method, but a call to amplify an existing method with the stated purpose of improving real data on riverine systems. Freshwater collections should expand beyond rivers to include lakes and wetlands. An emphasis on this research has the potential to solve the so-called missing plastic problem: the disconnect between material input estimates and what has been measured in the world's oceans (Cózar et al., 2014; Schmidt et al., 2017). Researchers know that a great deal of marine debris begins as river debris. As such, expanding debris collection to riversides will help us holistically understand the issue, which should more aptly be called global plastic pollution.
Many organizations, non-profits, groups, and individuals promote annual or more frequent beach and river cleanups at city, regional, national, and international scales (e.g., Afroz Shah's Versova Beach Cleanup, Bali's Biggest Cleanup, The International Coastal Cleanup, The Surfrider Foundation National Beach Cleanup, The Source to Sea Cleanup, The Great American Cleanup). While these efforts contribute to a decrease of debris in locations around the world, and may provide limited debris composition data, they do not necessarily produce scientifically replicable results that allow comparisons across sites. In their 2009 United Nations Environmental Guide, Cheshire and Adler called for more consistent, comparable methods in marine coastal cleanups. Interestingly, Cheshire and Adler (2009) write that the “only practical route” to combat the problem is through “managing discard behavior” (p. 8). This is fascinating in that it fails to recognize that creating materials for one-time use that take decades or longer to degrade—and which never biodegrade—is inherently unsustainable. They continue by noting that “popular beaches” may be cleaned, though the process is “both expensive and logistically difficult” and “almost impossible” in an oceanic setting (p. 8). In this way the authors recognize that beach cleanups are not a long-term solution for the problem of marine debris. We concur, and promote riverside cleanups not as a solution, but instead as a tool to better inform communities, policymakers, and a global audience about the debilitating concentrations of debris polluting the world.
At present, researchers studying waste along riversides use wildly different methodology. In most of the riverside collection studies we evaluated, researchers did not note the source of their methodology, making it difficult to link to other studies potentially using the same or similar methods for comparison in meta-analysis. In many cases, it appears that the researchers devised new methodologies. While this arguably allows flexibility to local conditions, it prevents connecting the results to other research. In reading descriptions of methodology for the studies included here, it was at times difficult to understand basic facts about the collection, for example the total area sampled, the length of collection time, how many individuals took part in the collection, or whether researchers used a methodical pattern of walking an area to ensure consistency, thoroughness, and allow for replication. Our proposed method alleviates these concerns.
We also noted that researchers often collect and report data on broad categories of debris (plastic, metal, cloth, etc.). Broad categorization allows researchers to understand the percentage of plastic, for example, but does not allow a deeper understanding of what kind of plastic (or metal, or cloth, etc.) is most frequently found. More detailed data is often needed when cataloging debris as it allows understanding what percentage of the found debris is, for example, food packaging or fishing gear. This depth of information can better allow linking science and policy—and provide data that can enrich recommendations to target policy change.
In some cases, researchers divide the debris into broad categories based on function (i.e., hygiene/medical; food packaging). In this way they more closely tie their data with human behavior instead of source materials (i.e., plastic, glass). While this may potentially allow more targeted outreach to local users, collecting data in this way does not allow simple comparison with results from other sites. One way to improve these results would be to count and categorize materials explicitly by type (e.g., plastic bottles, plastic bags, shoes) and then merge categories to form broad groups based on usage. When data are collected with a high level of detail, as can be the case when using the NOAA methodology, explicit categories can always be merged into groups later.
Cheshire and Adler (2009) provide methodologies for comprehensive and rapid beach litter assessments, benthic assessments, and floating litter assessments. When considering their comprehensive coastal assessment, the Cheshire and Adler (2009) methodology recommends selecting a beach site of minimum 100 m length, from 15 to 45° slope, accessible both in terms of a lack of built structures (i.e., jetties) and to researchers throughout the year. In addition they recommend selecting a site not featuring other collection activities and one on which collection activities will not harm threatened or endangered species (Cheshire and Adler, 2009). The authors note that both the Convention for the Protection of the Marine Environment of the Northeast Atlantic (OSPAR) and Northwest Pacific Action Plan (NOWPAP) recommend that collection sites should “not be within close proximity to rivers, harbors and ports” but in contrast, Cheshire and Adler recommend a stratified sample featuring “Urban coasts (i.e., mostly terrestrial inputs); Rural coasts (i.e., mostly oceanic inputs); and Within close distance to major riverine inputs” (Cheshire and Adler, 2009, p. 23). As such, they recognize that river inputs are an important part of the marine litter equation, mentioning them as one of seven potential sources (others listed are fisheries and aquaculture; ships of all types; storm water runoff; debris blowing from land; beach users/dumping; and oil rigs) (Cheshire and Adler, 2009). Throughout their methodological description, Cheshire and Adler (2009) comment on the importance of understanding how marine litter may be influenced by rivers, and yet do not recommend collecting on riversides.
In their shoreline field guide, Opfer et al. (2012) have similar recommendations of sites with characteristics such as, “Sandy beach or pebble shoreline; Clear, direct, year-round access; No breakwaters or jetties; At least 100 m in length parallel to the water; and No regular cleanup activities” (p. 2). Opfer et al. (2012) methodology includes making a note of potential land sources that might influence a marine shoreline cleanup, including distance to a nearby town or river mouth but as with Cheshire and Adler, their methodologies are written expressly for marine shoreline cleanups. Opfer et al. (2012) provide information for conducting either an accumulation or a standing stock survey; their methods form the basis for the methods we propose here.
This method is a cost-effective way to understand the global plastic waste problem, is applicable by citizen scientists and scientists, and provides local data. In this application of the methodology we encourage breadth not depth. In other words, our goal is to encourage a global application of this methodology to provide empirical evidence of riverine debris. While in these examples we provide only a one-time analysis, the method can be applied repeatedly to understand accumulation over time and seasonal variation, as has always been true for the NOAA field methodology. Other researchers could use this methodology repetitively to understand local variation and accumulation.
One could argue that a one-time collection may not provide comprehensive enough data to inform policy. This is a valid criticism, and yet our current understanding of the way plastic moves through riverine systems frequently does not include any ground-truthed evidence and therefore no information about the composition of debris. As such, these large scale assessments (see Jambeck et al., 2015; Lebreton et al., 2017) provide understanding of the problem from a systems level—a truly important aspect of how we understand the problem— but little evidence about how debris composition may vary within systems. While our proposed methodology cannot answer all questions about the problem of marine litter, it can provide important evidence that informs local policy and behavior as well as contributes to our understanding of the missing plastic question.
Proposed Methodology
Our proposed method is modified from the NOAA Marine Debris Shoreline Survey Field Guide (Opfer et al., 2012). Opfer et al. (2012) present two methods in their guide: that of an accumulation study and of a standing stock study. In an accumulation study, all debris is removed from “the entire length of the shoreline during each site visit” (Opfer et al., 2012, p. 1). This method is used for periodic cleanups, measuring debris deposition of one site over time; it also provides data on types and weight of debris (Opfer et al., 2012). Depending on the size of the beach, this type of survey may require a large number of volunteers. In a standing stock study, participants survey a 100 m long stretch of beach to determine debris density (Opfer et al., 2012). This assessment may require less time, but the debris is left on site during the analysis. When using a standing stock study, the researchers return periodically to the site to measure density, shedding light on how this may change over time.
Our modified method is neither of these methods, but pulls important elements from each: surveying a 100 m long, 5 m deep area along a riverside to quantify density and composition of debris. After selecting a site that ideally allows 100 m of continuous riverside collecting (i.e., avoiding walls, private property, or an impenetrable landscape) researchers measure the site and mark a 100 m length of shoreline with survey flags, starting at the river's edge. Researchers then measure 5 m depth landward from the shoreline, marking this distance with flags along the 100 m length. This produces a total collection area of 500 m2 as shown in Figure 1. Researchers then walk in a systematic pattern, back and forth from the shoreline, to the edge of the 5 m deep area, and then back to the shoreline until the entire area has been covered, as shown in Figure 1. Researchers collect everything visible within the given area that is attributable to humans.
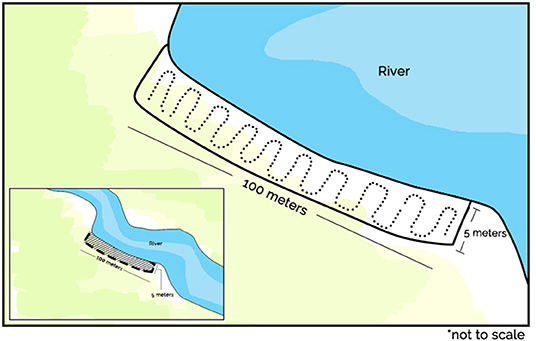
Figure 1. How a collection area should be sited along a river including the recommended walking pattern adapted from Opfer et al. (2012) to a riverside collection site (Illustration by K. Owens and P. Kamil).
We recommend that researchers remove the material from the site, returning to a laboratory or classroom to analyze it systematically by counting, weighing, and cataloging the constituents in accordance with the attached appendices, which include data sheets for both site data and for cataloging debris, derived and adapted from Opfer et al. (2012). While most categories may allow for easy classification of material, in some cases researchers may wish to add more types of debris to allow for maximum depth of data. Examples of sorting categories can be seen in Figure 2; an example of the spreadsheet being used to tally data during a collection can be seen in Figure 3; “nylon foam sponge” and “child swim toy” were not categories included in the original list, but were added for this particular collection.
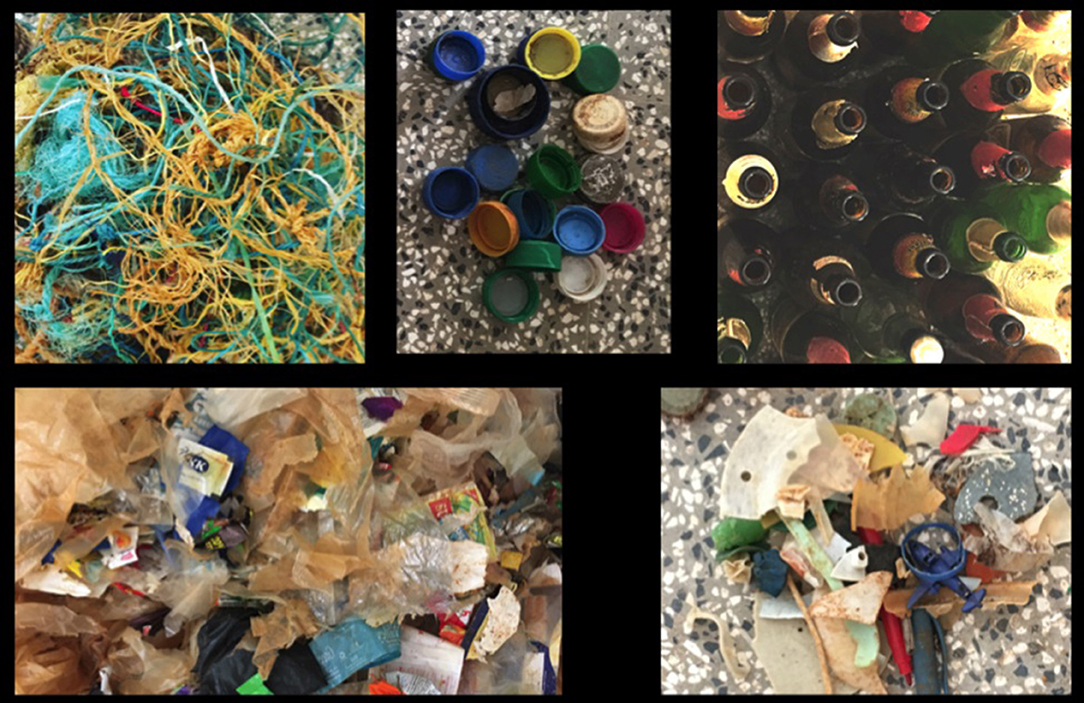
Figure 2. Examples of some distinct categories including (clockwise from top left) nylon cords and ropes, plastic bottle caps, glass bottles, hard plastic fragments, filmed plastic fragments (Photos by K. Owens).
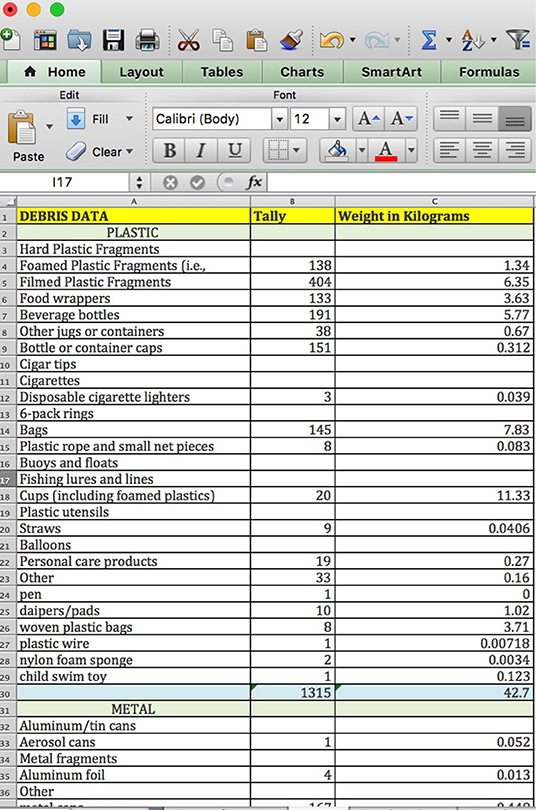
Figure 3. Example data shown as entered into the spreadsheet after collection.
While we recommend weighing each subcategory, we recognize that this may not always be practical, particularly when working in remote sites. In our examples below, one researcher was able to return all material to the laboratory for individual weighing (India), while the other was able to count and catalog all pieces debris, but only weigh in broad categories (i.e., plastic, glass, metal) due to conditions (Indonesia). Clearly, sub-category weighing provides more detail but may not always be practical. In the NOAA shoreline method, researchers would be expected to visit a beach at low tide; for river collections the recommendation is to visit in the dry season, as more debris that has made its way along the river may be evident in that period. It should be noted that until researchers have made comparative studies of riverside collections in the wet and dry seasons, we could only presume how these varying conditions might affect results.
Benefits of this Methodology
The methodology we propose is not elaborate and does not require expensive supplies or equipment. Recommended equipment includes: GPS, 100 M measuring tape, gloves, scales (hanging scale and more precise scale for smaller items), clipboards, paper, writing instruments, collection bags, boots, sunscreen, drinking water, and insect repellant. Often, large-scale cleanups are used to educate the public about littering and debris, to collect data, or to clean rivers. This methodology does not propose to clean an entire river system, but instead to harness the work of a small team to better understand local debris. It can be completed with a small team of researchers in a few hours. It does allow for a consistent and replicable scientifically valid way of collecting material in a range of settings. This method enables:
• Collecting data on the total weight and count of debris found within a 500 m2 riverside area
• Cataloging said debris to understand what percentage is comprised of plastic, metal, glass, paper, clothing/shoes, and other materials
• Classifying within these broad categories to understand whether the preponderance of material originates from municipal waste, shipping, commercial or recreational fishing, manufacturing, or another source
• Calculating a mean density of debris
This level of detail can be used to report conditions to local policymakers, therefore linking science and policy in the local context (as is the case for the author working in India) or as a part of a comparative study to analyze human behavior (as is the case for the author working in Indonesia). Sharing methodology with other researchers allows comparative analysis in different countries, systems, and settings. We should reiterate that neither of our studies have the goal of removing all debris from an area, but instead of using sampling to better understand the composition of debris in a given area.
Examples From India and Indonesia
The authors honed this methodology in a series of discussions as they planned research projects funded by the National Geographic Society—the results of those studies are a part of other publications (Kamil, under review; Conlon et al., under review). Here we describe how these methods have been applied in settings on the ground in Indonesia and India.
Indonesia: Tukad Badung River, Bali
We conducted data collections at two sites along the Tukad Badung River of Bali as a pilot for a larger study. Data collection took place on May 9, 2019, in the dry season. Sites, shown in Figure 4, were selected using river hydrology maps. The pilot study includes two site types (transition and floodplain) as this met the larger constraints of our study. While in one site we found 100 continuous meters for our collection, due to limited access, our second site was instead 50 m in length. At each site, we conducted the debris collection in one continuous shoreline. We picked the shoreline based on its accessibility and safety for the team members and volunteers. The rest of our procedure follows that described in the methodology section.
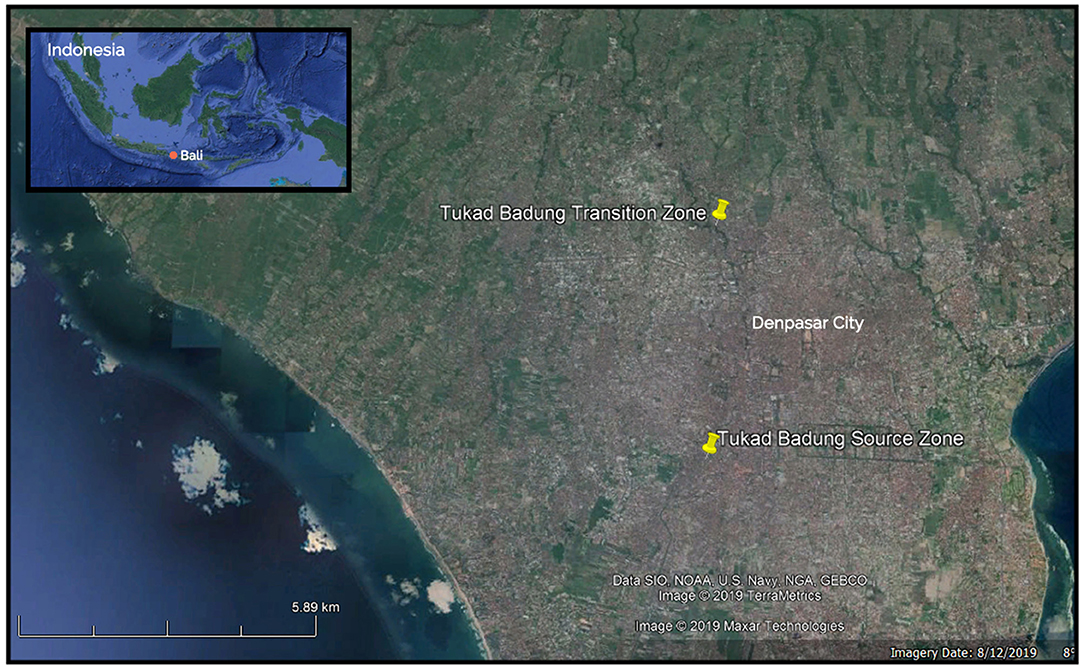
Figure 4. Map of Indonesian sites (Map by P. Kamil).
Tukad Badung River is a short river of 22 km in length, flowing across the capital city of Bali, Denpasar, the most densely populated city on the island. The first site was in the floodplain zone, −8.6733 N, 115.2048 E. In this site, we successfully created a block of 500 m2. We collected a total weight of 14.84 kg, or 0.029 kg/m2. We collected 598 pieces of debris here, averaging 1.19 pieces per m2 with 92.8% of the found pieces being plastic. Our methodology allows assessing the composition to better understand the source of debris. The source of the material appears to be litter and human household waste (i.e., not from industry, manufacturing, commercial fishing, recreational fishing, aquaculture, or shipping). This site only has one solid riverbank on its shoreline, covered by soil and grass, surrounded by permanent settlements. At this particular site, we found three large sacks (>30 cm in dimension), used for rice, cement, and shallots.
The second site was in transition zone, −8.306 N, 115.2065 E, where we were only able to create a block of 250 m2 due to soil contour and vegetation coverage. Big rocks and solid soil, a very limited amount of grass, and a notable amount of fig trees cover riverbanks in this area. While under the recommended ideal coverage of 500 m2, because in this method we measure area, the density of debris can always be calculated. At this site we collected 147 pieces debris weighing 3.58 kg, averaging 0.58 pieces per m2 or 0.014 kg/m2. Again, most of the pieces found are plastic (88.4%). The source of the material appears to be litter and human household waste (i.e., not from industry, manufacturing, commercial fishing, recreational fishing, aquaculture, or shipping). At this site we found two relatively larger pieces of debris comprised of two rice sacks and a 90 × 150 cm carpet. Example summary debris data from Tukad Ayung is shown in Table 1. We originally planned to measure within the source zone, however, there is no riverbank available in the area (−8.5751 N, 115.1940 E), as a wall designated for irrigation blocks the stream. These pilot data are a part of a larger study available (Kamil, P., manuscript under review).
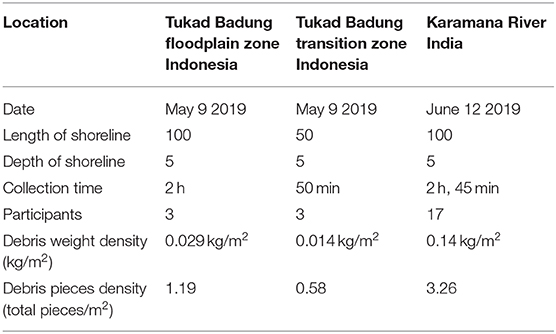
Table 1. Compiled results from example studies.
India: Karamana River, Kerala
The collection took place on June 12, 2019 from 8:00 a.m. to 10:45 a.m. local time and included a team of researchers from the national workshop Experiential learning with Indian educators on marine debris and its management sponsored by the National Geographic Society and the Fulbright Nehru Scholar program. Participants included 17 individuals: workshop attendees and trained students and faculty from the University of Kerala, Karyavattom campus, Department of Environmental Science. The collection site, shown in Figure 5, was on the Karamana River, upstream of the Parasurama Temple Thiruvallam just off the Kazhakootam-Kovalam Bypass Road at location 8.4425 N, 76.9544 E. The cleanup event took place at the beginning of the typical monsoon season, however monsoon rains increasingly begin later in this region. On this day the river was not flooded; little rain had yet fallen. Example summary debris data from the Karamana River is shown in Table 1. We collected a total of 1,630 pieces weighing 71.93 kg. In this case, the most frequently found type of debris by category was plastic (80.7% of the found pieces) and the source of the material appears to be litter and human household waste (i.e., not from industry, manufacturing, commercial fishing, recreational fishing, aquaculture, or shipping). The mean density of debris at this site was 3.26 pieces/m2 or 0.14 kg/m2. The full results of this study are available in (Conlon et al., under review).
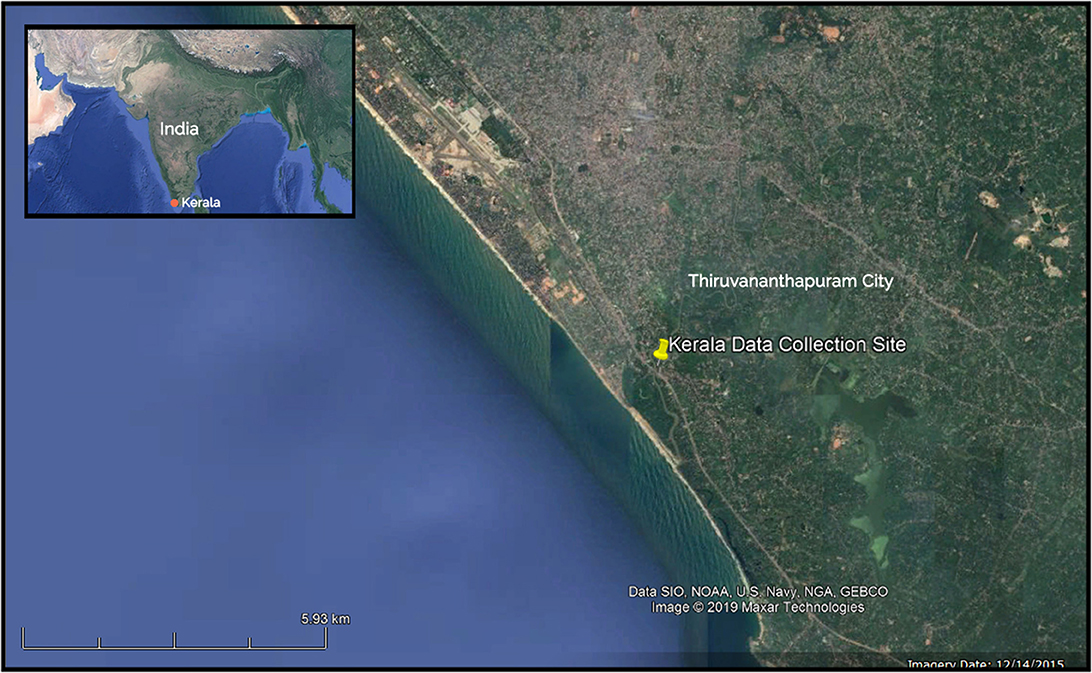
Figure 5. Map of Indian site (Map by P. Kamil).
These data could help scientists and policymakers better estimate debris in freshwater systems worldwide. For example, the Karamana River is 42 miles long (67.59 km) when considering both shores the river has a total shoreline length of 135.18 km. In our study we found just over 1,600 pieces along a 100 m long stretch of river. If you were to extrapolate from that, assuming that this is an average level of accumulation (which we acknowledge is a rather broad assumption) you could estimate that the Karamana River has 2.16 million pieces of debris along its shorelines. In the case of the Tukad Badung River, we measured 745 pieces of debris along 150 m. At 22 km long, considering both its shores yields a total of 44 km of river shoreline. Extrapolating from these data, we could estimate that the Tukad Badung has 218,285 pieces of debris along its shorelines. While we would not propose that an assessment of 100–150 m is sufficient to determine the amount of waste along a river of 22–67 km, we do find that an increased effort to ground-truth waste along waterways in a consistent, replicable way can lead to better modeling and estimates of the way litter moves through and remains in freshwater systems.
Recommendations for Collecting on Riversides
Collecting riverside can be different from seaside. Often, when working on the beach we must be wary of glass, medical or other unsanitary waste, but not wildlife (snakes, crocodiles, alligators, mammalian predators), thorns, or stinging insects, all of which may be more of a concern riverside. In this way, while boots and insect repellant may not be necessary for beachside collecting, they are recommended for riverside cleanups. As safety comes first, we suggest researchers pick safe shorelines considering slope or height. In addition it is important to find safe access to the riverbank considering brush and other natural or unnatural blockages along the shoreline. Riversides can be extraordinarily inaccessible. While our recommendation is that researchers select an area of 100 m in length for data collection, such a length may be impossible given conditions riverside, as was the case for the Tukad Badung transition zone in Indonesia (shown in Figure 6). In an effort to collect data despite lack of accessibility, researchers opted for a 50 m long collection area. While this was not ideal, it allowed for data collection in the transition zone, an important element of that particular study. In comparison see the relatively accessible site along the Karamana river in India, shown in Figure 7.
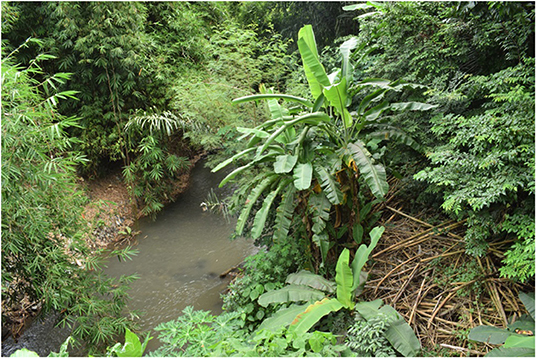
Figure 6. An example of an unsafe riverbank in the Tukad Badung River transition zone area. It is full of detritus, raising the possibility of exposure to reptiles, particularly snakes. Detritus covers the land structure underneath, increasing the risk of accident if the underlying ground is not solid enough for debris collection. There is also no human access to the area (Photo by P. Kamil).
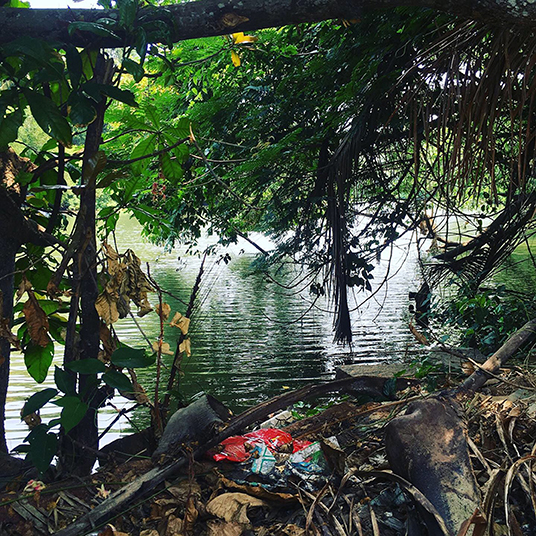
Figure 7. This area became part of the site for collection along the Karamana River. While brush and debris exists along the water's edge, the ground is solid and the approach is flat (Photo by K. Owens).
If researchers collect data on specific locations (e.g., source or transition zones), we recommend a hydrology analysis first using available GIS tools, then a site visit to the area before bringing volunteers to the sites. A field site that looks accessible from satellite imagery may be inaccessible in actual condition. This way, researchers will save time and effort enabling efficient data collection. Whether river or ocean, this method does not include wading into the water to remove the debris—but instead measuring what accumulates on the banks. It should be noted that it provides limited information about the debris flowing through a river system, and does not provide information about debris accumulating on the river bottom, in underwater vegetation, or in sediments. Other methods of analysis are needed to understand how debris accumulates in rivers in these scenarios.
Conclusions
Our proposed methodology is a modification and new application of the Opfer et al. (2012) methods focusing on one-time analysis of a river shoreline. Current methods vary widely– with researchers in some cases selecting random transects along riversides or picking contiguous areas in different river zones depending on proximity to pollution. Each comes with costs and benefits. We do not presume that this method can answer every question about river debris, but currently, people are not collecting along riversides in a concerted way to understand conditions on the ground. We propose that they do, and by doing so, add to the knowledge on the fate of debris and the missing plastics question. This method allows for the production of data that can help us understand how debris accumulates along global rivers. When rivers flood, a great deal of this debris makes its way from riversides into oceanic systems or may be pulled from riverside dumping areas into freshwater systems. Better data about river shorelines can help us holistically understand the issue of marine debris– which should more broadly be considered the problem of global plastic pollution. The benefits of this method are many. It allows for consistent, replicable data gathering at sites around the world. Because of the size limitations, the work can be managed in a relatively short amount of time with a small group of researchers or volunteers. The goal of this method in application is not to clean the world's riversides. As is the case with beach cleanups, cleaning river shorelines globally is not a long-term solution to the problem of debris. The value of this method in application is allowing researchers to quickly and cost-effectively understand the on-site debris density and provide a snapshot of accumulation data. It allows researchers around the world to begin to ground-truth the myriad estimations of debris traveling through but also accumulating in river systems, important habitats in their own right. With better data and a deeper understanding of these systems, we can more effectively address the litter that chokes the world's riverways and seas.
Data Availability Statement
This work details methodology, using studies that are being published in other formats to describe the methodology in application—we therefore do not share a research result and the work is not explicitly based on a dataset. DOIs of the referenced data sets are available upon request.
Author Contributions
KO and PK contributed to the conception and design of this study and co-wrote the first draft of the manuscript. All authors contributed to manuscript revision, read, and approved the submitted version.
Funding
This work would not have been possible without the support of the Department of Environmental Science of the University of Kerala, Thiruvananthapuram, India, and the participants of the National Workshop on Experiential Learning with Indian Educators on Marine Debris and its Management, June 2019, Kerala, India (KO). The data collection in Indonesia received significant support from Luh De Dwi Jayanthi from Plastik Detox Bali and Muhammad Azmi from Komodo Survival Program (PK). KO's work was supported by National Geographic Society Grant #NGS-55326E-19 and the Fulbright Nehru program. PK's work was supported by National Geographic Society Grant #EC-KOR-56385R-19.
Conflict of Interest
PK was employed by company Catalyze Communications.
The remaining author declares that the research was conducted in the absence of any commercial or financial relationships that could be construed as a potential conflict of interest.
References
Alshawafi, A., Analla, M., Alwashali, E., and Aksissou, M. (2017). Assessment of marine debris on the coastal wetland of Martil in the North-East of Morocco. Mar. Pollut. Bull. 117, 302–310. doi: 10.1016/j.marpolbul.2017.01.079
Baldwin, A. K., Corsi, S. R., and Mason, S. A. (2016). Plastic debris in 29 great lakes tributaries: relations to watershed attributes and hydrology. Environ. Sci. Technol. 50, 10377–10385. doi: 10.1021/acs.est.6b02917
Barrows, A. P., Christiansen, K. S., Bode, E. T., and Hoellein, T. J. (2018). A watershed-scale, citizen science approach to quantifying microplastic concentration in a mixed land-use river. Water Res. 147, 382–392. doi: 10.1016/j.watres.2018.10.013
Battulga, B., Kawahigashi, M., and Oyuntsetseg, B. (2019). Distribution and composition of plastic debris along the river shore in the Selenga River basin in Mongolia. Environ. Sci. Pollut. Res. 26, 14059–14072. doi: 10.1007/s11356-019-04632-1
Blettler, M. C., Abrial, E., Khan, F. R., Sivri, N., and Espinola, L. A. (2018). Freshwater plastic pollution: recognizing research biases and identifying knowledge gaps. Water Res. 143, 416–424. doi: 10.1016/j.watres.2018.06.015
Blettler, M. C., Ulla, M. A., Rabuffetti, A. P., and Garello, N. (2017). Plastic pollution infreshwater ecosystems: macro-, meso-, and microplastic debris in a floodplain lake. Environ. Monit. Assess. 189:581. doi: 10.1007/s10661-017-6305-8
Blettler, M. C., and Wantzen, K. M. (2019). Threats Underestimated in freshwater plastic pollution: mini-review. Water Air Soil Pollut. 230:174. doi: 10.1007/s11270-019-4220-z
Bruge, A., Barreau, C., Carlot, J., Collin, H., Moreno, C., and Maison, P. (2018). Monitoring litter inputs from the Adour River (Southwest France) to the marine environment. J. Mar. Sci. Eng. 6:24. doi: 10.3390/jmse6010024
Cable, R. N., Beletsky, D., Beletsky, R., Wigginton, K., Locke, B. W., and Duhaime, M. B. (2017). Distribution and modeled transport of plastic pollution in the Great Lakes, the world's largest freshwater resource. Front. Environ. Sci. 5:45. doi: 10.3389/fenvs.2017.00045
Castro-Jiménez, J., González-Fernández, D., Fornier, M., Schmidt, N., and Sempere, R. (2019). Macro-litter in surface waters from the Rhone River: plastic pollution and loading to the NW Mediterranean Sea. Mar. Pollut. Bull. 146, 60–66. doi: 10.1016/j.marpolbul.2019.05.067
Cheshire, A., and Adler, E. (2009). UNEP/IOC Guidelines on Survey and Monitoring of Marine Litter. UNEP Publication.
Cózar, A., Echevarría, F., González-Gordillo, J. I., Irigoien, X., Úbeda, B., Hernández-León, S., et al. (2014). Plastic debris in the open ocean. Proc. Natl. Acad. Sci. U.S.A. 111, 10239–10244. doi: 10.1073/pnas.1314705111
Díaz, S., Settele, J., Brondízio, E., Ngo, H., Guèze, M., Agard, J., et al. (2019). Summary for policymakers of the global assessment report on biodiversity and ecosystem services of the Intergovernmental Science-Policy Platform on Biodiversity and Ecosystem Services. Available online at: https://www.ipbes.net/sites/default/files/downloads/spm_unedited_advance_for_posting_htn.pdf
Driedger, A. G., Dürr, H. H., Mitchell, K., and Van Cappellen, P. (2015). Plastic debris in the Laurentian great lakes: a review. J. Great Lakes Res. 41, 9–19. doi: 10.1016/j.jglr.2014.12.020
Eerkes-Medrano, D., Thompson, R. C., and Aldridge, D. C. (2015). Microplastics in freshwater systems: a review of the emerging threats, identification of knowledge gaps and prioritisation of research needs. Water Res. 75, 63–82. doi: 10.1016/j.watres.2015.02.012
Gasperi, J., Dris, R., Bonin, T., Rocher, V., and Tassin, B. (2014). Assessment of floating plastic debris in surface water along the Seine river. Environ. Pollut. 195, 163–166. doi: 10.1016/j.envpol.2014.09.001
Horton, A. A., Svendsen, C., Williams, R. J., Spurgeon, D. J., and Lahive, E. (2017). Large microplastic particles in sediments of tributaries of the River Thames, UK–abundance, sources and methods for effective quantification. Mar. Pollut. Bull. 114, 218–226. doi: 10.1016/j.marpolbul.2016.09.004
Imhof, H. K., Ivleva, N. P., Schmid, J., Niessner, R., and Laforsch, C. (2013). Contamination of beach sediments of a subalpine lake with microplastic particles. Curr. Biol. 23, R867–R868. doi: 10.1016/j.cub.2013.09.001
Islam, M. S., and Tanaka, M. (2004). Impacts of pollution on coastal and marine ecosystems including coastal and marine fisheries and approach for management: a review and synthesis. Mar. Pollut. Bull. 48, 624–649. doi: 10.1016/j.marpolbul.2003.12.004
Jambeck, J. R., Geyer, R., Wilcox, C., Siegler, T. R., Perryman, M., Andrady, A., et al. (2015). Plastic waste inputs from land into the ocean. Science 347, 768–771. doi: 10.1126/science.1260352
Kaza, S., Yao, L., Bhada-Tata, P., and Van Woerden, F. (2018). What A Waste 2.0: A Global Snapshot of Solid Waste Management to 2050. Washington, DC: World Bank Publications.
Lahens, L., Strady, E., Kieu-Le, T. C., Dris, R., Boukerma, K., Rinnert, E., et al. (2018). Macroplastic and microplastic contamination assessment of a tropical river (Saigon River, Vietnam) transversed by a developing megacity. Environ. Pollut. 236, 661–671. doi: 10.1016/j.envpol.2018.02.005
Lebreton, L. C., Van der Zwet, J., Damsteeg, J. W., Slat, B., Andrady, A., and Reisser, J. (2017). River plastic emissions to the world's oceans. Nat. Commun. 8:15611. doi: 10.1038/ncomms15611
Lechner, A., Keckeis, H., Lumesberger-Loisl, F., Zens, B., Krusch, R., Tritthart, M., et al. (2014). The Danube so colourful: a potpourri of plastic litter outnumbers fish larvae in Europe's second largest river. Environ. Pollut. 188, 177–181. doi: 10.1016/j.envpol.2014.02.006
Mani, T., Hauk, A., Walter, U., and Burkhardt-Holm, P. (2015). Microplastics profile along the Rhine River. Sci. Rep. 5:17988. doi: 10.1038/srep17988
McCormick, A. R., and Hoellein, T. J. (2016). Anthropogenic litter is abundant, diverse, and mobile in urban rivers: insights from cross-ecosystem analyses using ecosystem and community ecology tools. Limnol. Oceanogr. 61, 1718–1734. doi: 10.1002/lno.10328
Moore, C. J., Lattin, G. L., and Zellers, A. F. (2011). Quantity and type of plastic debris flowing from two urban rivers to coastal waters and beaches of Southern California. Rev. Gestão Costeira Integr. 11, 65–73. doi: 10.5894/rgci194
Morritt, D., Stefanoudis, P. V., Pearce, D., Crimmen, O. A., and Clark, P. F. (2014). Plastic in the Thames: a river runs through it. Mar. Pollut. Bull. 78, 196–200. doi: 10.1016/j.marpolbul.2013.10.035
Nollkaemper, A. (1994). Land-based discharges of marine debris: from local to global regulation. Mar. Pollut. Bull. 28, 649–652. doi: 10.1016/0025-326X(94)90299-2
Ocean Conservancy (2015). Stemming the Tide: Land-Based Strategies for a Plastic-Free Ocean. New York, NY: Ocean Conservancy and McKinsey Center for Business and Environment.
Opfer, S., Arthur, C., and Lippiatt, S. (2012). NOAA Marine Debris Shoreline Survey Field Guide. Available online at: https://repository.library.noaa.gov/view/noaa/17535 (accessed December 20, 2019).
Rech, S., Macaya-Caquilpán, V., Pantoja, J. F., Rivadeneira, M. M., Madariaga, D. J., and Thiel, M. (2014). Rivers as a source of marine litter–a study from the SE Pacific. Mar. Pollut. Bull. 82, 66–75. doi: 10.1016/j.marpolbul.2014.03.019
Reynolds, C., and Ryan, P. G. (2018). Micro-plastic ingestion by waterbirds from contaminated wetlands in South Africa. Mar. Pollut. Bull. 126, 330–333. doi: 10.1016/j.marpolbul.2017.11.021
Sadri, S. S., and Thompson, R. C. (2014). On the quantity and composition of floating plastic debris entering and leaving the Tamar Estuary, Southwest England. Mar. Pollut. Bull. 81, 55–60. doi: 10.1016/j.marpolbul.2014.02.020
Schmidt, C., Krauth, T., and Wagner, S. (2017). Export of plastic debris by rivers into the sea. Environ. Sci. Technol. 51, 12246–12253. doi: 10.1021/acs.est.7b02368
Sruthy, S., and Ramasamy, E. V. (2017). Microplastic pollution in Vembanad lake, Kerala, India: the first report of microplastics in lake and estuarine sediments in India. Environ. Pollut. 222, 315–322. doi: 10.1016/j.envpol.2016.12.038
van Emmerik, T., Tramoy, R., van Calcar, C., Alligant, S., Treilles, R., Tassin, B., et al. (2019). Seine plastic debris transport tenfolded during increased river discharge. Front. Mar. Sci. 6:642. doi: 10.3389/fmars.2019.00642
Vincent, A. E., and Hoellein, T. J. (2017). Anthropogenic litter abundance and accumulation rates point to seasonal litter sources on a Great Lakes Beach. J. Contemp. Water Res. Educ. 160, 72–84. doi: 10.1111/j.1936-704X.2017.03241.x
Keywords: litter, debris, freshwater, river, plastic pollution, methods, missing plastic
Citation: Owens KA and Kamil PI (2020) Adapting Coastal Collection Methods for River Assessment to Increase Data on Global Plastic Pollution: Examples From India and Indonesia. Front. Environ. Sci. 7:208. doi: 10.3389/fenvs.2019.00208
Received: 07 November 2019; Accepted: 31 December 2019;
Published: 22 January 2020.
Edited by:
Gabriele Weigelhofer, University of Natural Resources and Life Sciences Vienna, AustriaReviewed by:
Nidhi Nagabhatla, United Nations University Institute for Water Environment and Health, CanadaMarcos Callisto, Federal University of Minas Gerais, Brazil
Copyright © 2020 Owens and Kamil. This is an open-access article distributed under the terms of the Creative Commons Attribution License (CC BY). The use, distribution or reproduction in other forums is permitted, provided the original author(s) and the copyright owner(s) are credited and that the original publication in this journal is cited, in accordance with accepted academic practice. No use, distribution or reproduction is permitted which does not comply with these terms.
*Correspondence: Katharine A. Owens, a293ZW5zQGhhcnRmb3JkLmVkdQ==